RESILIENT CAPE TOWN Preliminary Resilience Assessment - City of Cape Town
←
→
Page content transcription
If your browser does not render page correctly, please read the page content below
RESILIENT
CAPE TOWN
Preliminary Resilience Assessment

RESILIENT   CAPE TOWN
Resilient Cape Town: Preliminary Resilience
    Assessment

    Resilient Cape Town: Preliminary Resilience
    Assessment is published by the Resilience
    Department in the Directorate of Corporate
    Services, City of Cape Town. It has been prepared
    after consultation with numerous stakeholders
    across the city. This document is prepared for
    discussion purposes only. It marks the completion
    of Phase I of the journey towards the creation of
    Cape Town’s first Resilience Strategy.

    The City of Cape Town is appreciative to 100
    Resilient Cities, pioneered by the Rockefeller
    Foundation, for its ongoing support in
    development of the Resilience Strategy.

    Noting process
    This document was presented for noting to the
    following structures in the City of Cape Town
    before publication:

    Executive Management Team on 24 May 2018
    Section 79 Committee on Sustainability and
    Resilience on 13 June 2018
    Mayoral Committee on 7 August 2018

    Document authors
    Craig Kesson – Chief Resilience Officer
    Gareth Morgan – Director: Resilience
    Cayley Green – Senior Resilience Analyst

    Project Administrator
    Megan Williams

    Acknowledgements
    The Resilience Department would like to express
    its appreciation to the following organisations and
    City departments for assisting in the production of
    this document:

    Arup
    Communications Department, City of Cape Town
    Department of Organisational Policy and Planning,
    City of Cape Town
    GreenCape
    Public Participation Unit, City of Cape Town

    Comments
    If you have any comments or queries about this
    document please direct them to cayley.green@
    capetown.gov.za.

2
Contents
1.   DEVELOPING A RESILIENCE STRATEGY FOR CAPE TOWN 		4
     1.1  Understanding Resilience (Key definitions and concepts)		 7
     1.2. The City Resilience framework						10
     1.3  The Resilience Strategy journey						12

2.   CITY   PROFILE										14
     2.1    The legislative context of different spheres of government		 16
     2.2    The spatial context of Cape Town						                       18
     2.3    The economic context of Cape Town					                       20
     2.4    The social context of Cape Town						                        24
     2.5    The environmental context of Cape Town					                  28
     2.6    The City budgetary context							32
     2.7    The City organisational context						34
     2.8    The City planning context							35
     2.9    The City data context								37
     2.10   Resilience timeline of Cape Town						38

3.   UNDERSTANDING OUR RESILIENCE						40
     3.1 Actions Inventory									42
     3.2 Most relevant strategies and plans						46
     3.3 Perceptions of Resilience							48
     3.4 City Resilience Index								53
     3.5 Shocks and Stresses								56

4.   ENABLERS AND DISCOVERY AREAS						60
     4.1 Enabler 1: Social Cohesion							64
     4.2 Enabler 2: Mainstreaming resilience in City decision-making  66
     4.3 Enabler 3: Knowledge Management and Data				                 68
     4.4 Enabler 4: Resourcing and Funding Resilience				             70
     4.5 Discovery Area 1: Connected, climate adaptive city			        72
     4.6 Discovery Area 2: Compassionate, holistically healthy city		 74
     4.7 Discovery Area 3: A capable, job-creating city				           76
     4.8 Discovery Area 4: Collectively, shock-ready city			          78

5.   NEXT STEPS										80

6.   ANNEXURES										82
     6.1 Annexure A: Detailed qualitative CRI outputs				  82
     6.2 Annexure B: Detailed quantitative CRI outputs				 84
     6.3 Annexure C: Stakeholders Engaged						86
     6.4 Annexure D: List of Figures							87
     6.5 Annexure E: List of Acronyms							87

     End notes											88
Developing a
    1   Resilience Strategy
        for Cape Town

4
In May 2016, Cape Town was selected by 100 Resilient Cities (100RC), pioneered
by the Rockefeller Foundation, to join a global network of cities committed to
building urban resilience in the 21st century. Cape Town joins several other African
cities in this community of member cities, including Accra, Addis Ababa, Dakar,
Durban, Kigali, Lagos, Nairobi and Paynesville, in this community of member cities.
These cities, and others around the world, may have many differences but they
are united in striving to ensure that they have the ability to adapt, survive and
thrive no matter what acute shocks or chronic stresses they may experience.

Cape Town was admitted into this global network not because it is not resilient, but
because it aspires to increase its resilience, knowing that the challenges of the future
may be increasingly unfamiliar. Climate change is a major stress and Cape Town is
particularly vulnerable to its impacts, which
are expected to become more frequent and
intense. The city, as well as the surrounding
provincial region, is currently confronted
with a severe drought, with recent annual The people of Cape Town have
rainfall levels being among the lowest
                                                  responded to the possibility of
in recorded history. The people of Cape
Town have responded to the possibility what has come to be known as
of what has come to be known as ‘Day “Day Zero” by curtailing water
Zero’ by curtailing water consumption consumption by more than
by more than 50% compared with pre-
drought consumptions levels. This is a
                                                  50% compared to pre-drought
remarkable achievement and is evidence consumptions levels.
of the resilient character of Capetonians.

Cape Town is also grappling with the
challenge of overcoming its divided past. Twenty-four years after the dawn
of constitutional democracy and the defeat of apartheid, Cape Town – and
South Africa as a whole – has made remarkable progress in certain aspects of
human development, including access to water, electricity, basic education and
healthcare. However, a large number of Capetonians still live with the legacy of
apartheid on a daily basis through chronic stresses such as high unemployment,
poverty, crime and lack of availability of affordable housing. The spatial legacy of
apartheid remains particularly severe and difficult to overcome, but it has become
a high priority for the City administration to transform the spatial landscape
of Cape Town through the enablement of dense and transport-orientated
development and the development of an efficient, integrated transport system.

The above stresses and others that are prioritised in this document are exacerbated
by known shocks such as drought, fire, and storm surges. However, as a city we also
need to be aware of and prepare for possible unknown shocks such as cyber-attacks.

Building a resilience strategy for Cape Town is not just about what actions the City
administration must take. In this regard it is fundamentally different to the City’s

                                                                                  RESILIENT CAPE TOWN   5
Integrated Development Plan (IDP). Cape Town’s        This document, the Preliminary Resilience
    resilience relies on a broader approach that          Assessment (PRA) for Cape Town, marks
    requires individuals, communities, institutions,      the conclusion of Phase 1 of the resilience
    and all spheres of government, including the          strategy process for the city. It documents and
    City of Cape Town, to play a variety of resilience-   analyses the relevant information that has been
    building roles. A comprehensive resilience            accumulated and gathered through various
    strategy for Cape Town will form the basis of this    processes in order to identify and understand
    new approach. At the same time, this strategy         Cape Town’s resilience challenges. It identifies
    is not a a “fix all” – it does not cover every        the ‘Enablers’ of Cape Town’s resilience and the
    issue facing the city. Rather, the strategy will      ‘Discovery Areas’ that guide further exploration
    target specific gaps identified through rigorous      in Phase 2, the phase during which the Cape
    data analysis and stakeholder engagement as           Town Resilience Strategy will be developed.
    described in this document, that present resilience
    challenges and opportunities for the city.

6
1.1 	Understanding Resilience (Key definitions and concepts)

There are different understandings of what        While Cape Town has its own unique resilience-
‘resilience’ means to different stakeholders.     related challenges, they are likely to be wide
It is important that during the resilience        ranging and hence ‘resilience’ cannot be a
strategy-building process the complexity of       term related to only one or two thematic areas.
urban resilience is understood by all citizens.

  What is Resilience?

  100RC defines resilience as “the capacity of individuals,
  communities, institutions, businesses and systems within a city to
  survive, adapt and grow no matter what kind of chronic stresses
  and acute shocks they experience.”

  What are acute shocks and chronic stresses?

  Chronic stresses weaken the fabric               Acute shocks are sudden sharp
  of a city on a day-to-day or cyclical            events that threaten a city, for
  basis, for example, high unemploy-               example, earthquakes and floods.
  ment and crime.

                                                                                       RESILIENT CAPE TOWN   7
What are typically the qualities that resilient cities
      demonstrate?
      The Cape Town Resilience Strategy will endeavour to build the
      seven qualities of resilience listed below into the various systems
      and initiatives it will deliver.

              Reflective: Using past                           Flexible: Willingness and
              experiences to inform future                     ability to adopt alternative
              decisions.                                       strategies in response to
                                                               changing circumstances.

              Resourceful: Recognizing
              alternative ways to use                          Inclusive: Prioritize broad
              resources.                                       consultation to create a
                                                               sense of shared ownership in
                                                               decision-making.
              Robust: Well-conceived,
              constructed and managed
              systems.                                         Integrated: Bring together a
                                                               range of distinct systems and
                                                               institutions.

              Redundant: Spare capacity,
              purposefully created to
              accommodate disruption.

    When we refer to ‘city’ and ‘City’ what are we
    talking about?

    The Cape Town Resilience Strategy is concerned with Cape Town as a whole, made up of all of its
    people, communities, eco-systems, infrastructure, spheres of government and the economy. This is
    referred to as the ‘city’.

    The City of Cape Town, a municipality established by the City of Cape Town Establishment Notice
    No. 479 of 22 September 2000, issued in terms of the Local Government: Municipal Structures Act,
    Act 117 of 1998, is referred to as the ‘City’. While the City is leading the development of the Cape
    Town Resilience Strategy, it is only one player in the complex structure that makes up the whole of
    the city.

8
RESILIENT CAPE TOWN 9

The City Resilience
      1.2
               Framework

     The City Resilience Framework (CRF), see figure                      is a useful starting point for Cape Town’s
     1, is the prescribed lens through which Cape                         resilience journey. The CRF methodology is
     Town’s resilience challenges and opportunities                       applied in a subsequent section to an actions
     are assessed. The methodology, which includes                        inventory, a perceptions inventory and the
     four dimensions, 12 drivers and 50 sub-drivers,                      City Resilience Index (CRI) for Cape Town.

       FIGURE 1
       City Resilience Framework

                  4 x Dimensions                       12 x Drivers                              50 x Sub-Drivers

                  The CRF is built on four essential   Each dimension contains three             Each driver comprises a number of sub-
                  dimensions of urban resilience.      drivers which reflect more specific       drivers which identify specific and more
                                                       characteristics of resilient cities can   detailed actions to aid assessment.
                                                       take to improve their resilience. The
                                                       drivers form the core of the CRF, and
                                                       when taken together they represent
                                                       a city’s resilience to a wide range of
                                                       shocks and stresses.

                                                       CITY RESILIENCE FRAMEWORK

                                                        City Resilience Framework (CRF)
                                                        comprises four dimensions and 12
                                                       drivers, which together describe the
                                                       complex and interdependent issues
                                                         that contribute to a resilient city.

10
What is the City Resilience Framework? A resilient city is one that:
The City Resilience Framework provides a 1. Meets basic needs
lens through which the complexity of cities 2. Supports livelihoods and employment
and the numerous factors that contribute to 3. Ensures public health services
a city’s resilience can be understood. 4. Promotes cohesive and engaged
communities
It contains 12 drivers that describe the 5. Ensures social stability, security and
fundamental outcomes of a resilient city. justice
6. Fosters economic prosperity
7. Provides and enhances natural and
manmade assets
8. Ensures continuity of critical services
9. Provides reliable communication and
mobility
10. Promotes leadership and effective
management
11. Empowers a broad range of stakeholders
12. Fosters long-term and integrated planning
RESILIENT CAPE TOWN 111.3 The Resilience Strategy journey
The PRA documents Phase 1 of the Section 4 identifies emerging resilience
development of Cape Town’s Resilience themes and translates these into cross-
Strategy. We have undertaken a holistic review cutting Discovery Areas and Enablers to
of the city’s state of resilience, engaging with guide Phase 2 of our work, where we will
stakeholders, critical voices, City decision- undertake more detailed and targeted analysis.
makers and experts in a range of disciplines.
Section 5 describes the next steps we will
Sections 2 and 3 provide an overview of the take to complete a comprehensive strategy
city profile and summarise the work that has that seeks to improve the resilience of our
been done to date to understand Cape Town’s city through a programme of tangible,
key resilience strengths and weaknesses, as well implementable and impactful initiatives.
as identify opportunities where we can begin
to build on existing good work and initiatives.
12NOVEMBER 2015
2015 Cape Town applies to be a member of 100RC
MAY 2016
2016
Cape Town is selected to join the 100RC network
MARCH 2017 MAY 2017
Cape Town’s first Chief Agenda Setting Workshop
2017 Resilience Officer (CRO) Introducing the City of
is appointed by Council Cape Town and our stakeholders
to the 100RC network
SEPTEMBER 2017-JUNE 2018 JULY-SEPTEMBER 2018
Preliminary Resilience Assessment Discovery Area Analysis
Identifying priorities and partners Connect with stakeholders in Cape Town
for conducting more detailed and explore agreed Discovery Areas
diagnostic work in Phase 2 within working groups to advance
knowledge and test new opportunities.
2018
OCTOBER-NOVEMBER 2018 DECEMBER 2018 -MARCH 2019
Opportunity Assessment City Resilience Strategy
Organising and synthesising the Identifying and validating Cape Town’s
findings of the Discovery Area key resilience goals and initiatives.
analysis and diagnostic, together Goals will be the high-level priorities
with the PRA, to discuss with for action and the initiatives will be
stakeholders and identify and test specific activities that when
resilience-building options and implemented fulfil the ambition of the
implementable initiatives. Resilience Strategy.
APRIL 2019 ONWARDS
Implementation
2019 Implementing, monitoring and evaluating the Resilience
Strategy. The Resilience Strategy is not an outcome or endpoint
but a catalyst for long term continuous resilience building.
RESILIENT CAPE TOWN 132 City Profile 14
This section presents Cape Town’s city profile. It summarises information and
data necessary to understand the challenges and opportunities that the city faces.
The profile is an important counterpart to the inventory of resilience actions, the
assessment of perceptions and the CRI.
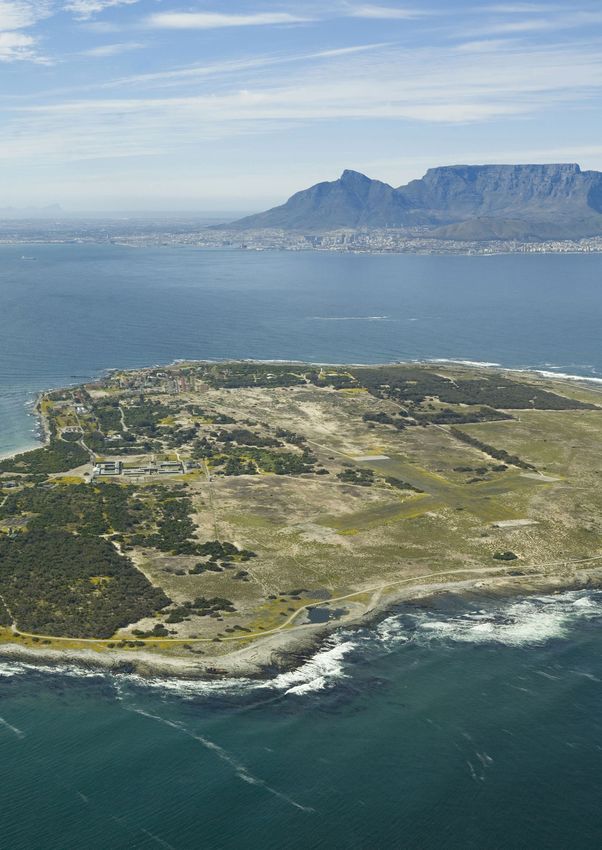
Cape Town, located in the Western Cape, is the legislative capital of South Africa
and is the location of the Parliament of South Africa.
World renowned for its stunning natural beauty
and biodiversity, it is one of the most popular
tourist destinations in the world. It is the
location of the iconic Table Mountain, one of the
New7Wonders of Nature1 and the location of two
UNESCO World Heritage sites, the Cape Floral
Region and Robben Island.2
It is the second most populous city in South
Africa and the 10th most populous city in Africa3.
In 2016 the population of Cape Town was 4 004
793, an increase of 7,1% since 2011 and of 56,2%
since 19964. This represents roughly a 1.5 - 2%
population increase per annum at present. From
2011 to 2016, Cape Town had the fourth highest annual population growth rate of
all the metropolitan municipalities in South Africa, increasing from 1,5% between
2011 and 2012 to 1,6% between 2015 and 20165. This rapid urbanisation is largely
the result of high inward migration of South Africans, particularly from the Eastern
Cape and other parts of the Western Cape. A significant number of new migrants
to Cape Town find residence in one of the city’s many informal settlements.
Cape Town’s continued growth will intensify the range of challenges it already
faces including high levels of unemployment, substance abuse and crime.
Simultaneously, Cape Town needs to overcome its inequitability, which is a legacy
of the former apartheid system. Hence Cape Town will require a major focus on
physical and economic infrastructure as well as human capital development to
manage these challenges.
RESILIENT CAPE TOWN 15Geography Population and Demography
Total area 2016 2456 sq. km. Population total 2016 4 004 793
Length of coastline including Table Mountain 307 km Gender 2016
National Park Female 2 034 040 (50,8%)
Male 1 970 753 (49,2%)
City budget
Population group 2016
Total (ZAR ‘000) 2017/2018 44 286 175
Operating (ZAR ‘000) 37 322 109 Black African 1 704 232 (42,55%)
Capital (ZAR ‘000) 6 964 066 Coloured 6
1 597 841 (39,9%)
Asian 43 593 ( 1,09%)
Governance
White 659 127 (16,46%)
Number of registered voters 2016 1 977 690
Gross population density 2017 1 700 ppl per sq km
Voter turnout actual 2016 1 271 923
Provincial life expectancy at birth 2017
Voter turnout % 64,21%
Female 71,8
Economy Male 66,8
Economic contribution to South Africa’s GDP 2016 9,9% Number of households 2016 1 264 849
Average economic growth per annum 2016 1% Household size 2016 3,17
Gini coefficient for Cape Town 2015 0,62
Natural environment
Unemployment rate (strict definition) 2017 22,7%
Percentage of land conserved 2015 20,82%
Percentage employment per sector 2016
Number of public open spaces: 2016
Formal sector 82,90%
Community parks 3 526
Informal sector 10,70%
District parks 12
Private households 6,30%
Greenbelts 364
Real GDP per capita 2016 R73 811
Average annual rainfall 2016 382mm
Health
Transport
Tuberculosis incidence for 1 000 population 2015 606
Percentage of citizens using public or private transport 2015
Infant mortality rate per 1 000 live births 2012 16.4
Public 52%
Private 48%
Length of tarred roads 2015 11 894km
The legislative context well as areas of exclusive competence and
2.1 of different spheres of functions. Examples of functional areas of
concurrent national and provincial legislative
government
competencies include agriculture, health
services, housing, tourism, disaster management,
The Constitution of the Republic of South regional planning and development, trade
Africa, 1996, provides for three spheres of and education at all levels, excluding tertiary.
government namely national, provincial and
local (municipal). The Constitution describes Examples of local government competencies
the spheres of government as distinctive, include building regulations, municipal
interdependent and interrelated. The City of planning, municipal public transport, firefighting
Cape Town is a metropolitan municipality, and services, childcare facilities, street trading
hence is the relevant local government authority and water and sanitation services limited to
in this regard. The Western Cape Government is potable water supply systems and domestic
the relevant provincial government. See figure waste-water and sewage-disposal systems.
2 for a graphical representation of the three
spheres of government and their competencies. National government has sole authority to pass
and implement legislation on any matter not
Through Schedules 4 and 5, the Constitution listed in Schedules 4 and 5 of the Constitution.7
provides for shared or concurrent competencies
(or mandates) between these spheres as
16FIGURE 2
The three spheres of government
SOURCE: ‘THE PEOPLE’S GUIDE’, PUBLISHED BY THE SOUTH AFRICAN CITIES NETWORK
Each of these spheres of government is made times, whether it be on the functioning of and
up of executive and administrative components. developmental plans for Metrorail, an entity
The executive components consist of the elected of national government 8, or over the supply
government for that specific sphere of government. of bulk water, in the context of the drought. 9
In some instances there is also a need for
Relations between the three spheres of greater cooperation and coordination between
government are governed by the principles of the City and provincial government as well.
co-operative government and intergovernmental
relations. These include, among others, respect In some cases intergovernmental disputes
for the constitutional status, institutions, have been declared. For example in 2011, the
powers and functions of governments in other City declared an intergovernmental dispute
spheres and exercising powers and performing with the South African National Roads Agency
functions in a manner that does not encroach over its plans to toll certain national roads in
on the geographical, functional or institutional the city. More recently, in July 2017, the City
integrity of government in another sphere. took the national Minister of Energy to court to
At the same time, there is inherent overlap in attempt to force the Minister to allow the City
terms of impact of the actions of one sphere of to procure renewable energy from independent
government on the other, and in many instances power producers. The City has set itself a
there are shared competencies. From a resilience target of sourcing at least 20% of its energy
perspective, this means that cooperation from renewable energy by 2020, but this will
and coordination between spheres is crucial. not be possible unless the City can purchase
this energy from an independent source. 10
As is noted on various occasions in this
document, there is room for improvement Notwithstanding the different functions and
in the intergovernmental relations between mandates of each sphere of government, if Cape
the City and national government. The City Town is to improve its resilience across a number
has found itself at odds with the national of thematic areas, it will require the cooperation
government on a number of occasions in recent of both provincial and national government.
RESILIENT CAPE TOWN 17The spatial context of
2.2 Cape Town
Apartheid urban planning and the racially
divisive policies of the country’s past have
negatively affected the spatial form, social
fabric and structure of the economy, and
resulted in urban management inefficiencies
and expensive operating costs. As a result,
the poorer population largely resides further
away from economic and employment hubs,
with uneven access to basic services as well as
affordable housing, health, education, transport,
social, cultural and recreational facilities.
The reality of this spatial context is clearly of the apartheid era that have been further
depicted by the City’s Transport Development exacerbated by urban growth and urbanisation.
Index which has shown that the low-income Through a bold spatial transformation process,
segment of Cape Town’s population spends a more productive, liveable and resource-
on average 43% of their household income on efficient city is the intended outcome.
commuting costs, more than four times the
acceptable international average.11 See figure 3 Following the approval of the City’s Organisational
for a snapshot of Cape Town’s transport network. Development and Transformation Plan (ODTP)
in 2016, the Transport and Urban Development
One of the main transport-related stresses Authority was established, which includes
experienced by Capetonians includes the duration the co-location of the City’s transport, urban
of peak-hour travel on the city’s public roads. development and human settlements elements,
Cape Town is South Africa’s most congested city allowing for improved transversal management.
and is ranked 48th in the world out of 390 cities
on the TomTom Traffic Index Report.12 Another Going forward, the strategic intent is to prioritise
key transport-related stress is regular failure bulk infrastructure within, or to the benefit
of the public transport system, particularly of of, the existing urban footprint, framed by
the Metrorail service, which is outside the City’s three integration zones. Further, high-density,
jurisdiction. Failure of Metrorail is typically due to high-intensity, mixed-use development will
vandalism and incidents of crime and violence. be prioritised along bus rapid transport trunk
For example, at the start of 2018 the busy Central routes and rail station precincts. Also, there
Line had to be shut down for six weeks after a will increasingly be integrated and innovative
security guard was murdered at Chris Hani station inclusionary housing solutions in the inner city
in Khayelitsha, which resulted in rail staff refusing urban cores, such as Khayelitsha, Cape Town CBD,
to work due to safety concerns. When attempts Claremont, Mitchell’s Plain, Wynberg and Bellville.
were made to restart the service, vandalism
through cable theft prevented it. 13 A further Various transport-related projects are included in
transport-related stress is the lack of integration the Integrated Public Transport Network, which
between the different public transport modes to describes the public transport routes that are
function as a cohesive whole.14 This example brings expected to be in place by 2032.15 These include
to the fore the challenge of intergovernmental further expansion of the MyCiti system to, among
relations from a resilience perspective. others, link Khayelitsha and Mitchells Plain to
Claremont and Wynberg, and the Blue Downs
The City has adopted the use of transit-orientated rail corridor project, which will be implemented
development to address urban inefficiencies in conjunction with PRASA, to connect the
and substantial transport costs, both relics Metro South East with the Northern Suburbs.
18FIGURE 3
Cape Town’s Transport Picture 2016
Cape Town is South Africa’s
most congested city and is
ranked 48th in the world
9%
Walking
or cycling
% of the population’s
main mode of transport
Metered Cycle
Taxis Lanes
1,585 440km
services operating
of cycle lanes 53%
Private
Transport
8%
Contracted 95%
car ownership in high
Bus Service to middle-income
communities
GABS, Sibanye
and MyCiTi
250,000+
passengers a day
1,400+
bus registrations
12% 6
regional bodies
Minibus
Taxis 119
associations
SANTACO
Western Cape 1,350
routes
18% 12,000
licensed minibus
taxis
Passenger Rail Bus Rapid 300,000+
Transit passengers
2.7% 125 32km
of trains are cancelled of dedicated
stations LAUNCHED
red road 2010
25% 1,014
of trains are delayed km of rail network
23 454,000
routes on 4 corridors passenger trips
72
operating train sets
SOURCE: CITY OF CAPE TOWN, CITY OF CAPE TOWN TRANSPORT DEVELOPMENT INDEX. TRANSPORT FOR CAPE TOWN, 2016.
RESILIENT CAPE TOWN 19There are at least 204 informal settlements in Informal settlements are at a greater risk from the
Cape Town that have been established in response effects of disasters. Some informal areas are built
to rapid inward migration and urbanisation. on dangerous sites such as unplanned landfills,
These informal settlements accommodate wetlands or depressions which intensifies the
approximately 145 000 households.16 They are likelihood of disasters such as flooding.18 From
mostly located on City-owned land. The reality a social point of view, these areas often overlap
is that the challenges of daily stresses and with high social vulnerability such as poverty,
intermittent shocks are exponentially higher for unemployment and high crime rates (see
individuals living in these settlements. Informal Section 2.4 for more information in this regard).
settlements are characterised by a lack of formal
tenure, insufficient public space and facilities, The City has various initiatives to re-block
inadequate access to municipal services, poor informal settlements that will, among other
access ways, and non-compliance with planning things, aim to create a safer public realm, access
and building regulations.17 In addition, informal for emergency vehicles, safe and convenient
settlements also confront health threats due to paths for movement on foot and, where possible,
the lack of disposal of greywater, the prevalence open space for essential community facilities
of rodents and other environmental health risks. that may precede formal upgrading processes.
2.3 The economic context of Cape Town
The Cape Town economy contributes 9,4% rate is the lowest of all metropolitan areas
to the national employment figure and is the in the country, the hard truth is that 448 312
second-largest employer of all the South Capetonians who want to work are unemployed.
African metropolitan areas. See figure 4. Furthermore, 26,5% of young people between
Cape Town’s economy has progressively
shifted towards a predominantly service-
driven economy with growth in tertiary sector FIGURE 4
industries outpacing growth in both primary Employment contributions per metro
and secondary sector industries in the past 10
years.19 The local economy has recently grown
faster than the country’s, primarily because it
is not heavily dependent on the mineral sector,
which has experienced a recent downturn.
Industries that have grown quickly and have
emerged as comparative advantages for Cape
Town include information and communication
technology, renewable energy, film and
media, and tourism and business services,
especially business-process outsourcing.
Accompanying this shift is the continuing
SOURCE: CITY OF CAPE TOWN EPIC 2017 Q2
decline of employment opportunities for
low- and semi-skilled workers in the city. 20
Cape Town’s unemployment rate as of mid-2017
stood at 22,7% on the narrow definition, and 24,2%
on the broad definition of unemployment.21 While
the strict unemployment rate is one of the lowest
in South Africa and the broad unemployment
20the ages of 18 and 25 are not in employment, particularly in respect to starting new
education or training (NEET rate).22 See figure 5 businesses, high labour costs by international
for an explanation of the unemployment statistics. standards, and low levels of entrepreneurship.
High unemployment is a significant stress in While the local economy has outperformed the
Cape Town and is a contributing factor to high national economy, it is still inextricably linked to
levels of poverty and economic inequality. the national economy and international investor
South Africa ranks among the most unequal sentiment. Policy and political uncertainty
countries globally with regards to the income at the national level and the weakening of
gap between rich and poor. Cape Town’s Gini state institutions have been sighted in recent
coefficient, like that of South Africa’s, remains times by ratings agencies for declining credit
high (above 0,5) and is currently 0,62. 23 ratings. There was however some early
evidence at the beginning of 2018 that investor
Notwithstanding significant efforts by both confidence in South Africa may be returning.24
the City of Cape Town and the Western Cape
Government to create an enabling environment For Cape Town, the key challenges include
for job creation, unemployment levels are the creation of a cross-section of jobs from
stubbornly stuck in a narrow band, not displaying highly skilled to semi-skilled and unskilled;
any consistent downward trend. See figure 5 for addressing the skills mismatch and high youth
an explanation of the narrow band of change unemployment; establishing infrastructure for a
between 2010 and 2017. A wide range of issues knowledge economy; attracting foreign direct
continue to constrain the current ability of Cape investment; and supporting small, medium and
Town’s economy to absorb larger numbers of micro enterprises within the local economy. A
low-skilled, unskilled and semi-skilled workers. variety of initiatives to address these challenges
These include productivity improvements are contained in the City’s Economic Growth
in labour intensive sectors leading to lower Strategy and in the Western Cape Government’s
demand for labour, red-tape constraints, Project Khulisa, but more needs to be done.
FIGURE 5
Unemployment in Cape Town
SOURCE: CITY OF CAPE TOWN EPIC 2017 Q2
RESILIENT CAPE TOWN 21FIGURE 6
Strict vs broad unemployment rates for Cape Town
SOURCE: CITY OF CAPE TOWN, 2017, EPIC 2017 Q3.
Also key is encouraging a closer alignment terms of sectors present in Cape Town. The
between the spatial location of employment greatest sector employer within the informal
opportunities and residential areas, and economy is retail and wholesale trade, account-
improving the ability of Capetonians to easily ing for 40% of all informal economy workers. 29
traverse the city to seek economic opportunities.
The informal economy in Cape Town, while
relatively small compared with other metropolitan
areas in South Africa, 25 is responsible for Nearly 450,000 Capetonians
employing approximately 6% of the working who want to work are
age population. As of mid-2017 this translated
into employment for 172 000 Capetonians. 26
unemployed
The main group participating in the informal
economy are classified as African (49%), male There is significant untapped potential in
(60%) and unskilled (43% without matric). 27 enabling the growth of the informal economy
in Cape Town, particularly as a means to
The informal economy, for its size, makes a absorb unskilled workers. There needs to be
disproportionately large contribution towards much more research conducted to understand
taking people out of poverty. Wages in the dynamics of the informal economy,
the sector are low, but they tend to accrue particularly in understanding value chains.
predominantly to poorer households. It is
estimated that the activity in the informal Above all, there needs to be an increased
economy reduces the poverty rate in Cape Town acknowledgement of the importance of
by 4,5 percentage points. This equates to a safety the informal economy in building a resilient
net for an estimated 186 000 Capetonians. 28 Cape Town. Some areas of possible focus
include adopting flexible and responsive
The informal economy is incredibly diverse in regulation and management approaches;
22FIGURE 7
The informal economy
The current drought in Cape Town, a significant
shock event, has laid bare the vulnerabilities
of the economy to constrained water supply.
While households, the largest water consumer
group, have responded well to restrictions,
many economic sectors have found the
restrictions considerably more challenging.
The drought has also attracted considerable
adverse international attention, which
may dull investor confidence for a period.
The Cape Town economy will recover from the
drought, and will emerge more water-resilient;
however, the impacts of climate change, which
includes drought, rainfall flooding, and heat
waves among others, is expected to be more
frequent and intense in the future. In addition,
the international imperatives to build a low-
carbon economy as a contribution to mitigating
climate change will add further challenges. For
this reason, it is important to make a concerted
effort to further enable the growth of the green
economy in Cape Town, which means expanded
economic opportunities through the provision
of goods and services and the use of production
SOURCE: INFOGRAPHIC ON INFORMAL ECONOMY PREPARED FOR CITY
OF CAPE TOWN BY SUSTAINABLE LIVELIHOODS FOUNDATION processes that are more resource-efficient,
enhance environmental resilience, optimise the
use of natural assets and promote social inclusivity.
moving from restrictive approaches to
supportive approaches; and supporting Lastly, the Cape Town economy needs to build
businesses to meet regulatory obligations. 30 resilience in response to the ‘Fourth Industrial
Revolution’. According to Klaus Schwab,
A resilient Cape Town economy needs to keep Executive Chairman of the World Economic
on top of international trends. In a globalised Forum, the scale, scope and complexity of
world, the local economy is inextricably linked the ‘Fourth Industrial Revolution’ will be a
to the world economy. Further, the impacts ‘transformation unlike anything humankind
of climate change pose significant resource as experienced before’. It is advancing at an
constraints on the economy, while also offering exponential rather than linear pace and it
significant opportunities for innovation. is disrupting almost every industry in every
RESILIENT CAPE TOWN 23country. It is transforming entire systems of
production, management and governance. 31
On the positive side it will bring gains in efficiency
and productivity, and decreased costs of
What is the Fourth Industrial transport, communications and trade. However,
Revolution? it could yield greater inequality, particularly in its
potential to disrupt labour markets as automation
It is a digital revolution that has increasingly substitutes labour. This is a significant
been occurring since the middle of risk to the Cape Town economy that already has
the last century. Occurring at an high levels of unemployment and inequality.
exponential rather than linear pace,
it is characterized by a fusion of The Cape Town economy needs to establish
technologies that is blurring the lines how it can capitalise on the ‘Fourth Industrial
between the physical, digital and Revolution’ to harness the opportunities, while
biological spheres. diminishing its possible negative impacts.
2.4 The social context of Cape Town
Cape Town consists of a dynamic and Western Cape between 2011 and 2014, it stabilised
multicultural society that provides a number in Cape Town during the same timeframe. 35
of opportunities. Precisely due to its diverse Together with its national and provincial
society, the City of Cape Town has highlighted counterparts and the United States President’s
the importance of social inclusion as a strategic Emergency Plan For Aids Relief, the City Health
priority. Cape Town is however also a city with Directorate is at the early stages of implementing
numerous societal stresses, many overlaid on t h e U N A I D S s t r a t e g y o f ‘ 9 0 - 9 0 - 9 0 ’ . 36
each other, with strong spatial agglomeration.
A downward trend in the incidence and number
Quality-of-health levels in general have increased of cases of tuberculosis (TB) began to emerge
in Cape Town, with the city’s infant mortality rate between 2009 and 2014, and was linked to
having dropped significantly in recent years.32 the increasing access to ARTs for HIV-positive
The Western Cape, of which Cape Town has the people who are vulnerable to TB if not on
largest population, had the highest average life the treatment regime. TB in Cape Town is
expectancy at birth (64 years) in the country exacerbated by poverty and urbanisation, which
in 2017. 33 While people are living longer and result in overcrowding, challenges with treatment
healthier lives, the percentage of economically adherence and substance abuse. Drug-resistant
active working-age people (aged 15-64) has also strains of TB (multidrug-resistant and extensively
increased. This has caused a drop in the total age drug-resistant) present an ongoing challenge.37
dependency ratio34 for Cape Town – an ongoing
trend for Cape Town over the last two decades. Illiteracy levels among Cape Town’s adult
population more than halved in the period 1996
There has been an increase in the number of to 2016, dropping from 4,2% to 2% in 2016. The
Capetonians living with HIV/Aids registering provision of basic education in Cape Town is
for antiretroviral treatment (ART) at the City’s a mandate of the Western Cape Government.
clinics, which means they are living longer lives. Education outcomes in the city have generally
Although the HIV-prevalence rate increased in the been better than the rest of the country. 38
24The benefit of improving health and education
levels as well as social development is
that Cape Town residents will develop an
increased capacity to withstand personal
and community trials, which can in turn
support efforts to build resilience in the city.
Key social stresses that Cape Town is still
grappling with can be linked to the country’s
historical roots, including the legacy of
apartheid, as well as ongoing high levels of
unemployment and poverty. These stresses
include crime, substance abuse, gang
activity and gender-based violence, 39 with
the youth and women being most at risk.
Social vulnerability has a distinct spatial
form in Cape Town. Social vulnerability is the
‘underlying state of conditions that makes
people more likely to be negatively impacted
by a shock or stress. It is often correlated
with a lack of wealth, education, employment,
access to services, health and assets.’ 40
In figure 8 the Social Vulnerability Index
approach is applied to Cape Town, using
44 variables from the Census 2011 statistics. for purposes of determining interventions.
Crime affects the whole of Cape Town, but
Social vulnerability varies greatly thoughout criminal activity in general and gang activity
Cape Town. According to UCT researcher, Alex in particular occurs more often in areas of
Aspostos, ‘the lack of wealth, income, education, social vulnerability and poverty, and is linked
asset ownership and employment appears to to social problems such as substance abuse.42
explain much of the variation in social vulnerability’
while secondary factors include a lack of access The high number of murders in Cape Town is of
to services and health problems. Demographic particular concern, and along with other high
and household charateristics are also important levels of crime, such as assault with intent to
in identifying vulnerability. As Aspostos goes on do grievous bodily harm, robberies and sexual
to note, ‘areas with high, black female-headed offenses, contributes to high levels of trauma
and extended family households are often areas in the city, which is itself a significant stress.
that also experience high social vulnerability.’ 41
The murder rate in Cape Town per 100,000
Decreasing social vulnerability is important for people (see figure 9) is the highest out of any
increasing resilience at household and community metropolitan municipality in South Africa,
levels. Continued investment in infrastructure, and is on an upward trend. It has increased
services and human capital is critically important by 40% between 2010/2011 and 2015/2016. 43
in areas of high social vulnerability. Importantly,
it needs to be understood that from a resilience Bringing down the high levels of crime, most
perspective, areas of social vulnerability are notably murders, and improving community
particularly susceptible to the impacts of safety requires the intergovernmental
shocks. Hence there is a need to combine cooperation of the following three spheres of
social vulnerability with physical hazard maps government: the South African Police Service
to identify areas of high overall vulnerability (SAPS), which is an entity of national government,
RESILIENT CAPE TOWN 25FIGURE 8
Social vulnerability in Cape Town
SOURCE: APOSTOS, ALEX 2017, ‘MAPPING SOCIAL VULNERABILITY IN CAPE TOWN’
26FIGURE 9
Recorded murder rates per 100 000 by municipality
SOURCE: URBAN SAFETY REFERENCE GROUP, THE STATE OF URBAN SAFETY IN SOUTH AFRICA REPORT, 2017
and whose overall responsibility is achieving safe in full or in part, are likely to be relevant to
communities; the Western Cape Government’s numerous other communities in Cape Town.44
Department of Community Safety, which is
responsible for police oversight and priority Nevertheless, much like Cape Town requires
setting; and local government, in this case the improved action from national government
City of Cape Town, which is responsible for in growing the local economy, it similarly
municipal policing and by-law enforcement, local needs improved action from the SAPS in
crime-prevention programmes and participation reducing crime. While there are certainly
in community and/or policing and safety forums. more actions that can be taken by local
stakeholders, including the City, improved
The Khayelitsha Commission, which examined resourcing, efficiency and professionalism
allegations of police inefficiency in Khayelitsha of the SAPS is desperately required.
and a breakdown in relations between the
community and the police, delineates numerous
recommendations for improving policing in that
community, including roles for all spheres of
government. These recommendations, whether
RESILIENT CAPE TOWN 272.5 The environmental context of Cape Town
Cape Town’s natural assets and biological
diversity are part of what makes the city a unique
and desirable place to live, work and visit. The
city is, however, very vulnerable to the impact
of climate change, notably to a likely increase
in frequency and intensity of extreme weather
events. Improving Cape Town’s adaptive capacity Climatic changes that Cape Town is
to climate change is of critical importance, and facing include:
is extensively covered in the City’s new climate-
change policy. The impact of climate change, • a decrease in annual average rainfall
which can manifest as shock events, have the
and changed seasonality of rainfall
ability to be multiplied by existing societal
stresses such as poverty and food insecurity. • an increase in mean annual tempera-
ture: higher maximum temperatures,
Climate change is globally understood to pose more hot days, and more frequent
a significant risk to socio-economic stability and intense heat waves
and growth. Although the City has been taking • an increase in average wind and
steps to reduce its climate vulnerability and maximum wind strength
carbon emissions, these have been insufficient • an increase in both the intensity
to address the pace of climate change impacts
and frequency of storms: short,
increasingly affecting Cape Town.46 A new climate
high-intensity rainfall events and
adaptation plan is currently in development and
increased size and duration of
will be aligned with the Resilience Strategy.
coastal storms
The city is located within one of the world’s six
plant kingdoms, the Cape Floristic Region (CFR),
which is a recognised UNESCO World Heritage
site. The CFR has been identified as a global
biodiversity hotspot that recognises it as one of vegetation types are critically endangered
the planet’s most threatened ecosystems and and remnants are required to be conserved
places an international responsibility on all spheres both within and outside the urban edge. 49
of government to ensure its adequate protection.
Cape Town is a unique example of a city where
Managing such threatened biodiversity in an biodiversity must be conserved as part of
urban context is a complex task. The network of the urban fabric, and be fully integrated into
conserved land is managed by various entities present and future spatial planning. The City’s
including the City, SANParks (national entity) and conservation goals and targets are aligned
CapeNature (provincial entity). According to the with the national goals. These targets are used
2012 State of the Environment Report, over two to determine the minimum sets of areas in the
thirds of the natural vegetation types are classified Biodiversity Network (BioNet). The BioNet
as ‘endangered’ or ‘critically endangered’, and is a fine-scale systemic biodiversity plan that
over 300 of Cape Town’s plant species are identifies sites that need to be prioritised for
threatened with global extinction.48 See figure conservation and protected from development
10 for a representation of the ecosystem status. and inappropriate management. The BioNet
forms part of Cape Town’s life-support system,
Cape Town has six endemic vegetation types, as natural ecosystems provide many goods
which means that they can only be conserved and services, as well as space for healthy
within the boundaries of the city. Four of these recreation and spiritual and social upliftment.50
28FIGURE 10 Ecosytem Status
Ecosystem status
Critically Endangered
Endangered
Vulnerable
Least Threatened
10
km
SOURCE: CITY OF CAPE TOWN 2012 STATE OF THE ENVIRONMENT REPORT
MAP 3: Conservation Status (2011)
16 RESILIENT CAPE TOWN 29FIGURE 11
Effectiveness of WCWDM
700 6.0
Water Treated per year (million m3)
600
5.0
Introduction of
WCWDM Programme
Population (millions)
500
4.0
400
3.0
300
2.0
200
1.0
100
1950 1960 1970 1980 1990 2000 2010 2020
Water Treated 4.0% growth Population Expon. (Population)
Resource constraints are becoming an despite population growth of approximately
increasingly important issue for the city. This 30% in the same period. See figure 11.
is currently most evident in the drought shock,
which is the most severe in recorded history. Hence, due to relatively high water-use efficiency
Rainfall responsible for filling the six large dams in Cape Town over roughly the last two decades,
of the Western Cape Water Supply System curtailment in consumption under drought
(WCWSS) has been critically low for the period conditions has had to be particularly severe.
2015 to 2017. 51 In order to meet nationally
prescribed water restrictions, mandated The drought has shone a spotlight on the lack
consumption of water was restricted to 50 of diversity in Cape Town’s water supply. More
litres per person per day as of the beginning of than 90% of the city’s water comes from the
2018. While ‘Day Zero’ — the day dams reach surface water in the six large dams.54 There has
13,5% of capacity and reticulation to much of thus been insufficient redundancy in the water
the city is turned off — will be avoided in 2018, supply system to provide extra capacity during
the drought has laid bare the vulnerability of this extreme shock event, which is beyond the
Cape Town to heightened drought conditions.52 modelled parameters of the water-supply system.
The current drought is much more severe than a
Cape Town has had remarkable success in water 1-in-50-year drought event. ‘The best estimate of
management over many years, and is regarded the return interval of the meteorological drought
as a global leader in water conservation and in the region of the Western Cape Water Supply
water-demand management (WCWDM). 53 System dams is 311 years, with 90% confidence
Prior to the current drought, and hence before that it actually falls between 105 and 1280 years’.55
curtailments in consumption, Cape Town
was consuming about the same amount of While plans to augment water supply using
water as it was at the start of this century, alternative sources such as groundwater
30abstraction, water re-use and desalination people of the city have had to shoulder the burden
have existed on the long-term demand plan of decreased consumption, the associated loss in
for Cape Town for some time, the drought revenue to the City and the cost of augmenting
has resulted in the advancement of the supply under emergency conditions. Water
development of these alternative sources. provision is another area that requires stronger
Starting in mid-2018 and ramping up for the intergovernmental cooperation in the future.
rest of the year into 2019, it is planned that
close to 150 mega-litres of additional water Cape Town is becoming a more water-resilient
from alternative sources will enter the system.56 city, but there is a considerable journey still
ahead. The resilience of Capetonians has
Much like the issues of the economy and safety been remarkable. There is a need at the
discussed earlier, the water system also has appropriate time to capture the learnings
different competencies assigned to different from this drought so that they can be used to
spheres of government, particularly local and prepare for other shock events in the future.
national government. National government
through the Department of Water and Sanitation
is primarily responsible for provision of bulk water
supplies, while local government is responsible
for the treatment and reticulation of water to
consumers. During the current drought there
has been conflict between regional and national
decision makers about roles and responsibilities
for water supply and there has been little
support from national government for disaster
preparedness.57 The City of Cape Town and the
RESILIENT CAPE TOWN 312.6 The City budgetary context
The City has a R44,3 billion budget for the
financial year 2017/2018. Of this, R6,8 billion FIGURE 12
Budget for each City directorate for 2017/2018
is for capital and R37,5 billion is for operating
expenditure. Figure 12 shows the budget for
each Directorate as at the date of Council
approval. It is clear from this information
that the largest portion of the City’s budget,
by virtue of the allocations to the energy
directorate and the informal settlements,
water and waste services directorate, is
allocated to providing basic services as well
as to providing infrastructure for the poor.
The City’s principal sources of revenue include
property rates, electricity tariffs, refuse tariffs, water
tariffs, sanitation tariffs and housing rental charges.
Other income includes an equitable share
grant from national government, which is used
to subsidise the provision of free basic water,
electricity, sanitation and refuse removal
services for the poor, and a fuel levy allocation
from national government based on fuel
sale figures within the municipal jurisdiction.
At the time of the passing of the 2017/2018
budget, revenue from electricity sales was
SOURCE: CITY OF CAPE TOWN PRESENTATION ON 201/2018 – 2019/2020 BUDGET
expected to shrink by 1% over the course of
the year, attributed to an increased uptake in
efficiency and conservation interventions by
consumers. The IDP highlights the need for underestimated. Due to more stringent water
a project to implement a revenue model that restrictions issued after the passing of the
reduces the City’s reliance on electricity sales.58 budget as the true extent of the drought shock
It is acknowledged that as consumers become became known, it was reported to Council
more energy-efficient and adopt more small-scale in December 2017 that the projected water
embedded generation, the electricity distribution budget would incur a deficit in the region of
model needs to change to keep the City’s rates R1,7 billion for the 2017/2018 financial year.59
account affordable and financially sustainable.
The current drought has put significant pressure
At the time of the passing of the budget it was on the budget, with some adjustments having
also projected that there would be negative to be made within the financial year to fund
growth in revenue earned from water and emergency water-augmentation projects. It
sanitation due to the physical reduction in has shone a spotlight on the sensitivity of the
water usage due to water restrictions during the existing revenue model of the City during
drought shock event. It was also foreseen that shock events and highlighted the difficulty of
there would be permanent reductions in water funding projects in emergency circumstances
usage after the drought due to actions taken that were not foreseen when the budget was
by consumers during the drought. However, approved. Responding to shock events is not
the projections in negative growth were heavily easily done off the balance sheet as it stands.
32A selection of capital budget highlights for 2017/2018 as approved by Council in May 2017
Energy Finance
R7m for e-tendering system to speed up tender
R60,5m for electrification programme to provide processes
subsidised connections to informal settlements and
housing developments
R67,8m for streetlighting in various areas in aid of
safe movement of pedestrian and vehicular traffic
R14,5m for resource and energy efficiency in large
municipal buildings
Corporate Services
R260m for continued rollout of broadband to build
the Metro Area Telecommunications Network
R3,5m for provision of internet access at all libraries
Social Services
R16,2m for new early childhood development centres
in Strand and Heideveld
R22,9m for new clinics in Fisantekraal and Pelican Park
Area Based Service Delivery
R6,9m for replacement of clinics in Uitsig and
Zakhele
R3,8m for upgrade of informal markets and facilities
R23,1m for new library in Dunoon
Informal Settlements,
Transport & Urban
Water and Waste Services
Development Authority
R462m for ongoing rollout of IRT Project: Phase 2A R44m for materials-recovery facility at Athlone and
linking Mitchells Plain and Khayelitsha to Wynberg Coastal Park to divert waste from landfills
and Claremont public transport hubs R60,5m for gas-management systems at various
R108,7m for development and upgrading of various landfill sites
public transport interchanges R38m and R35m for construction of civil and
R150m for rollout of pedestrian and cycle facilities electrical infrastructure at Kalkfontein Informal
across the city Settlement and Seethomes, Philippi respectively
R239,6m for various projects intended to relieve R22m for informal settlements’ sanitation installation
traffic congestion R341m for extensions to various wastewater
R66m for provision of bulk infrastructure for housing treatment plants
projects in Greenville in Fisantekraal, and Imizamo R13,1m for water network upgrading to ensure an
Yethu uninterrupted supply of water and to prevent water
losses
SOURCE: CITY OF CAPE TOWN PRESENTATION ON 2017/18 – 2019/20 BUDGET
RESILIENT CAPE TOWN 33You can also read


