VISION - ASPIRATIONS - ACTIONS - 2012 Plan of Conservation and Development - Adopted: December 17, 2012 Effective: January 14, 2013 - Planning
←
→
Page content transcription
If your browser does not render page correctly, please read the page content below
2012 Plan of Conservation and Development

VISION – ASPIRATIONS – ACTIONS

                                  Adopted: December 17, 2012
                                   Effective: January 14, 2013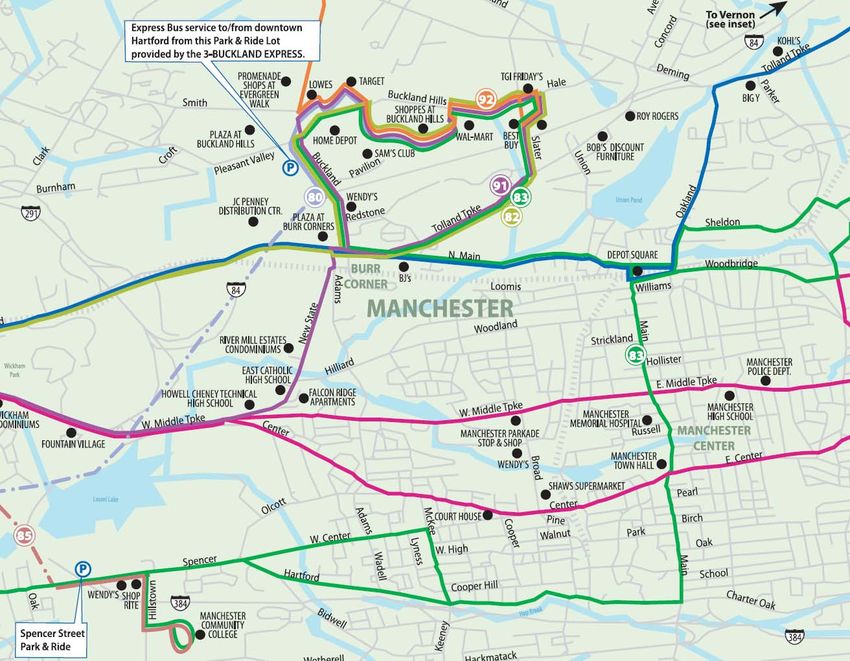
ACKNOWLEDGEMENTS

   Planning and Zoning Commission
         Joseph Diminico, Chairman
        Kevin Dougan, Vice Chairman
            Andy Kidd, Secretary
               Horace Brown
                 Eric Prause
              Anthony Petrone
              Susan Shanbaum
                John Chaput
               Michael Stebe
             Eugene Sierakowski

            Board of Directors
            Leo V. Diana, Mayor
          Jay Moran, Deputy Mayor
          Lisa P. O’Neill, Secretary
                 Steve Gates
               Susan Holmes
             Rudy C. Kissmann
              Cheri A. Pelletier
              John D. Topping
              Mark D. Tweedie

       Planning Department Staff
              Mark Pellegrini, AICP
Director of Planning and Economic Development
           Gary A. Anderson, AICP
Senior Planner-Comprehensive/Special Projects
            Renata Bertotti, AICP
       Senior Planner-Current Planning
           Matthew R. Bordeaux
    Environmental Planner/Wetlands Agent
            Heather Donoghue
  Community Development Program Manager
Manchester 2020 Participants
Joie Aiken                     Bob Eckert            Jim MacDonald           Bruce Samborski
Scott Aiken                    Christina Edelwich    Doug MacGillvary        Bob Samuelson
Nick Albano                    Nicholas Ehr          Phil MacVane            Bettylou Sandy
Peg Aldrich                    Mary Ann Ettinger     Kathy Maffe             Robert Santy
Nicolas Arias                  Lauren Falzarano      Amelia Mariotti         Mary Savage-Dunham
Barbara Armentano              Mike Farina           Martha Marteney         Jack Sayre
Mary Ann Attinger              Eileen Faust          James Martin            Jan Sayre
Betsy Baker                    David Fiereck         Martha Martinez         Bob Schneider
Evelyn Banning                 Jennifer Fiereck      Jon Marx                Bob Sekoll
Bob Barker                     Herb Flink            Jeanne Matthew          Sharon Sekoll
Linda Barker                   Bruce Forde           Steve Mazdski           Bob Shanbaum
Malcolm Barlow                 Donna Forde           Lauren Mcavoy           Susan Shanbaum
Susan Barlow                   Margaret Forman       Linnea McCaffrey        Bill Siddons
Maureen Barton                 Leslie Frey           Jack McCoy              Kathy Siddons
George Beauregard              Dan Gallagher         Doug McDonough          Chris Silver
Jeri Beckford                  John Garaventa        Charlie McFall          Glenda Sinnamon
Joni Belman                    Steve Gates           Rita McParland          Joe Sinnamon
Joshua Beltre’                 Sally Gifford         Sarah Melquist          Ed Slegeski
Wilma Beltre’                  Charles Gilbert       Shelby Mertes           Dave Smith
Hector Beltre’, Sr.            Kristi Gillespie      Anne Miller             Doug Smith
Hector-Gabriel Beltre’, Jr.    Albert Gionet         Lauren Miller           Ginger Smith
Martha Bertrand                Henry Golembeski      Ashley Mills            Greg Smith
Len Bjorn                      Mark Gorka            Trudy Mitchell          Mike Smith
Terry Bogli                    Gerry Guay            Christy Morin           Selwyn Smith
Robert Bonn                    Don Guinan            Sharon Morin            Steve Smith
Pete Bonzani                   John Guszkowski       Donna Mozdzierz         B. Snyder
Loretta Bowden                 Robert Haley          Walter Mozdzierz        Diane Sorrentino
Deb Bowen                      Clifford Hall         Nancy Murray            Lou Spadaccini
Paul Briggs                    John Hammer           Jennifer Nelson         David Spaulding
Jean Burr                      Ann Heinrich          Peggy Newton            Fred Spaulding
John Caraventa                 Eric Heinrich         Bill Nighan             Mike Stebe
Laura Cassidento               Janet Heller          Douglas Norwood         Doug Stewart
Deanna Catudal                 Bob Hetzel            Christiane O’Brien      Julian Stoppelman
Maryann Cherniak-Lexius        Pat Hetzel            Kevin O’Brien           Susan Stoppelman
Natalie Chirico                Lee Hilliard          Jerry O’Connor          Sandy Stough
Carolyn Chudzik                Linda Hilliard        Sue O’Connor            Dean Streeter
William Chudzik                Joyce Hodgson         Barbara O’Donnell       Debbie Streeter
Sarah Cinquenani               Rich Holmes           Bill O’Neill            Tom Stringfellow
Patrick Clancy                 Susan Holmes          Chuck Obuchowski        Phil Susag
Joan Clapp                     Eric Horan            Jim Orfitelli           Judy Sutter
Mark Connors                   Cheryl Jacobs         Bill Overton            Eileen Sweeney
Marianne Cornish               Howard Jacobs         Matt Pafford            Wayne Sweeney
Kim Costello                   Peggy Jacobs-Forman   Lisa Paggioli-O’Neill   Gary Sweet
Pam Cowan                      Pat Jensen            Nancy Pappas            Charlene Tappan
Curtis Cunningham              Rich Jensen           Ed Paquette             Jack Thompson
Irene Cyr                      Collins Johnston      Nancy Parker            Joy Thompson
Thomas Danahy                  Jennifer Kalasardo    Terry Parla             Nohemy Tirado
Mike Darby                     Gregory Kane          Tana Parseliti          Tom Tomko
Kathleen Dargan                Andy Kidd             Matt Peak               Rebecca Townsend
Jeremy DeCarli                 Merrill Kidd          Barbara Pettyjohn       Joan Troy
Tom Deffenbaugh                Geoffrey King         Elyse Petzold           Laurinda Tuthill
Dianne DeJoannis               Rudy C. Kissmann      Ralph Petzold           Melissa Tweedie
Gene DeJoannis                 Stephanie Knybel      Doris Phillips          Joe Tyler
Tim Devanney                   Kip Kolesinskas       Berlin Pineda           Sue Valade
Leo Diana                      David Kooris          Bonnie Potocki          Marlene Walsh
Susan DiBella                  Bill Kramer           Harold Potocki          John Weedon
Doti Dienst                    JD LaBelle            Barbara Quigley         Barbara Weinberg
Joe Diminico                   Marcie LaBelle        Frank Reischerl         Terry Werkhoven
Theresa Dittman                Margaret Langevin     Marie Richard           Ralph Willing g
Joy Dorin                      Robert Laughlin       Rima Riedel             Kathryn L. Wilson
John Dormer                    Fred Lee              Gary Robbins            Sharon Woodley
Ellen Dougan                   Barbara Leighton      Helen Robbins           Catherin Wynn
Kevin Dougan                   Bryan Lerch           Matthew Robinson        Jodi Wynn-Rodiger
Debbie Downing                 Jim Lessard           Mary Roche-Cronin       Andy Zyrek
Rick Downing                   Jillian Lopez         Orlando Rodriguez
Lelia Druzdis                  Serafin Lopez         Jason Rojas
Latasha Easterling-Turnquest   Geoff Luxenberg       Chuck Russell
TABLE OF CONTENTS
I.      INTRODUCTION ................................................................................................................1
II.     CURRENT ENVIRONMENT AND EXPECTED TRENDS...........................................3
        Overview.................................................................................................................................3
        Population ..............................................................................................................................3
        Economy .................................................................................................................................6
        Housing ..................................................................................................................................8
        Community Facilities ...........................................................................................................12
        Sustainability ........................................................................................................................12
        The Public Policy Response .................................................................................................13
III. ASPIRATIONS, OPPORTUNITIES AND CHALLENGES .........................................14
IV.     GROWTH MANAGEMENT PRINCIPLES...................................................................17
        GMP 1: Conserve, Restore, and Protect of the Natural Environment, Farmland, and
        Assets Critical to Public Health and Safety .........................................................................17
        GMP 2: Conserve, Restore and Protect Cultural and Historic Resources .........................22
        GMP 3: Redevelop and Revitalize Existing Commercial Centers and Areas of Mixed Land
        Use ........................................................................................................................................27
        GMP 4: Concentrate Development Around Transportation Nodes and Major
        Transportation Corridors .....................................................................................................37
        GMP 5: Expand housing opportunities and design choices to accommodate a variety of
        household types and needs. ..................................................................................................47
V.      GOALS AND OBJECTIVES ............................................................................................53
VI.     COMMUNITY CHARACTER .........................................................................................60
VII. HOW TO USE THIS PLAN ..............................................................................................66
VIII. CONSISTENCY WITH STATE GROWTH MANAGEMENT PRINCIPLES ..........77

APPENDICES
Appendix A: Economy .................................................................................................................83
Appendix B: Housing ...................................................................................................................88
Appendix C: Community Facilities ..............................................................................................89

                                                                      –i–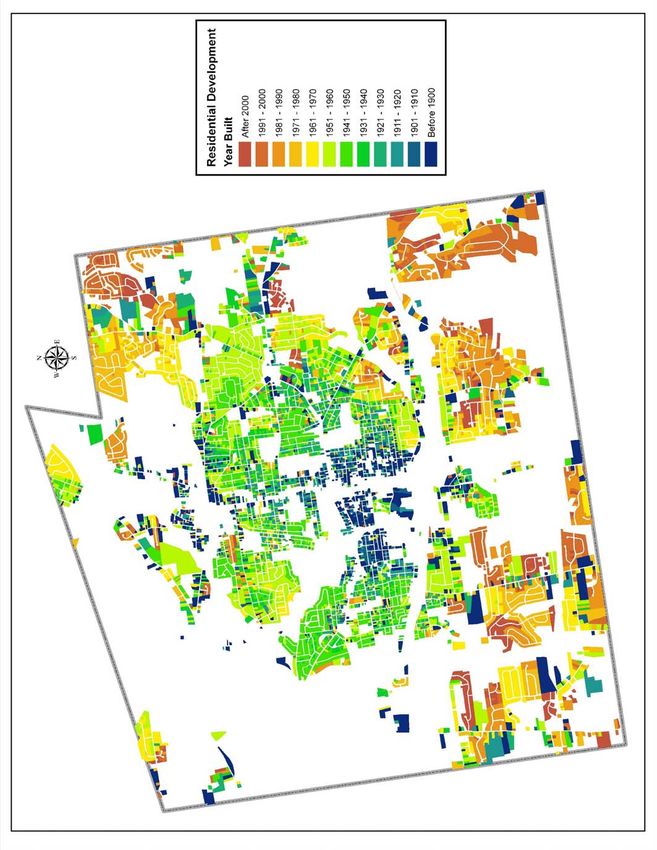
I.      INTRODUCTION

Planning Process

The process for preparing this update of the Town’s Plan of Conservation and Development was
organized with several objectives in mind. We wanted the Plan to resonate with and be
supported by a broad segment of the community – both its residents and the Town Boards and
Commissions responsible for carrying out the Plan’s recommendations. We wanted the Plan to
be focused on the future and on results – what kind of community we want to be and how we
will get there. We wanted to think more in terms of placemaking than policymaking to ensure
we created attractive, safe, and vibrant neighborhood, business and mixed-use districts, industrial
and business parks, and recreational and open spaces.

We organized the process so that everyone engaged would be involved in all aspects of the plan.
Traditionally subcommittees made up of representatives of Town Boards or Commissions,
selected community members, and staff would conduct their own research and develop
recommended goals and objectives for their particular study area. These subjects included
housing, the economy, parks and open space, community facilities, transportation and cultural
and historic resources. The PZC and staff would combine the individual subcommittee reports
and recommendations into a unified Plan of Conservation and Development.

For the Manchester 2020 Plan we invited all Town Boards and Commissions and the public to
attend informational programs and workshops to examine and discuss all issues and
opportunities affecting Manchester. Instead of organizing around specific topics such as housing
or transportation, we organized the discussion around the growth management principles in the
State Plan of Conservation and Development, which we are required to address by State Statute.
This approach integrated the opinions, knowledge, skills, and expertise of a broad cross section
of the community, allowing us to look at the Town in a more holistic way. The State growth
management principles are:

     1) Conserve, restore, and protect the natural environment, farmland, and assets critical to
        public health and safety.

     2) Conserve, restore, and protect cultural and historic resources.

     3) Redevelop and revitalize commercial centers in area of mixed land use where there is
        exiting or planned physical infrastructure.

     4) Concentrate development around transportation nodes and along major transportation
        corridors to support the viability of transportation options and land reuse.

     5) Expand housing opportunities and design choices to accommodate a variety of household
        types and needs.

A sixth growth management principle requires that plans of conservation and development be
consistent with regional and state plans. The PZC made every effort to meet this principle
during the planning process as well, organizing the plan around the State’s growth management
policies and including references to and recommendations from various regional plans.

                                             –1–                            Adopted: December 17, 2012
                                                                             Effective: January 14, 2013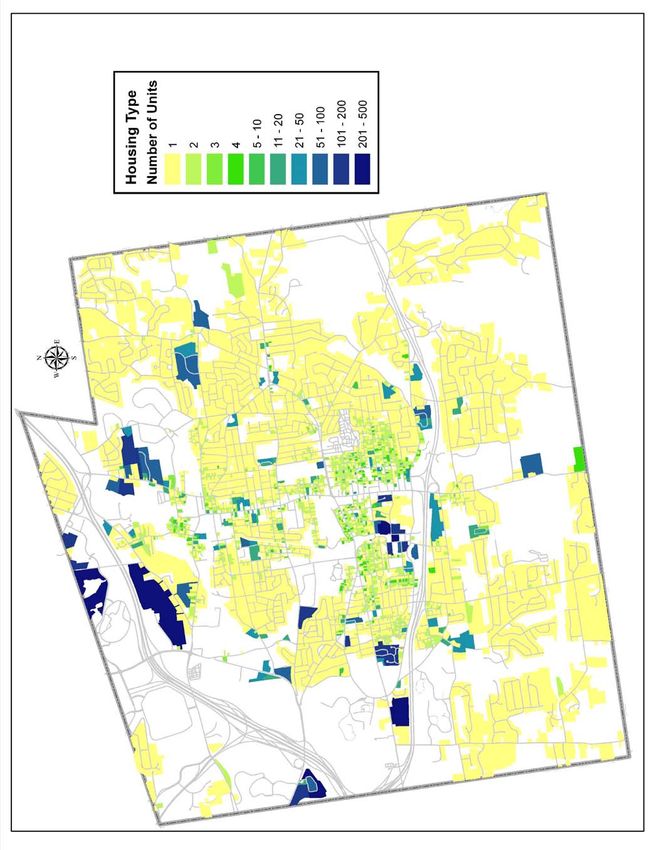
In order to develop the major issues, trends and opportunities identified in this plan, we divided
Manchester into four geographic quadrants. In each quadrant we held a workshop where
participants commented on opportunities for conservation and development that would support
or achieve the growth management principles. Additional sessions held on specific topics such
as agricultural viability or public transit, and additional staff research were added to the initial
impressions of the participants at the quadrant meetings, resulting in this final plan document.

                                             –2–                             Adopted: December 17, 2012
                                                                              Effective: January 14, 2013
II.      CURRENT ENVIRONMENT AND EXPECTED TRENDS

Overview

The Manchester 2020 Plan was prepared during a time when the State and nation were beginning
a slow recovery from the most severe economic recession in decades. The collapse of the
financial markets not only threatened the banking system but resulted in unemployment between
9% and 10%; a record number of home foreclosures and attendant declines in home sales, prices,
and new construction; a rising federal deficit resulting from less revenue and increased
expenditures to stimulate the economy and stabilize the financial markets; severe State budget
deficits; and declining State and federal resources to support local government services.
Manchester tends to mirror state and regional trends and so each of these issues had some effect
on both the town and its residents.

Although these events were severe and may result in long-term structural changes in the
economy, they were relatively short in duration. Other larger and longer-term trends will affect
Manchester, the region and nation in the future.

Population

Connecticut’s population growth has been relatively flat for the last 20 years. If not for foreign
immigration the State would have actually lost population during that period. Manchester,
however, has grown steadily over the same time period and is projected to continue to do so over
the next decade. The Connecticut Economic Resource Center projects Manchester’s population
will grow by 1.1% each year between 2010 and 2016, higher than the projected increases for
Hartford County (.8%) and the State (.8%). Additionally, while most of Connecticut is expected
to grow older at a rapid pace, the aging of Manchester’s population is projected to be less
significant, due partially to the diversity of both its population and its housing stock. Already a
diverse community in terms of age, income, race, and ethnicity, Manchester will become more
diverse. Over the next 20 years younger residents will be much more racially and ethnically
diverse within their age group than older residents.

Table A: Population Growth
                                                      %
                       1990      2000      2010     Growth
Manchester            51,618    54,740    58,241     12.8%
Hartford County                                      3.3%
Connecticut                                          6.6%
Source: US Census

                                            –3–                            Adopted: December 17, 2012
                                                                            Effective: January 14, 2013
Chart 1: Population by Race and Ethnicity

Source: US Census

Nationally, the Baby Boom generation, the oldest members of whom are now entering
retirement, will continue to grow as a percentage of the population. Generation X (generally
those born in the 1960s and 1970s) is a large share of the current workforce and housing market
while Generation Y (generally those born in the 1980s and 1990s) is starting to enter the
workforce and in terms of its size, is larger than even the baby boomer population. Meanwhile it
is expected that the K-12 population will decrease over the next 20 years.

                                          –4–                            Adopted: December 17, 2012
                                                                          Effective: January 14, 2013
Chart 2: Population Trends by Age

Source: US Census

It is expected the fastest growing segments of the housing market will be driven by married
couples without children, including young people and empty nesters, and single person
households. Empty nest and Gen X homeowners currently comprise the “move out and move
up” market, while the Generation Y segment represents new households entering the market.
Research indicates these groups will primarily be looking for housing that is efficient and
affordable, and will be more interested in smaller spaces that require less maintenance. Renting
will be an attractive option for many households because of cost, convenience, uncertainty
regarding the future investment returns of homeownership and the freedom to move to other jobs
in an increasingly fluid economy.

These large population trends will influence the community’s housing market, neighborhoods
and the demand for and type of services expected from the community. On one hand, an
expanding elderly and retired population may feel they have less disposable income and be less
likely to fund major capital investments or service improvements from which they may not
directly benefit. On the other hand, new households looking for places to live will be expecting
high levels of services, quality amenities, vibrant, interesting places and quality schools.

                                           –5–                            Adopted: December 17, 2012
                                                                           Effective: January 14, 2013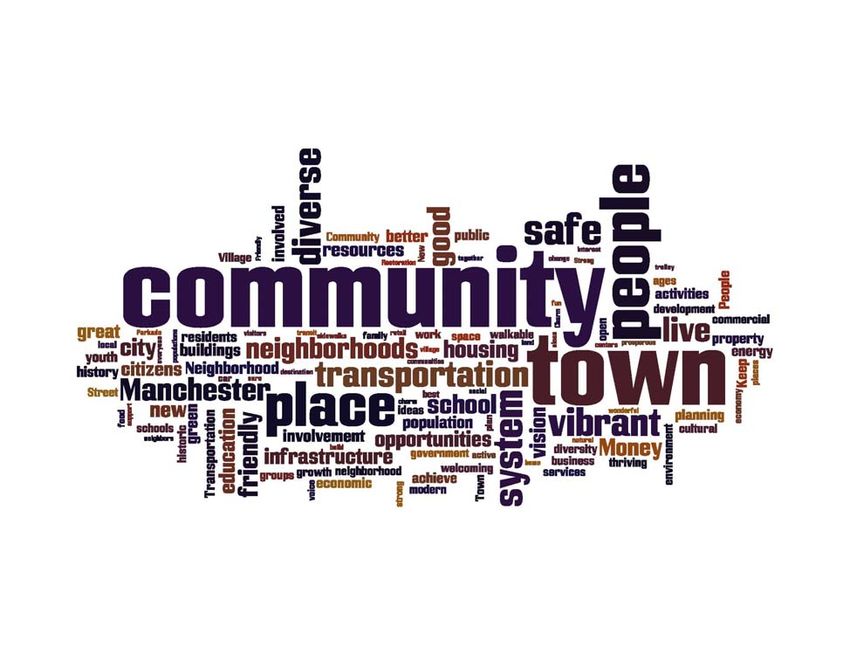
Table B: Household Income Distribution
% of Manchester
Income Households Earning in 2008
< $15,000 10.0%
$15,000-
$24,999 9.6%
$25,000-
$34,999 8.5%
$35,000-
$49,999 14.0%
$50,000-
$74,999 19.8%
$75,000-
$99,999 15.5%
$100,000-
$149,999 14.1%
> $150,000 8.5%
Source: US Census
Economy
Manchester serves as an economic, employment and service hub of the Greater Hartford region
east of the Connecticut River. As it has throughout its history, the Town continues to grow and
adapt to economic and market conditions through a robust and diverse local economy, desirable
location, active government and residents, and cooperation between the private and public
sectors.
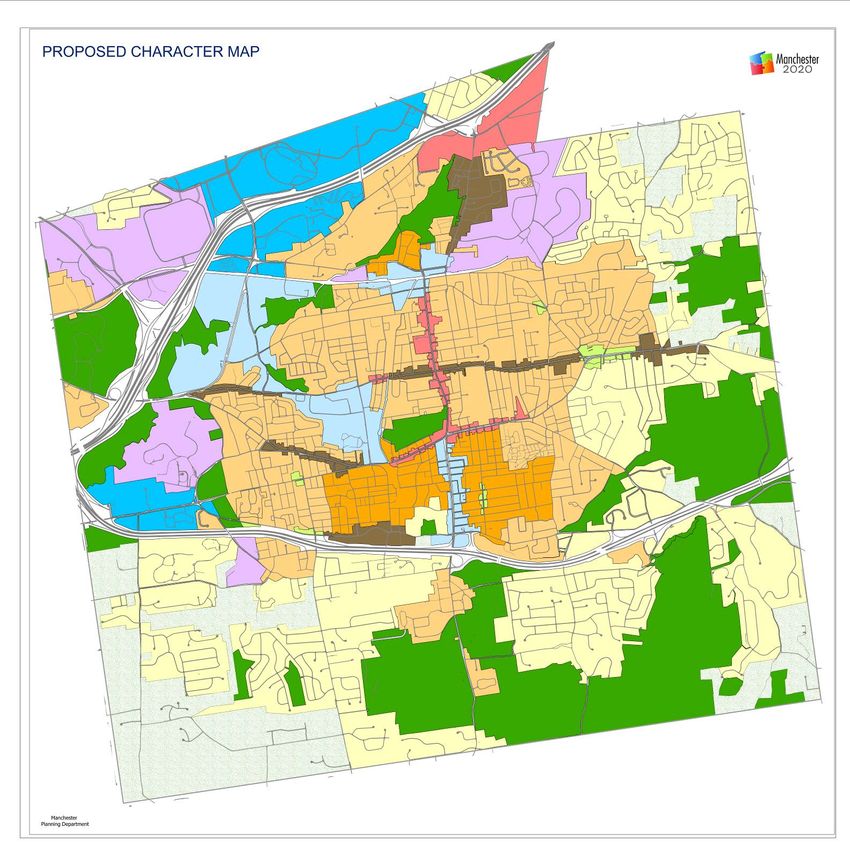
One of Manchester’s primary economic advantages is its location along Interstates I-84, I-384
and I-291. Ten miles east of Connecticut’s capital city of Hartford and approximately halfway
between New York and Boston, Manchester is both a major regional destination and a strategic
location between the two major economic drivers in the northeast. Local transportation
infrastructure compliments the Town’s highway access and includes hundreds of local roads,
local and express bus service routes and freight rail service. Tens of thousands of people travel
to, from and through Manchester on a daily basis. This prime location makes Manchester
attractive to industries of various sizes and types.
Manchester has developed a variety of unique commercial and mixed-use districts, industrial and
warehouse locations, and regional destinations. Each district serves a specific purpose,
demographic and market.
While Manchester continues to be interested in growing the Town’s share of regional economic
activity, each commercial area has its own distinct character and different areas call for business
activities of differing scales. Buckland Hills serves as a superregional shopping center and as
such is home to various national and regional retailers and restaurants. Business parks continue
to be attractive to large and medium scale manufacturing, warehousing and other uses. Spencer
Street and Tolland Turnpike are heavily traveled commercial corridors. Mixed-use districts like
Downtown, Depot Square and the emerging Broad Street area are compact community centers
–6– Adopted: December 17, 2012
Effective: January 14, 2013with a mix of uses and activities. Neighborhood centers like Manchester Green and commercial
corridors like Center Street offer opportunities for locally owned retail, convenience, restaurant
and office uses. While much of the business activity at each activity center and corridor is driven
by market conditions, existing zoning and available space, there is a need to identify
opportunities and challenges specific to various districts. Using these and other tools,
Manchester has the opportunity to take advantage of its rich economic resources as a way to
build vibrant places.
Workforce and Employment
The Great Recession of 2008 had far-reaching effects on the state and regional economies. The
recession lasted 22 months in Connecticut, four months longer than it lasted nationally. During
that time period the state lost 119,000 jobs, according to the report State of Working Connecticut,
2011: Jobs, Unemployment, and the Great Recession (Santacroce and Rodriguez 2011). The
report estimates it will take approximately six years to regain pre-recession employment levels.
Unemployment in Connecticut peaked at 9.3% in 2010 and six out of the seven largest sectors
suffered job losses between 2008 and 2010. The retail, manufacturing, finance and insurance,
accommodation/food services and local public education sectors lost jobs, while private sector
health care saw an increase in jobs. Regionally, the recession hit the finance/insurance and
manufacturing sectors especially hard, costing those sectors 7% and 11% of regional jobs
respectively.
As in the State as a whole, the healthcare sector, a single bright spot, experienced positive
growth in the Hartford Metro Statistical Area (MSA) between 2008 and 2011, adding 3,100 jobs
during that time period. The recovery continues, although very slowly. In 2012 the
unemployment rate was 7.8%, with healthcare, manufacturing and retail employment leading
employment gains.
The recession had a disproportionately negative effect on younger members of the labor force
and on minority populations, both of which are more highly represented in Manchester than in
the region as a whole. Statewide unemployment levels for Hispanics from 2006 to 2010
increased by 9.5 percentage points, 7.3 percentage points for African-Americans, and 4.2
percentage point for whites. In 2006, unemployment among workers age 55+ was 2.7 percent
compared to 11.4 percent for the youngest workers age 16-24, a difference of 8.7 percentage
points. By 2010, the unemployment gap had grown to 11.6 percentage points, with
unemployment among young workers at 18.2%. It could be argued that because of the relatively
high percentages of younger and minority residents the recession hit Manchester residents harder
than other municipalities in the region. However, the diversity of Manchester’s commercial base
has likely allowed it to ride out the difficult economic period more quickly than municipalities
that depend more heavily on one or two primary industries.
Unemployment in Manchester stayed just below state averages during both the recession and
recovery periods. In 2009, 27,501 people were employed in Manchester and 30,545 Manchester
residents were in the labor force. These totals made up 6% of the jobs in Hartford County and
7% of the County’s workforce. In terms of unemployment, Manchester has historically reflected
state and regional trends. The yearly average unemployment for both Manchester and the state
peaked in 2010. In that year Manchester averaged 8.8% unemployment, while Connecticut
averaged 9.3%. The average unemployment rate fell in 2011 and continued to fall through the
first quarter of 2012 (see Chart 3).
–7– Adopted: December 17, 2012
Effective: January 14, 2013Chart 3
Unemployment Trends 2002-2011
10.0%
9.0%
8.0%
7.0%
6.0%
Connecticut
% Unemployed
5.0%
4.0% Manchester
3.0%
2.0%
1.0%
0.0%
2002 2003 2004 2005 2006 2007 2008 2009 2010 2011
Year
Source: CT Labor Department
Housing
Manchester’s housing stock has continued to grow over the past decade, despite the recent
downturn in the national, regional and local housing markets. The 2010 Census indicates
Manchester currently has 25,996 housing units, an increase of 7.2% since 2000. Between 2000
and 2010, Manchester added 1,740 units of housing. Of the current units, 24,689 or 95% are
occupied and 5% are vacant. Of those occupied housing units, 57% are owner-occupied and
43% are occupied by renters.
In terms of housing type, just over half (54%) of all housing units are single family homes, while
46% fall into a multi-family category. Of the units in multi-family structures, 10% are in
duplexes, 8% are in buildings of 3-4 units, 9% are in buildings of 5-9 units, and 8% are in
buildings with 10-19 units (see Chart 4). The largest category of multi-family structures are of
20 or more units, which contain 11% of Manchester’s housing units. This mix of housing
attracts a diverse demographic and offers residents opportunities to stay in town as their living
space needs, income and lifestyles change over time. The diversity of Manchester’s housing
stock also cushions fluctuations in the housing market, adding to Manchester’s economic
sustainability over the long term.
–8– Adopted: December 17, 2012
Effective: January 14, 2013Chart 4
MANCHESTER HOUSING UNITS BY STRUCTURE TYPE
11%
8%
1 Unit Detached
1 Unit Attached
9% 48% 2 Units
3-4 Units
5-9 Units
8%
10-19 Units
20 or More Units
10%
6%
Source: 2008-2010 American Community Survey
Because Manchester started developing before most surrounding towns, its housing stock is
generally older than that in those other towns. Out of all Manchester’s housing units, 37.4%
were constructed before 1950 and more than 25% were constructed before 1940 (see Map 1).
While this development pattern has resulted in unique, historic neighborhoods, it also presents
challenges. Older homes often require considerable work to modernize mechanical systems and
correct structural issues.
–9– Adopted: December 17, 2012
Effective: January 14, 2013Map 1: Residential Development by Year Built
– 10 – Adopted: December 17, 2012
Effective: January 14, 2013Over the past several decades the Town has focused public investment in older neighborhoods to
enhance existing conditions and improve the safety of the housing stock. While some of this
older stock has been well preserved, updated and cared for, many older structures have
deteriorated over time as repairs and updates become exceedingly expensive to owners. Because
most of this older housing stock is clustered in the East and West sides and the North End, poor
property conditions can have a negative effect on those neighborhoods.
The Town has focused infrastructure improvements in both the East and West sides, including
new streets, sidewalks, sewer lines and public water. Manchester’s Housing Rehabilitation
program, funded through Community Development Block Grant (CDBG) funds, has assisted low
and moderate income homeowners with emergency repairs, and work to remediate lead-based
paint and code violations. Another program, Rebuilding Together, assists income-qualified
households with repairs, roof replacements and landscaping. Volunteers perform the work and
the program is funded through donations and more recently, through CDBG. The program has
helped improve over 1,000 homes since 1992.
While these programs are valuable, the amount of funding limits the number of homes that can
be rehabilitated. Continued investment in the form of grants or loans is needed to significantly
improve this housing stock and stabilize Manchester’s older neighborhoods. Additional, private
and/or public investment in the activity nodes and corridors adjacent to these neighborhoods has
the potential to make these areas more desirable, potentially increasing owner investment in the
housing stock.
Affordability
Affordable housing is defined as housing for which costs do not exceed 30% of a household’s
income for households that earn 80% or less of the area median income. Compared to other
towns in the region, Manchester has successfully maintained affordable housing options for
individuals and families. According to a 2011 Partnership for Strong Communities study,
Manchester was one of 57 municipalities in Connecticut in which a family earning the median
income would qualify for the median priced home. The median single family home price in
Manchester has remained lower than in the region. The recent housing crisis and resulting
downturn in the residential housing market have resulted in falling home prices in both
Manchester and the region.
While purchasing a home in Manchester and the region has become more affordable, the
associated foreclosure crisis and the lessened ability and desire of households to own a home has
increased demand for rental housing. The increased demand coupled with a lag in housing
production has meant an increase in average rents, as indicated in the Planning Department’s
annual rental survey. According to the 2011 survey average rents for one bedroom apartments
have risen 12% over the past five years, while two-bedroom apartment rents rose 15%. The
vacancy rate in the 2011 survey was 3%, the lowest it has been in the past 10 years. Rising
rental costs and low vacancy rates illustrate Manchester’s continued desirability as a place to
live, but also indicate much of Manchester’s rental housing is not affordable to moderate income
households. Average Manchester rents in this survey are higher than the Department of Housing
and Urban Development’s Fair Market Rents (FMRs), which reflect what an apartment should
cost in a given regional market (see Appendix B).
– 11 – Adopted: December 17, 2012
Effective: January 14, 2013Community Facilities
Introduction
Manchester owns, operates, and maintains a wide range of facilities necessary to provide
services that both ensure residents’ health and safety and contribute to the Town’s quality of life.
These can be broken down broadly into public utilities and public services. Manchester has
consistently invested heavily in its utilities, buildings, and street infrastructure. Nonetheless,
given Manchester’s historic development pattern, changing population, and shifting resident
expectations the community is at a stage where it must determine whether to rehabilitate or
expand existing facilities, build new facilities, or abandon underused facilities and dispose of
surplus property. These decisions are important because the type, location, condition and
capacity of community facilities provide essential health and public safety and create settings for
entertainment, socialization, enrichment, and contribute to the community’s image and identity
not only for its own residents but for the larger region.
The Town owns and operates the great majority of Manchester’s community facilities, but there
are also partnership arrangements with service providers in which the Town owns properties
leased to non-profits. Private schools, state owned and operated facilities, facilities owned and
operated by the 8th Utilities District, and private or non-profit park and recreational facilities also
directly contribute to Manchester’s image and quality of life. For the purpose of the 2020 Plan
we will focus on those facilities owned and operated by Manchester, or those in which
Manchester is in a partnership arrangement with third parties. (For more detail on current
community facilities needs see Appendix C.)
Sustainability
The concept of sustainability has been around for at least 30 years, but recently the principles
and practices behind the concept have gained wider acceptance and broader constituencies. In
1987 the Brundtland Report established the working definition of sustainability as: “Meeting the
needs of the present generation without compromising the ability of future generations to meet
their needs.” Since then, the definition has been expanded to include ideas like creating
communities of lasting value; having cleaner water and better health in the future compared to
today; conserving resources by reducing our demands for energy and land; preserving natural
resources and features for both environmental and recreational quality of life reasons; creating
compact, mixed-use and vibrant places; spending less time in cars and more time walking,
bicycling or using public transit as a way to protect the environment, improve public health and
reduce fuel and other costs.
There is also more interest, not only among academics and advocates but in the marketplace for
energy efficient appliances, transportation, and buildings. “Green building” construction is
becoming more mainstream because green buildings cost less to operate, are more efficient, and
create healthier internal environments. “Green infrastructure” where storm water management is
integrated into public spaces like parks or streets to both protect the environment and reduce
long-term capital and maintenance costs, is becoming a more accepted practice as technology
becomes proven. “Green energy” from solar, wind, and geothermal technologies are being used
in office buildings, factories and single family homes.
– 12 – Adopted: December 17, 2012
Effective: January 14, 2013The smart growth movement advocates creating or restoring neighborhoods and developments
that emphasize compact building design, walkable neighborhoods, interconnected streets, a mix
of activities, a range of housing types and choices, and access to a variety of transportation
options. In both the municipal and regional context, the emphasis is on developing where
activity centers and infrastructure already exist and focusing on revitalizing, reusing, and
infilling developed areas as opposed to developing of vacant land farther from existing
infrastructure and services. The growing acceptance of and desire for sustainable developments,
compact neighborhoods, and connectivity is coincident with the needs and desires of the
population groups that will be driving the housing and employment market for the foreseeable
future.
Another aspect of the sustainability movement, indirectly related to physical development or
land conservation, is agricultural viability. For public health and economic reasons, local
agricultural viability is increasingly seen as an important tool. By preserving farmland and
ensuring it is actively farmed, a supply of fresh local food can be assured. Local farming
requires less energy by reducing the cost of production, transportation and refrigeration, and
preserves important agricultural lands by making them economically self-sufficient. The concept
of community gardens is also gaining acceptance and popularity. In both suburban and urban
settings vacant lots, underutilized lands and some public lands provide opportunities for
neighborhood residents or others to be stewards of local gardens. This has the benefit of
providing a local food supply, maintaining what might otherwise be vacant and unproductive
properties and providing educational and offering stewardship and leadership experiences and
opportunities for young people.
The Public Policy Response
It would seem obvious that transportation investments influence economic development, that
economic growth and housing supply are linked, and that land use regulations effect housing and
economic development location decisions. However, the practice has been for those agencies
responsible for each of these policy areas to focus on their own individual responsibility without
coordinating or collaborating with each other. Increasingly land use, transportation, housing,
environmental protection and economic development policies and investments are being linked.
There are movements at the federal and state executive branch levels to compel coordination of
policies and investments across agency lines. This integrated approach is vital to ensure the most
efficient and effective use of financial and infrastructure investment during a time when financial
resources in particular are limited. This plan and its implementation are intended to mirror this
holistic approach, recognizing the complexity and interconnectedness of these various land-use
issues.
– 13 – Adopted: December 17, 2012
Effective: January 14, 2013III. ASPIRATIONS, OPPORTUNITIES AND CHALLENGES
The previous analysis of the current environment and expected trends combined with the
comments, suggestions, and opinions of the participants in the 2020 workshops resulted in a set
of aspirations for Manchester, as well as identified trends/opportunities and challenges/threats
that we can expect to encounter as we work to realize those aspirations. How we move forward
in dealing with the opportunities and challenges, and in carrying out the recommendations in the
plan, should be measured against how those actions will help the community realize its
aspirations.
This diagram illustrates what participants in the 2020 process indicated they want Manchester to be in 2020. The
size of each word reflects how many times it was mentioned during the exercise.
Aspirations
There is a desire for Manchester to be a vibrant, thriving and energetic community. The
characteristics of such a community include a diverse population, a welcoming
atmosphere and destinations or activities that can be reached by transit/private auto and
on foot.
Creating community requires a physical arrangement and design of spaces that provide
for both programmed and spontaneous interaction. Businesses, shops, arts,
entertainment, food, parks, and plazas located in attractive and accessible settings are
important.
– 14 – Adopted: December 17, 2012
Effective: January 14, 2013 Equally important to creating community is the “soft” infrastructure of neighborhood
groups, clubs, and activities organized by government agencies, non-profits or social
networks.
Walkability involves more than just safe sidewalks and greenways. It also involves
attractive architecture and places to walk by and to including parks, shops, restaurants,
and work. Shops and restaurants, however, require a large enough market to support
them.
There is a desire for Manchester to have an intra-town transit system and more transit
options in general.
Opportunities
Two major demographic trends are the aging baby boomers and Gen Y. These make up
over 50% of the population and will be driving housing consumption and other markets.
Gen Y cohorts are more racially and ethnically diverse than boomers.
If Gen Y & Boomers are the major demographic sandwiching Gen X, Manchester needs to
seek out opportunities to invest in places and activities that appeal to each of these
populations.
Interest in food source protection and local foods is increasing, creating the foundation
for more effort in this area. Manchester should ensure its remaining farmland stays in
agricultural use.
There is growing interest in sustainable living, growth and development. This includes
cleaner and less costly energy; smaller, more cost efficient homes; development practices
that work with nature to protect water, air and land with low impact and low cost
construction technologies; and more compact and mixed-use development patterns.
Challenges
Can Manchester be a community that is attractive to younger working and child-
rearing/working families while serving an increasingly older population?
Can we preserve and rehabilitate our older neighborhoods yet accommodate infill and
redevelopment in these inherently walkable, mixed-use places? This will require
investment in infrastructure, community facilities and housing.
An aging population means people are less likely/willing/able to pay, but more likely to
demand quality services.
Manchester is land poor. If we preserve agricultural land, forest, open space, and
watersheds, Manchester needs to invest in infrastructure and community facilities to
incentivize revitalization, redevelopment, and reuse in previously developed or mostly
developed locations.
– 15 – Adopted: December 17, 2012
Effective: January 14, 2013 If transit patterns shift to high-speed and commuter rail in the Springfield – Hartford –
New Haven corridor, location preferences will shift in the region. Manchester must
strive to connect to this expanding public transportation system.
Manchester has a surplus of business and industrially zoned land and buildings on highly
visible and accessible locations that may not meet the needs of growing or emerging
businesses. Investment in the buildings and infrastructure within these business parks
will be required to keep them attractive to emerging businesses and companies that are
already here.
If we want more local businesses and convenience shopping to create walkable
neighborhoods, we will need to find ways to accommodate more residents in order to
provide the market to support those businesses.
Both intra- and inter-town transit require public subsidy, sufficient population, adequate
demand and desirable destinations. We will need to find ways to accommodate more
residents to provide the market to support transit investments.
– 16 – Adopted: December 17, 2012
Effective: January 14, 2013IV. GROWTH MANAGEMENT PRINCIPLES
Introduction
The State’s growth management principles were used as a way to think about and organize
discussions of current and desired future conditions in Manchester. Relying on the ideas of the
participants at the 2020 workshops and additional research by the staff, this section of the plan
will discuss the findings and potential opportunities for Manchester related to the growth
management principles. This section will also recommend specific actions to be pursued to carry
out the recommendations and meet the aspirations contained in the plan.
GMP 1: Conserve, Restore, and Protect of the Natural Environment, Farmland, and Assets
Critical to Public Health and Safety
Manchester has a considerable amount of land protected for and dedicated to providing reliable
and clean drinking water and offering a diverse range of recreational opportunities. The physical
condition and public perception of these spaces is directly related to the quality of life the
community enjoys and expects. During the 2020 Plan workshops, Manchester’s many assets
were identified and characterized according to their purpose and function. Most of these assets
are valuable for more than one reason. For example, protected forested watershed land ensures a
standard of public health, provides recreational opportunities, and maintains ecological diversity.
These numerous, complementary and overlapping functions make these resources especially
valuable to the community.
The concept of ‘green infrastructure’ draws the relationship between elements of the
environmental life-support system (i.e. soil, air, water) and man-made functions such as
recreation space and farmland that promote safe and healthy living spaces. Green infrastructure
in Manchester includes open spaces and natural resources, recreational and agricultural resources
and the connections between them. The Town should preserve and protect these assets and to
achieve the maximum benefit for each potential user.
The following sections briefly describe Manchester’s major environmental assets and the
characteristics of and challenges to each that may be faced over the next 10 years.
Recreational Assets
There are approximately 1,400 acres of recreational open space throughout Manchester. These
include traditional parks such as Center Springs Park, Charter Oak Park and Northwest Park
which incorporate a mix of natural features, play areas, sports facilities and gathering places.
Manchester’s parks each offer a unique range of activities for all seasons. In addition to the
abundant sports facilities for soccer, baseball, and basketball, other activities include ice skating
at Charter Oak Park, sledding at Center Springs Park, fishing at Saulters Pond and boating at
Northwest Park. Elementary schools add to neighborhood recreational amenities with ball fields,
playgrounds and open space.
Manchester’s linear parks continue to expand and provide connections between neighborhoods,
local attractions and a growing regional trail network. The Manchester section of the East Coast
Greenway (ECG) will soon be complete creating a nearly continuous off road, multi-use path
from East Hartford to the Bolton town line. This extension will eventually connect to Bolton
– 17 – Adopted: December 17, 2012
Effective: January 14, 2013Notch State Park and intersect with the Hop River State Park Trail, providing a loop back into
Manchester through the Manchester Business Park.
The Hockanum River Linear Park is a State designated greenway that continues to grow along
the river. The Hockanum River watershed includes portions of Ellington, Vernon, South
Windsor, Manchester and East Hartford, and is a major tributary to the Connecticut River which
empties into Long Island Sound. The water quality and physical characteristics of the watershed
have been negatively impacted by development, first by industrial factories that used the river
and its tributaries for energy production and waste disposal in the late 1800’s and later by more
modern, industrial and commercial development. Recently, the 77 square mile Hockanum River
watershed has been the focus of restoration efforts that recognize the impacts of the contributing
sub-watersheds.
Volunteer groups such as the Hockanum River Linear Park Committee and the Bigelow Brook
Greenway Committee have been diligent in their efforts to restore and improve the corridors
adjacent to these watercourses. These committees have successfully organized volunteer clean-
ups and trail maintenance events and secured recreation and habitat restoration grants from the
state. As a result of renewed attention to these resources, the use and visibility of the river
grows. The popularity of an annual Kayak and Canoe Race on the river continues to rise, trout
fishery has been improved and a growing number of residents and visitors hike along the trail
each year. The Bigelow Brook Greenway, part of the Broad Street Redevelopment Plan, would
connect the Hockanum River Linear Park to Center Springs Park and other recreational assets in
the center of town. Efforts to provide additional linkages to this and other parks are underway
thanks to the cooperation of many stakeholders.
Prominent forested areas including the Oak Grove Nature Center and the expansive Case
Mountain Recreation Area appeal to both naturalists and outdoor recreation enthusiasts.
Through the years Case Mountain has been a focus of the Manchester Conservation Commission
and various government and non-profit organizations. Popular as a hiking and mountain biking
site for Manchester and the surrounding region, the Case Mountain Recreation Area preserves a
forested area beneficial for its contribution to our water supply and wildlife habitat. The 52-acre
Oak Grove Nature Center is used by Lutz Children’s Museum for educational programs and is
valued for its accessibility and convenience in a neighborhood setting.
Manchester is also home to open space and recreation areas owned and managed by non-profit
and private entities such as the Manchester Land Conservation Trust (MLCT) and Wickham
Park Trust. The MLCT owns and maintains 122 acres of diverse landscapes in Town that are
generally in an undisturbed state. MLCT members and volunteers have adopted a stewardship
program that includes installation of walking paths and enhancements of scenic vistas as well as
monitoring and management of invasive plant species. Wickham Park, located on the town
border with East Hartford, contains over 250 acres of gardens, open space, and recreational
facilities and is recognized as one of New England’s finest private parks.
The Manchester Country Club, opened in 1917, is a Town-owned, privately managed 18-hole
public golf course. The course is located substantially within contributing public surface water
supply watershed. A tradition of stewardship and stakeholder collaboration have enabled the
golf course to be successful without having a detrimental impact on the Town’s drinking water
supply.
– 18 – Adopted: December 17, 2012
Effective: January 14, 2013Public Water Supply Resources
The Town of Manchester Water & Sewer Department manages 4,000 acres of publicly owned
water supply watershed land in Manchester. Approximately 65% of this land drains directly to
seven (7) surface water reservoirs and includes Class III Watershed land which does not directly
contribute to the surface water supply but provides an undeveloped buffer from surrounding
uses. Portions of the surface water supply watersheds that drain to these reservoirs extend into
parts of Glastonbury to the south, Vernon to the northeast and Bolton to the east.
This forested land is critical to a healthy watershed because it is itself non-polluting and absorbs
nutrients that can negatively impact the drinking water supply. Forest management is therefore
an integral function of the Manchester Water & Sewer Department and includes timber harvests
that generate income for the Town, provide viable, diverse wildlife habitat and control invasive
species. Some of this protected watershed land is also used by the public for hiking, bird
watching and similar outdoor activities.
Manchester’s public drinking water supply also includes significant groundwater resources. The
Town operates ten (10) active wells, which account for approximately 40% of Manchester’s total
water supply. These aquifers are for the most part underneath developed parts of the community.
Recently adopted aquifer protection regulations require handlers of hazardous materials located
in designated protection areas to manage their activities according to best practices and limit
future land uses that would pose a significant threat to this resource.
Farmland and Agriculture
The public is increasingly aware of the environmental impacts and security of our food supply
system. Research addressing the distance our food is transported from farm to plate brings to
light an inefficient system that generates excessive greenhouse gas emissions and heightens
health concerns related to the treatment and handling of food products. Additional variables
such as extreme weather events, the cost of energy (particularly oil) and the risks of mass-
contamination are leading consumers to explore more local options.
The benefits of locally produced foods are driving health and environment-conscious consumers
to seek alternatives to the industrial agriculture system whose products dominate grocery-store
shelves. The opportunity to interact with a farmer and understand the relationships between a
farmer’s practice and the impacts on ecological, social, and economic issues that add up to
sustainability is worth the investment for many.
According to the Connecticut Farm Bureau, agriculture remains a $600 million business
enterprise in Connecticut, providing 20,000 jobs. While the average size of Connecticut farms
fell from 87 to 82 acres between 1991 and 2008, the number of farms increased from 4,250 to
4,900. Farmers around the state are diversifying the activities conducted on farms, doing more
with less space, and creatively engaging a community customer base that seeks convenient
access to fresh, local products. These trends indicate opportunities for Manchester to embrace a
period of renewed interest in local agriculture and local food and promote the preservation and
active use of farmland.
The Town of Manchester uses State Public Act 490 (PA490), to help private property owners
keep their land in agricultural and conservation use by assessing the portions of the property
actively engaged in agricultural activities or kept as undisturbed conservation areas at its use-
– 19 – Adopted: December 17, 2012
Effective: January 14, 2013value rather than its potential market-value. Approximately 987 acres of forest and farmland is
given this preferential tax treatment in town. Of that total, roughly 330 acres are private, active
farmland and pasture distributed across an average size farm of just 12 acres. Activities in town,
concentrated mostly in the northeast and southwest quadrants, include Christmas tree farming,
the keeping of alpaca, chickens and goats, and the growing of fruits and vegetables made
available at farmers markets and roadside stands.
The Manchester Agriculture Preservation Association (MAPA), a subcommittee of the
Manchester Conservation Commission, has taken the lead role in the planning and
implementation of policies to promote agricultural viability. This includes advocacy and
preparation of changes to the regulatory landscape necessary to keep farming economically
viable. MAPA has been listening to the experiences, challenges and desires of those actively
engaged in agriculture and those concerned about the future of farming in town and envisions a
bright future for farmers and farming in Manchester.
Manchester has two seasonal farmers’ markets, one downtown and one at Manchester
Community College. There are also several smaller farm stands around town. Some local
products are available in limited supply at grocery stores, and the Central Connecticut
Cooperative Farmers Association has recently expanded their operation to include the sale of
local, seasonal produce. Some restaurants have begun to seek local products and highlight them
on their menus. Despite this progress, efforts must still be made to improve all of those
opportunities and to seek more. These connections to the consumer could help to reverse the
loss of farmland to development and may encourage the next generation of farmers to
competitively seek land and resources to expand agricultural activities in Manchester.
Beyond the desire for locally grown food, participants in the 2020 workshops expressed a desire
to encourage agriculture as a way to maintain the agricultural and rural character still found in
some areas of town, most notably the southwest corner. Ensuring existing farmlands stay in
active agricultural use would have the added benefit of ensuring these areas remain rural into the
future.
Urban Forest and Agriculture
Manchester’s residential neighborhoods differ in terms of design, architecture, street width and
lot size. Private yards and gardens comprise a majority of the open space in neighborhoods,
while most public space is associated with streets, municipal parks, Water Department land or
land around public schools or other community facilities. Together, these elements contribute to
the urban forest of street and park trees which is integral to the quality of life in each
neighborhood and the community.
Street trees are considered a highly desirable attribute of a healthy and attractive neighborhood.
In many older Manchester neighborhoods street trees are very mature and in some cases
unhealthy. When these trees are lost they often are not replaced. In the fall of 2011, hundreds of
trees on both public and private property were lost after a hurricane and a subsequent severe
snow storm and were not replaced. In many newer neighborhoods street trees are primarily on
private property and are not yet mature. There are still other neighborhoods which have fairly
extensive deciduous and evergreen tree canopies, including portions of the Bowers, Highland
Park and Verplanck neighborhoods.
– 20 – Adopted: December 17, 2012
Effective: January 14, 2013Restoration of trees and tree belts on streets, in parklets and along greenway corridors would
contribute to clean air and water in addition to making neighborhoods more attractive. Mature
street trees serve a number of purposes including traffic calming and pedestrian comfort and
safety. Their shade helps reduce intense summer heat, and their roots and canopy absorb large
amounts of stormwater. Recent studies have indicated planting street trees increases a
community’s property values. A commitment to the health, maturity and proper maintenance of
street trees and the urban forest is a critical component to the success of the concept of “complete
streets” explored later in this Plan.
Over the last decade the popularity of community gardening, in which individual residents care
for individual lots in a communal garden space, has also grown tremendously. Community
gardening is attractive for many reasons. These gardens bring people together, provide
ecological benefits, beautify neighborhood urban settings and offer health benefits to those who
participate. Market gardening, or selling one’s produce, also exposes even casual gardeners to
skills in marketing, business management, organizational development, agriculture, horticulture
and education.
Despite growing interest, community gardening in Manchester is limited. The Manchester
Senior Center has a flourishing garden. Manchester Community College has a community
garden that is open to anyone subject to available space at a nominal fee. The success of these
spaces indicates the potential and desirability for community gardens in other locations around
town.
MAPA and the Citizens for a Greener Manchester, a grass-roots non-profit organization,
continue to seek locations for community gardening opportunities. One opportunity for
community gardens is at the Manchester public schools. Waddell Elementary School has a
habitat garden and students have installed and propagated raised beds at Bennet Academy and
Martin Elementary School. Ground was broken at Verplanck Elementary School for a garden to
be shared by students and neighbors. Because they are located within residential neighborhoods
schools provide convenient access, good visibility, parking, and water. Properly programmed
community gardens can engage neighborhood residents in the maintenance of school grounds.
Additionally, gardens located at the schools would create abundant educational and service-
learning opportunities for children and their families.
– 21 – Adopted: December 17, 2012
Effective: January 14, 2013You can also read