KENT AND MEDWAY GROWTH AND INFRASTRUCTURE FRAMEWORK - 2018 UPDATE 2017 UPDATE KENT COUNTY COUNCIL
←
→
Page content transcription
If your browser does not render page correctly, please read the page content below

KENT AND MEDWAY
GROWTH AND
INFRASTRUCTURE
FRAMEWORK
KENT COUNTY COUNCIL

 2 0 1 8 U P D AT E

  2 0 1 7 U P D AT E

EXECUTIVE SUMMARY                                                                                                and population growth has far outpaced the delivery of the infrastructure required to sustain it. Combined
                                                                                                                 with unprecedented funding challenges, local services across the County have been brought to breaking
                                                                                                                 point. Nonetheless, the County remains critically important to national productivity and is strategically located
The link between infrastructure and growth is well known. Robust infrastructure can fundamen-                    as the main international gateway into the UK from Europe, being a key link to the investment being made
tally unlock the viability of development. Infrastructure frameworks such as the Kent and Med-                   in the Midlands Engine and Northern Powerhouse. The County holds important connections in relation to
way Growth and Infrastructure Framework (GIF) should be at the forefront in spatial planning                     London, as well as already having made crucial contributions to the Government’s housing agenda.
considerations, but freedoms and flexibilities need to be extended to allow for a tighter and
more collaborative response to barriers to infrastructure delivery.                                              The UK is the third worst country for congestion in Europe in terms of peak hours spent in congestion, with
                                                                                                                 the most traffic hotspots1. There was a 14.3% increase in the number of vehicles on major roads in Kent
PURPOSE OF THE GIF                                                                                               between 2006 and 20162. Additionally, there has been an increase of 42% in people using train stations in
                                                                                                                 Kent in the past ten years3. In 2016/2017, 1.8 million people used Ebbsfleet International Station, whilst the
There is value in having infrastructure and growth requirements considered over a wider geography to             passenger usage of Canterbury West has almost doubled in the last ten years.
provide a spatial perspective. The GIF has been prepared by Kent County Council (KCC) to provide a view
of emerging development and infrastructure requirements to support growth across Kent and Medway.                THE GROWTH CHALLENGE
KCC has worked closely with Medway Council, districts and boroughs, and key strategic partners in the
preparation of this framework.                                                                                   Kent and Medway’s growth aspiration up to 2031 is equivalent to building another town the
                                                                                                                 size of Faversham every year, for 20 years! Our ambition is high. In 2016/17, we delivered the
The GIF provides a strategic framework across the County, for identifying and prioritising investment            highest completion rate of all the shire areas in the country*. However, the scale of the challenge can-
across a range of infrastructure, for planned growth up to 2031. It draws together information and               not be underestimated - the pace of development remains behind an average requirement of 8,900
data from a range of sources, including district Local Plans, Infrastructure Delivery Plans (IDPs) and           homes per annum to 2031.
infrastructure and service providers. The framework is also fundamental in providing robust evidence
to attract investment and engagement, and in supporting the case for public funding bids and pack-
aging projects for major private sector investment.

Ultimately, the GIF will help to ensure that Kent residents enjoy a good quality of life through well-planned,
sustainable development that is supported by the right infrastructure and services. By planning strategically,
it enables Kent and Medway to respond to the growth pressures on the County’s housing and infrastructure
needs, while supporting growth pressures from London.

A COUNTY UNDER PRESSURE
Over recent years, Kent and Medway have delivered some of the highest rates of housing de-
livery in the country; however, the infrastructure has not kept up with the pace of growth. Growing
congestion on roads and in towns, overcrowded trains and ever longer waiting times to access health facili-
ties have meant a continued challenge to the quality of life for residents and businesses. For years, housing

2            KENT AND MEDWAY GROWTH AND INFRASTRUCTURE FRAMEWORK | 2018 UPDATE
1 http://inrix.com/press-releases/traffic-congestion-cost-uk-motorists-more-than-30-billion-in-2016/; 2 https://www.dft.gov.uk/traffic-counts/area.php?region=South+East&la=Kent; 3 Office of Rail and Road
*Shire Counties exclude all Unitary Authorities within each geographical county

                                                                                                                                                                                                              KENT COUNTY COUNCIL   3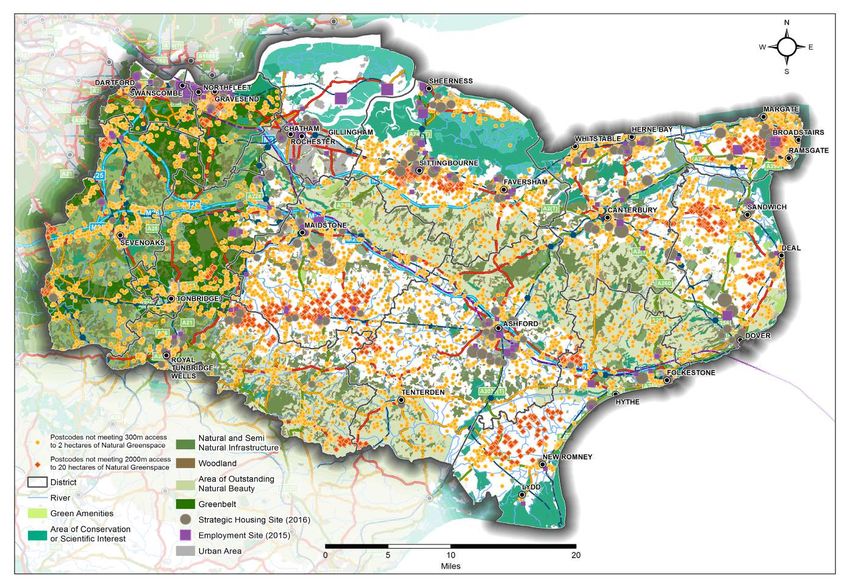
There are approximately 770,000 existing housing units across the County. To accommodate the forecast
increase in population, local authority housing forecasts indicate that some 178,600 housing units are
planned across Kent and Medway between 2011 and 2031. Between 2011/12 and 2016/17, a total of
30,537 houses were constructed across Kent and Medway.

Despite increases in housing delivery over recent years, there remains a significant challenge in delivering
at the planned rate of required growth. The pressures facing local authorities across Kent and Medway in
meeting current Objectively Assessed Needs (OAN) remains significant.

A key challenge facing the growth agenda is how to attract inward investment and employment
opportunities that enable the area to grow economically. There is a need for the local economy to
provide the right space in the right location, to encourage businesses to set up and grow. Evidence
indicates that suitable commercial space is in limited supply and with a Government agenda focused
on the housing crisis, the challenge of delivering suitable commercial space links back to viability
challenges.

                                                                                                               THE BURDEN OF RESPONSIBILITY

                                                                                                               The GIF identifies that 76% of the infrastructure required for growth will be funded. Only 5%
                                                                                                               of the total requirement has funding that is secured. The remaining funding is “expected”
                                                                                                               based on previous rates of attracting developer contributions and at which other infrastructure
                                                                                                               providers are able to invest in the relevant infrastructure – which means that even where we
                                                                                                               expect funding, there is a significant risk that such funding may not materialise to the amount or
                                                                                                               the timescale required. A total of 24% of the total infrastructure required is neither secured nor
                                                                                                               expected – leaving a funding gap of £3.96bn.

4             KENT AND MEDWAY GROWTH AND INFRASTRUCTURE FRAMEWORK | 2018 UPDATE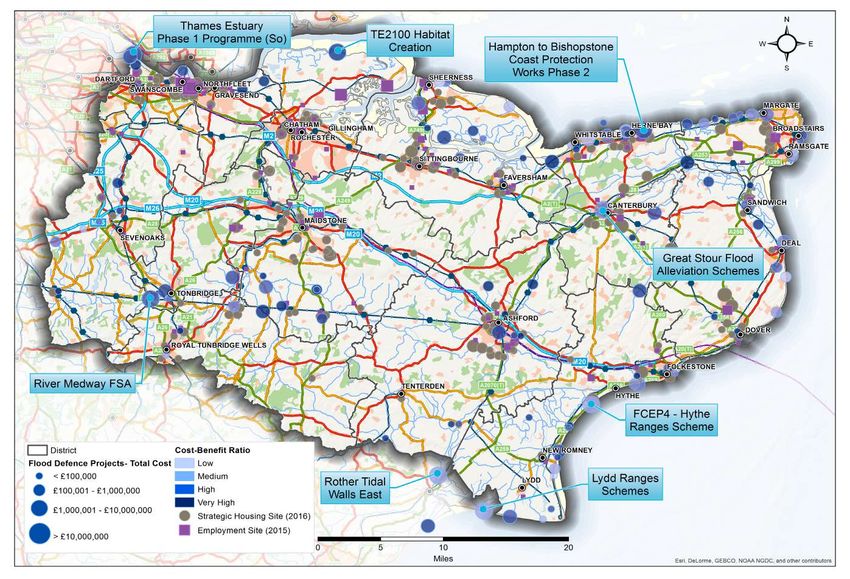
Based on the total infrastructure requirement, further analysis identifies the following breakdown       WHAT HAVE WE ACHIEVED?
for who is the principal body responsible for delivery*:
                                                                                                         Since the original publication of the Kent and Medway GIF in September 2015, the authorities
                                                                                                         and infrastructure providers across Kent and Medway have worked collaboratively to secure the
                                                                                                         following private and public investments:

                                                                                                          • Securing almost £120mn of Local Growth Funding from Central Government for transport
                                                                                                              schemes, including the new junction 10A scheme on the M20 at Ashford;

                                                                                                          • Securing £27mn of funding under LGF3 (2016) to deliver:
                                                                                                                  - Dartford Town Centre transformation;
                                                                                                                  - Ashford International Rail Connectivity (Ashford Spurs);
                                                                                                                  - Fort Halstead;
                                                                                                                  - A2500 Lower Road Improvement;
                                                                                                                  - Kent & Medway Engineering and Design Growth and Enterprise Hub;
                                                                                                                  - Leigh Flood Storage Area and East Peckham - unlocking growth;
                                                                                                                  - A2 Off-slip at Wincheap, Canterbury.
Based on total identified funding, further analysis identifies the following breakdown for infrastruc-
ture funding*:                                                                                            • A commitment from Government to deliver a new Lower Thames Crossing and identification of
                                                                                                              significant private sector interest in its financing;

                                                                                                          • Government support and funding of £155,000 for Otterpool Park Garden Town;

                                                                                                          • Since 2015, £121,449,009 has been secured through s106 contributions;

                                                                                                          • Delivered 15,068 new dwellings from 2015/16 to 2016/17 in Kent and Medway.

                                                                                                         **Private Sector/Developer Bodies:                      ***Public Sector:
                                                                                                          •   Highways contractors                                    •   DfE
                                                                                                          •   Bus companies                                           •   DfT and Highways England
                                                                                                          •   Rail franchises                                         •   National Rail
                                                                                                          •   Dover Harbour Board                                     •   NHS England
                                                                                                          •   Broadband providers                                     •   Local Government Capital Budgets
                                                                                                          •   Social care providers                                   •   Skills Funding Agency
*Estimated based on GIF project lists                                                                     •   Academy/Further Education groups and organ- •               South East LEP grants
                                                                                                              isations

                                                                                                                                                                                KENT COUNTY COUNCIL          5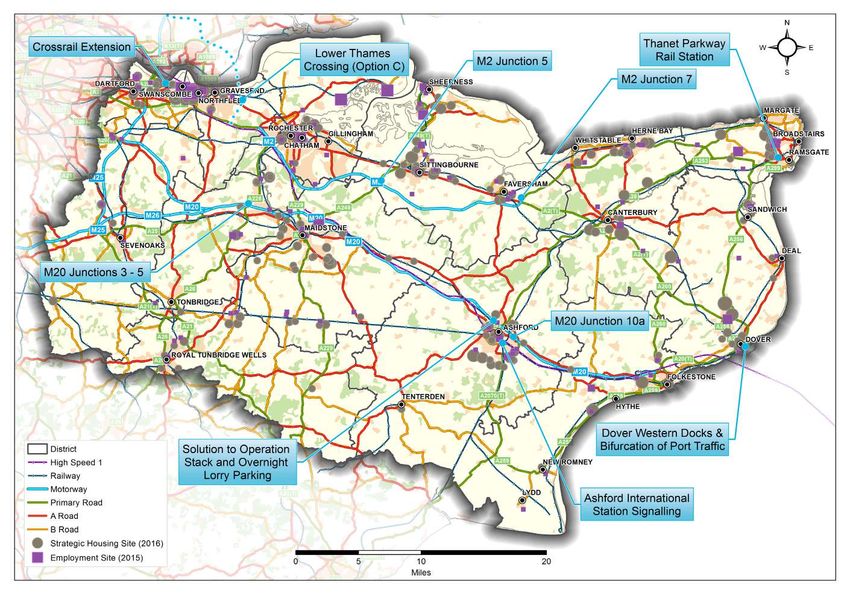
NEXT STEPS

                                                                                                           Tackling these challenges will require innovative thinking and proactive collaboration between local authori-
                      KEY MESSAGES TO GOVERNMENT                                                           ties, Government and industry. The Government is already reviewing its model for the Community Infrastruc-
                                                                                                           ture Levy (CIL) and exploring the issues leading to unimplemented planning permissions. In working with
• There is a need for more forward funding of strategic infrastructure by Government –                     the Government to further develop solutions, Kent and Medway has set out the following action plan:
    like the Housing Infrastructure Fund;
                                                                                                           1. Defining the investment gap: We will make clear the shortfall in capital investment identified for
• Government funding needs to be easier and less costly to access – local authorities cur-                 delivering planned, high-quality growth across Kent and Medway;
    rently spend hundreds of thousands of pounds on the preparation of business cases for every
    round of funding that is announced, often with different requirements, objectives and timescales;      2. Pioneering a “place-based” approach: We will pioneer an approach that sees greater co-or-
                                                                                                           dination of investment in homes, infrastructure and jobs to build quality communities, and new ways
• There should be a mechanism for enabling local authorities to bring forward sites                        of working with Government and its agencies across Kent and Medway. In this, we will work with the
    with unimplemented planning permission – in some cases, planning permissions are not                   local planning authorities to enable coherent new towns and settlements where infrastructure is avail-
    implemented for good reason, but where there is unnecessary delay in new development being             able to support, but recognise where infrastructure is insufficient to accommodate further growth;
    brought forward, local authorities should have the ability to intervene;
                                                                                                           3. Exploring innovation in financing the funding gap: We will explore new ways of closing the
• The Government should unlink infrastructure funding from specific growth proposals                       funding gap and ways of working with Government and other potential funders in addressing the
    – too often, strategic infrastructure goes under-funded, as the impact of that infrastructure is       shortfall in capital funding;
    shared by many development sites and existing settlements. It is therefore difficult to attribute
    entirely to specific settlements;                                                                      4. Commercial supply and demand: We will work with local partners to develop key actions to re-
                                                                                                           spond to the gaps identified between the supply and demand of commercial space, such as through
• The Government should establish greater power of direction over utility companies                        encouraging speculative commercial development or funding incentives;
    where practices are stalling development – utility companies across the board create some
    of the most costly and time-consuming barriers to development, with the risk and cost of new           5. Future-proofing Kent and Medway’s infrastructure: We will future-proof the infrastructure we
    utility provision often falling disproportionately on developers.The Housing Finance Institute (HFI)   deliver today to the greatest extent possible, building in resilience, innovation and flexibility;
    paper “How to build homes, fast” was partly informed by the GIF and highlights the importance
    of improving the timely provision of utilities. It also recommends the need for Infrastructure         6. Creating well-designed communities: We will work with local partners and the industry in ensur-
    Dependencies Mapping to understand the requirements for utilities within an area, and for direct       ing high-quality, innovative and inclusive design across the County;
    intervention to force improvement performance.
                                                                                                           7. Collaborating with infrastructure providers: We will work and liaise with the utilities companies,
                                                                                                           the health sector and other providers to ensure that their medium- to long-term planning aligns with
                                                                                                           Kent and Medway’s growth agenda;

                                                                                                           8. Creating an increasingly robust evidence base: For the GIF to continue to be a valuable tool
                                                                                                           in helping us understand the county-wide growth agenda and associated delivery challenges, we will
6          KENT AND MEDWAY GROWTH AND INFRASTRUCTURE FRAMEWORK | 2018 UPDATE                               continue to develop and evolve the Framework, working with partners.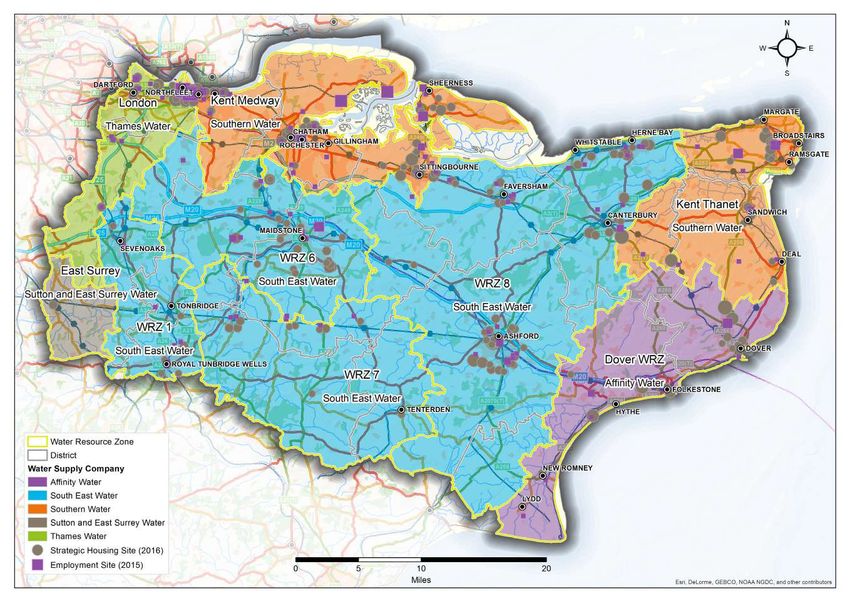
KENT AND MEDWAY SUMMARY
The Growth and Infrastructure Framework identifies the following headlines
for Kent and Medway to 2031:

178,600
Additional homes 2011-2031 (24% growth)

396,300
Additional people 2011-2031 (23% growth)

170,300
Additional jobs* 2011-2031 (21% growth)

TOTAL INFRASTRUCTURE REQUIREMENT 2017-
2031:

£16,376,314,000       **

TOTAL SECURED FUNDING: £820,174,000

TOTAL EXPECTED FUNDING: £11,599,146,000
TOTAL FUNDING GAP: £3,956,994,000
(£2 billion allocated to C2E extension)

% OF INFRASTRUCTURE FUNDED: 76%

* Residents in employment means jobs created will not necessarily be taken up within Kent and Medway
** Includes Lower Thames Crossing and C2E costs and funding
                                                                                                       KENT COUNTY COUNCIL   7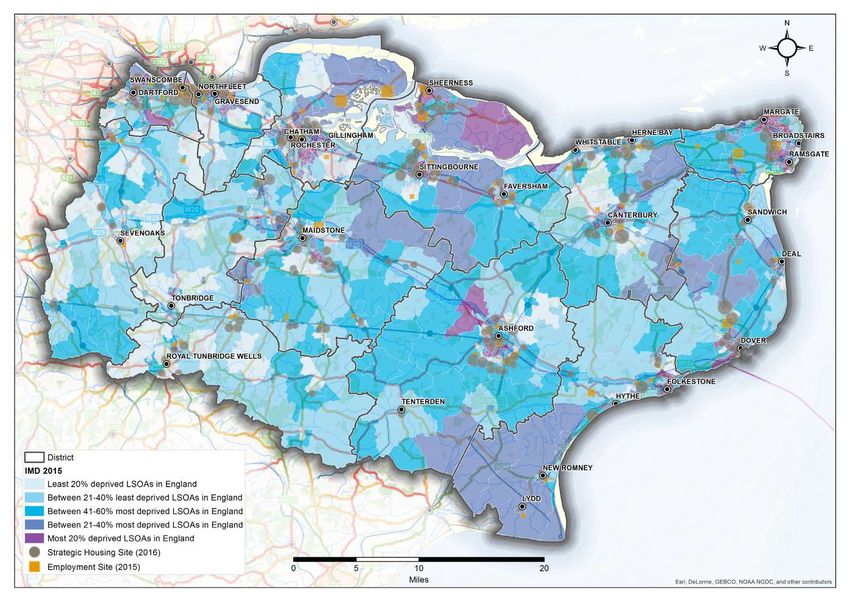
TRANSPORT: £9.96BN                                                                                     HEALTH & SOCIAL CARE: £2.76BN
Major projects include the Lower Thames Crossing and associated strategic road corridor through       Major projects include transformation of the health estate and implementing KCC’s Accommoda-
to the Channel ports, Crossrail extension to Ebbsfleet, a solution to Operation Stack and lorry       tion Strategy.
parking.            COSTS                                   FUNDING                                                     COSTS                                  FUNDING
                                                                                           Secured                                                                                        Secured

                                                                                           Expected                                                                                       Expected

                                                                                           Gap                                                                                            Gap

                EDUCATION: £1.18BN                                                                                     UTILITIES: £1.03BN

Major projects include providing sufficient education places caused by growth, especially in sec-     Major projects include sufficient county-wide energy and water provision.
ondary education.
                    COSTS                                   FUNDING                                                     COSTS                                  FUNDING
                                                                                           Secured                                                                                        Secured

                                                                                           Expected                                                                                       Expected

                                                                                           Gap                                                                                            Gap

                COMMUNITY & CULTURE: £0.40BN                                                                           NATURAL ENVIRONMENT: £1.04BN

Major projects include Tunbridge Wells Cultural Hub and county-wide sports and recreation             Major projects include the Thames Estuary flood risk management programme and flood risk and
provision.                                                                                            coastal erosion protection for the Romney Marshes.
                    COSTS                                   FUNDING                                                     COSTS                                  FUNDING
                                                                                           Secured                                                                                        Secured

                                                                                           Expected                                                                                       Expected

                                                                                           Gap                                                                                            Gap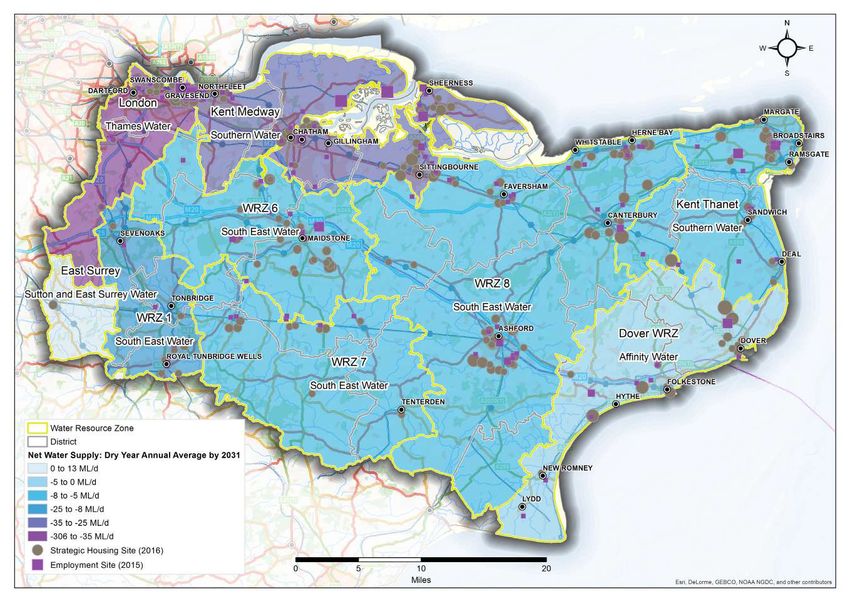
6

    CONTENTS
    1.   Introduction 				10

    2.   A Wider South East Context		          14

    3.   Kent and Medway in 2050 		            16

    4.   A Picture of Growth in Kent and Medway 23

    5.   Infrastructure: Meeting The Need      35
         5.1 Transport				36
         5.2 Education			39
         5.3 Health & Social Care		            43
         5.4 Community and Culture		           46
         5.5 Utilities 				49
         5.6 Natural Environment		             58

    6.   Renewal of Existing Infrastructure    62

    7.   Sub-County Overviews		                65

    8.   Ebbsfleet Garden City - Case Study    82

    9.   Addressing the Gap			                 84

    10. Next Steps				93

    11. Appendices				96

                                                     Ramsgate Beach, Visit Kent
1. INTRODUCTION     The Growth and Infrastructure Framework (GIF) has been prepared by Kent County Council
                    (KCC) to provide a view of emerging development and infrastructure requirements to support
                    growth across Kent and Medway. KCC has worked closely with Medway Council, districts and
                    boroughs, and key strategic partners in the preparation of this document.

                    The purpose of the framework is to highlight the opportunities and challenges to creating sustainable com-
                    munities in Kent and Medway that are balanced with employment growth alongside vital infrastructure. This
                    document provides an overview of the price of growth across the County, which in turn supports national
                    productivity. It aims to:
                     • Collate and summarise population and housing growth projections across Kent and Medway;
                     • Set out an understanding of capacity within current infrastructure provision and pipeline infrastructure
                          projects being taken forward by KCC, Medway Council and other infrastructure providers; and
                     • Highlight cumulative costs, gaps in infrastructure funding and funding streams.

                    Critically, the framework has not been developed in isolation. Consideration is given to external factors
                    affecting growth and infrastructure provision in Kent and Medway in relation to London and the wider South
                    East growth requirements.

                    The GIF has been produced for Government, infrastructure providers, district councils, parish councils, local
                    communities, Kent and Medway businesses and developers and other local partners. Looking forward, a dy-
                    namic online platform will be progressed, using the data that underpins the GIF to develop a platform that will
                    enable users to interact with relevant areas of interest.

                    1.1 SCOPE OF THE FRAMEWORK
                    The GIF includes a broad range of infrastructure required to turn housing and employment growth into
                    sustainable communities.

                    It therefore includes infrastructure provided by KCC, Medway Council and other providers. The GIF
                    draws together information and data from a range of sources, including district local plans and Infra-
                    structure Delivery Plans (IDPs). KCC, Medway (a unitary authority) and all local authorities within Kent
                    have been included within the assessment.

                    1.2 PLANNING FOR INFRASTRUCTURE
                    This document provides a co-ordinated understanding of growth and infrastructure across
                    Kent and Medway.
Dartford Crossing
Changes to Government legislation have modified how infrastruc- to be in place to provide strategic co-ordination of growth across
ture planning is undertaken and place greater emphasis on the link local authority boundaries or strategic infrastructure.
between local plans and the delivery of infrastructure.
1.3 INFRASTRUCTURE PROVIDERS
In Kent, it is the district councils and Medway Council who have KCC, Medway Council and the district councils play a vital role
responsibility for producing local plans, as Local Planning Authori- in the provision of infrastructure in Kent. A range of public and
ties (LPAs). KCC is a statutory consultee in the creation of these lo- private organisations have responsibility to provide infrastruc-
cal plans, as an infrastructure and service provider, but it does not ture to support the existing population and proposed growth.
have a statutory responsibility for plan making (with the exception
of Minerals and Waste planning). In practice the relationship between infrastructure require-
ments and providers in Kent and Medway is complex, as
The Government’s National Planning Policy Framework (NPPF) shown in the figure below.
2012 states that LPAs should work with other authorities and
providers to assess the quality and capacity of a range of infra-
structure types, their ability to meet forecast demands and take
account of the need for strategic infrastructure within the LPA area.
Local plan policies on infrastructure delivery and development
are required to operate together, in order to ensure viability and
deliverability in a timely fashion. Where possible, the NPPF also
recommends that Community Infrastructure Levy (CIL) charges
should be developed and assessed alongside the local plan.
Local planning authorities in Kent and Medway are at varying
stages in the preparation of local plans, some have been adopted
while others are in the process of being prepared. The majority
are supported by an IDP, which sets out the infrastructure required
to support growth and funding regimes. Neighbourhood plans
are also taken into consideration that enable local people to align
strategic needs with priorities for their local area.
The NPPF also sets out a duty to co-operate across boundaries;
ensuring local authorities engage with neighbouring authorities
and other organisations on strategic planning issues, in particular
infrastructure providers. However, an improved mechanism needs
KENT COUNTY COUNCIL 111.4 PARAMETERS OF THE FRAMEWORK Strategic Housing - Strategic housing sites are defined as those Costs from theoretical projects represent the services required
It is important to note that the GIF is a snapshot in time; the data used over 100 units and include both extant permissions and alloca- and not the cost of maintaining/supplying current service demand.
is the best available, and in some cases, theoretical costings and tions, using a list of strategic housing sites and numbers collated They are capital requirements and do not account for any reve-
assumptions have been used where exact data is not available. by KCC Business Intelligence (from 2016 HIA returns). nue-based services, i.e. they do not include costs for running or
staffing buildings and services.
POPULATION INFRASTRUCTURE
Theoretical costs are used as a proxy measure of cost for an
Population Forecast Project lists - Project lists are compiled from information received entire service and are completely separate to proposed projects.
The GIF makes use of the KCC housing-led population forecast from various sources, including KCC service leads, Medway and
that is produced annually, based on the latest demographic infor- district IDPs. THEORETICAL FUNDING
mation available from the ONS and driven by housing numbers
detailed in district and borough council local plans at a set point Costs - Total infrastructure costs are a combination of proposed Theoretical funding is based on percentages across three poten-
in time. project costs and theoretical costs. The total costs of actual pro- tial funding sources - public sector, private sector and developer
posed projects will always take priority over theoretical costs. contributions. The percentages may not cover the full cost, i.e.
The latest population forecasts are based on 2016 ONS may not add up to 100%. This allows for the assumption that there
Mid-Year Population Estimates (released August 2017) and FUNDING may not be sufficient funding available to meet requirements for
housing figures as at September 2017. certain services.
Secured funding - any named project that has a legal agree-
Migration - The migration data is sourced from the 2016 ONS Mid- ment or Government funding stream stating that funding will be Theoretical funding does not make up for shortfalls in any proposed
Year Population Estimates. provided, regardless of whether it has been received or not. project – if there is a shortfall, it is calculated as part of the overall
funding gap.
Demographics - Indices of Multiple Deprivation (IMD) information Expected funding - any public sector, private sector or developer
is sourced from the DCLG with the latest information available contribution funding that is expected, but where there is no legal
being IMD 2015. agreement in place stating that the funding will be provided. This
funding is estimated based on previous rates of attracting funding
HOUSING from a variety of sources (e.g. developer contributions, the NHS,
etc). All theoretical modelling outputs for funding are considered
Trajectories - Compiled by KCC Business Intelligence in Sep- as expected funding.
tember 2017, based on district/borough submissions (so may
not fully reflect emerging Local Plan figures). Housing may not be THEORETICAL COSTS
delivered to the scale/time frames stated, as it is market led.
Theoretical projects are used to forecast the overall infrastructure
Completions - Housing completions information is sourced from costs up to 2031.
the KCC Business Intelligence bulletin.
12 KENT AND MEDWAY GROWTH AND INFRASTRUCTURE FRAMEWORK | 2018 UPDATE1.5 COUNTY-WIDE APPROACH WITH
SUB-COUNTY BREAKDOWN
The approval of a successful local plan is reliant on
collaboration between a wide range of organisa-
tions and public bodies to determine the infra-
structure required to support growth. A number of
districts and boroughs prepare IDPs to identify the
infrastructure required to meet spatial objectives
and growth anticipated in the local plans – to en-
sure that the plan is realistic and deliverable. A range
of infrastructure schemes are provided by councils,
but many others are provided by other bodies –
both public and private – and will often extend
beyond physical district boundaries. Similarly,
physical constraints and socio-economic trends
that will influence growth and the provision of
infrastructure and services will often cover much
broader areas.
Therefore, alongside the Kent and Medway
analysis, the GIF also takes a sub-county
approach by giving an overview of the char-
acteristics, planned growth and infrastructure
required within each sub-county area. This
provides a new strategic layer to growth and
infrastructure challenges.
The County is shown by its three sub-county
groupings: North Kent, East Kent and West
Kent – as shown in Figure 1.1.
Figure 1.1: GIF sub-county areas for Kent and Medway
KENT COUNTY COUNCIL 132. A WIDER SOUTH Strategically, the County’s position as the main international gateway from the UK into Europe, and
EAST CONTEXT adjacent to London, inevitably means it plays a major role in the national economy. It also means
that the Kent and Medway economy is sensitive to external demographic, political and economic in-
fluences. This section identifies the external factors, parties influencing the County and opportunities
for collaboration that will affect the growth challenge in Kent and Medway.
Figure 2.1: Kent in the wider South East
2.1 LONDON
The impact of London’s growth on Kent and Medway will influence migration in and out of the County, as well as business relocation. These trends could lead to
growing pressures on areas that surround London, and a potential pressure to absorb some of the capital’s growth1. London is under intense pressure to address
the acceleration in housing need, which in turn could affect the supply of suitable office space2. The residual housing demand and the growing crisis in office and
employment space will necessarily put additional pressure onto economies across the wider South East - all of which are facing their own growth in demand.
Folkestone HarbourIt will be crucial to continue engaging proactively with the Greater Commission’s final report, which will lay out recommendations to (DfT). It also involves road and rail providers, such as Highways
London Authority (GLA) as the London Plan progresses to ensure Government, will be published in spring 2018. England and Network Rail, and other providers such as ports
that the County’s growth is supported by all the necessary infra- and airports.The major benefits of the partnership include:
structure and services. Kent and Medway are represented on the SEEC • Setting spending priorities to improve the transport net-
Wider South East Political Steering Group, which meets to initiate, SEEC has identified an infrastructure funding gap of £15.4bn work for all travellers and businesses;
steer and agree strategic collaboration activities across the wider over the next 15 years, holding back South East and national • Ensuring the South East economy remains a driver of
South East - covering common strategic planning and economic business success3. The South East’s changing fortunes are due national prosperity;
growth issues, alongside the preparation of the 2016 London Plan. to a growing gap in per capita public spending, including in areas • Directly influencing the decisions of national and regional
such as transport and enterprise investment4.. Kent and Medway infrastructure providers and operators.
Kent and Medway are also actively involved with, and represented are represented by SEEC and work with a number of partners in
by, South East England Council (SEEC) which looks to ensure that ensuring growth priorities are delivered across the South East. The creation of sub-national transport bodies, such as TfSE,
the South East has opportunities to influence London’s housing allows decisions on strategic transport investment to move from
and strategic infrastructure plans. SELEP national to area level. The Government’s Industrial Strategy
The South East Local Enterprise Partnership (SELEP) is tasked with and its devolution agenda also support the principle of allowing
2.2 WIDER CROSS-COUNTY PARTNERS supporting local growth and helping deliver a stronger economy that places to build on their strengths and remove obstacles to
covers East Sussex, Essex, Kent, Medway, Southend and Thurrock. further growth. TfSE intends to move to full operation, with Gov-
Thames Gateway Kent Partnership ernment backing, in 2020/21 and produce a transport strategy
The wider Thames Gateway/Estuary is a key regeneration area that SELEP is business-led and brings together the public and private for the South East.
stretches north of the Thames from Canary Wharf to Southend, sectors to drive local economic growth, build new homes and create
and south of the Thames from Deptford to the Medway and Swale, sustainable communities by delivering jobs and tackling skills and
Canterbury and Thanet. Regeneration of the Thames Gateway has training issues. KEY FACTS AND FIGURES
been underway since the 1990s, in which Thames Gateway Kent • In 2015/16, the South East delivered an additional 34,900 homes-
has an important role and vision to enable North Kent to prosper SELEP is currently refreshing its South East Strategic Economic the most across all regions in England.
and grow. Plan (SEP) to make sure it builds on progress to date, supports • Its economic output (GVA) is the second highest in England, at
local priorities, unlocks funding and is responsive to the changing £249 billion.
The Thames Gateway Kent Partnership (TGKP) champions macro-economic environment and national agenda. The SEP will • At 9.1 million (in 2017), it has the UK’s largest population.
sustainable economic growth across North Kent (aligning with the support forthcoming economic development strategies, infrastructure • It has an estimated £15.4 billion infrastructure investment gap
original geography of the Gateway) and seeks to create the best planning and housing policy, as well as improving overall productivity. (by 2030)5.
conditions possible to attract investment and deliver sustainable, • The current Further Alterations to London Plan (2015) sets a ten-
private sector-led economic growth across North Kent, promote Transport for the South East (TfSE) year housing target of 49,000 houses per year.
and enable collaboration to achieve growth and ensure that the In May 2017, leaders from across the South East launched a • The London Strategic Housing Market Assessment (SHMA)
Thames Gateway remains a key priority for Government. The partnership as a single voice with the ability to directly influence is indicating a housing target of 65,000 a year, with a need for
Thames Estuary 2050 Growth Commission, now chaired by Sir the area’s transport priorities. The partnership brings together 66,000 homes per year. The Greater London Authority will be
John Armitt, has announced its priorities, which include equipping the area’s sixteen transport authorities and five Local Enterprise looking beyond London to explore if there is potential to accom-
people with the right skills and providing high-quality housing. The Partnerships to work directly with the Department for Transport modate more growth in sustainable locations outside the capital.
1
London Office Policy Review 2017 - Greater London Authority; 2London Industrial Land Demand (June 2017) – GLA; 3South East England Councils’ response to Government’s Industrial Strategy Green Paper 2017; KENT COUNTY COUNCIL 15
4
SEEC, South East MP Briefing; Maximising Economic Potential, 2017 ; 5 http://www.secouncils.gov.uk/wp-content/uploads/2012/04/SEEC-Dashboard-SUMMARY-2-SIDES-SUMMER2017.pdf3. KENT AND In order to start to prepare for a longer time horizon, this refreshed version of
the GIF starts to examine the challenges and opportunities likely to face Kent
MEDWAY IN 2050
and Medway to 2050, by taking a scenario-based approach. This chapter will
provide a framework to ensure that Kent and Medway are in a strong position
to anticipate and plan for sustainable growth. The full 2050 report, written by
ARUP, can be read as a separate document.
3.1 POPULATION AND TRENDS
The scenarios set out in this chapter use predicted metrics in population, hous-
ing and jobs numbers expected in 2050. The expected increase in population
and growth in the demand for housing will intensify the infrastructure challeng-
es, if growth is delivered in the same way as today.
METRIC 2031 2050 2031-2050 INCREASE 2031-2050 INCREASE (%)
Population 2,127,000 2,347,000 220,000 10%
Households 922,000 1,061,000 139,000 15%
Jobs 976,000 1,075,000 99,000 10%
Figure 3.1: Long-term population forecast in Kent & Medway (KCC SBDI data)
16 KENT AND MEDWAY GROWTH AND INFRASTRUCTURE FRAMEWORK | 2018 UPDATEBeyond these certainties, there are a number of “critical un- Scenario D (page 21) is characterised by high economic growth and
certainties” – trends that could go one way or another, based moderate climate challenge impacts – of the four scenarios, it is the
on current information. It is these trends against which the one to aim for.
following scenarios have been developed.
3.3 FUNDING, FINANCING AND GOVERNANCE
‘Climate Challenges’ and ‘Economic Growth’ have been CONSIDERATIONS
chosen as critical uncertainties on which to base the scenarios. As well as creating demands for new types of infrastructure,
These factors are both highly uncertain and have the potential there is likely to be an appetite and need for different forms of
to be highly impactful or disruptive to 2050. Four scenarios have governance and for new models of funding and financing in-
been developed based on these uncertainties and each scenario frastructure. The table below sets out some of the funding and
Figure 3.2: Long-term population forecast by age (KCC SBDI data) explores potential impacts on the County’s infrastructure provi- finance implications of “high economic growth and moderate
sion, in order to inform the development of effective strategies and climate challenges” vs. “low economic growth and severe
2050 baseline for population, housing and employment responses. climate challenges”.
A predicted baseline expected in 2050 has been calculated
using KCC’s forecast for 2031 and employing the following
assumptions:
HIGH ECONOMIC GROWTH AND MODERATE LOW ECONOMIC GROWTH AND SEVERE CLI-
CLIMATE CHALLENGES MATE CHALLENGES
• Households will rise at a similar rate as population (taken
Greater economic autonomy - local authorities have
from the Kent 2050 population forecasts), with an ad- Shorter-term approach to investment
greater discretion over how much to invest
justment made for the average household size reducing
More borrowing from central government, more
(trends taken from DCLG 2014-based household projec- More investment in infrastructure from institutional
dependence on bidding for grants and more central
tions); investors
government control
Central government offers more local control for
• Employment will rise at a similar rate as population, with Increased competition between investments for cli-
creative and innovative funding and finance mecha-
no adjustment for changes in participation rates or the mate challenge adaptation and mitigation
nisms
balance of commuting (instead, adjustments are made in
Economic stability leading to a longer-term approach Local government rationalising estates and selling off
each of the scenarios).
to investment on behalf of local authorities assets
A higher proportion of foreign direct investment (FDI) Greater collaboration with other public bodies for
3.2 A SCENARIO APPROACH
from outside the EU shared services and co-investment
This chapter provides a basis for county-wide conversations
on how the area can ensure it is adaptable, resilient and con-
nected in planning for a sustainable future.
KENT COUNTY COUNCIL 17SCENARIO A – HOT HOUSE
This scenario is characterised by high economic growth and severe climate challenge impacts. Due to extreme levels of economic, environmental and political migration and the UK’s buoyant economy as a
pull factor, the County experiences a relatively high amount of immigration. There has been an increase in employment opportunities in London, as well as Kent and Medway, due to a strong local economy
fuelled by increased entrepreneurial activity. This has also increased commuting within and out of the area.
SCENARIO A - HOT HOUSE
High economic growth, severe climate challenge impacts
SOCIAL TECHNOLOGICAL ECONOMIC POLITICAL ENVIRONMENTAL
• Wealth gap reduced • AI embraced, creating • Buoyant commercial • Strong economy re- • Increased blue and
• Housing inequality high-value jobs in sector – increase in sults in stable political green infrastructure
(especially environ- technology industries jobs in knowledge situation provides accessible
mental resilience • Loss of jobs in freight intensive business • Equitable distribution environment for
measures) and logistics, due to services of resources and recreation and leisure,
• Increase in imported technology advances • Employment wealth remains an and as mitigation
goods + increased • Advanced, resilient prospects attracting important political measures against
agricultural regula- materials and new further skilled labour topic flooding, heatwaves
tion = Food price construction methods • New entry-level jobs and drought
increases required due to created post Brexit • Electric vehicles
climate challenge reduce air pollution
impacts
Resulting Infrastructure Requirements
HOUSING EMPLOYMENT TRANSPORT EDUCATION
HEALTH AND UTILITIES AND NATURAL
• High-quality new • New office space to SOCIAL CARE • Infrastructure to sup- • Upgrades to existing ENVIRONMENT
green towns and support the knowl- port ‘smart’ transport schools to ensure
• New technologies • Diverse sources of
villages and urban edge economy – modes and better they are able to meet
used in healthcare energy and low-car-
extensions, well ser- particularly smaller / choices – linking requirements of
and social care bon approach to
viced and with access flexible units suitable different modes of migrant populations
• This includes use of wider infrastructure
to amenities and jobs for small and growing transport and creating – both physical
mobile technology in • Increase in localised
businesses choices that favour and technological
order to improve the sources of energy
• Brexit-related em- sustainable deci- capacity
standard of care improves resilience
ployment floor space, sion-making
• Use of green and
close to ‘gateways’ • Transport links to
blue infrastructure
(e.g. Dover, Fol- other parts of the
• Waste infrastructure
kestone) country
provision localised
18 KENT AND MEDWAY GROWTH AND INFRASTRUCTURE FRAMEWORK | 2018 UPDATESCENARIO B – WITHERING GROWTH
Immigration has increased (briefly) – with associated pressure on the rental market, healthcare and schooling. Low economic growth has led to many falling below the poverty line and has in-
creased the wealth gap. Severe climate challenges are increasing in frequency, as are the magnitude of extreme weather events such as heatwaves, droughts and flash floods from surface water.
SCENARIO B - WITHERING GROWTH
Lower economic growth, severe climate challenge impacts
SOCIAL TECHNOLOGICAL ECONOMIC POLITICAL ENVIRONMENTAL
• Fewer jobs available • The reduced cost • Domestic tourism • Some climate • Vulnerability of some
• Longer commutes of domestic solar growth due to cost of challenge adaptation locations in the face
• Housing construction electricity generation foreign holidays policies are put into of increased extreme
increase in off-site and water heating • Emphasis on mul- effect, but the lack of weather and rising
and modular, to save solutions results in ti-functional, shared funding makes im- sea levels, coupled
costs mass roll-out infrastructure due to plementation largely with the increased
• Climate challenge reduction in funding ineffective cost of protection,
disproportionately • Greater coopera- • Tax increases has led to some
affecting coastal tion between local required to pay for ‘managed decline’
communities and less government and utility infrastructure require-
wealthy residents companies ments
Resulting Infrastructure Requirements
HOUSING TRANSPORT EDUCATION
HEALTH AND UTILITIES AND NATURAL
• Modular homes and SOCIAL CARE • Lower central funding • Increased use of ENVIRONMENT
off-site construction pushes authorities multi- functional com-
• Increased use of ‘top • Centralised energy
towards funding munity hubs
up’ services above storage infrastructure
mechanisms that tar- • Rationalised centres
and beyond more • Reliance on overseas
get users/beneficiaries of further education to
basic levels of care energy
of the infrastructure reduce costs – some
• Non-UK adopted • Strategic flood
• Rise of ‘pay as you go’ students are therefore
residents pay at defences with retreat
mobility services required to travel
market rate for their from areas where not
further
healthcare at the possible to protect
point of use • Focus on improve-
ments to green and
blue infrastructure
KENT COUNTY COUNCIL 19SCENARIO C – LYING FALLOW
This scenario is characterised by lower economic growth growth, and moderate (less severe) climate challenge impacts. Poor economic performance combined with technological advancement has led to
fewer jobs. There is also limited funding for infrastructure, creating further congestion and poor service provision. This hardship leads to social unrest, heated public opinion and heightened political activism.
SCENARIO C - LYING FALLOW
Lower economic growth, moderate climate challenge impacts
SOCIAL TECHNOLOGICAL ECONOMIC POLITICAL ENVIRONMENTAL
• Increase in pur- • Technological • Brexit has led to barri- • A greater emphasis is • Less focus on
pose-built homes and advancements focus ers to the streamlined put on the inter-rela- delivery of blue/green
facilities for incoming on making best use movement of people, tionship between busi- infrastructure
older people, serving of existing assets vehicles and goods nesses, universities • Moderate climate
the wider South East and infrastructure, • Rise in young profes- and politics – creating change allows for in-
• Increasing demand in particular use of sionals moving out of a ‘Local Enterprise crease in agro-forestry
for health and social existing airfields for London Partnership-plus’ • Careful agro-forestry-
care - boosted em- non-vertical take-off • Agricultural sector char- • LAs, central govern- management results
ployment technologies (e.g. acterised by lower levels ment and other coun- in increased habitats,
• New models of hous- passenger drones) of investment & more tries share resources improved soil struc-
ing emerge traditional technology and infrastructure and ture and increased
and inputs exploit synergies shading
Resulting Infrastructure Requirements
HOUSING TRANSPORT EDUCATION
HEALTH AND UTILITIES AND NATURAL
• Housing growth SOCIAL CARE • Limited improvements • Increased focus on ENVIRONMENT
through redevel- to highways network community-level
• New technologies • New generation of bio-
opment, infill and – ‘patches’ to alleviate and community-led
used to improve energy infrastructure
smaller extensions, congestion and infrastructure to
healthcare and social • Increased tree cover
including in the Green impacts of Brexit on reduce pressures on
care in order to reduce (through agro-forestry)
Belt movement strategic provision –
costs, in particular may reduce river flood
• New models of • Limited improvements including new wave
physical infrastructure risk in some locations
housing to meet to rail network, but of childminders (no
costs • Reduction in main-
specific requirements no new lines or major physical infrastructure
• Greater availability and tenance results in
of population upgrades required)
provision of elderly reduced quality of blue
care homes, both and green infrastruc-
state-run and private ture
20 KENT AND MEDWAY GROWTH AND INFRASTRUCTURE FRAMEWORK | 2018 UPDATESCENARIO D – FERTILE GROUND
This scenario is characterised by strong economic growth and only moderate climate challenge impacts – it is therefore the most desirable of the four scenarios. The County has capitalised on its identity
as the ‘Garden of England’, focusing on cultural identity, natural beauty and attractiveness as a tourist destination. Kent competes successfully for skills, investment and talent. The buoyant local economy
creates new revenue streams to fund infrastructure, while new technologies are embraced to create efficiencies in service provision and delivery.
SCENARIO D - FERTILE GROUND
High economic growth, moderate climate challenge impacts
SOCIAL TECHNOLOGICAL ECONOMIC POLITICAL ENVIRONMENTAL
• Town centres are • Shared autonomous • Strong economic • The strong economy • Kent and Medway
revitalised with more vehicles/autono- identity, through growth has allowed for new are leading Research
pedestrianistation, mous shuttles have in sectors including revenue streams to and Development in
greener infrastructure, been embraced professional services, fund infrastructure advanced precision
with shared autono- • Improved accessibil- advanced manufac- without risking viability agriculture, com-
mous transport ity of transport turing and precision of businesses etc., bining technology,
• Local businesses • New transport in- agriculture including road user organic principles
thrive, boosting em- vestment links Kent • Strong local economy pricing and local infra- and resilience against
ployment with other growth and improved connec- structure taxing environmental stress-
• Increase in remote areas in the South tivity to parts of the UK es and shocks
working and greater East and beyond
levels of commuting • Seen as strategic gate-
way to the continent
Resulting Infrastructure Requirements
HOUSING TRANSPORT EDUCATION
EMPLOYMENT UTILITIES AND NATURAL
• New housing via • Focus on walkability • Secondary schools ENVIRONMENT
• Buoyant local econ-
high-quality new – new paved routes form new relation-
omy coupled with • Agricultural sector
green towns and and spaces, including ships with univer-
proximity to Gatwick, growth leads to
urban extensions, retrofitting of existing sities, embedding
results in multiple increased demand for
redevelopment & infill infrastructure higher education and
sectors including water irrigation
• Housing well served • Increased rail capacity sharing facilities
professional services • Data centres and
by transport links, in into London – both • Growth in higher
and advanced manu- networks required to
particular rail travel through additional education – existing
facturing facilitate big data
• Additional housing to services/rolling stock university, new provid-
• Growth in office and • Traditional waste
counteract gentrifica- and upgrades ers, and ‘campuses’
industrial floorspace systems
tion – affordable and/ • Secondary hubs devel- for London-based
required • Less multi-functional
or safeguarded for oped, e.g Ashford and universities requiring
open space
local residents Ebbsfleet more space
KENT COUNTY COUNCIL 213.4 IMPLICATIONS AND NEXT STEPS Whilst emerging technology has the potential to radically
Whilst it is impossible to predict which of these scenarios is change the way that infrastructure is planned, delivered
most likely, it is clear that there are certain inevitabilities that and maintained, this needs to be considered within the
Kent and Medway need to start preparing for if they are to context of the County already being challenged in how to
deliver sustainable growth. provide the necessary infrastructure for current growth.
• The role and pace of technology in the delivery of Moving forward, partners will be using this scenario-based
new infrastructure will grow. In every scenario, the role framework to test the approach on infrastructure types and
of technology will either enable infrastructure providers developing a more consistent approach to future-proofing
to provide more competitive forms of infrastructure or infrastructure through a series of workstreams. These work-
deliver more cost-effective infrastructure. How authorities streams will feed into more detailed iterations of this analysis.
enable this growing pace of technology in the future is a
key challenge. The implication is that the County needs
to build horizon scanning for new technology into the
analysis phase, in the development of new infrastructure
projects.
KENT AND MEDWAY - PLANNING
• As a result of this increasing role of technology, the NOW FOR 2050
role of digital connectivity is vital. Whatever outcome
or scenario, the way in which information is gathered, ADAPTABLE to new technologies, a rise in electric vehi-
analysed and communicated will become increasingly cles, a growing and ageing population, climate risks, decar-
important to sustainable communities. bonisation and a growing energy demand;
• The critical necessity of a more sustainable solu- RESILIENT to changes in climate, economic uncertainty
tion to providing energy. With an imminent influx in (Brexit), population growth and increased financial pressure
the adoption of electric vehicles, there will be significant on services;
implications for the way in which energy is delivered
to support this new infrastructure. In addition, growth CONNECTED to growth in technology, AI and automation,
pressures, whether in a high- or low-growth scenario, will broadband demand, changes in work patterns and employment.
mean that pressures on the grid are exacerbated further.
There will be a need to strategically plan the way in which
electricity is generated and delivered.
• Whatever scenario materialises, the funding of in-
frastructure will continue to present real challenges.
22 KENT AND MEDWAY GROWTH AND INFRASTRUCTURE FRAMEWORK | 2018 UPDATE4. A PICTURE OF GROWTH IN This chapter provides the context for growth across Kent and Medway to 2031. It gives
an overview of the projected growth in population, employment and housing for Kent
KENT AND MEDWAY and Medway and explores the demographics and economics of that growth. In doing
so, it sets out key trends and projections that will affect the distribution of growth and
planning to support infrastructure to 2031.
In order to illustrate how Kent and Medway is changing in terms of population, demo-
graphics and housing growth, the figures in this section represent the period 2011-
2031, unless stated otherwise.
4.1 POPULATION FORECASTS
GIF POPULATION FORECAST
The GIF uses the KCC Housing Led Forecast, produced by KCC Strategic Business
Development & Intelligence, to establish a population forecast directly linked to (and
constrained by) the planned housing identified for this framework. As districts are at
various stages in the Local Plan process, housing trajectories can be volatile. The GIF
forecast takes housing trajectories at a set point in time (September 2017) provided
by Local Authorities to perform a consistent analysis of growth and need across the
County.
The GIF forecast shows a 2031 population of 2,127,600 – an increase of 396,300
from 2011, equivalent to 23% growth
Houses in Sevenoaks, Sevenoaks DC
Figure 4.1: Forecast population change 2011 to 2031 (Source: KCC GIF Forecast 2017)
KENT COUNTY COUNCIL 23Net international migration accounted for approximately The majority of people who move into Kent and Medway come
a third of this net flow into Kent and Medway, and con- from London. In 2016, this was 29,200 people. In contrast,
tinues a general trend of the last decade. Net migration 13,400 people moved to London, giving a net gain of 15,800
into Kent and Medway has increased across all popu- people from London into Kent and Medway.
lation age groups with the exception of 16-24 year olds.
Therefore, Kent is a net importer of migrants from Lon-
don and a net exporter to all other regions and countries
in the UK.
Figure 4.2: Forecast population change in five-year blocks (Source:
KCC Housing Led Forecast 2017)
4.2 MIGRATION
Migration is the main driver of population growth for Kent and
Medway. Between 2007 and 2016, net inward migration ac-
counted for 72% of total population growth during this period.
In 2016, there were a net 7,500 migrants into Kent and Med- Figure 4.4: International migration to and from Kent and Medway
way from other UK areas and 7,300 international migrants, 2006/07 - 2015/16 (Source: ONS August 2017) Figure 4.6: 2016 Migration flows to Kent and Medway from Lon-
resulting in a net inward flow of 14,800 into Kent and Medway. don (Source: ONS August 2017)
Figure 4.3: Causes of population change 2006/07 – 2015/16 (Source:
ONS August 2017) Figure 4.5: 2016 age breakdown of all migration to and from Kent
and Medway (Source: ONS August 2017) Figure 4.7: 2016 Migration flows to Kent and Medway from all
UK regions (Source: ONS August 2017)At a district level, all districts have experienced net inflows of Traditional assumptions on the working age population age
internal (within UK) migration from 2011 to 2016, with the ex- range will likely need to be revised as the population continues
ception of Tonbridge and Malling. The largest flows have been to get older. As an approximate measure of the working age
into Canterbury, Swale and Maidstone. population, those aged 20-64 will decline by 5% in their total
share of the population by 2031, whereas those aged 65+ will
increase their share by 6% of the population (Figure 4.11).
Figure 4.9: Forecast percentage population growth by 5-year age
band between 2011 and 2031 (Source: KCC Housing Led Forecast 2017)
Figure 4.11: Forecast differences in population by age group be-
Figure 4.8: Internal migration flows to districts and boroughs tween 2011 and 2031 (Source: KCC Housing Led Forecast 2017)
from 2011/12 to 2015/16 (Source: ONS August 2017)
4.4 DEPRIVATION
4.3 DEMOGRAPHIC HEADLINES Relative to the rest of England, quality of life is generally high
Similar to the rest of the UK, the population of Kent and across Kent and Medway.
Medway is ageing. Those aged 65 and above are forecast
to increase by 64%, and those aged 80+ are forecast to Yet there are clear pockets of deprivation in urban areas such
increase by 94%. as Chatham, Gillingham, Ashford, Folkestone and Dover as
well as peripheral coastal and estuarial areas, including the
An ageing population presents its own challenges and will Isle of Sheppey and parts of Thanet (Figure 4.12).
alter infrastructure demands in Kent and Medway. These chal-
lenges include changing requirements for house types to be There are variations in the causes of deprivation across Kent
more adaptable and the increasing need for better healthcare and Medway, ranging from a lack of access to healthcare and
and accessible infrastructure. skills training, to poor access to potential job markets.
Figure 4.10: Population pyramid showing forecast differences be-
tween 2011 and 2031 (Source: KCC Housing Led Forecast 2017)
KENT COUNTY COUNCIL 25Figure 4.12: Map showing Indices of Multiple Deprivation 2015 (Source: ONS 2016) 26 KENT AND MEDWAY GROWTH AND INFRASTRUCTURE FRAMEWORK | 2018 UPDATE
4.5 HOUSING DELIVERY
There are approximately 770,000 existing
housing units across the County. To accommo-
date the forecast increase in population, local
authority housing forecasts indicate that some
178,600 housing units are planned across Kent
and Medway between 2011 and 2031. Housing
forecasts used within the GIF have been
sourced from Kent and Medway’s districts
and boroughs as at September 2017. These
sources are summarised below. Forecasts are
adjusted to match the 2011-2031 period, where
required.

  DISTRICT                  SOURCE
    Ashford           Reg 19, 2011 - 2030
                   Adopted Local Plan 2011 -
  Canterbury
                            2031
   Dartford        Core Strategy 2006 - 2026

     Dover         Core Strategy 2006 - 2026

  Gravesham        Core Strategy 2011 - 2028
                   Main Mods, Reg 19, 2011 -
  Maidstone
                            2031
                  2014 Housing position state-
   Medway
                            ment
                   Issues and Options, 2015-
  Sevenoaks
                             2035
   Shepway         Core Strategy 2006 - 2031
                   Adopted Local Plan 2014-
     Swale
                            2031
    Thanet        Draft Local Plan, 2011 - 2031
Tonbridge and      Issues and Options, 2011-
    Malling                  2031
                                                  Figure 4.13: Kent and Medway growth context
   Tunbridge       Issues and Options, 2011-
     Wells                   2031

                                                           KENT COUNTY COUNCIL              27
You can also read