Land value capture Annexes - London.gov.uk
←
→
Page content transcription
If your browser does not render page correctly, please read the page content below

Land value capture Annexes
Contents

Annex 1 – Land value uplift and public transport projects: theory and evidence .............................. 3
Annex 2 – Historic examples of land value uplift and development of a value uplift model ........... 10
Annex 3 – Review of existing mechanisms to capture value uplift on existing stock and new
development ................................................................................................................................. 16
Annex 4 – Additional CPO reform proposals ................................................................................. 20
Annex 5 – Summary of TfL’s response to the Government’s consultation on further reform of the
compulsory purchase system ........................................................................................................ 25
Annex 6 – KPMG findings .............................................................................................................. 27
Annex 7 – Literature review ........................................................................................................... 32

                                                                                                                     Version 10.0 – 20 February2017

                                                                       2
Annex 1 – Land value uplift and public
transport projects: theory and evidence

1.       This annex summarises the theoretical and empirical insights from our review at Transport
for London (TfL) of the literature on land value uplift. Study references are to the bibliography in
the literature review.

Theory
The basic monocentric urban model

2.       To develop the theoretical foundations for this study, we begin with the simplest case of
the monocentric urban model. Consider a city with a central business district (CBD), where people
work for a uniform nominal wage. Each person commutes from identical properties located in
concentric rings around the centre (called ‘isochrones’). It takes the same time to the centre from
any property on a given circle. But as one moves radially outwards from one circle to the next, the
travel times go up and accessibility to the centre goes down uniformly (see figure 1).

                              Figure 1 – Monocentric urban model

                                                                   A
                                              CBD

3.       This monocentric model makes simple predictions about the pattern of land values in such
a city. Businesses as well as households will be in direct competition to locate within the central
business district; businesses because they can serve the largest possible market of consumers
from the centre, and households because living in the CBD minimises commuting times. Land
values will therefore be highest in the CBD, and will then decline along a gradient as one moves
outwards, as businesses drop out of competition for land, and households compete with each
other in trying to locate as close as possible to the CBD. In equilibrium, real wages are equalised
throughout as the reduction in land rents from moving outwards compensates for the increase in
commuting costs, and no one has an incentive to migrate at the margin.

                                                  3
Introducing a transport intervention

4.     What happens to land values if we introduce a public transport intervention1 into this
simple model? Imagine a transit link to point A on isochrone 2, which shifts all the properties
located around point A in isochrone 2 ‘inward’ to isochrone 1 by reducing journey times (see
figure 2).

5.     Transport economics theory tells us that all the transit users who are able to travel in from
point A will experience an increase in real wages driven by a reduction in journey times and
commuting costs (net of any fares charged). Now real wages are highest around point A, and
everyone else will compete to locate there. This will drive up the price of housing (and land rents)
around point A. If point A is a transit access point like a Tube station, then the theory suggests that
competition between house buyers will create a similar pattern of a gradient in land values around
point A as the gradient spreading out from the CBD, since accessibility to the CBD via point A will
now vary with walking times to point A.

6.      Beyond a reasonable walking distance (surveys of users in London suggests this is about
one kilometre), commuters may choose no longer to use the transit link and the uplift in values
should disappear altogether. This ‘walkability’ criterion should determine the project’s zone of
influence on land values.

            Figure 2 – Monocentric urban model – impact of transport intervention

                                                                             A
                                                    CBD

7.     What will be the new equilibrium? As house prices around A rise, land rents will increase in
concert. If the supply of land for new housing around point A is not completely inelastic, this
increase in rents should lead over time to new housing development as more land is offered for
residential uses.

1Most of the literature focuses on rail rather than road. One of the reasons for this may be that road projects do not
usually involve discontinuous access points around which effects might be concentrated through a localised increase in
demand for housing. The benefits of road projects tend to be dispersed over much larger geographical areas.

                                                          4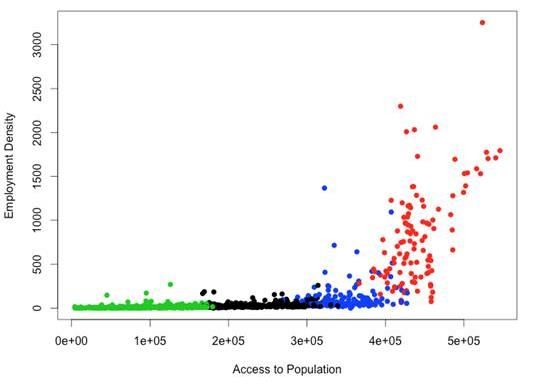
8.      A new equilibrium will be reached once the increase in house prices just cancels out the
real wage gains, and there is no further incentive to migrate from other locations to point A.2 At
this point, the transit project will have caused an increase in land values in a gradient around point
A that has (a) lifted the prices of existing stock; and (b) induced the development of new housing.
The increase in land values around point A (aggregated across existing and new housing stock)
should equal the aggregate user benefits (or the original real wage gains) from travelling into the
CBD from point A.

Predictions of the model

9.      The simple model described above makes some powerful predictions about the land value
uplifts of public transport projects: that they should scale with user benefits (in particular with
journey time improvements to the CBD); that the uplifts should fall in a gradient around transit
access points; that they should occur over time (following the availability of the new transport) as a
new equilibrium is reached in the housing market with greater local supply and higher house prices;
and that the extent to which the value of capitalised user benefits is distributed between existing
stock and new development depends on the local elasticity of land available for housing.

10.     This model makes no predictions about whether land speculators, developers or house
buyers are able to anticipate the land value uplift prior to project completion. However, some of
the empirical literature suggests that land values can indeed start rising straight after project
announcement, and continue rising through the construction period, in anticipation of the eventual
land value uplifts. There is no theoretical reason that this should always be the case.

Relaxing some of the model’s assumptions

11.     Consider next the effects of relaxing some of the assumptions in the basic monocentric
urban model. What happens if nominal wages are not uniform (for example, if different workers are
paid different wages based on skills and productivity)?

12.      It is easy to show that the effect of this will be that land rents will still decline away from
the centre, but the gradient will now depend not just on travel times but also on nominal wage
differentials. The condition for equilibrium remains the same: land rent gradients will equalise the
real wage everywhere so there is no net migration between locations. Similarly, if all locations are
not identical in terms of place quality (for example, local schools, green spaces, community
facilities), then land rents will differ both between isochrones, and along an isochrone.

13.     Land rents will be lower in locations with poor place quality, but now equilibrium requires
that real wage differentials between locations exactly compensate for place quality differentials.
The important point is that in all these cases – so long as existing earnings and place quality
differentials are unaffected by a change in commuting costs – once an initial equilibrium is reached,
the effect of a new public transport scheme should be identical: to create an island of higher real
wages compared to all other locations, which should cause the local demand for housing to rise,
and induce a land value uplift in the manner as described above.

2For simplicity, we have focused here only on journey time benefits. But the model will predict exactly the same
pattern of land value uplifts if users expect to derive other benefits from increased accessibility to the CBD via point A,
such as access to a greater number of jobs, or more productive jobs. If this drives up the expected real wage from
commuting via point A, it will drive up bids for housing around point A in the same way as above, until higher house
prices cancel out the expected increase in real wages.

                                                            5
14. What happens if wage and place quality differentials are affected by the change in
commuting costs? Although there is a sizeable literature on compensating wage differentials in the
labour market, most of the cases deal with compensation for the location of the job, rather than
the residence of the worker. For instance, many employers compensate workers for relocating their
role from one city to another to reflect differences in the cost of living (for example, by paying a
special allowance to relocate a worker from Manchester to London), or to compensate for the
unattractiveness of working in particular locations (for example, by paying a hardship allowance to
relocate someone from London to Kabul). These are not relevant for the monocentric model,
where all (or most of) the jobs are located in the centre, and there is no change in their location.
15. The more relevant case for our purposes is when employers agree to reimburse commuting
costs for employees (for example by paying for rail season tickets). Where such contracts are
common, it is possible that some part of the reduction in commuting costs from improved public
transport provision may be passed directly to the employer through reduced wages, and not get
capitalised into land values. However, employers in the UK do not generally compensate workers
for commuting costs. One reason for this is simply that it is inefficient in the UK – both the
employer and employee are taxed on the benefit.
Theoretical conditions for land value uplifts on residential property
16. Is it possible to specify the conditions under which a public transport project will produce
observable land value uplifts? There are three conditions that emerge from the theory:
The transport project produces significant local benefits that are valued highly by users
Access to these benefits depends on location, and the local demand for housing in those
locations rises as a result
The local supply of land is inelastic, so an increase in local demand for housing (even while
inducing some new supply) causes land rents to rise
17. One implication of the first condition is that land value uplifts can be important markers of
whether transport projects have in practice delivered benefits to users, and the scale of the uplifts
should reflect the value placed on those benefits by users. Poorly planned or executed projects
that fail to deliver the expected benefits should also fail to produce land value uplifts.
18. The second condition is more interesting. Land value uplifts arise because a real wage
differential around a transit access point (relative to other locations) induces an increase in demand
for housing in that location. There are two points worth noting here.
19. First, it is not obvious that the local demand should be a linear or continuous function of
the real wage differentials produced by public transport. As place quality declines, it is possible
that it takes larger and larger real wage differentials to encourage further inward migration from
other locations, so the movement from one equilibrium to another becomes slower and more
discontinuous.3 In such cases, improved accessibility to the centre can be a necessary condition for
land value uplifts, but not a sufficient condition. The transport improvement may need to be
accompanied by the delivery of other public goods to raise place quality before any significant land
value uplift effects are observed.
3 The analogy here is with how, in the absence of a catalyst, an activation energy barrier can prevent chemical reactions
from proceeding any further.
620. Second, the effect of local demand responsiveness on land rents may be heavily influenced
by broader conditions in the economy and the housing market. It may be the case for instance that
even though at the margin there is an increase in local demand for housing because of a transport
improvement, this is swamped by a broader reduction in demand for housing overall due to
recessionary conditions in the housing market. In such cases, one should still expect a gradient of
some sort around the transport hubs, but not necessarily an absolute uplift in land values. Such
positive uplifts may not become apparent until the property cycle has turned.
21. The third condition is fairly easy to satisfy in most urban contexts. The urban housing
market tends to be relatively inelastic, and there are usually strict limits imposed on new
development by city planners in light of the capacity of the transport network to deal with
incremental traffic. In the accompanying literature review, we have included a review of the
evidence on the extent to which housing supply responds to rising house prices in London.
Effects on commercial property
22. The monocentric urban model predicts that commercial property will mainly locate in the
CBD, from where it can access the greater pool of labour, as well as the largest number of potential
customers. Outside of the CBD, local businesses such as retail, supermarkets and restaurants will
mainly wish to locate quite close around the transport hub, from where they can easily attract local
customers as well as labour. This will create the familiar pattern of secondary town centres and
suburban high streets.
23. For such commercial properties, improvements in transport accessibility to the centre
should mainly reduce business travel (another class of direct user benefits), and the higher
profitability should be readily capitalised into the rateable values of commercial premises around
the station/transit hub. Unlike residential properties however, the zone of influence for commercial
properties should not depend on a ‘walkability’ criterion, but rather on the radius within which it is
profitable for local businesses to operate.
Agglomeration effects
24. The literature review notes that direct user benefits are only one class of benefits created
by transport projects. The other major class concerns wider economic benefits. The most
important of these effects in a city like London is agglomeration. Improvements in transport
connectivity increase a location’s access to economic mass (ATEM), a measure that weights a
location’s proximity to jobs by generalised travel costs.
25. Increases in a location’s ATEM generally reflect an increase in proximity or employment
density, which has been found to be associated with higher productivity and earnings due to
agglomeration effects. A transport link that connects the CBD to a new pool of labour should
increase the CBD’s ATEM through effects both on proximity as well as inducing more economic
activity to locate in and around the CBD. This can then raise productivity, wages and profits across
the CBD.
26. Increased profitability in the CBD should get capitalised in the rateable value of commercial
premises across the CBD, while higher wages should feed back into land values right across all the
catchment areas from which the CBD’s labour is drawn, including a feedback effect on the land
rents generated by the transport improvement along its line of route. An important inference that
emerges from this is that the zone of influence of a transport scheme that increases connectivity of
labour into the CBD spreads right across the CBD, while it is concentrated within a short radius
around transport hubs outside of the CBD.
7Transport and new development
27. It is often suggested that one of the main impacts of a transport investment is that it
unlocks land for development, and that this creates benefits over and above those captured by
conventionally measured user benefits. For instance, the Department for Transport’s (DfT’s)
guidance on assessing wider economic effects includes a method for calculating the benefits of
land-use change where it can be shown that a development would not take place in the absence of
the transport scheme due to the existing infrastructure being unable to supply a reasonable level of
service to existing or new users. The DfT’s guidance in turn notes that the analysis is likely to result
in a large estimated value for the benefits of such transport-dependent development, because the
surplus of value of land in, for example, residential use over land in agricultural use is typically large.
In fact, in England it is often an order of magnitude difference.
28. There is a reasonable debate in academia as to whether such benefits are net welfare gains
to society. The fact that a transport project unlocks new development does not necessarily result
in a net benefit to society. It depends on whether private and social values of new development
diverge. The transport project needs to correct for a market failure of some sort.
29. However, this is less relevant from the point of view of land value capture. The key point is
that if new development is unlocked on a piece of land by transport, because the improved
transport accessibility allows a change in use or higher density of development, this will have the
inevitable effect of significantly increasing the value of that piece of land over and above the simple
capitalisation of user benefits. In principle, some or all of this uplift can be captured to fund the
project that caused it.
30. Theory makes no strong predictions about the effects of transport schemes on new
development, beyond that it depends on the elasticity of local land supply and planning policies.
Placemaking
31. John Nellthorp (2016), in reviewing our Business Case Development Manual, has
summarised the various factors other than transport that govern land and property value uplifts.
Apart from transport accessibility, other locational factors such as the quality of the urban realm
(including public spaces) and the retail offer in the vicinity can have significant effects on land
values. He notes that as a result, we should not expect residential and commercial properties to be
affected in the same way by the same set of factors – for example, residential property prices will
be heavily influenced by the quality of schools and crime rates in the neighbourhood; retail values
are likely to be heavily influenced by footfall; and office rents are likely to be heavily driven by
proximity to other businesses through an agglomeration-like effect.
32. Other ‘place factors’ such as the pedestrian amenities, walkability and noise/environmental
quality have also been found to have significant effects on property values. All of these features
are incorporated in a conventional bid-rent model where land rent differentials reflect (in part) place
quality differentials. This work, however, is a reminder that if both transport as well as place factors
change together in a location, it can be challenging to isolate the effect of each independently.
Release of land and air rights
33. All the theoretical work on land value uplifts associated with transport projects
concentrates on accessibility improvements. However, it is possible for certain types of transport
schemes to lift land values not because of their transport benefits, but because they release land
for development. For instance, a flyunder scheme that releases land above for development, or a
8scheme to deck over depots to release air rights. There would be little capitalisation of user
benefits in such cases; instead most of the gain should flow from the value of land or air rights
released.
Empirical evidence from the literature review
Value uplift
34. The literature review sets out a detailed assessment of the empirical evidence, and how far
it supports the theoretical predictions from the monocentric urban model. Mohammed et al (2013)
have summarised the results of 26 studies, covering various types of rail transit interventions from
around the world. Most (20) of these studies focus on residential property price impacts, and 16
out of these find positive value uplifts, albeit with a wide range. The studies that have focused on
commercial or retail price impacts generally report much higher value uplifts than on residential,
and all but one find positive results.
Gradient
35. Many studies discuss the ‘zone of influence’ over which uplift effects decay. Different
studies report different distances over which this zone extends, with no real consensus. The two
case studies from London (Jubilee line extension, JLE, and the North London line) for instance
provide an indication that the zone may not extend much beyond 500 metres to one kilometre of a
Tube station. Some studies suggest the gradient is much steeper for commercial properties
compared with residential properties.
Timing
36. Some studies document a pattern where value uplifts are anticipated from the
announcement of the scheme and continue right through the construction period. This pattern was
also expected by a number of experts (BGVA and CBRE) in the case of Crossrail in London, but
Savills’ primary research for this study does not find any value uplifts anticipated during the
construction period.
Agglomeration
37. Research by Volterra (2014) documents the correlation between access to labour pools and
employment density, showing this is flat at low levels of accessibility and beyond a threshold level,
employment density suddenly starts rising sharply. Volterra reports a similar pattern is found
between employment density and earnings differentials, which are a reasonable proxy for Gross
Value Added (GVA). Finally, research by KPMG (2012) shows that there is a fairly linear relationship
between GVA and rateable values. A plausible explanation for this is that some part of productivity
growth is capitalised into higher rateable values in the CBD.
New development
38. There is surprisingly little in the empirical literature on the effects of transport on new
development. Research on the JLE found a 77 per cent increase in new consents, compared to 15
per cent for the reference case in inner east London. But no comparable assessment is available on
other schemes.
9Discussion paper – not a statement of policy
Annex 2 – Historic examples of land value
uplift and development of a value uplift
model
Land value uplift around historic London infrastructure projects
1. Savills extracted and analysed data from Land Registry on residential property transactions
in the zones of influence surrounding four historic London infrastructure projects: the Jubilee line
extension, the North London line change of franchise, the Docklands Light Railway (DLR) extension
to Woolwich, and Crossrail.
2. The literature review carried out by ourselves and further studies reviewed by Savills
suggested that the zone of influence surrounding each station was up to one kilometre, with value
uplift strongest in the 500 metres surrounding each station and decaying as distance from station
increases. Therefore, for each of these studies Savills considered residential transactions within
500 metres of the station (most strongly affected zone) and compared them to transactions
between one and two kilometres away (beyond the zone of influence). The difference in value
growth between these two areas gives the residential value uplift.4
3. For each historic project Savills considered growth in residential value from one year before
construction on the project started to five years after project completion. In the case of the JLE,
Savills considered growth from December 1995 until five years following the project’s completion
as Land Registry only records data from 1995 onwards. In the case of Crossrail, Savills considered
growth from one year before the project began to May 2016 (the latest available at the time), since
the project is not yet completed.
4. The results of this analysis showed that, on average, the areas around stations on the
Jubilee line extension, the North London line, and Woolwich Arsenal did experience an uplift in
values relative to the surrounding areas. However, it also showed that the areas surrounding
Crossrail stations had yet to show any land value uplift. The uplift in residential values around the
station on each of these projects is shown in Figure 3 below.
4 There may be some uplift effect just beyond one kilometre from a station if the increase in transport connectivity
brought about by the project is sufficiently large, however, we believe the area covered by the one to two kilometre
radius is large enough that this should not affect growth appreciably in that area. As additional checks, Savills has
benchmarked against value growth at a borough level and reviewed various forms of mix-adjusted growth.
10Figure 3 – Residential value uplift around historic case study projects
60%
Proportional value uplift in average
50%
residential values resulting from
transport improvement
40%
30%
20%
10%
0%
Jubilee line extension* DLR extension to Woolwich North London line
Source: Savills analysis for TfL; Land Registry
* Excludes stations with low sample sizes of property transactions
5. The data did not suggest there was any residential value uplift around stations on the North
London line or Crossrail prior to construction starting. Therefore when modelling value uplift on
future projects Savills has assumed there will be no residential value uplift before the project
begins.
6. The data also showed there was no residential value uplift around North London line
stations while the line was being improved. This suggests the magnitude of the infrastructure
project has some effect on the pattern of value uplift observed. This might vary from large
infrastructure projects where there is substantial investment in improving connectivity (for
example, the Jubilee line extension, Crossrail 2) to smaller scale projects where transport
connectivity is improved more incrementally (for example, the North London line, Camden Town
redevelopment).
7. The commercial property market consists of fewer, larger units than the residential property
market, therefore there were not enough transactions around each individual station to make a
similar transaction-based uplift analysis possible. Consequently Savills relied on the academic and
commercial research covered by the literature review to establish the commercial value uplift
around each project.
Categorisation of the case study stations
8. Breaking down the residential value uplift results by station, the analysis showed there was
significant variation in the land value uplift from station to station.
9. Savills split the stations from each case study into categories with similar growth
characteristics. There were four primary factors that appeared to affect the size of residential land
value uplift (if any):
Whether there was an adjacent high value residential area from which to draw emerging
affluent demand
11 The concentration of period housing stock around the station
The scale of change in the quality and nature of the area following the project
The scale of change in transport connectivity as a result of the project
10. Savills determined whether a station area was adjacent to existing high value areas by
mapping the site locations in geographic information system (GIS) software and viewing them
against average residential transaction values in the year the project was started. By visually
comparing average transaction values within one kilometre of the stations to the areas slightly
more than one kilometre from the stations, it was possible to identify which stations had a value
gradient, ie those that were adjacent to higher value housing areas, and those that did not have a
value gradient, ie those where values were higher than or very similar to any surrounding areas.
11. The concentration of period housing stock was measured using the ‘Dwellings by Property
Build Period and Type’ dataset published by the Valuation Office Agency in 2014 and available on
the London Datastore. A station area was identified as having period stock if more than half the
area within one kilometre of the station was predominantly composed of stock constructed prior
to 1930.
12. The presence of an adjacent high value area and the concentration of period housing stock
together formed the basis for identifying the potential for an area to experience land value uplift. In
Savills’ experience, areas with a large amount of period housing and that lie adjacent to a higher
value housing market tend to have greater potential for value uplift than areas where values are
already the highest in the local area and with limited period housing. In cases where an area had
one of these attributes but not the other, an individual judgement was made to reflect the size of
the value gradient and the actual concentration of period housing stock.
13. The change in the quality and nature of the area surrounding each of the case study stations
was estimated with reference to the literature review carried out by ourselves and the experience
of Savills’ real estate professionals working in those areas at the time of those projects. In the case
of Crossrail stations, this assessment includes any planned regeneration and development that is
expected to occur as a result of the new line.
14. The change in connectivity of a station was determined by comparing the estimated travel
time from that location to London’s Central Activities Zone (CAZ) before and after the
infrastructure project and through discussion and agreement with ourselves. It also took some
account of increases in transport capacity by considering whether each station was new, as was the
case for Canning Town, or an improvement to an existing station, as was the case for London
Bridge, both on the Jubilee line extension.
15. The change in quality of place and connectivity together formed the basis for identifying the
amount of change in an area expected to experience uplift. Areas with extensive regeneration and
development and large increases in connectivity should experience greater uplift than areas where
there is limited change in quality of place and the transport connectivity does not change
substantially. In cases where an area had one of these attributes but not the other an individual
judgement was made to reflect the actual change in travel time and development surrounding the
station.
16. Combining these two binary factors creates four categories with potential for increases in
land value (due to the nature of current stock and place quality of the area) and the change in
transport accessibility resulting from the transport scheme:
12 High potential and high change (which we would expect to have the highest land value uplift)
High potential and low change
Low potential and high change
Low potential and low change (which we would expect to have the lowest land value uplift)
17. The average value uplifts around the stations that fall within each of these categories were
used to inform the modelling of residential land value uplift around future projects.
18. Stations were categorised in a similar way to estimate the extent of commercial land value
uplift. The potential for uplift in commercial property values was estimated by looking at the
existence of any high value office or retail areas and the presence of an interchange at the station.
The change categorisation of stations was determined in a similar way as to residential value uplift.
19. Stations were considered to be adjacent to high value commercial property markets if such
a high value market lay adjacent to the area surrounding the station. In particular, this categorisation
considered proximity to the City, West End, and Canary Wharf business areas.
20. The presence of an interchange at a station was considered to be an important factor for
the potential for commercial property value uplift because footfall would typically be expected to
be higher around such stations. This categorisation considered stations with London Underground
and/or London Overground interchanges but not those that had interchanges with National Rail
services or associated bus stations.
21. Savills estimated the commercial land value uplift around each category of station with
reference to existing academic and commercial analysis, adjusted to reflect the distribution of
residential land value uplift observed around each category of station. For example, stations with
high potential for commercial value uplift and high change were forecast to experience the top end
of the potential uplift range reported in the literature. The value uplift estimates applied in the
residential and commercial property modelling are shown in tTable 1 and Table 2 below – project
growth is additional to no project (underlying) growth rates.
Table 1 – Residential land value uplift estimates
Real growth rate pa
During Post
Pre-construction construction construction
Project Zone
High potential, high change 1.00% 1.00% 1.00%
No project High potential, low change 1.00% 1.00% 1.00%
(underlying) Low potential, high change 0.50% 0.50% 0.50%
Low potential, low change 0.50% 0.50% 0.50%
High impact High potential, high change 0.00% 10.00% 6.50%
uplift additional High potential, low change 0.00% 2.50% 2.50%
to no project Low potential, high change 0.00% 0.00% 0.50%
growth Low potential, low change 0.00% 0.00% 0.00%
Low impact High potential, high change 0.00% 0.00% 2.50%
uplift additional High potential, low change 0.00% 0.00% 2.50%
to no project Low potential, high change 0.00% 0.00% 0.50%
growth Low potential, low change 0.00% 0.00% 0.00%
Source: Savills analysis for TfL
13Table 2 – Commercial land value uplift
estimates Real growth rate p.a.
During Post
Pre-construction construction construction
Project Zone
High potential, high change 1.00% 1.00% 1.00%
No project High potential, low change 1.00% 1.00% 1.00%
(underlying) Low potential, high change 0.50% 0.50% 0.50%
Low potential, low change 0.50% 0.50% 0.50%
High potential, high change 2.00% 2.50% 3.00%
High impact uplift
High potential, low change 1.00% 2.00% 1.00%
additional to no
project growth Low potential, high change 0.00% 1.50% 0.50%
Low potential, low change 0.00% 0.00% 0.00%
High potential, high change 0.00% 0.00% 1.50%
Low impact uplift
High potential, low change 0.00% 0.00% 1.00%
additional to no
project growth Low potential, high change 0.00% 0.00% 0.50%
Low potential, low change 0.00% 0.00% 0.00%
Source: Savills analysis for TfL
Applying the land value uplift categories to potential future
stations
22. Each station and development area on the eight potential TfL projects was assigned one of
four categories using the same method as for the case study stations.
23. The total impact of each project was estimated, within a scale from:
Large infrastructure projects Smaller infrastructure projects Projects with no improvement
with substantial changes in with limited changes in in connectivity, where no uplift
connectivity and quality of connectivity and quality of in value growth was forecast
place, which followed the uplift place, to which were applied an (for example, Poplar decking,
estimates derived from the uplift estimate between those A13 tunnel). All potential land
Jubilee line extension derived from the Jubilee line value uplift for this kind of site
extension and the North is assumed to be due to the
London line development of new stock
24. Savills then applied these land value uplift estimates to each station to give a forecast
percentage value uplift year-by-year.
Estimating the total uplift in land values
25. To estimate the total uplift in land values around each station, it was necessary to
determine the current value of property in each station area.
26. For residential property, Savills estimated the total number of private households within
one kilometre of each station by taking the number of private households (ie owner occupied,
shared ownership and privately rented) in Output Areas in that radius at the time of the 2011
Census, then inflating that number using the relevant borough-level 2014 household projections.5
5This is likely to represent a slight overestimate of growth, however, the household projections are assumed to have
been correct when they were carried out in 2014 and so there should only be two years of divergence.
14This number of households was multiplied by the average residential transaction value within each
station radius in the 12 months to May 2016 to give an estimated total private residential property
value.
27. For commercial property, Savills estimated the total rateable area within one kilometre of
each station by filtering the Valuation Office Agency 2010 rating lists to show just properties with
registered postcodes within that radius and summing the areas of all those hereditaments. The
total rateable value within these areas was divided by an estimated yield, taken from the
Investment Property Databank (IPD),6 to give the total estimated investment value for commercial
property within each station radius as at the 2010 valuation date. These values were then inflated
to 2016 values by applying the background growth rates used in the commercial property model.
28. Savills modelled the value of existing property using background value growth and new
development that would have occurred without the project to give a ‘no project’ value. Savills then
subtracted this from the value of existing property accounting for value uplift due to the projects,
new development that would have occurred without the project, and new development that was
catalysed by the project (the ‘with project’ value) to give the total value uplift.
29. The new development that would have occurred without the project was either taken from
existing work carried out for us on the projects or modelled using borough-level household
projections.
30. The new development that will be catalysed by the projects was taken from existing work
carried out for us on the projects.
31. The total amount of value uplift for residential and commercial land around each station
was then used as the input for KPMG’s modelling of land value capture mechanisms.
6 The IPD yields are likely to reflect a higher grade of stock than is typical across all of London because it covers
investment-grade property rather than all properties. Given that the land value attributable to commercial property is
somewhat smaller than the proportion attributable to residential property, we believe this approximation is acceptable.
15Annex 3 – Review of existing mechanisms to
capture value uplift on existing stock and
new development
Few instruments respond to value uplift on existing stock
32. There are four property taxes that impact existing stock:
Council Tax
Business rates
Stamp Duty Land Tax (SDLT)
Capital Gains Tax (CGT)
Council Tax
33. The Council Tax is levied on households, based on the estimated value of a property in
1991. It is an annual tax and represents a stable and predictable revenue source for the local
authorities who use it to pay for council services. It is not specifically used for funding transport
investment. A limitation of the current Council Tax system, which makes it ineffective for the
purposes of land value capture, is that it does not respond to changes in property values, as the tax
bandings have not been revalued since the introduction of the tax in 1991. Increases in Council Tax
are currently limited to two per cent per annum without triggering a local referendum. The total tax
take is therefore a fraction of the current property value and does not target any uplift related to
transport investment. According to London Councils, in 2015/16, £3.5bn in Council Tax (including
the Greater London Authority, GLA, precept) was collected in London.7
Business rates
34. Business rates are charged on most commercial properties and are a product of the
property’s rateable value (essentially the annual rent paid on the property) and a multiplier, set by
the central Government and expressed as ‘pence in pound of rateable value’. It is a counterpart to
Council Tax on residential property and is paid by businesses annually, in theory making it a stable
revenue source for local authorities, once the tax is fully devolved. Rateable values of commercial
properties are revised every five years to reflect changes in rental values. However, any increase in
average rateable values across the country are ‘neutralised’ by reducing the multiplier. Further, a
system of tariffs and top-ups ensures that individual local authorities only receive rates receipts to
reflect their spending needs. The end result is a limited link to value and limited potential of
capturing land value uplifts resulting from transport investment. Business rates are forecast to
generate approximately £6.9bn in London in 2016/17.
7London Councils, http://www.londoncouncils.gov.uk/our-key-themes/local-government-finance/local-taxation-
council-tax-and-business-rates/council-tax
1635. There are two exceptions to revaluation neutralisation; both sit outside of the core rates
retention system. The first is Business Rates Supplement (BRS), and the second is Enterprise Zones
(EZs).
36. Business Rates Supplement, introduced in London in 2010 to raise funding for the Crossrail
project, is a subset of the business rates system. BRS is set at two pence in every pound of
rateable value and is paid by all businesses in London with rateable value above £55,000. It is an
example of a method by which commercial property value growth can be taxed and retained in an
area where growth has occurred. Given that the multiplier is fixed at two pence, redistribution of
rates revenue that occurs under the main business rates system does not occur under BRS.
37. Enterprise Zones are a device through which the growth in business rates revenue above a
baseline can be retained locally, with a view to paying for the infrastructure that has created that
growth.
Stamp Duty Land Tax (SDLT)
38. SDLT is a transaction tax paid on the purchase of land or property above a certain price. It is
set as a percentage of the property value that increases up to a maximum of 12 per cent on
properties priced above £1.5m. The tax responds fully to changes in land value given that the tax is
set as a percentage of property price. Although there is a clear link to value on sale, SDLT does not
target rental properties. SDLT follows the property market cycles so can be volatile. For example,
in 2008/09 SDLT receipts in London fell by 54 per cent (to £1.24bn) in comparison to the previous
year as a result of the economic downturn. The receipts did increase quickly subsequent to this fall
and reached £4.28bn in 2014/15.8
Capital Gains Tax (CGT)
39. CGT is targeted at individual taxpayers and is levied on the profit from the sale of property
or an investment. It is a good example of a tax that specifically targets the uplift in property’s value.
However, it does not differentiate between the uplift that results from the background price
growth, from any other form of place improvement and from the transport-specific investment. It
is collected at transaction and therefore targets value uplift at the point at which it is realised. The
tax is calculated as a percentage of the gain realised and is therefore proportionate to the size of
the gain. While a link to value is clearly present, the current Capital Gains Tax regime exempts gains
made on the sale of primary residences and does not target rental income. This significantly limits
the ability to use the tax for the purposes of capturing value uplift from within a zone of influence
of transport investment, given that a significant number of residential dwellings are likely to be
primary residences or tenant-occupied. Similarly to SDLT, CGT could be volatile as it is transaction-
based. According to HM Revenue & Customs (HMRC) statistics, CGT receipts in London in 2013/14
amounted to £1.3bn, although the element of this that relates to land and property is estimated to
be of the order of £400m.9
40. In summary, no single tax on existing property is currently designed to capture significant
value uplift resulting from transport investment. Council Tax and business rates have a limited link
to value but present a stable revenue stream. Although link to value is much clearer on SDLT and
CGT, receipts from these taxes are volatile.
8 HMRC, https://www.gov.uk/government/statistics/uk-stamp-tax-statistics
9 HMRC, https://www.gov.uk/government/collections/capital-gains-tax-statistics
17Value capture on new development enabled by transport
investment
41. Transport authorities can capture value on new development either directly through land
acquisition and self-development; or indirectly through taxation or negotiated developer
contribution.
Direct development
42. Transport authorities can carry out over-station development (OSD), which is a way of
capturing value uplift resulting from new transport provision. They are restricted to either
undertaking development within the station footprint on land that would have been compulsorily
acquired for the transport purposes or acquiring land on the open market, at the prevalent market
price, and developing it.
43. The impact on land values around new transport investment, however, extends beyond the
station footprint and covers the entire ‘zone of influence’. A way of extending transport authorities’
ability to capture a significant proportion of the value uplift from this wider zone of influence is to
permit them to acquire land beyond the immediate station footprint and self-develop or sell
development rights to third parties. This would require access to significant land acquisition
budgets, which transport authorities do not have at present.
44. The ability to acquire land early is important, given that value uplift can be measured as the
difference between the pre- and the post-transport scheme market value of a development site. If
acquisition of the land by transport authorities is carried out post-transport scheme delivery, the
market value would have already adjusted upwards to accommodate the transport investment
effect, thus neutralising the ability of transport authorities to capture value uplift.
Taxation of new development
Community Infrastructure Levy (CIL)
45. CIL was introduced by the Government in 2010 as a spatial tax on new development. It is
levied by local authorities and in London both the Mayor and the boroughs can levy a CIL. It is set
at a rate per square metre of new development and is paid by developers at the point of
development commencement. Local authorities can choose to set a flat rate across all land uses or
differentiate rates according to land use and location.
46. Borough CILs have a limited value link as the tax is based on space rather than development
value. The structure of the tax tends to be regressive – more profitable developments pay a lower
proportion of development value as CIL compared with less profitable ones with the same floor
area. This is partly compensated by authorities differentiating the rates for different types of
development.
47. Arguably, CILs target development at the wrong time – at development commencement,
when development risks are highest and the full development value has not yet been realised.
Local authorities have discretion over the levels at which CIL is set, which can create uncertainty
for the developers. Although authorities are required to publish annual CIL returns, there tends not
to be a great deal of transparency in how the CIL receipts are being spent.
1848. In contrast to borough CILs, the Mayoral CIL adopted a different approach and has been
successful in raising significant proceeds. It is set at low rates that are not differentiated by land
use and offer limited exemptions. The money raised is visibly spent on strategic infrastructure – for
instance, the Crossrail project.
Section 106
49. The objectives behind the introduction of the CILs were to move away from the negotiated
nature of the section 106 agreements, give developers certainty over the amount of tax to be paid
on new developments and speed up the negotiation process overall. As such, the use of section
106 contributions towards strategic infrastructure (apart from the specially created Crossrail
section 106 regime) has been significantly reduced and pooling restrictions make it difficult to
collect meaningful sums via section 106 agreements, which make them an unsuitable form of
capturing land value uplift. However, they are still commonly used to fund affordable housing and
other local site-specific mitigations. Under the current system, section 106 contributions sit
alongside CIL payments and the overall process of the developer contribution negotiation has not
been speeded up.
50. In general, on projects (typically on rail extensions) where dependent new development is
easily identifiable and relates to a single ‘anchor’ development scheme, it has been possible to
capture a substantial proportion of the value uplift. This is clearly illustrated by the Northern line
extension (NLE) to Battersea Power Station (where about 20 per cent of project cost is met via
developer contribution) and the Overground extension to Barking Riverside (BRE) (where about 65
per cent of project cost is met via developer contribution).
51. Clearly dependent developments are the exception rather than the rule. In most major
projects, dependent developments are not as easily identifiable. This is generally the case for
strategic transport projects or longer rail extensions, for example Crossrail 1 and the Jubilee line
extension. In these instances the transport schemes can often lead to significant increases in
density of development and accelerate the timing of its delivery (as well as raising the values of
development), but it is not the deciding factor in whether the development takes place at all. The
process of capturing land value uplift via negotiation of a developer contribution breaks down in
such ‘multilateral’ environments. Transport authorities therefore have to settle for low amounts of
developer contributions. For instance, developers contributed to just £300m of section 106
contributions for the Crossrail project (about two per cent of total project cost), and to less than
five per cent of the cost of the Jubilee line extension.
52. In summary, the ability of transport authorities to capture value uplift from wider zones of
transport investment influence via direct development is limited under current legal and budget
parameters. Citywide development taxes such as the Mayoral CIL are useful, and in some cases
where new development is clearly dependent on the transport project, it may be possible to
negotiate a high developer contribution. The big gap, however, is in the more common situation
where dependent developments are not clearly identifiable.
19Annex 4 – Additional CPO reform proposals
Proposal 1: Obtaining planning certainty through a reform of
section 17 of the Land Compensation Act 1961
1. One way in which transport authorities could capture land value uplift that results from
transport investment is through the direct development route. This would see a transport authority
acquiring development rights within a ‘zone of influence’ and bringing third party landownership
under single development control, as part of an area regeneration programme.
2. The acquisition of land for coordinated development would be done initially on a voluntary
basis, but with the compulsory purchase (CP) as a backstop in situations where landowners are
‘holding out’ their land unreasonably.
3. In March 2016, the Department for Communities and Local Government (DCLG) and HM
Treasury sought public view on proposals for further reform of the CP system, to which we
submitted a response. A summary of the key points from our response can be found in annex 5.
The Neighbourhood Planning Bill, introduced in the House of Commons for the First Reading on 7
September 2016, proposes two key changes. Firstly, the Bill seeks to restrict the market value of
the land to be compulsorily acquired to the value under the ‘no scheme principle’. Secondly, it
seeks to permit the GLA and TfL to put forward joint compulsory purchase order (CPO)
applications.
4. We support the Government’s proposals. They should make the CP process easier and less
time-consuming for the two authorities and provide acquiring authorities with an incentive to
undertake wider area investment regeneration.
5. While these proposed changes would go some way towards simplifying the CP process, we
consider that it does not go far enough in assisting acquiring authorities to capture meaningful land
value increases. This is because the change will not address the fundamental issue of cost of
compulsory land acquisition being too high.
Restricting the compulsory purchase price of land to no-transport scheme market value
6. Value uplift is essentially the difference between no-transport scheme and with-transport
scheme market value of the land. The acquiring authority’s aim would be to purchase land at a cost
that is as close as possible to the no-scheme market value to benefit from the uplift resulting from
the introduction of transport investment.
7. In its paper, ‘Bridging the infrastructure gap’,10 the Centre for Progressive Capitalism argues
that the compulsory acquisition price of the land should be restricted to the existing use value.
However, we consider that this will not fairly reflect the ability of the land to support alternative
development in the absence of the transport investment. The land’s ‘no- scheme’ market value
10The Centre for Progressive Capitalism, ‘Bridging the infrastructure gap’, June 2016, http://progressive-
capitalism.net/wp-content/uploads/2016/06/Bridging-the-infrastructure-gap-June-2016.pdf
20should reflect any existing planning permission on the land, as well as any potential future planning
permissions that could have been granted in the absence of the transport scheme.
8. Our understanding is that in theory, the CP Code (if the CPO reform consultation proposals
are implemented) would restrict the acquisition price to the value that a willing seller would pay for
the land in the open market, taking into account existing and potential future planning permissions,
but ignoring the effect of the transport scheme. It is however very difficult in practice to determine
the ‘no-scheme’ market value of the land.
9. To determine the ‘no-scheme’ market value, a valuer needs to know the existing use value
of the land, and add to this the value of any existing planning consents that could be converted into
new development, as well as any potential future consents that could have been converted into
new development in the absence of the scheme. It is the third element that creates uncertainty in
the valuation.
10. Knowing the market value of the land that would need to be paid early on can assist the
acquiring authority in setting its CPO budgets and make the process more certain. Ideally, valuation
of the land would take place before the acquiring authority starts the negotiation process with the
landowner and before an application for a CPO is made. It could potentially help to avoid the need
to issue a formal CPO notice as the landowner will know from the outset how much they can
expect to be paid for the land.
Limitations of existing mechanisms determining development potential of land, and
consequent market value of land
11. Under the Land Compensation Act an acquiring authority can obtain a section 17
certificate, which is a formal statement of what development the relevant planning authority would
have permitted in the absence of the scheme. In principle, this should serve as an indication of the
land’s development in the absence of the transport scheme and should therefore provide a basis
on which the ‘no-scheme’ market value of the land can be calculated.
12. Where an application is made to the planning authority for a section 17 certificate, the Land
Compensation Act provides for the planning authority to give an opinion to the applicant on
whether a planning permission for one or more land use classes stated in the certificate might, or
might not, reasonably have been expected to be granted. The planning authority may then specify
conditions and requirements on which development may have been granted a planning permission,
but this is at the planning authority’s discretion. In order for the acquiring authority to determine
the market value of the land in a no-transport scheme world, it is crucial that the certificate
specifies the acceptable land use as well as the possible density and quantum of the development
that would be permitted.
13. This is important because often a transport scheme’s effect can be to induce an increase in
density rather than a complete change in use.
14. Through the latest Housing and Planning Bill, the Government is going to introduce a new
planning consent route called ‘permission in principle’ (PIP). It is designed to increase the efficiency
of the planning process and speed up the decision-making on granting developers with a planning
consent. PIP will give developers a planning permission ‘in principle’ based on the high level
development parameters, such as land use, location and amount of permissible development. The
additional parameter of development amount overcomes the limitation of the section 17
certificate. However, PIP can only be granted on the actual development that is going to occur, not
on what could have occurred in the absence of the transport scheme.
21You can also read