The ARTA Years 2004 2010 - Auckland Transport
←
→
Page content transcription
If your browser does not render page correctly, please read the page content below
The ARTA Years 2004 – 2010

       Auckland Regional Transport Authority (ARTA):
                1 December 2004 – 31 October 2010
Contents
How ARTA came into existence                                                          2

Growing supply and demand                                                            10

    Case study 2005: Double tracking the Western Line                                17

    Case study 2006: Northern Express service                                        31

    Case study 2007: Electrification of the rail network                             34

Challenges and opportunities                                                         36

    Case study 2008: Northern Busway opens                                           37

    Case study 2009: A single integrated ticket for Auckland                         38

    Case study 2010: Newmarket Station opens                                         40

Our people                                                                           42

The journey ahead for transport                                                      46

Appendices                                                                           48

    Appendix A: Summary of capital works expenditure/assets and sources of funding   48

    Appendix B: Indicative capital expenditure to 2019                               49

    Appendix C: ARTA’s stakeholders and project partners                             49

The vision for transport in Auckland                                                 52

                                                                                             1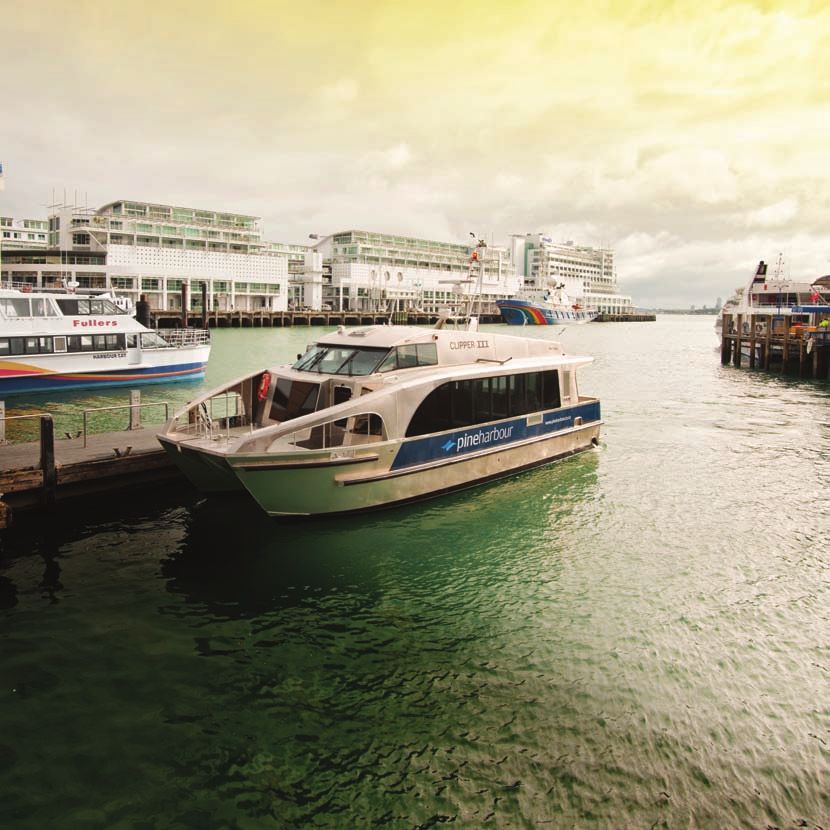
In 2004, ARTA was formed as the country’s first stand alone regional transport authority, with a
    mandate to solve Auckland’s transport challenges. We were given the lead role in planning, funding and
    developing the region’s public transport system of rail, buses and ferries in order to decongest our roads
    and deliver the maximum economic and social benefits.

    This booklet demonstrates the step change we have achieved over the past six years in patronage of
    public transport. A better rail network, more frequent services, simpler routes on buses, infrastructure
    improvements that are up to international standards, and community education programmes are all part
    of the ARTA story.

            How ARTA came into existence
             In 2003, 18 different bodies were involved with planning, financing and implementing transport in Auckland.
    They included the Auckland Regional Council (devising strategy), Infrastructure Auckland (allocating grants for projects),
    Transfund (funding assistance for passenger transport) and Auckland Regional Transport Network Limited (rail
    infrastructure).
    Transport governance had been the subject of continual review for three years, with all parties accepting the need for
    urgent action but not able to reach a consensus on a preferred model. In December 2003, the Government made a rare
    move to intervene in the city’s affairs, offering Auckland additional funding of $1.62 billion over ten years for transport in
    exchange for changes to the way transport was governed and funded. These changes were accepted in general by the
    region’s territorial authorities and enacted in the Local Government (Auckland) Amendment Act 2004.
    The Act introduced a balance of political oversight by the ARC and stand-alone operational governance. Two new bodies
    were set up as separate legal entities: the Auckland Regional Transport Authority (ARTA) and Auckland Regional Holdings
    (ARH), governed by their own board of directors while also being subsidiary organisations of the ARC. The ARH would
    own and manage transport and other assets. Over half the regional rates collected by the ARC and revenue from the
    ARH would go towards funding Auckland’s network of rail, bus and ferry services. ARTA’s role was to take a region-wide
    approach to planning, funding and developing the land transport system in Auckland and contributing to the overall
    vision for the country’s largest city, as outlined in the Regional Growth Strategy. The ARC would act as both a funding
    and strategic body for ARTA, with constrained powers of control, working in a partnership of mutual reliance to achieve
    significant improvements to Auckland’s transport system and traffic congestion problems.

            ARTA gets moving
            ARTA was established on 1 July 2004 as a council-controlled organisation, a subsidiary of the ARC, and began
    operating on 1 December 2004. It was launched by Prime Minister Helen Clark in February 2005. Staff transferred from
    the ARC to ARTA and the initial team of 40 has grown to 115.
    The ARC has committed bulk funding to ARTA on a year-by-year basis. ARTA’s responsibilities to the ARC were to provide
    an annual statement of intent; half yearly and annual reports; and allow the ARC to regularly undertake performance
    monitoring.

2
Auckland ferries have been an integral part of public transport since the Devonport ferry service was established in 1860.The SuperGold Card,
offering free travel for seniors at off-peak times, has played a key role in reviving ferry patronage since it was introduced in 2008.

                                                                                                                                                3
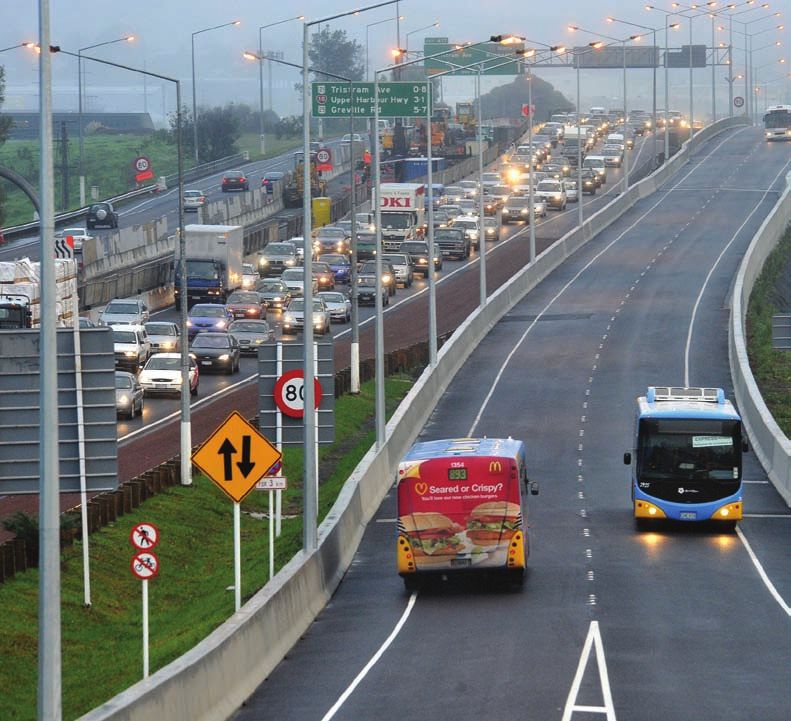
Dedicated busways carry 12,000 people an hour while a single lane of motorway carries only 2,400 people. The Northern Busway’s capacity and reliability
    is playing a key role in addressing traffic congestion over the Harbour Bridge by taking 5,100 cars off the road in morning peak times.

4
ARTA’s vision
          One of the first tasks for the new Board of Directors was to develop a vision and regional strategies for achieving
that vision.
           Vision: A world-class transport system that makes Auckland an even better place to live, work and play.
           Strategies:
        Growing Auckland
The transport system will support regional growth and economic development strategies by linking Auckland’s main urban
centres with a fast, frequent and reliable Rapid Transit Network, comprising an electrified rail system and the Northern
Busway.

         Moving Aucklanders
One ticket will take you anywhere in Auckland, on a seamless network of bus, train and ferry services. Aucklanders will be
in the habit of quickly checking the options for their trip before leaving home, and will be able to choose between a quality
public transport service, safe walking and cycling routes, and predictable car journey times.

        Sustaining Communities
Aucklanders will make safe, healthy and sustainable travel choices. People who do not have access to a car will still have
access to employment, education, health, commercial and recreational opportunities.

           The first comprehensive 10-year plan
        In 20051, the ARC published the Regional Land Transport Strategy (RLTS), which set the expected transport
outcomes for 2016 and required ARTA to prepare an Auckland Passenger Transport Network Plan (PTNP). The plan,
published in 2006, identified the strengths and weaknesses of the transport system, the lessons Auckland could learn
from other cities internationally, and set a 10-year plan of action to 2016 to get the region moving.

           Analysis of Auckland’s transport network
         An analysis of the public transport network showed that it had world-class elements but had suffered from chronic
under-investment and lack of an overarching planning framework. Auckland had been growing rapidly in a sprawling
fashion. By 2004, the city was absorbing an extra 50 people each day and hence potentially an extra 35 cars. By 2040, the
region’s population is predicted to reach two million. While roads will remain important for moving freight, it had become
impossible to build our way out of congestion by providing more road capacity. The region was coming to a congested
standstill, as a recurring consequence of growth, impacting on the economy, the environment and public health. It was
estimated in 2006 that congestion in Auckland was costing the country $1 billion a year, just under 1% of the GDP.
Wellington was moving proportionately 75% more people by public transport than Auckland, where 25,000 homes
had more private vehicles than people. Already, Auckland had outgrown the structure of the public transport system,
which could be broadly described as multiple private operators operating peak-time-only services to and from the
CBD. Metropolitan centres such as Manukau had grown considerably. The populations of peripheries such as Flatbush
(near Manukau) had shot up and rising inner city property values was one driving factor in the development of non-CBD
employment areas such as Westgate, Albany and the airport. People were no longer travelling from the suburbs into one
central location for work and play. They had needs to travel within and between these mushrooming centres at all times
of the day and night.

1. Dates refer to calendar rather than financial years unless otherwise stated.                                                 5
Some marked improvements were under way: the opening of Britomart in 2003 and investment in rail infrastructure
    and services, upgrading ferry services and terminals, the early stages of the Northern Busway project and increased
    frequencies of bus services. These had led to an increase of 15% in the use of public transport between 2001 and 2005.
            The main limitations of the transport network were:
    q       Lack of integration between the three modes of transport, bus, rail and ferry, resulting in duplicated services
    q       While bus coverage appeared extensive it was focused on travel to the CBD and services were infrequent,
            with 75% operating fewer than three buses per hour. There were over 450 routes but around 90% of them
            were peak-time only. The emphasis on direct services resulted in long, inefficient bus routes rather than
            efficient transfers. Bus services didn’t match the public’s needs and often they were in direct competition with
            train services
    q       While the rail network had improved with refurbished trains and higher frequency, rail had limited coverage
            with less than 15% of Auckland’s population living within 800m of a train station
    q       Too many competing fares. Users of the transport system had over 100 fare products to choose from,
            with different fares for bus and train journeys and fare stages every three to five kms. Services and
            timetables were generally planned separately, with competition between private operators discouraging
            integrated services.
    q       The development of unsustainable features such as diesel powered trains
    q       Lack of supporting facilities such as transport interchanges, high-quality stations, information and bus priority
            measures.

        Less than 15% of Auckland’s population lived within 800m of a train station in 2006. The new Grafton Station was moved to a more convenient
        location and since it opened earlier this year has already attracted 45% more patronage than the Boston Road Station that it replaced.

6
Lessons learned from other cities
         The key success factors in the transport networks of five international cities were identified. The cities were
Brisbane, Perth, Ottawa, Vancouver and Portland. They were chosen for their similarities in population size and land use
density.
        The core factors were:
q       Strong institutional structures supporting integrated land use and transport planning
q       A layered arrangement of transport services with an RTN forming the backbone; a high-frequency branded
        express bus and a network of support/feeder services giving good geographic coverage
q       Targeted services to fill particular market niches
q       High-quality transport systems on a dedicated right of way to ensure high reliability
q       High frequency and reliability of transport services — the greatest patronage gains can come from transforming
        existing networks rather than introducing new services
q       Investing in transport interchange and Park-and-Ride facilities, enhancing customer information; improving
        comfort, safety and security; and providing integrated ticketing systems.

        Moving forward in Auckland
         In short, lessons from overseas showed that people wanted services that ran on time, services they didn’t have
to travel too far to get to or wait too long for. The dispersed nature of both population and employment centres in
Auckland meant it wasn’t an efficient use of scarce resources to provide direct services for all trips to all destinations. A
trade-off between service coverage and frequency would have to be made, targeting funding to where it would give best
results. People would get more frequent, faster and reliable services but perhaps have to walk a little further to access
them or make an easy transfer between services. Planning to double the amount of trips that required a transfer (from
15% to 30%) made it even more imperative to provide an integrated ticket and fare system that was simple and easy to
understand. A seamless system was integral to achieving the RLTS goal of 100 million passenger boardings by 2016.
ARTA’s gap analysis in Auckland’s transport network and research into overseas experience identified three essential
components of a world-class system: rapid, quality and integrated. All three needed further development in order for the
transport system to meet both the present and future needs of the region.
The Rapid Transit Network (RTN) was planned as a number of spines running through the region, along which high-quality
(direct, fast, reliable), high-frequency services would run. The aim was to get people to their destinations quicker, ensuring
the services didn’t get held up in road traffic congestion. The RTN should be able to compete with the convenience and
speed of car travel. Its two main components were a modern electrified rail system and an expanded busway system. The
RTN supports Auckland’s growth strategy of intensified land use and is likely to carry around 40% of all public transport
trips, around 80 million a year by 2050. The RTN also makes the biggest contribution to decongesting Auckland’s roads,
with an annual benefit of $25,000 for each additional user. On a cost/benefit ratio, investing in the RTN makes good
economic sense (see the graph on page 8).

                                                                                                                                 7
The Quality Transit Network (QTN) would become the veins and arteries of the city’s transport system. The QTN was
    designed to transport people cross-town, linking key population and employment centres mainly on bus corridors where
    the buses had priority. The QTN delivers only roughly half the benefit of the investment in the RTN, i.e. $12,000 annually
    for each additional user.
            An integrated network would deliver:
    q       Interconnecting train, bus and ferry services at transport interchanges such as Britomart
    q       Integrated ticketing and a simplified fare structure
    q       Local Connector services into the RTN and QTN networks
    q       Targeted services for groups whose needs were not met by regular services, such as Total Mobility for people
            with disabilities and fare concession schemes.

            The other key elements in a shift towards increased use of public transport were:
    q       Changing attitudes and behaviours through education such as travel plans
    q       Developing more sustainable forms of travel such as walking and cycling
    q       Integrating land use and urban design with transport.

          Annual decongestion benefit of each additional user of the RTN, QTN, and LCN networks

                                                     $25,000

                                                                          Northern Busway and rail
                    Decongestion benefits ($ p.a.)

                                                     $15,000

                                                     $15,000
                                                                                                   Key bus and ferry
                                                                                                   routes
                                                     $10,000
                                                                                                                           Local bus and ferry
                                                                                                                           routes
                                                      $5,000

                                                           0
                                                               Rapid Transit Network   Quality Transit Network   Local Connector Network

8
Benefits and net cost of 10 minutes electric compared to the status quo
1400
1200
Annual uplifted
benefit ($m) 1000
800
Net costs (Opex
plus capex minus
600
revenue) ($m)
$m
400
200
0
-200
2008-10 2011-15 2016-20 2021-25 2026-30 2031-35 2036-40 2041-45
-400
Rapid Transit Network
Capacity per hour/person
A single lane of motorway 2,400
Bus lanes 7,500
Dedicated busway 12,000
Rail corridors 20,000 – 25,000
9Growing supply and demand
Comparing progress
The Auckland Passenger Transport Network Plan 2006–2016 predicted more progress in 10 years than in the past 50 years
The table below summarises progress from 1954 to 2004, against achievements of the past six years.
Transport in Auckland 1954 – 2004 Progress on transport 2005 – 2010
(50 years) (5 years)
1955 Master Transportation Plan concludes: “motorways 2005 Northern Express bus services launched and North Shore
should be constructed in priority to the underground bus services redesigned
(CBD) railway project”.
2006 ARTA launches first comprehensive plans for Auckland’s
1959 Auckland Harbour Bridge opened public transport network
1960 Car ownership had reduced public transport 2006 Central Motorway Junction completed
patronage by 42%
2007 First integrated Auckland Transport Plan launched
1966 First section of Western Line double tracked
2007 Planning for electrification gets under way
1993 19 second-hand diesel trains purchased
2008 Northern Busway opens and Northern Express service
1996 Link bus service introduced in CBD takes 5,100 cars off morning peak-time roads
1998 First dedicated bus lanes in Sandringham and 2008 Real time passenger info (VPIDs) installed at all high-
New North roads priority bus stops, and more bus lanes
2000 Suburban rail to Pukekohe was first extension of 2008 40% tertiary discount fares and SuperGold Card for free
coverage in more than 70 years senior travel introduced
2001 New Zealand cities had one of the lowest rates of 2008 Free public transport integrated into sports events and
public transport use in the world concert tickets
2002 Government and ARC buy back Auckland rail assets 2009 Contract for integrated ticketing system signed
from private operator Tranz Rail, which had
underinvested since taking ownership in 1993 2009 Central Connector completed
2003 Britomart Station opens, first refurbished trains 2009 SH20 extension through Mt Roskill completed
in service
2009 Downtown Ferry Terminal improvements completed and
2004 North-western cycleway opened substantial rebuilding of piers 1-4 started
2005 Use of public transport increased 15% between 2010 New rail stations at Newmarket, New Lynn and Grafton
2001-2005 completed, and Onehunga Branch Line reopens
2010 New rail link to Manukau City Centre well under way
(complete mid 2011) and Western Line fully double tracked
2010 20 existing rail stations upgraded and 10 new stations built
since 2003. VPIDs at three rail stations
2010 CBD Rail Loop preferred route chosen and protected
2010 Extra Manukau Harbour Crossing completed
2010 TravelWise programme is taking 9,619 car trips off the
road each morning peak
2010 60.6m trips taken on public transport. Use of public
transport increased 13.9% from March 2005 to March 2010
10Record numbers of Aucklanders are getting on board public transport. Patronage is higher than in any year since 1984 and rail usage has risen by 97%
over the past five years. In 2010, with completion of some major rail infrastructure projects, customer satisfaction with public transport has risen to 87%.
11Traffic congestion is costing the economy an estimated $1 billion a year. Revitalising Auckland’s rail assets to provide high-quality, high-frequency services has been
the only way to achieve the objective of freeing up motorways and intensifying urban development.
12Priority projects
These projects were identified in the 10-year Auckland Passenger Transport Network Plan 2006-2016
as the major components. The table below gives the background work undertaken to achieve the results
listed in the comparison table on page 10.
Project Work undertaken
Rail
Electrifying the rail network Detailed planning began in 2005 with an in-depth electric traction technical evaluation
study and cost/benefit analysis of electric vs diesel trains. Further planning, and funding
go-ahead in 2007, led to a call for EOIs. Funding shifted to KiwiRail in March 2009
(following cancellation of regional fuel tax). In November 2009, $500m was approved
for electrical multiple units. In January 2010, a contract was signed for the infrastructure
required. A supplier for the electric trains is expected to be contracted early 2011. See the
case study on page 34 for details.
Complete double tracking the 2004/05 Swanson to Waitakere
Western Line 2005 Boston Rd to Morningside
2007 New Lynn to Henderson
2008 Henderson to Swanson
2010 last sections completed from Britomart through Newmarket Viaduct to Boston
Road, and Morningside to New Lynn.
New rail station for Newmarket New Remuera Link Road bridge constructed to access Remuera Road station entrance.
Station concourse with floating roof canopy built above four platforms.
Opened January 2010.
New rail station for New Lynn Integrated into double tracking from Avondale to Titirangi Road and with a bus transport
interchange. Trench work complete, station opened in September 2010.
New rail connection to Manukau City 2km of new rail line is being constructed linking Manukau City Centre with the Southern
Centre Line at Puhinui. New rail station and platforms, plus bus transport interchange are being
constructed, to open mid-2011.
Reopening Onehunga Branch Line Work on three new stations began August 2009 — at Onehunga Town, Penrose and Te
Papapa. Opened in September 2010.
Upgraded train stations Upgrading work began in 2005 to accommodate longer trains and greater passenger
numbers, improve security and information, and to meet disability access standards. All
existing stations are expected to be upgraded by 2013.
New rolling stock (trains) There are now 135 trains in services, as opposed to 46 in 2003/04. These trains were
integral to delivering 10-minute frequencies on the three branch lines.
Buses Albany and Constellation stations and Park-and-Ride facilities were commissioned
Completing the Northern Busway and in November 2005 and three further stations the following year. The 8.4km Northern
expanding the service to Orewa Busway opened in February 2008, allowing buses to travel at high frequencies both north
and south unaffected by traffic congestion. See case study on page 37 for more details.
Plans to extend the busway through Silverdale and on to Orewa are under way.
13Project cont... Work undertaken cont...
Completing the Central Connector Work began in 2008 on the 4km bus priority project connecting Britomart with
Newmarket. Includes 24-hour bus lanes, new bus stops and shelters, improved traffic
signals, safety, walking and cycling amenities.
Improved feeder services to the RTN In 2005, there was a 28% increase in overall bus services across the North Shore. Albany
and Constellation feeder bus services grew by 41% to June 2008.
In 2007, routes in the Panmure to Botany corridor and in Manurewa were changed to
coincide with the opening of the rail/bus transport interchanges, resulting in 19% growth.
New QTN services between key In 2007, more frequent peak-time services were added between Botany and downtown
destinations including Botany, Manukau Auckland, growing patronage by 30% in one year.
and Auckland Airport In June 2008, the Airbus Express to the Airport was relaunched with an increased
frequency and more direct route. A new service from Manukau to the Airport was also
launched, together increasing patronage by 13.5% to June 2009.
New bus services to growth areas New bus services to Sylvia Park led to patronage increase of 31%. New services for
Flatbush and Mission Heights were designed in 2008.
New cross-town QTN bus services Botany, Manukau and Howick services were redesigned and introduced in February
serving major movements, e.g. Auckland 2009. Simplified routes within these areas and to the CBD resulted in a 65% increase to
isthmus to Tamaki fringe March 2010 for just 1.4% higher subsidy.
Ferries
Upgrade terminals at Bayswater, Beach Bayswater and Beachhaven upgrades planned 2007 but deferred.
Haven and Half Moon Bay Half Moon Bay upgraded 2008. Birkenhead upgraded 2010.
Investigate new ferry terminals at Browns The success of the Northern Busway, fare increases and parking charges at ferry
Bay, Takapuna, Te Atatu, Hobsonville and terminals are impacting on efforts to increase ferry patronage. ARTA’s focus is on building
Island Bay and introduce services a new terminal at Hobsonville, a high population growth area. Detailed design work has
begun, with construction to be complete by July 2011.
Improve services at new and upgraded More frequent services from Pine Harbour and West Harbour have been enabled by
terminals subsidies to operators to purchase new vessels. In 2009, patronage on these services
increased by 20% and 24% respectively.
Transport system
improvements
Continue to implement real time In 2009, 146 variable passenger information displays (VPIDs) were installed at high-use
information bus stops. 173 solar powered information displays were installed at lower-use bus stops.
In 2010, VPIDs were installed at three major rail stations and three ferry terminals. New
Lynn and Manukau interchanges will incorporate VPIDs, and 20 other upgraded stations
will get VPIDs in advance of the RWC 2011.
Single integrated ticket system A contract to develop and implement a smartcard integrated ticket system was signed in
November 2009.
A simpler, integrated fare structure A fully contracted system of bus services was introduced in 2008 through legislative
changes advocated by ARTA. A new fares policy to form the basis for integrated ticketing
was developed in 2006 to create uniformity across all operators and clarity for customers.
14Rebuilding the rail network
In 2005, the Government allocated $600 million to rebuild Auckland’s rail assets. Project DART (Developing
Auckland’s Rail Transport) as it became known was assigned to KiwiRail, with responsibility for all the below ground
works. This included double tracking the Western Line, Newmarket redevelopment and the Manukau Rail Link. All the
above ground upgrades to rail stations and rolling stock were to be funded and managed by ARTA, paid for by regional
rates and from the Land Transport New Zealand (later NZ Transport Agency) budget.
Upgrading and building new rail stations
30 out of the 40 rail stations on the four branch lines in the region are either new or have been upgraded in
the past six years. The remaining 10 are planned for upgrade by 2013 and a new branch line to Manukau City Centre
is due to open in 2011. The stations accommodate longer trains and
greater passenger numbers, improve security and information, and
meet modern disability access standards. They all have modern
shelters and seating, CCTV security monitoring, emergency help
points, improved lighting, safety markings including yellow tactile
strips strategically placed on platform for the visually impaired, public
address systems, information display boards showing timetable
information and way-finding signage/maps. A programme is under
way for real time information displays to be installed at stations.
Upgraded stations, in the same location:
2004: Glen Innes
2005: Papatoetoe, Ranui
2006: Henderson, Homai, Meadowbank, Orakei, Puhinui
2007: Glen Eden, Fruitvale, Manurewa, Middlemore, Sunnyvale
2008: Ellerslie, Mt Eden, Papakura, Ranui (stage 2),
Sturges Road, Swanson
2009: Morningside
2010: Kingsland.
New stations, including new location:
2003: Britomart
2007: Panmure, Sylvia Park
2010: Avondale, Grafton, New Lynn, Newmarket,
Onehunga, Penrose, Te Papapa
2011: Manukau.
Stations yet to be upgraded, renewed or built:
Baldwin Ave, Mt Albert, Remuera, Greenlane, Penrose Main Line,
With major infrastructure works completed this year and the
Westfield, Otahuhu, Te Mahia, Takinini, Pukekohe, Waitakere and
reopening of the Onehunga Branch Line, 400 extra train trips
Strand Emergency Station. There is also potential for two new stations are now running Auckland-wide each week, which is a 25%
at Parnell and Drury. increase in services.
15Auckland patronage growth versus population growth
62,000,000 1,460,000
Patronage
1,440,000
60,000,000
Population 1,420,000
58,000,000
1,400,000
56,000,000 1,380,000
Patronage
Population
54,000,000 1,360,000
1,340,000
52,000,000
1,320,000
50,000,000
1,300,000
48,000,000 1,280,000
2006 2007 2008 2009 2010 2011
In 30 years’ time, Auckland’s population is predicted to reach two million. A world-class transport system will need to carry at least 200 million public
transport trips a year if we are to improve journey times across the region. ARTA’s strategic goal has been to double the number of public transport
journeys by 2016, in order to keep pace with population growth. The graph above shows that the consistent increase in patronage levels since 2006
is tracking with our expanding population.
Patronage on Auckland’s public transport 1960 - 2010
70,000,000
60,000,000
50,000,000
40,000,000
30,000,000
20,000,000
10,000,000
1960
1962
1964
1966
1968
1970
1972
1974
1976
1978
1980
1982
1984
1986
1988
1990
1992
1994
1996
1998
2000
2002
2004
2006
2008
2010
Increase in rail services
June June June June September
2007 2008 2009 2010 2010
Services (per week) 1,301 1,382 1,475 1,529 1,951
% Increase from previous year 9.1% 6.2% 6.7% 3.7% 25%
16ANNUAL HIGHLIGHTS – CASE STUDY
2005: Double tracking the Western Line (Project DART)
Auckland has had four rail lines, built between 1873 and 1930. By 1939, both the Eastern and Southern rail lines
were fully double tracked. The first section of the Western Line to be double tracked was Morningside to Avondale in
1966. No further progress was made until 2005, when ONTRACK (later KiwiRail) began works for stage one of what was
then known as Project Boston and is now Project DART. The section of track from Boston Road to Morningside was
completed in 2005 and integrated with construction that same year of a new station at Kingsland. Double tracking of the
entire line from Britomart through to Waitakere was completed mid-2010.
Double tracking work and extra carriages allowed the services in peak times to run every 15 minutes from July 2008,
which contributed over half of the 12.6% patronage growth on trains in the following year. Peak time services on the
Western Line now run every ten minutes.
Partners: KiwiRail, ARTA
A crew of more than 600 worked around the clock over Christmas 2008/9 on rail infrastructure projects. They laid 7km of new track and excavated over
50,000m3 of dirt in less than a week.
17Increasing rolling stock and refurbishing trains
Over half of Auckland’s train fleet was more than 25 years old at the time ARTA launched the first Rail Development
Plan for Auckland in 2006. The oldest had been in service nearly 40 years. The plan was to have 28 new trains in service
by 2009 and 35 trains in service by 2011, in order to deliver 10-minute frequency of services. Peak period trains would
have four to six carriages. That level of expansion has been exceeded with a total additional 89 trains in service across all
classes.
The first high-frequency bus corridors
In June 2010, the first QTN high-frequency bus corridors started operating along Mt Eden Road and Dominion
Road. The b.line buses run every one to 15 minutes from 7am to 7pm on weekdays. Like the Northern Express on the
RTN, the service is designed to be ‘turn-up-and-go’. No timetables needed. As part of the process of developing b.line,
ARTA asked its online consumer panel to rate the service’s potential to move Auckland forward. Along with integrated
ticketing, b.line scored highly on a range of factors, including being world-class, vibrant, simple and easy and meeting
customers’ needs.
Downtown Ferry Terminal repairs
The Downtown Ferry Terminal is the hub of Auckland region’s passenger ferry services. The terminal was built on
top of wharves that are over 100 years old. The undersides of these historic piers have become corroded by a combination
of environmental toxins such as chlorides and sewage leaks, structural overloads and through design and construction
flaws. The piers required substantial repairs to their structural fabric. ARTA took over responsibility for the Downtown
Ferry Terminal infrastructure in October 2007, when it absorbed ARTNL, and funded substantial partial rebuilds. Work on
piers 1 and 2 was completed in mid 2010. Investigation and design is complete for piers 3 and 4 but the physical works
programme is yet to be confirmed.
Several improvements to passenger facilities at the Downtown Ferry Terminal were also completed in 2008, including a
glass wall enclosure and ports operations office on pier 1, a canopy on pier 2 and construction of a link bridge between
the two piers.
Encouraging more sustainable travel
A key conclusion of the RLTS, and of transport studies and strategies worldwide, is that building roads cannot,
on its own, reduce traffic congestion or provide a transport system that meets wider environmental and social goals.
Public transport, walking and cycling have vital roles to play in the shift towards lowering the cost of transport on the
environment and human health.
In 2006, ARTA launched the Sustainable Transport Plan, which defined sustainable transport as working with people and
their communities to improve travel opportunities and to encourage people to make fewer car journeys. ARTA took the
lead role in ensuring the plan remained on track and had three mains tools for influencing this: land use planning, funding
and activities it delivered directly.
18Achievements in three main elements of the plan are reported on in this section:
q TravelWise programme in schools, workplaces and tertiary institutes
q Accessible public transport
q Walking and cycling action plans.
TravelWise programme
The TravelWise programme was launched in 2005 with the goal of achieving voluntary reductions in car travel to Auckland
schools, workplaces and tertiary institutes of 20,000 trips each morning by 2016. For context, 20,000 is the maximum
number of trips that could cross the Auckland Harbour Bridge — eight lanes of motorway — in an hour.
ARTA has employed teams of plan advisers and the TravelWise partnership is on track to achieving the above RLTS goal. It
is making an important contribution to the Government’s objectives for road safety and the reduction of traffic congestion
in major urban areas.
Overall, results of TravelWise include:
q Taking 9,619 car trips off the road each morning peak
q Halving child pedestrian injury crashes around TravelWise schools
q Reducing car travel by 135,000 km, giving a congestion benefit of $20.35 million each year
q Long-term safety benefits of infrastructure installed to date of $132 million
q An established reputation with schools, and a growing reputation with NZ’s top companies and major
institutions.
The 2010 TravelWise Week was the most successful ever, with 133 schools registered across Auckland and 54,000
students participating.
There are now over 300 Walking School Buses operating at 130 schools throughout Auckland (up from 159 in 2005).
A travel plan for the two CBD university campuses has achieved a reduction of 1,626 car trips to the CBD universities each
peak morning.
Partners: TravelWise has been managed in partnership by ARTA, the councils of Auckland City, Franklin District, Manukau
City, North Shore City, Papakura District, Rodney District and Waitakere City, and the NZ Transport Agency.
Cost/benefit ratio: 9.5, making this one of the most cost-effective transport programmes in New Zealand.
“I believe we are reaching a tipping point with public transport use, through a shift in some key drivers. Aucklanders
are now genuinely motivated by its environmental benefits; 25% of the crowds at special events travel by public
transport and more dense inner city living has made it acceptable not to own a car. There’s been a slow groundswell,
with use of public transport becoming normalised for high earners as well as those on tighter budgets.”
Shelley Watson, ARTA general manager, Marketing and Communications
19There are 34 organisations in Auckland that have a workplace travel plan. A 2008 review found that there were 355 fewer car trips to work each
day at the five workplaces with the most advanced travel plans.
20Workplace travel plans
Vodafone NZ and Auckland Airport are two examples of the success of workplace travel plans in promoting more
sustainable travel. Vodafone NZ was one of the first organisations to begin a plan, early in 2004. Needing to relocate their
1,100 staff, they worked closely with ARTA on an i-commute programme to promote the use of public transport, walking
and cycling. While the company has benefited from a reduced need for car parking, the major benefits to the wider
community by 2006 were:
q Reduced congestion, saving other road users $64,000
q Fewer road crashes, valued at $21,000 per year
q Environmental and health benefits, valued at $45,000.
In 2006, Auckland Airport developed its Lift programme with input from ARTA. Promoting car pooling and use of public
transport to over 12,000 staff, the programme now has 23 companies in the airport vicinity as members. In just two years
it had taken 840 cars off the road each month, reducing CO2 emissions by at least 68 tonnes per year.
Results: Ten workplaces have now completed and evaluated travel plans, and collectively have achieved a reduction of
788 car trips to work each morning peak. This reduction in car trips corresponds to 4.5 million fewer kilometres travelled,
and a CO2 reduction of 1,469 tonnes.
Progress on accessible public transport
Both national and regional transport strategies require local authorities to consider the needs of transport
disadvantaged people and to provide services to meet those needs. ARTA has been proactively working to improve
accessibility for communities and groups whose needs are not met by the regular public transport system. These groups
are primarily children, senior citizens and disabled people.
ARTA has established a Transport Disability Advisory Group (TDAG) that provides guidance, advice and clear direction to
ARTA, councils and key stakeholders with the aim of increasing access to transport services for disabled people. We work
closely with bus, train and ferry operators and with
KiwiRail and local councils to achieve improvements to
existing and new infrastructure, services, information
about services and staff training. We also administer
the Total Mobility (TM) scheme for taxi and hoist vehicle
transport. The Auckland Regional Public Transport
Plan 2010 contains new policies and actions for
transport disadvantaged Aucklanders that build on the
progress to date, and a number of improvements to
the Total Mobility scheme are due to be implemented
in October this year.
The old Grafton Bridge (right) has become a
key element of the Central Connector route
that links to the new Grafton Station.
21Disability access
By the end of June 2010: 9,500 people are registered with Total Mobility in the Auckland region, up
q 27 of the 38 operational rail stations were from 8,000 in 2005.
fully accessible, including 10 stations with ifts
All stations will meet modern design criteria
for accessibility by the time the upgrade
programme is completed in 2013
q All trains were accessible via a portable
ramp
q 60% of Auckland’s urban bus fleet was
wheelchair accessible and a further
12% had ‘SuperLow Floor’ (single step
access) without wheelchair ramps. The
remaining 28% had multiple step access
but operation of these buses was mainly
confined to peak periods
q ARTA’s “Vessel Standards for Ferries” had
been issued for initial consultation by the
industry and the TDAG. The intention of
the new standards is to provide more
consistent accessibility as new and
refurbished vessels are introduced into
service.
Total Mobility
ARTA has implemented two phases of recommendations for national improvements to the Total Mobility Scheme. TM
working group member Mary Schnackenberg says the biggest reason behind increases in registration for the scheme
in Auckland is ARTA’s commitment to these improvements. “ARTA’s placed considerable energy into training assessors
and raising awareness of the scheme. They’ve led the country in signing on to the Phase 2 improvements.”
From October 2010:
q More disabled people will be able to get concessionary fares on public transport as the Total Mobility ID card
will be accepted as valid ID on selected services
q The TM maximum fare subsidy per trip will increase to reflect increasing costs of taxis and hoist vehicles fares
q Auckland’s and Wellington’s TM ID cards will be interoperable so clients can use their card to claim discounted
fares when travelling in the other region, instead of using ‘out of town’ TM vouchers.
22Cycling and walking action plans
ARTA has convened the Regional Cycling and Walking Group, along with developing and monitoring walking and
cycling action plans. Walking is an essential link between transport networks and destinations and accounted for 13% of
all journeys in our region in 2006, yet Auckland has a reputation as one of the worst cities in the world for walking. Goals
of the Sustainability Plan 2006 were for the Auckland region to be walk-friendly, and in particular for the walkability of 18
town centres to be improved. There are no specific means for measuring walking but all new town centre plans, such
as Botany’s, take pedestrian needs into account, and the move towards more dense urban living is also supporting
walking. The RLTS set a goal for 2016 of 15% of morning peak trips made by walking or cycling, particularly to schools and
town centres. This goal is being measured through the TravelWise goal of 20,000 fewer car trips being taken each peak
morning.
Only 1% of all morning peak trips were being made by cycling in 2006. The key is providing space to cycle and minimising
conflicts between cyclists and other road users. Hence, the Regional Cycle Network was created in 2007. Cycle parking
also needed improving, along with the ability to take cycles on trains and ferries.
Main goals of the Cycling Action Plan were: Achieved
Half of the 938km Regional Cycle Network 32.6% or 306.2km scheduled for completion by 2012
completed by 2016 (cost $100m)
Develop and distribute cycle maps 5 regional cycle maps produced showing dedicated
cycleways 47,000 maps distributed. Google cycle
maps available on MAXX website
Contribute to the marketing and promotion BikeWise Week extended to one month in 2009
of cycling
Result: The RLTS target for 2016 was to increase cycling by 1%. There was no overall change from 2006-2009 but
significant increases at sites where cycle routes are continuous and connected. In 2010, there has been an annual increase
in cycling of 27%, with the North Western Cycleway rising by 70%.
Increasing customer satisfaction and loyalty to public transport
ARTA’s customer focus has built like a wave over the past six years, working hand-in-hand with delivery of major
projects and development of services. In the first years, while comprehensive plans were being made, marketing had a
twin focus — the need to better understand our customer base and the desire for customers to better understand their
travel choices.
In 2006, ARTA printed and distributed over 1.5 million timetable brochures and regional guides, along with increasing
information on the ground at Britomart, bus stops, train stations and ferry terminals. Permanent information units were
installed at 10 locations. The Contact Centre, run by the ARC, and the MAXX Journey Planner website were also central
to creating a perception shift that public transport could be easy to use, safe and reliable.
23These three qualities were discovered to be high on the list of barriers to use of public transport. In 2006 and again in
2009, ARTA carried out segmentation studies of the public transport customer base, firstly to identify particular barriers
and opportunities for each segment of the population and then to assess the shift in perception over three years. Six target
customer segments were identified in 2009. There are opportunities to retain and grow patronage by tertiary students,
retirees, ‘empty nesters’ (50-69 age) and public transport lovers (30-59 environmentally aware). New customers could
be attained from ‘flat out families’ who need to transport kids and ‘anxious parents’ with additional concerns about safety
on public transport.
Key managers from both Veolia and ARTA headed out to train stations in October 2008 and April 2009 to hear exactly
what mattered most to customers. ‘Meet the Managers’ was designed to give rail customers the experience of giving
feedback directly to decision-makers who had authority to act on complaints and suggestions. Customer feedback
resulted in a number of improvements, such as customer service ambassadors available at Britomart and key interchange
locations during times of service disruption and special events; new Star Mart ticket agencies in the central city; and
improved safety signage for all trains.
Tertiary fare concessions
The Universities’ Travel Plan was introduced in 2007. At the start of the 2008 academic year, ARTA began an ongoing
campaign, particularly via social media, to raise students’ awareness about their travel choices and launched it by
introducing a 40% discount off the one-way single adult fare, doubling the discount students had previously received.
Tertiary 12 month rolling total
4,264,535
4,500,000
4,000,000
3,500.000
3,000,000 Tertiary discounts for
Multiride discounts
2,500,000 increases from 20% to
40% of adult fare.
2,000,000
1,500,000
1,000,000
500,000 Jun 10
Mar 05
Jun 05
Sep 05
Dec 05
Mar 06
Jun 06
Sep 06
Dec 06
Mar 07
Jun 07
Sep 07
Dec 07
Mar 08
Jun 08
Sep 08
Dec 08
Mar 09
Jun 09
Sep 09
Dec 09
Mar 10
24The campaign was an instant success.
Results: Tertiary student patronage of buses, trains and ferries was flat at around 1.5 million from March 2005 to March
2008. Since then the 40% discount has boosted tertiary patronage to June 2010 by 186%, with an additional 2.78 million
trips on public transport being taken by students in the 12 months to June 2010.
SuperGold Card success
From 1 October 2008 Senior Citizen card holders became entitled to free public transport on all buses, trains and ferries
after 9am on weekdays and all day on weekends and public holidays. Getting senior citizens out of their cars and onto
public transport during commercial hours helps free up our roads for business activity, and makes good use of off-peak
public transport services. Equally, it gives those who can no longer drive greater access to their local communities,
reducing social isolation.
While central government funded the off-peak SuperGold Card initiative through the Ministry of Social Development,
ARTA and the ARC worked with the NZTA to get an even better deal exclusively for Auckland’s senior citizens, to include
free travel during afternoon peak services.
Results: SuperGold Card trips on public transport have risen from 1.7 million in the 12 months to September 2008 to 5.5
million for the 12 months to June 2010. This is an increase of 277%.
SuperGold Card 12 month rolling total
5,531,832
5,500,000
5,000,000
4,500,000
4,000,000
3,500,000 Free offpeak travel
for SuperGold Card
3,000,000 holders introduced.
2,500,000
2,000,000
1,500,000
1,000,000
500,000
000,000
Mar 05
Jun 05
Sep 05
Dec 05
Mar 06
Jun 06
Sep 06
Dec 06
Mar 07
Jun 07
Sep 07
Dec 07
Mar 08
Jun 08
Sep 08
Dec 08
Mar 09
Jun 09
Sep 09
Dec 09
Mar 10
Jun 10
25Newmarket Station, nestled amidst apartment
living and a vibrant retail area, is a great example
of transport working hand in hand with more
intensified land use.
Planning and funding –
a coordinated regional approach
Until ARTA’s inception, the planning and funding of transport activities in the
region was devolved to the ARC and each of the seven territorial authorities. This
piecemeal approach and the lack of an objective framework for prioritising projects
with a regional impact were seen as delaying action on the urgent need to address
Auckland’s increasing traffic congestion and its associated challenges. ARTA was
tasked with planning and prioritising funding for high-priority projects on a regional
basis.
A central focus in the initial 18 months was to:
q Develop a set of prioritisation principles and assessment criteria for
allocating scarce funding – the right projects at the right time
q Prepare a set of plans for the region’s transport system, based on these
principles and on wide consultation with stakeholders.
While the PTNP published in April 2006 was required by the RLTS, other plans such
as Auckland Transport Plan, the Sustainable Transport Plan and the Rail Development
Plan were innovative and represented a first for Auckland as comprehensive planning
documents to move Auckland forward in an integrated and sustainable way.
Aspects of the PTNP research are discussed on pages 5 to 7 and the table on page
13-14 shows the priority projects within the 2006-2016 planning period, along with
substantial progress to 2010. The Sustainable Transport Plan has been discussed in
the section on encouraging more sustainable travel on pages 18 to 23. The other
plans are discussed below.
The first Rail Development Plan
Revitalising Auckland’s rail assets was pivotal to the PTNP. Long neglected, the rail
system had huge strategic importance for its potential to address traffic congestion
and its revitalisation represented the possibility of a real step change in the shift
towards increased patronage of public transport. The opening of Britomart, and a
modest investment in upgraded trains, tracks and stations, had doubled patronage
on the trains in three years, from 2.5 million in 2003 to 5 million in June 2006.
At the same time, the underlying tensions in Auckland’s complex local body structures
were nowhere more apparent than in the development of the region’s rail assets. The
Government and the ARC bought the rail assets back from TranzRail and granted
access rights to a private operator Connex (now Veolia) to run services, while the
territorial authorities set up the Auckland Regional Transport Network Ltd (ARTNL)
26to own and maintain the stations. This was the situation ARTA stepped into in
2004. Launching the Rail Development Plan in August 2006 was a step in the
direction of changing both Auckland’s transport development and the shape of
the region’s urban development. The plan presented a strong business case
for electrifying the network.
Implementing the plan required buy-in at both regional and national levels,
particularly as it incorporated a business case for electrifying Auckland’s rail
network (see page 34 for more). The number of stakeholders involved has
meant persistence and dedicated effort being required to give effect to an
extensive programme of work — from rolling stock, signalling, train carriage
refurbishment, station upgrades, new stations and electrification of the network.
The significant results of that work are detailed on pages 15 to 18.
ARTNL’s assets were transferred to ARTA in October 2007, by an Order In
Council.
The innovative Auckland Transport Plan 2007/2009
The 2007 Auckland Transport Plan (ATP) became a landmark for forward
planning in Auckland transport. As the region’s 10-year planning document,
applied within a longer-term context, it set out — for the first time — one
cohesive programme of work. It unified the strategies, plans and projects
of every stakeholder agency and all the modes of travel, harnessing the
role that transport can play in delivering a broad set of economic, social and
environmental outcomes for the region.
The ATP has encouraged cooperative action between all the agencies involved
and priorisiting of funding. It is the main mechanism for transforming the policies
and strategies in the RLTS into action. The ATP 2009 replaced this flagship
document and requires funding in excess of $22 billion to achieve both the
10-year and key long-term projects such as the CBD Rail Loop and rail to the
airport. It aims to raise awareness of the major funding challenges faced by the
region.
Prioritising funding and projects
Auckland has had to make trade-offs, given that funding for transport has
consistently fallen short of and delayed projects required to meet both national
and regional targets. In order to ensure that best use was made of scarce
funds, ARTA was legally required to make a statement about its view of the land
transport priorities in the region, including the priorities of other organisations.
We have then recommended which projects should receive a subsidy from the
National Land Transport Programme.
27To ensure that view was objective and backed by sound reasoning, ARTA developed a set of prioritisation principles that
took account of other regional planning document objectives and goals as well as its own, and NZTA and Ministry of
Transport objectives for the land transport network.
Three main assessment criteria were derived from the principles:
q Seriousness and urgency of the issues being addressed
q Effectiveness of the proposed solution
q Efficiency.
Components of the PTNP 2006-2016 were rated as high, medium or low against each of the three criteria. The top priority
was clear: making progress in developing the RTN, followed by the QTN.
Funding would also be prioritised by taking into account:
q Investments already committed to, such as double tracking the Western Line
q Geographic priorities, namely those areas poorly served by public transport
q Projects that contributed to the preferred long-term development of the network.
The ATP has informed ARTA’s Regional Land Transport Programme of activities. Released in June 2009, the latest
programme prioritises over 950 projects worth $4.36 billion over the next three years, compared to only around 300
projects in previous three-year programmes.
An inherited model for bus and ferry operation that had proved unsuccessful in other
international cities
Cities across the world outsource the operations of bus services to reduce subsidies and improve quality. Bus and ferry
services have always been privately operated in Auckland, some services with government subsidies and others on a
fully commercial basis. Restraints imposed by the Commerce Commission have prevented any one company from fully
monopolising the Auckland bus or ferry market but deregulation had similar effects to those in the UK — a dramatic rise in
public subsidies following a host of commercial service deregistrations, and stagnant bus and ferry patronage.
The Transport Services Licensing Act 1989 had created a service delivery framework that had not kept pace with growth.
The procurement system allowed private operators to establish commercial services that did not have to meet quality,
performance or customer standards. They could walk away from those services at short notice. New legislation was
needed to reverse this trend. ARTA proposed a fully contracted system, specifying how transport services were to be
delivered, to the Ministry of Transport’s Public Transport Procurement Legislation Review in 2006.
The resulting Public Transport Management Act 2008, has three purposes:
q To prevent commercial services from being registered strategically at break even or loss levels
q To introduce a model of full contracting with incentives
q To facilitate the introduction of an integrated fare system.
28The Act allows ARTA to integrate all the routes, timetables and fares. All the revenue from contracted services comes
to ARTA and each operator is paid a fixed rate, along with an incentive payment for each additional passenger they
generate. This model rewards operators for innovation but insulates them from risk. It gives ARTA accurate information
about revenues, on which to allocate subsidies. Longer contracts and larger clusters of contracts increase the interest
of potential bidders. The Act also acknowledges that ARTA is better placed to leverage patronage growth than private
operators because most of the levers, such as fuel pricing and tertiary education policies, are not within operators’
controls. Operators still work with ARTA to define the most efficient routes and streamline their operations but ARTA has
been able to enforce universal reliability standards.
The Integrated Transport Assessment Guidelines
Another significant change introduced by the LG(A)AA 2004, was related to integrated land use. Land use and urban
design in Auckland has been influenced by cars since the 1950s when car travel started to dominate and Auckland began
to sprawl. Our inherited housing density, street layout and mix of activities continued to influence travel choices, leading
to a public perception of walking and cycling as unattractive options. By 2001, the average travel pattern across Auckland
was for most trips, even very short ones, to be made by car.
The Act required the ARC and the seven territorial authorities to prepare and publicly notify amendments to their district
plans to specifically provide for integrated land use and transport. It gave ARTA an influencing role in ensuring land use
decisions support a more integrated and sustainable transport system. ARTA led a process to develop Integrated Transport
Assessment Guidelines as a framework for gathering and assessing all the appropriate transport information required to
assist developers, councils and the NZTA in better aligning land use and transport in Auckland. Developed in consultation
with the ARC and stakeholders and published in 2006, the assessment tools were already in use internationally but ARTA
reshaped these tools for the Auckland context.
Results: The guidelines were adopted by all seven territorial authorities. “ARTA‘s Integrated Transport Assessment
Guidelines are an example of a framework that can be applied at a local/regional level.” Quality Planning, The RMA
Planning Resource website.
29You can also read