Wairarapa Local Government - Assessment of Options June 2016 - Local Government Commission
←
→
Page content transcription
If your browser does not render page correctly, please read the page content below

Wairarapa Local Government
         Assessment of Options
                       June 2016
Document status

Ref      Version                                                             Approving director               Date
2165     1.1 Draft for Council consultation                                  Bruce Nicholson                  19 May 2016
2165     1.2 Draft Final for Local Government Commission                     Bruce Nicholson                  1 June 2016
2165     1.3 FINAL for Local Government Commission                           Bruce Nicholson                  3 June 2016

© Morrison Low

Except for all client data and factual information contained herein, this document is the copyright of Morrison Low. All or any part of it
may only be used, copied or reproduced for the purpose for which it was originally intended, except where the prior permission to do
otherwise has been sought from and granted by Morrison Low. Prospective users are invited to make enquiries of Morrison Low
concerning using all or part of this copyright document for purposes other than that for which it was intended.
Contents
Executive Summary 1
Glossary 3
1 Introduction 4
1.1 Background 4
1.2 Scope of work 4
1.3 Methodology 5
2 Options assessment 7
2.1 Governance 7
2.2 Representation 8
2.3 Planning framework 10
2.4 Local and regional activity delivery 10
2.5 Strategic capacity 13
2.6 Financial performance 14
2.7 Impacts on GWRC 18
2.8 Overall summary of Options 19
3 Option A – the Status Quo 22
3.1 Description 22
3.2 Governance 22
3.3 Representation 23
3.4 Assessment of Planning Framework 23
3.5 Assessment of Local Activities 25
3.6 Assessment of Regional Activities 35
3.7 Strategic capacity and cultural alignment 38
3.8 Customer Responsiveness 39
3.9 Financial 39
4 Option B – Wairarapa District Council 40
4.1 Description 40
4.2 Governance 41
4.3 Representation 42
4.4 Assessment of Planning Framework 43
4.5 Assessment of local activities 44
4.6 Assessment of Regional activities 50
4.7 Strategic capacity and cultural alignment 50
4.8 Customer Responsiveness 51
Morrison Low i
4.9 Financial 51
5 Option C – Wairarapa District Council and a joint Wairarapa Unitary Plan Committee 54
5.1 Governance 54
5.2 Impact on representation, local activities, strategic capacity and customer responsiveness 55
5.3 Assessment of Planning Framework 55
5.4 Assessment of Regional activities 57
5.5 Financial 57
6 Option D – Wairarapa District Council and two committees with the regional council 59
6.1 Governance 60
6.2 Impact on representation, local activities, strategic capacity and customer responsiveness 61
6.3 Assessment of Planning Framework 61
6.4 Assessment of Regional activities 61
6.5 Financial 62
7 Option E – Wairarapa District Council takes on most regional council activities 63
7.1 Governance 63
7.2 Impact on representation, local activities and customer responsiveness 64
7.3 Assessment of Planning Framework 64
7.4 Assessment of Regional activities 65
7.5 Strategic Capacity 67
7.6 Financial 68
8 Option F – Wairarapa Unitary Council 70
8.1 Governance 70
8.2 Representation 71
8.3 Assessment of Planning Framework 71
8.4 Assessment of Local activities and customer responsiveness 72
8.5 Assessment of Regional activities and customer responsiveness 72
8.6 Strategic Capacity 74
8.7 Financial 74
9 Fit for the Future Benchmarks 77
Appendix A Modelling Assumptions 81
Appendix B – Summary of Local and Regional Activities 83
Appendix C – GWRC allocation of costs 84
Appendix D – Te Upoko Taiao Terms of Reference 86
Appendix E – Potential Local Government Options for Wairarapa 87
Morrison Low ii
Tables Table 1: Options for assessment 4 Table 2: Representation summary 8 Table 3: Comparison of representation across similar scale district and unitary councils 9 Table 4: Allocation of Governance and Management Responsibility 11 Table 5: Impact of Options on local activities 11 Table 6: Impact of Options on regional activities from a Wairarapa perspective 12 Table 7: Key Elements of Strategic Capacity from Wairarapa Perspective 14 Table 8: Net Operating result for Options A-F, Years 1-10 15 Table 9: Net Present Value of the operating result before revaluations (7% discount rate) 17 Table 10: Impacts on GWRC 18 Table 11: Summary 19 Table 12: Number of staff at MDC, CDC and SWDC 25 Table 13: Current participation in shared services 26 Table 14: Summary of the significant Roading Assets 29 Table 15: Summary of community services provided 32 Table 16: GWRC Wairarapa rate requirement for Environment activities 38 Table 17: Net Operating result 39 Table 18: Relative scale – Wairarapa District Council 40 Table 19: Summary of Combined Assets - WDC responsibility 47 Table 20: Net Operating Results ($M) 52 Table 21: Sensitivity analysis of IT transition costs (Net Operating Results ten year total ($M)) 52 Table 22: Allocation of governance and management responsibility 57 Table 23: Net Operating Results ($M) 58 Table 24: Allocation of governance and management responsibility 62 Table 25: Net Operating Results ($M) 62 Table 26: Net Operating Results ($M) 68 Table 27: Net Operating Results ($M) 75 Table 28: Environment rating and expenditure 75 Table 29: Assessment of Year 1-10 financial performance against Fit for the Future benchmarks 77 Table 30: Modelling Assumptions 81 Table 31: Local and Regional Activities 83 Table 32: Principles of allocation of GWRC costs to the Wairarapa 84 Table 33: GWRC allocation of rates-funded costs to the Wairarapa 85 Figures Figure 1: Net Operating result of Options A-F ..................................................................................................... 16 Figure 2: Revenue and expenditure by Activity 2015/16 .................................................................................... 44 Figure 3: Territorial authorities ranked by population ........................................................................................ 50 Figure 4: Revenue and expenditure by Regional Activity 2015/16 ..................................................................... 69 Figure 5: Revenue and expenditure by Regional Activity 2015/16 ..................................................................... 76 Morrison Low iii
Executive Summary
The process of assessment of Local Government options for the Wairarapa was undertaken in collaboration
with the Carterton District Council, Masterton District Council, South Wairarapa District Council, Greater
Wellington Regional Council and the Local Government Commission.
Our project brief was to undertake an assessment of the identified Wairarapa Local Government Options
based on robust information, namely the Long Term Plans 2015/2025, Infrastructure Strategies, Asset
Management Plans and Annual Reports. At the outset project assumptions were agreed for the purposes of
the assessment. The assumptions of Greater Wellington Regional Council on the expenditure for regional
activities in the Wairarapa was critical to the assessment as is the assumptions around potential costs to
transition the councils to a single information technology system.
The assessment involved bringing together the robust information as provided by the respective councils
and identifying the anticipated transition and ongoing costs, and efficiencies associated with Options B to F.
The value proposition of increased scale and capacity may provide additional benefits over and above those
quantified in our assessment. These would require further study once a preferred option is identified.
Our assessment was based on the current councils’ positions and was not about anticipating a future
Council’s decisions in regard to rating policy, service levels and projects.
The Qualitative Matters
The purpose of our assessment and resulting information was to facilitate an informed discussion in the
community. Our analysis would suggest that there are a number of matters to discuss that are qualitative in
nature, namely the benefits of:
A consolidated Wairarapa District Council (Options B, C & D) over the Status Quo (Option A),
A consolidated Wairarapa District Council with empowerment of committees (Options C & D) against
a traditional consolidated District Council (Option B), and
The greatest autonomy (Options E and F) against the consolidated Wairarapa District Council
(Options B, C and D) and the Status Quo (Option A)
A consolidated District Council would provide:
clarity of voice and purpose,
improved resilience and resource,
increased influence on regional activities,
development of one set of local plans, policies and standards,
efficiency and consistent service delivery,
integrated processes, systems and information,
standardised levels of service, and
increased scale and capacity, but
lower representation of district councillors
Morrison Low 2165 Wairarapa Assessment of Local Government Options 1A larger organisation (Options B to D) makes the council more attractive as an employer and provides for
increased:
depth of resource (financial and staff),
capability to undertake strategy and planning, and
ability to attract and retain staff resources.
Options E to F will display similar characteristics to Options B to D except for potential challenges in:
strategic capability and skills retention for regional activities,
consistency of regional standards across the greater Wellington region,
the disaggregation and duplication of Greater Wellington Regional Council activities, and
ability to participate nationally on regional government matters.
Option F also results in the redefinition of the greater Wellington region.
The Quantitative Matters
Our financial analysis of the options has identified that:
Options A to D are similar based on the assumptions, and
Options E and F indicate a funding challenge that would have to be addressed by the Wairarapa.
The financial results for Options A to E are dependent on the continuation of Greater Wellington Regional
Council’s rating policy and the estimate of future information technology costs.
The financial sustainability of Options E and F would have to be addressed by the future Council, potentially
through a mixture of general rates increases, service level reviews and consideration of major projects. The
extra total rates requirement from the community would be an average increase of 1.8% for every $1 million
of additional operational expenditure.
The assessment of options allows the community to consider the qualitative and quantitative benefits and
disbenefits of Options A to F.
Morrison Low 2165 Wairarapa Assessment of Local Government Options 2Glossary AMP – Asset Management Plan CDC – Carterton District Council CWDP – Combined Wairarapa District Plan GWRC – Greater Wellington Regional Council LGA – Local Government Act LGC – Local Government Commission LTP – Long Term Plan MDC – Masterton District Council RLTS – Regional Land Transport Statement RMA – Resource Management Act RPS – Regional Policy Statement SWDC – South Wairarapa District Council WDC – Wairarapa District Council WUC – Wairarapa Unitary Council WWUP – Wairarapa Water Use Project Morrison Low 2165 Wairarapa Assessment of Local Government Options 3
1 Introduction
1.1 Background
In May 2013 the Wairarapa Governance Review Working Party (representing South Wairarapa District
Council, Carterton District Council and Masterton District Council) made an Application to the Local
Government Commission (the Commission) for reorganisation of their respective councils, and the regional
council activities over the corresponding area, into a single unitary authority for the Wairarapa region.
In June 2013 the Local Government Commission also received an application from the Greater Wellington
Regional Council, for reorganisation of local government in Wellington Region. The application was for the
constitution of a unitary authority, covering the area of the existing Wellington Region with the exception of
a small area of Tararua District which would be transferred to Manawatu-Wanganui Region.
As a result of these two applications, the Commission proposed and further investigated a region-wide
unitary authority. In June 2015, the Commission decided not to proceed with this proposal due to lack of
public support. However because there was appetite for changes to the status quo, the Commission
continued to work with councils and the community to identify possible alternative options.
To progress changes specific to the Wairarapa, Councillors from South Wairarapa District Council, Carterton
District Council, Masterton District Council and Greater Wellington Regional Council held two workshops
with the Local Government Commission in November and December 2015. This resulted in six potential
governance options on which initial feedback was sought at three public meetings during February 2016.
Introduction
1.2 Scope of work
To date, the Councils and the Commission have identified the challenges they wish to address and a range of
options for addressing them. This report has now been commissioned by the Commission, in partnership
with the four councils to independently assess the six identified options (‘the Options’), with a view to
carrying out full public consultation later in 2016.
The purpose of this is to identify the costs, benefits and risks (monetary and non-monetary) of each for each
of the four councils and overall. Since the development of the Options, the councils, including Greater
Wellington Regional Council, have refined the governance of Options C, D and E.
1
Table 1: Options for assessment
Option A Status Quo
Option B Wairarapa District Council (WDC)
Option C Wairarapa District Council (WDC) and a joint Wairarapa Unitary Plan Committee
Option D Wairarapa District Council (WDC) and two Committees with Greater Wellington Regional Council
Option E Wairarapa District Council (WDC) takes on most regional council activities
Option F Wairarapa Unitary Council (WUC)
1
For full details of the Options as defined by the Local Government Commission, refer to Appendix E.
Morrison Low 2165 Wairarapa Assessment of Local Government Options 41.3 Methodology
The methodology is based on developing a combined Long Term Plan to assess the overall financial position
of the council or councils under each Option. This is supported by a non-financial assessment of the
benefits, drawbacks and risks of each Option, when considered against the status quo.
For the purpose of adding value to the assessment, a project control group (PCG) comprising the Chief
Executives from all the councils and representatives from the Local Government Commission was
established. The PCG met weekly with a focus to discuss project progress and to provide a vehicle for
feedback and discussion on project work as it progressed. The PCG benefitted the assessment by providing
clarification and assurance as matters arose.
We have used the following methodology, based on our experience of assessing proposed council mergers.
1.3.1 Data collection
The following data was provided by the four councils. In some cases, not all requested data was available
and assumptions have been made, as described in Appendix A.
LTPs and Annual Plans
Asset Management Plans and asset registers
Capital works programme
Current contracts and any shared service arrangements
Introduction
Organisational structure
Financial information for activities currently undertaken by the Wairarapa District Councils is based on the
Wairarapa Councils’ 2015/25 LTPs. Financial information for activities undertaken by the GWRC is based on
the revenue and expenditure of the GWRC within the Wairarapa District. As the GWRC do not specifically
record expenditure for the Wairarapa, the total costs of the regional activities have been apportioned by
GWRC staff as a percentage of the total GWRC expenditure as budgeted in the GWRC 2015/25 LTP. The
apportionment approach and results have been discussed and agreed to by the four councils and the Local
Government Commission in the Project Control Group.
The basis of apportionment is shown in Appendix C.
1.3.2 Analysis
Activities have been divided into two groups (local and regional) for the purposes of modelling a combined
Long Term Plan (LTP). These activities are identified in Appendix B. A combined LTP has been created for
each of the Options. The anticipated short, medium and long term savings and transition costs were
estimated and tabled at the Project Control Group meetings for comment. These were added into the
model to show the overall position of the merged council under each Option.
The Net Present Value of the net savings (savings less transition costs) for each Option has been calculated
over the life of the current LTPs and the performance of each Option has been assessed against the Financial
and Fit for the Future criteria. Financial results have been sense checked based on our experience of actual
councils of a similar scale to the proposed merged entity.
In addition to the financial assessment, and in accordance with the terms of reference agreed to by the four
councils, we have considered the impact of the Options on:
Governance and representation
Morrison Low 2165 Wairarapa Assessment of Local Government Options 5 The new council’s planning framework
Efficiency and effectiveness of delivery of local and regional services
Strategic capability and capacity of the proposed organisation
Customer responsiveness
Any other key risks and opportunities that will need to be factored into any decision and transition
process.
1.3.3 Reporting
Our analysis and commentary for the various Options is at the level of benefits and dis-benefits to the four
councils rather than from the point of view of each individual council, however the model and indicators
show the benefits and dis-benefits from each individual council’s perspective.
The findings have been reported back to the Project Control Group on a regular basis, to incorporate
feedback from the Chief Executives into the assessment.
1.3.4 Assumptions
In order to model and compare the various Options, a range of assumptions and standard indicators have
been developed based on previous experience. These were agreed to by all four councils.
The modelling undertaken for this study is based on the Wairarapa District councils’ 2015/25 LTP
budgets and assumes that the revenue forecast by the councils will be realised.
Introduction
The GWRC financial information is based on that revenue and expenditure within the Wairarapa
region as contained in the LTP 2015/25. This information was provided by the GWRC and was
independently reviewed by PWC.
The modelling assumes that the levels of service specified in the current LTP across the three
Wairarapa District Councils and GWRC will be maintained for the duration of the LTP unless
otherwise stated in the respective councils’ LTPs 2015/25.
This assessment considers the future governance structure of the Masterton, Carterton and South
Wairarapa districts and the Greater Wellington region. No other boundary changes are proposed for
the purposes of the assessment.
Provision has been made for the development of new regional/unitary plans and strategies for
regional activities in years 1-3 for Options C, E and F.
The full list of assumptions associated with the activity modelling is provided in Appendix A.
Morrison Low 2165 Wairarapa Assessment of Local Government Options 62 Options assessment
The Options can be clustered into three broad groups, with some variations in governance and service
delivery between the Options in each group. The Options progressively result in increased autonomy for the
Wairarapa region.
Option A represents the status quo, with three district councils for the Wairarapa, plus the Greater
Wellington Regional Council.
Options B-D would create a new combined District Council for the Wairarapa. The Options provide
progressively more influence over the governance of regional activities, however the responsibility
for funding and delivering all regional activities remains with the Greater Wellington Regional
Council for all these Options.
Options E and F result in a partial or complete transfer of regional activities from Greater Wellington
Regional Council to the new Wairarapa Council. This transfer includes the responsibility for
governance, funding and delivery of these activities.
Sections 3 to 8 of this assessment look at each of the Options in turn. The introduction to each section is the
description of the Option as developed by the Councils and the Commission. We then assess the impact of
the Option on the council’s:
governance;
Options assessment
representation;
planning framework;
local and regional activity delivery;
strategic capacity;
customer responsiveness; and
financial performance.
Where appropriate we have also commented on the impact of the Option to the remainder of the
Wellington Region.
2.1 Governance
The Local Government Act 2002 (the Act) sets out governance principles for local authorities. Amongst
others these include ensuring:
a clear understanding of the role of democratic governance by the community and elected
members,
governance structures and processes are effective, open and transparent,
as far as practicable responsibility and decision making processes for regulatory and non-regulatory
activities are separated.
The role of Community Boards is specified in the Act. For each board the role revolves around
communicating with, representing and advocating for the interests of its community. This includes, with
respect to each board’s community, considering and reporting on matters referred to the board by the local
authority, maintaining an overview of services, and preparing an annual submission for expenditure within
the community.
Morrison Low 2165 Wairarapa Assessment of Local Government Options 7In addition each board must undertake any other responsibilities that are delegated to it by the local
authority. It is only through this process of delegations that community boards can actually make council
decisions. All other decisions relate to engagement, advocacy or submissions.
The assessment of the Options needs to take these statutory provisions into account.
The Act also requires a local authority to:
establish and maintain process to provide opportunities for Māori to contribute to the decision
making processes of the local authority,
consider ways in which it may foster the development of Māori capacity to contribute to the
decision making processes, and
provide relevant information to Māori for those purposes.
In addition changes to the Act recently proposed by the Minister of Local Government for better local
services reforms will (if enacted) reinforce the obligation during reorganisations to protect the integrity of
council–Iwi arrangements established by legislation, including Treaty settlement legislation.
The Deed of Settlement with Rangitāne o Wairarapa and Rangitāne o Tāmaki Nui-ā-Rua was initialled on 11
May 2016. An agreement in principle was signed by the Crown and Ngāti Kahungunu ki Wairarapa on 7 May
2016.
These create a Wairarapa Moana statutory board to be formed between Ngāti Kahungunu ki Wairarapa,
Options assessment
Rangitāne o Wairarapa, Rangitāne Tāmaki Nui-ā-Rua, the Minister for Conservation, GWRC and SWDC. The
purpose of the Board will be to act as a guardian of Wairarapa Moana and the Ruamahanga River
catchment, for the benefit of present and future generations. In addition, a sub-committee of the statutory
board will be established to prepare and recommend the natural resources document to the statutory board
for approval. This sub-committee will be comprised of two Rangitāne and two Ngāti Kahungunu
representatives and one representative each of GWRC, MDC, SWDC and CDC.
2.2 Representation
The following table summarises the level and type of representation for each Option.
Table 2: Representation summary
Option A Options B to E Option F
Status Quo WDC WUC
Mayor 3 1 1
District/Unitary Councillors
At Large 13 0 0
By Wards 14 12 12
Elected Community Board Members 12 21 21
Regional Councillor 1 1 0
Total Elected Members 43 35 34
Population (2013) 41,112 41,112 41,112
Population per District Councillor (including the Mayor) 1,370 3,162 3,162
Morrison Low 2165 Wairarapa Assessment of Local Government Options 8While Options B to E have 17 less District Councillors (including the Mayors) than Option A, there is an
increase of 9 in the number of community board members. This will be of significance when considering the
extent to which powers should be delegated to community boards and also when considering the
management structure and resourcing model which best supports the governance decision making model.
A comparison of Options B to F with other district and unitary councils of a similar scale shows that the
numbers proposed are comparable, and generally more favourable, than for those other councils. For the
purposes of the following table, regional councillors are not included in the analysis.
Table 3: Comparison of representation across similar scale district and unitary councils
Council Area Population Mayor & Community Total Population Population
(Square (2013) Councillors Board Elected per per total
Kilometres) Members Members Mayor & Elected
Councillors Members
Wairarapa 5,936 41,112 13 21 34 3,162 1,209
Gisborne 8,386 43,653 14 0 14 3,118 3,118
Marlborough 10,458 43,416 14 0 14 3,101 3,101
Selwyn 6,381 44,595 12 9 21 3,716 2,124
Tasman 9,616 47,154 14 8 22 3,368 2,143
Timaru 2,733 43,929 10 16 26 4,393 1,690
Options assessment
Western Bays 1,951 43,692 12 20 32 3,641 1,365
Whanganui 2,373 42,150 13 7 20 3,242 2,107
Average 3,467 2,107
Under Options B to F, as well as a Mayor elected at large, the twelve Wairarapa councillors would be elected
from seven wards – five from Masterton, two from Carterton, one each from Greytown, Featherston and
Martinborough; plus two rural wards with one councillor each.
Current ward boundaries for Masterton urban, Martinborough, Greytown and Featherston would be
retained. The existing Carterton urban, Carterton rural and Masterton rural wards would be replaced with
one Carterton ward and two rural wards.
It is assumed that the ward and community board boundaries for Options B to F are those contained in the
2013 reorganisation application entitled “Wairarapa’s Future”. That report shows that none of the wards are
outside the statutory variance threshold of 10 per cent either side of the average.
The numbers in “Wairarapa’s Future” were based on population numbers as at the 2010 elections. When
applying numbers from the 2013 census data it appears that the Featherston Ward (whose population has
remained static against an overall increase for Wairarapa) falls outside the 10 per cent variance threshold.
However it is noted that the variance can be exceeded if the Local Government Commission is satisfied that
effective representation for affected communities is best achieved by doing so.
The 2013 populations of the Masterton, Martinborough and Greytown wards all sit within the 10 percent
variance. 2013 figures for the three proposed reconfigured wards, Carterton and the two rural wards, are
not available.
No community boards are proposed for the rural wards but instead a Rural Advisory Committee is proposed.
A Māori ward is not proposed in any of the Options but various mechanisms are proposed for Māori
involvement in decision making.
Morrison Low 2165 Wairarapa Assessment of Local Government Options 9Elected Member Remuneration
The Remuneration Authority (the Authority) determines annual salaries, meeting allowances (generally
restricted to district plan review meetings) and expense rules, particularly with respect travel costs. Salary
levels vary as between councils to reflect the size and scope of each council, including community boards,
and the governance structure (such as committees) adopted by each council.
The annual salary levels vary between the existing councils with Masterton having the highest and Carterton
the lowest. The total of the annual salary levels determined by the Authority for the existing councils
amounts to around $900,000. This excludes meeting allowances and expenses because these costs will vary
from year to year based on activity levels and mileages travelled by elected members.
While there would be fewer elected members under Options B to F the individual salary levels will be higher.
Based on a review of the Authorities determinations for 2015/16 for district and unitary councils of a similar
scale it is estimated the total annual salary levels for Options B to F (including for the community board
members) would be in the region of $750,000 to $800,000. The actual numbers will depend on the
Authority’s evaluation and the governance structure adopted for the new council. Once again meeting
allowances and expenses are ignored because there are too many variables including activity levels and
where elected members reside in relation to where they meet.
While these numbers are of necessity an approximation they do indicate that Options B to F will result in
total remuneration levels less than for Option A, but not to the extent that may have been expected.
Options assessment
2.3 Planning framework
From the Options assessed below Option F provides for the simplest planning framework as it provides the
new WUC the ability to create a Unitary Plan for the Wairarapa covering all regional and district activities
within one planning document and as an autonomous body. Option C also provides for a single Unitary Plan
within one document, however the governance structure is not as simple with delegations to the Unitary
Plan Committee. Option C could result in decisions being frustrated at the time of adoption by the
respective councils as the Unitary Plan Committee does not have the delegation to adopt the plan. Also,
decision making on resource consents is split between the region and the district requiring customers to go
to the different entities for approval which is not as streamlined as Option F and may lead to confusion of
functions.
Option B provides a traditional planning framework with the creation of a Wairarapa District Council. While
the regional and district activities are split between GWRC and WDC, they are clear functional splits that are
well understood. It also solidifies the combined plan approach for the Wairarapa. The other Options (C, D
and E) have either governance arrangements or a split of activities that do not have the clarity of the other
Options and will not result in an easy-to-understand or straightforward planning framework.
2.4 Local and regional activity delivery
The following table shows the activities that are managed and governed by WDC, GWRC and WUC under the
proposed Options. Some of the Options entail a split of Governance and Management responsibility for
regional activities.
Morrison Low 2165 Wairarapa Assessment of Local Government Options 10Table 4: Allocation of Governance and Management Responsibility
1. Local Activities include Roading, Utilities, Stormwater, Regulatory Services and Planning, Parks, Community Facilities and
Activities, Social and Economic Development and Environment and Heritage
Options assessment
2. Regional governance includes Regional Economic Development, Regional Strategy, Regional Initiatives, Emergency Management
and Climate Change Planning
3. Land Management includes Biodiversity Management and Pest Management
4. For Option D, Governance of these activities is by the Wairarapa Services Committee, a standing committee of the GWRC
This table excludes Regional Parks, Regional Water Supply and Harbor Management as these are not
applicable to the Wairarapa. The Wairarapa Services Committee under Option D may also consider other
matters in addition to those specified.
There are significant strategic benefits, as well as some disbenefits, in combining local activities into one
Wairarapa Council under Options B-F.
Table 5: Impact of Options on local activities
Status Quo (Option A) Service Delivery Impact (Options B-F)
Corp/Governance Shared GIS platform Increased capability for financial planning
Offices located close to customer No reduction in customer responsiveness
Knowledge of each district by staff as service centre numbers are retained
Potential loss of staff and local
knowledge through organisational
restructure
Roading Jointly awarded Roading Maintenance Potential for savings on annual
Contracts. Aim to produce a consistent operational expenditure through
standard and to reduce procurement collaboration between NZTA and Council
costs and establishment of Council-based
CDC roading professional services business unit
provided by MDC staff Increased specialisation of resources
Morrison Low 2165 Wairarapa Assessment of Local Government Options 11Status Quo (Option A) Service Delivery Impact (Options B-F)
Three Waters Different charging regimes and levels of Rationalisation of services and upgrades
service Improved resilience
Reduced procurement costs
Waste Joint solid waste contract No additional cost savings or service
Management MDC has a waste minimisation officer delivery efficiency gains
serving the three communities
Community Joint library service (CDC/SWDC) Potential for shared management of
Facilities, Parks community facilities, resulting in
and Sports increased specialisation of facilities and
better prioritisation of upgrades
Access to larger range of facilities
Potential for rationalisation of animal
management facilities
Regulatory and Combined District Plan, selected policies, Integrated decision making on all plans,
Planning district licensing committee policies, bylaws and consents and
Joint bylaws (MDC/SWDC) greater consistency in interpretation of
combined District Plan rules
Options assessment
Pooled building control staff when
required Reduction in Building Control Authority
compliance costs and IT upgrade costs
Little opportunity for strategic planning
efficiencies as Councils already have
combined District Plan
Options C, D, E and F provide incrementally more Wairarapa influence over Regional Council activities.
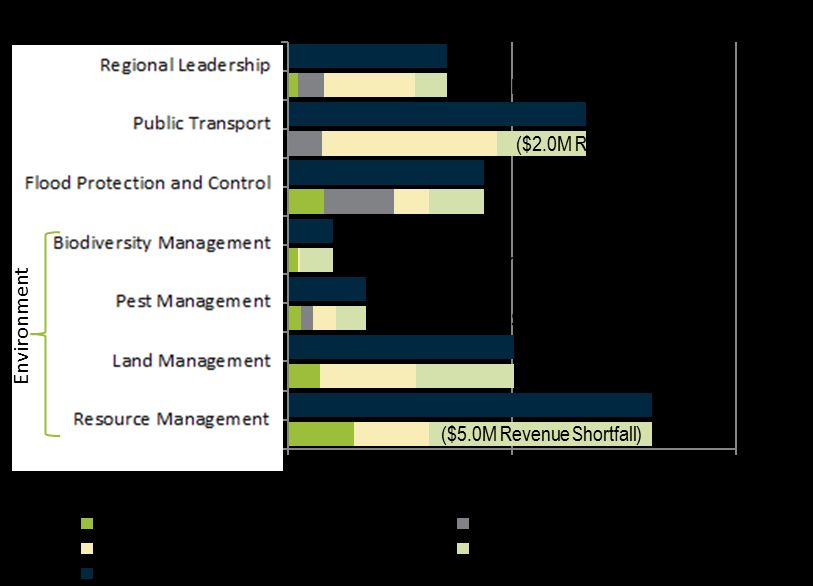
Table 6: Impact of Options on regional activities from a Wairarapa perspective
Regional Leadership Public Transport Environment (includes Flood Protection
Resource and Land
Management)
Options Status quo Status quo Status quo Status quo
A and B
Option C Status quo Status quo Combined Unitary Plan Status quo
provides single set of rules
for Wairarapa
Increased influence on
Regional Plan given
shared decision making
Resource management
policy delegated to a joint
committee, although
decision making remains
with WDC/GWRC
Morrison Low 2165 Wairarapa Assessment of Local Government Options 12Regional Leadership Public Transport Environment (includes Flood Protection
Resource and Land
Management)
Option Stronger Wairarapa Wairarapa influence over Increased
D Wairarapa influence over Regional Planning Wairarapa influence
influence over transport decisions over flood
Wairarapa decisions and Wairarapa influence over protection decisions
related matters investment land management and investment ,
No change to decisions and investment, within funding
existing within funding envelope envelope set by
decision making set by GWRC GWRC
responsibilities
Option E GWRC retains Status quo Control over future Direct management
regional investment decisions and control of
leadership Risk of duplication of assets within
function existing Regional Plan and district
Strong strategies Control over future
relationships Significant cost to investment
required with Wairarapa to take over decisions
GWRC due to this activity Significant cost to
Options assessment
split of regional Wairarapa to take
activities Diseconomies of scale
through split in GWRC over this activity
Environmental Split in GWRC Flood
Management resources Protection
resources
Option F WUC More Control over future Direct management
responsible for influence over investment decisions and control of
leadership of investment Risk of duplication of assets within
Wairarapa decisions existing Regional Plan and district
Co-ordinated Significant strategies Control over future
response to all cost to Significant cost to investment
Wairarapa Wairarapa to Wairarapa to take over decisions
regional issues take over this this activity Significant cost to
Loss of wider activity Wairarapa to take
Split in GWRC
Wellington Collaboration Environmental over this activity
regional required to Management resources Split in GWRC Flood
perspective align fare Protection
levels and resources
make
operational/s
ervice level
decisions
2.5 Strategic capacity
A larger council would provide both financial and non-financial benefits, based on improved strategic
capacity, changes to service delivery methods, standardisation of service levels and prioritisation of capital
Morrison Low 2165 Wairarapa Assessment of Local Government Options 13works. These benefits would depend on decisions made by the new Council and cannot be quantified in the
financial model, which is based on combined delivery of the four councils’ current Long Term Plans.
Enhanced strategic capacity improves the potential for the new council to realise these additional benefits.
An increased scale of council is generally expected to improve strategic capacity, however the operating
shortfall under Options E and F would reduce the council’s capacity for discretionary spending and taking on
additional activities and projects.
Future capability gains must also be balanced against the loss of existing institution knowledge both within
the three district councils and GWRC, particularly through the split of GWRC resources in Options E and F.
These benefits and disbenefits are illustrated in the table below and expanded on in the analysis of each of
the Options in sections 3 to 8.
Table 7: Key Elements of Strategic Capacity from Wairarapa Perspective
A B C D E F
More robust revenue base and increased discretionary spending
Council has increased financial capacity from rates and -
charges to fund debt servicing costs associated with a capital
works programme
Identified efficiencies delivering ongoing annual savings
-
Improved procurement capability and compliance with
Options assessment
contract establishment and use of approved suppliers
-
Advanced strategic planning and policy development -
Provides for an integrated and simplified planning and
reporting framework
Resource to undertake additional activities and projects
Increased capacity through revenue, capability and -
partnerships to undertake increased activities and projects
Capability to cope with complex and unexpected change -
Organisational knowledge, creativity and innovation
Increased ability to attract and retain a skilled workforce -
Retention of existing capacity and capability
- -
2.6 Financial performance
The net operating result for the new Wairarapa Council over years 1-10 is shown below. For Option A, the
combined net operating result for MDC, CDC and SWDC is shown. Under Options B-F, a number of one-off
and ongoing savings are estimated. In addition, there are one-off costs associated with each Option. The
net effect of these is shown in the Net Efficiencies line below.
Over the initial ten year period, there is a similar financial result for Options A-D, with a $44-47 million net
operating surplus. Options E and F result in a shortfall over the same period of $72 million and $100 million
respectively.
Refer to Appendix A for a list of the overall assumptions made and to the relevant Option for a description of
the additional costs and savings associated with that Option.
Morrison Low 2165 Wairarapa Assessment of Local Government Options 142
Table 8: Net Operating result for Options A-F, Years 1-10
Total
$M 2016-17 2017-18 2018-19 2019-20 2020-21 2021-22 2022-23 2023-24 2024-25 2025-26
10 Year
Option A – Status Quo
Revenue 72.8 75.0 77.5 79.0 81.8 84.4 86.9 89.3 91.5 94.6 833
Costs 70.6 73.0 74.0 75.5 78.1 79.0 80.6 83.2 84.5 87.3 786
Operating
2.2 2.0 3.5 3.5 3.7 5.5 6.3 6.1 7.0 7.3 46.9
result
Option B – WDC
Revenue 72.8 75.0 77.5 79.0 81.8 84.4 86.9 89.3 91.5 94.6 833
Costs 70.6 73.0 74.0 75.5 78.1 79.0 80.6 83.2 84.5 87.5 786
Net
Efficiencies = (2.4) (0.3) 1.3 (0.3) (0.1) 0.0 0.2 0.3 0.5 0.6
saving (cost)
Operating
(0.2) 1.7 4.8 3.2 3.6 5.5 6.5 6.4 7.5 7.7 46.6
Result
Option C – WDC
Revenue 72.8 75.0 77.5 79.0 81.8 84.4 86.9 89.3 91.5 94.6 833
Costs 71.0 73.4 74.5 76.0 78.2 79.1 80.7 83.4 84.6 87.6 788
Net
Efficiencies = (2.4) (0.3) 1.3 (0.3) (0.1) 0.0 0.2 0.3 0.5 0.6
saving (cost)
Options assessment
Operating
(0.6) 1.2 4.4 2.8 3.5 5.4 6.4 6.2 7.4 7.6 44.2
Result
Option D – WDC
Revenue 72.8 75.0 77.5 79.0 81.8 84.4 86.9 89.3 91.5 94.6 833
Costs 70.8 73.2 74.2 75.8 78.3 79.2 80.8 83.5 84.8 87.7 788
Net
Efficiencies = (2.4) (0.3) 1.3 (0.3) (0.1) 0.0 0.2 0.3 0.5 0.6
saving (cost)
Operating
(0.4) 1.5 4.6 3.0 3.4 5.2 6.3 6.1 7.2 7.5 44.3
Result
Option E – WDC
Revenue 86.3 89.3 92.2 95.6 97.1 100.2 103.2 106.1 108.9 112.6 992
Costs 93.3 97.2 99.7 102.2 105.3 107.1 109.8 112.6 115.1 119.1 1,061
Net
Efficiencies = (3.1) (1.0) 0.7 (0.3) (0.1) 0.0 0.2 0.3 0.5 0.6
saving (cost)
Operating
(10.0) (8.8) (6.8) (6.9) (8.3) (6.9) (6.4) (6.2) (5.7) (5.9) (71.9)
Result
Option F – WUC
Revenue 94.6 101.2 105.0 106.7 110.6 114.1 117.6 120.9 123.6 127.7 1,122
Costs 103.1 110.7 114.5 117.9 121.6 124.0 127.3 130.4 132.8 137.3 1,220
Net
Efficiencies = (3.1) (1.0) 0.7 (0.3) (0.1) 0.0 0.2 0.3 0.5 0.6
saving (cost)
Operating
(11.6) (10.5) (8.9) (11.5) (11.2) (9.9) (9.6) (9.2) (8.8) (9.1) (100.1)
Result
Both Options E and F result in a structural deficit of around $5-11 million per annum.
2
The net operating result represents the annual increase or decrease in the net worth of the Council. This includes changes in cash
and also changes in the value of assets owned and maintained on behalf of the ratepayers.
Morrison Low 2165 Wairarapa Assessment of Local Government Options 15Figure 1: Net Operating result of Options A-F
10
5
0
2015-16 2016-17 2017-18 2018-19 2019-20 2020-21 2021-22 2022-23 2023-24 2024-25 2025-26
$M
(5)
(10)
(15)
Status Quo Combined Wairarapa District
Wairarapa District with Unitary Plan Committee Wairarapa District with Two Committees
District with Most regional Functions Unitary Authority
Table 11 below shows Net Present Value of the council’s operating results over a 10, 20 and 30 year period.
Options assessment
The ten year Net Present Value differs from the ‘Total’ column in Table 10 above as it is a summation of the
present value of each year’s operating result, taking into account the time value of money based on a
discount rate of 7.0% p.a..
When compared over 30 years, Option B results in the largest operating surplus, with a Net Present Value of
$80.4 million. The shortfall for Option E and F, when looked at over 30 years, is even more significant at
$92.4 million and $134.3 million respectively.
Morrison Low 2165 Wairarapa Assessment of Local Government Options 163
Table 9: Net Present Value of the operating result before revaluations (7% discount rate)
10 years to 20 years to 30 Years
2025/26 2035/36 2045/46
Option A - Status Quo
Revenue 606,470 979,264 1,219,941
Costs 575,384 919,587 1,141,804
Operating result 31,085 59,677 78,136
Option B - Combined Wairarapa District
Revenue 606,469 979,222 1,219,831
Costs 575,448 925,814 1,151,736
Net Efficiencies = saving (cost) (760) 7,351 12,354
Operating result 31,781 60,759 80,448
Option C - Wairarapa District with Unitary Plan Committee
Revenue 606,469 979,222 1,219,831
Costs 577,231 928,120 1,154,381
Net Efficiencies = saving (cost) (760) 7,351 12,354
Operating result 28,478 58,452 77,804
Option D - Wairarapa District with Two Committees
Revenue 606,469 979,222 1,219,831
Costs 576,925 928,326 1,154,917
Net Efficiencies = saving (cost) (760) 7,351 12,354
Options assessment
Operating result 28,784 58,247 77,268
Option E - District with Most Regional Functions
Revenue 721,399 1,165,089 1,451,495
Costs 772,965 1,248,048 1,554,488
Net Efficiencies = saving (cost) (2,460) 5,601 10,572
Operating result (54,026) (77,358) (92,421)
Option F - Unitary Authority
Revenue 809,481 1,312,683 1,667,625
Costs 880,485 1,427,422 1,812,507
Net Efficiencies = saving (cost) (2,460) 5,601 10,572
Operating result (73,464) (109,138) (134,311)
3
Costs from Years 11 to 30 have been extrapolated by using the year 10 Business and Economic Research Limited (BERL) inflation
factor
Morrison Low 2165 Wairarapa Assessment of Local Government Options 172.7 Impacts on GWRC
Moving from the status quo, Options B - F have an impact on GWRC and the greater Wellington region.
Table 10 summarises the impacts.
Table 10: Impacts on GWRC
Impacts
Retention of a greater Wellington concept with full regional council responsibility and operation
Option B Option A
Risks, costs and the existing benefits of multiple constituent territorial local authorities and maintaining
multiple relationships
Retention of a greater Wellington concept with full regional council responsibility and operation
Simplified relationship with one, unified territorial local authority in the Wairarapa
Key governance impact is the joint Unitary Plan Committee and creation of the Wairarapa Unitary Plan,
Option C
creating a “split” across the greater Wellington region and impact on duplication of work for GWRC
A new relationship (the joint Unitary Plan Committee) to be developed and maintained with WDC and iwi
Delegations to committee impacts GWRC decision making
Develops and expands shared governance with WDC and iwi
Options assessment
Creates a level of duplication of activity for GWRC
Option D
General power of standing committees still ensures agreement of GWRC is required and GWRC retains
funding responsibility
Duplication of committees for Wairarapa incurs additional costs
Removal of resource management, flood protection and land management responsibilities of GRWC to the
Wairarapa
Disaggregation and duplication of some GWRC activities
Option E
Still holds key responsibilities for public transportation and regional governance which requires ongoing
governance and involvement of GWRC in the Wairarapa
Potential risk of stranded costs and maintenance of capability
Potential for reduction in rates for remainder of GWRC region
Complete split of greater Wellington region into two regions including all regional responsibilities
Option F
Disaggregation and duplication of GWRC activities
Retains potential risk of stranded costs and maintenance of capability
Potential for reduction in rates for remainder of GWRC region
Morrison Low 2165 Wairarapa Assessment of Local Government Options 182.8 Overall summary of Options
Table 11: Summary
Operating
Options Representation Governance Strategic Benefits 4 Future Challenges
Result
Highest Duplication of Status quo $46.9M Financial pressures
representati Governance on local
on by No unified government
Wairarapa Perspective
District voice GWRC retains
Council responsibility for
rating policy,
Option A
funding and
decisions on
regional activities
Status Quo Need for - -
ongoing
Perspective
relationship
Regional
with three
councils
Options assessment
Lower Stronger Improved $46.6M Amalgamation risks
representati mandate and resilience and Decisions on
on by governance resource regional rating
District for Wairarapa One set of local policy, funding and
Council
Wairarapa Perspective
plans, policies service levels are
and standards outside Wairarapa
Service levels
Option B
standardised
Increased scale
and capacity
Status Quo Stronger - -
mandate and
Perspective
governance
Regional
from
Wairarapa
4
Nett operating result across Years 1-10
Morrison Low 2165 Wairarapa Assessment of Local Government Options 19Operating
Options Representation Governance Strategic Benefits 4 Future Challenges
Result
Same as Same as Same as Option $44.2M Same as Option B
Option B Option B B Increased cost for
Perspective
Wairarapa
Improved Combined RMA Wairarapa RMA
advocacy for Plan for Plan
RMA Plan Wairarapa
Option C
Status Quo Stronger Duplication of Increased cost for
Regional Perspective
mandate and RMA Plans for Wairarapa RMA
governance GWRC Plan
from
Wairarapa
including on
RMA
Same as Funding and Same as Option $44.3M Same as option B
Option B governance is B
aligned and Increased
Wairarapa Perspective
rests with Wairarapa
GWRC for influence on
regional wider range of
Options assessment
Option D
functions regional council
activities in
Wairarapa
Status Quo Stronger Increased input Additional standing
mandate and into regional committees for
Perspective
governance activities from GWRC
Regional
from Wairarapa
Wairarapa
Morrison Low 2165 Wairarapa Assessment of Local Government Options 20Operating
Options Representation Governance Strategic Benefits 4 Future Challenges
Result
Same as Good Same as Option -$71.9M Financial pressure
Option B transparency B to ‘bridge the
and Most regional funding gap’ for
accountability activities regional activities
, some specific to Amalgamation risks
regional Wairarapa are
issues remain Confusion regarding
Wairarapa Perspective
managed in district/ regional
with GWRC Wairarapa roles
Ability to retain
regional resources
and strategic
capacity
Option E
Status Quo Stronger GWRC no GWRC retains
mandate and longer fund responsibility for
governance environment, rating policy,
from flood funding and
Wairarapa protection and decisions on
Loss of some regional balance of regional
Options assessment
responsibility leadership activities
for rating Disaggregation Some loss of
policy, and duplication greater Wellington
Regional Perspective
funding and of regional regional perspective
decisions on activity and Inconsistency of
some capacity regional standards
activities Stranded costs across greater
Wellington region
Same as Most All Wairarapa -$100.1M Financial pressure
Option B autonomy regional to ‘bridge the
and simple activities are funding gap’ for
Wairarapa Perspective
decision managed in the regional activities
making Wairarapa Amalgamation risks
Funding and Ability to retain
rating policy regional resources
decision and strategic
making capacity
Option F
One less Loss of GWRC no Inconsistency of
regional greater longer finance regional standards
councillor Wellington regional activity across greater
Regional Perspective
regional in Wairarapa Wellington region
perspective Disaggregation Loss of greater
and duplication Wellington regional
of regional perspective
activity and
capacity
Stranded costs
Morrison Low 2165 Wairarapa Assessment of Local Government Options 213 Option A – the Status Quo
3.1 Description
Under this Option there would be no structural change. The four councils in the Wairarapa would continue
to look for opportunities to work together to increase the efficiency and effectiveness of local government
services. Responsibility for the roles, activities and services provided by CDC, MDC, SWDC and GWRC would
remain unchanged.
3.2 Governance
The relevant advantages, disadvantages and risks associated with this Option are:
3.2.1 Advantages
No disruption to current structures or decision making processes is required but there is an ongoing
opportunity to improve co-operation and cohesion between the councils.
There is an established willingness amongst the councils to collaborate through joint committees
and forums.
Option A – the Status Quo
Wairarapa has three members and votes on some regional committees, including the Regional
Transport Committee.
3.2.2 Risks and Disadvantages
“Wairarapa’s Future”, the 2013 reorganisation application jointly prepared by the three local
councils, highlighted a distinct Wairarapa community of interest. However the status quo will
perpetuate a duplication of decision making processes and structural inconsistencies between
councils with respect to committees, task groups, working parties and community boards. This
makes it difficult to understand the governance arrangements for Wairarapa as a whole.
Joint committees and working groups are an essential part of the status quo, but they add a layer of
complexity and are at risk because they rely on the ongoing commitment of the individual councils
and must be re-established following each election.
Each council must prepare statutory documents (e.g. LTP and annual plans) and undertake their own
consultation processes.
Various degrees of fragmentation will remain with respect to funding of regional facilities, planning,
policy and regulatory decisions.
There are inconsistent approaches to the involvement of Māori in decision making and Iwi whose
role covers the whole of Wairarapa must engage with three territorial councils and a regional
council.
Groups and organisations whose interests span the whole of the Wairarapa must also engage with
three territorial councils and sometimes also with GWRC. These groups are at risk of receiving quite
different outcomes from the different councils.
There remains a separation between the decision making by the regional council and territorial
councils on matters affecting Wairarapa. The existing local representation and input into GWRC
decision making will remain, including consultation on annual work programmes and participation in
scheme meetings, particularly for activities where a targeted rate applies.
Morrison Low 2165 Wairarapa Assessment of Local Government Options 22 In spite of the proven willingness of the three territorial councils to work together there remains the
potential for Wairarapa not to speak with one voice in regional and national forums thus weakening
the impact of any advocacy on behalf of Wairarapa.
3.3 Representation
Currently, Masterton has a Mayor plus ten District Councillors, with five elected at large and five elected by
wards. Carterton has a Mayor plus eight District Councillors, all elected at large. South Wairarapa has a
Mayor and nine District Councillors, all elected by wards. It also has three community boards in the
townships of Greytown, Featherston and Martinborough. This results in an average ratio of one District
Councillor (including the Mayor) for every 1,370 people.
The Wairarapa is represented by one Regional Councillor in the Greater Wellington Regional Council.
MDC
CDC
SWDC
3 Mayors and 27 Councillors 12 Community Board Members 1 Regional Councillor
Option A – the Status Quo
3.3.1 Advantages
No reorganisation scheme is required.
The existing councils retain the ability in the normal course of representation reviews to reconsider
ward boundaries, the establishment of community boards, and at large versus ward based elections.
Existing relationships with and appointments to external bodies can be retained.
Higher levels of representation, compared with other Options, are retained.
For rural wards the current at large system of voting (partial for Masterton) is likely to result in a
higher number of elected members being elected from rural areas.
3.3.2 Risks and Disadvantages
In light of the views previously expressed that Wairarapa has a distinct community of interest it
could be argued that it is over represented under the status quo.
There is an inconsistent approach to representation as between the existing councils with respect to
voting at large, voting by ward and community boards.
3.4 Assessment of Planning Framework
The current planning framework consists of traditional model of regional and district council activities and
plans split between the Greater Wellington Regional Council and the three Wairarapa District Councils. The
key planning documents are:
Operative Regional Policy Statement – Operative 24 April 2013
Five Regional Plans:
Regional Air Quality Plan Operative 8 May 2000
Regional Freshwater Plan – Operative 17 December 1999
Morrison Low 2165 Wairarapa Assessment of Local Government Options 23 Regional Discharges to Land Plan – Operative 17 December 1999
Regional Soil Plan – Operative 9 October 2000
Regional Coastal Plan – Operative 19 June 2000
Proposed Natural Resources Plan – notified 21 July 2015 (Open to further submissions until 26 April
to the Errors and Omissions Addendum as notified on 11 April 2016)
Regional Land Transport Plan 2015
Regional Pest Management Strategy 2002-2022
Wairarapa Combined District Plan – Operative in part 25 May 2011
Bylaws
Masterton and South Wairarapa District Councils have a set of Consolidated Bylaws 2012 which came into
force on 1 September 2013. While all 18 bylaws apply to Masterton District, only parts one to six, parts eight
and nine and parts eleven to sixteen apply to South Wairarapa District. In addition, South Wairarapa has
seven bylaws and a Water Race Code of Practice specific to its district only. Carterton District Council has ten
of its own bylaws, and the Greater Wellington Regional Council has two local bylaws relating to Regional
Navigation and Safety, and Parks, Forests and Reserves.
Policies
Option A – the Status Quo
Each council has a range of policies that apply to their district, region or council, some of which are common,
such as the Significance and Engagement and Remission of Rates Policies, while others are specific such as
Stock Movements and Town Square use policies.
Activities and Committees
The current planning framework is a complete split between the Regional and District Activities. This means
that the area covered by the three Wairarapa District Councils is represented in decision making by one
Regional Councillor who represents the Wairarapa Constituency. There are 13 GWRC councillors in total.
Joint Committee - Wairarapa Planning Committee (Purpose is to “promulgate a District Plan to cover the
three regions.”)
Relevant Planning and Policy Committees
Masterton
Policy Committee and Hearings Committee
Carterton
Hearings Committee to make decisions on resource consents
South Wairarapa
Policy and Finance Committee
Māori Standing Committee
Greater Wellington
Environment Committee
Sustainable Transport Committee
Te Upoko Taiao – Natural Resource Management
Morrison Low 2165 Wairarapa Assessment of Local Government Options 24You can also read