Housing Sector in East Jerusalem, a Market Opportunity Analysis - Transforming knowledge, Advancing Life
←
→
Page content transcription
If your browser does not render page correctly, please read the page content below

Housing Sector in East Jerusalem, a
                  Market Opportunity Analysis
March 19th 2015

                                         Transforming knowledge, Advancing Life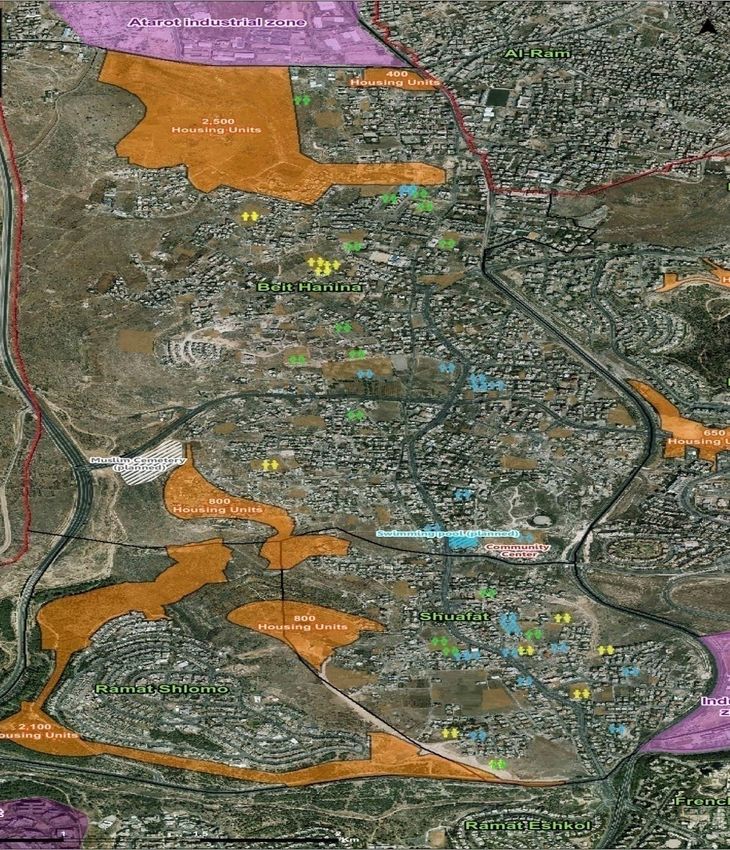
Real Estate and Housing Sector
   Opportunity Assessment
              Submitted to

Al-Quds Economic Forum and the Office of
             the Quartet
          In the Framework of

   East Jerusalem Market Assessment

                                  Funded by
Table of Content

Section       Overview                                                               Page        Section      Overview                                           Page
1             Market Analysis on the Housing Sector in East                               4          1.6             Obstacle to Housing Development               34
              Jerusalem
                                                                                                      1.6.1                  Planning                              35
    1.1                Demographics                                                       5
                                                                                                      1.6.2                  Zoning                                35
     1.1.1                       Population                                               6
                                                                                                      1.6.3                  Infrastructure                        35
     1.1.2                       Population Movements                                     7
                                                                                                      1.6.4                  Land Parcel                           36
    1.2                Characteristics of the Current Housing Units                       9
                                                                                                      1.6.5                  Land Registration                     36
     1.2.1                       Housing Stock                                          10
                                                                                                      1.6.6                  Access to Finance                     37
     1.2.2                       Housing Density                                         11
                                                                                                 2            Stakeholder Analysis                                 38
      1.23                       Housing Size                                           12
                                                                                                     2.1             Stakeholder in the Private Sector             40
    1.3                Affordability                                                    14
                                                                                                     2.2             Stakeholders in the Governmental and Non      57
     1.3.1                       Housing Cost and Selling Price                         15                           Governmental Sector
     1.3.2                       Ownership                                              22       3            Value Chain Scheme of the Housing Sector in East     75
                                                                                                              Jerusalem
     1.3.3                       Affordability                                          22
                                                                                                 4            Case Studies                                         78
    1.4                Housing Supply and Demand                                        25
                                                                                                 5            Conclusions and Recommendation                       87
     1.4.1                       Construction                                           26
                                                                                                 6            Annexes                                              91
     1.4.2                       Housing Supply and Demand Market                       28
                                 Analysis
    1.5                Profit Potential in the Housing Sector                           30

Real Estate and Housing Sector Opportunity Analysis - Al-Quds Economic Forum and the Office of                                                                     3
the Quartet.
Market Analysis on the Housing
Sector in East Jerusalem
Demographics

Real Estate and Housing Sector Opportunity Analysis - Al-Quds Economic Forum and the Office of
the Quartet.
Population
“Palestinians in East Jerusalem represent 9.1% of all Palestinians living in the occupied Palestinian territories. 64%
of the city’s Palestinian population is under the age of 30. Jerusalem has an annual growth rate of 1.84% which is
well below the West Bank rate of 2.66% per annum”

Population                                                                                                The population in Jerusalem governorate constitutes 9.1% of the total population
                                                                                                          of Palestine and 14.9% of the population in the West Bank. Whereas, the
According to the Palestinian Bureau of Statistics (PCBS), the total population of                         percentage of persons aged below 15 years in 2013 was 35.2% of the total
Arabs in Jerusalem governorate was estimated at 404,165 persons in 2013, of                               population, while those aged 60 years and above made up 6.7% of the total
whom 251,043 (62%) were in Area J1 and 153,122 were in Area J2.                                           population in Jerusalem governorate.
This contradicts the Jerusalem Institute for Israeli Studies (JIIS), which estimates                      The reported compound annual growth rate of Arabs residing in Jerusalem was
the Arab population in Jerusalem at 300,200 persons. This can be seen in the chart
                                                                                                          3% from 2000 until 2012, against the 1% of Jews. The population density was
below on the right. It is worth to mention that an accurate figure about the total                        1,182 (capita/Km2) by the end of 2013.
population is nearly impossible to find due to the dual lifestyle of Jerusalemites
                                                                                                                                              Figure 1
(East J. & WB).
The table below shows the neighborhood compounding East Jerusalem taking
into account locality J1 and J2.
                                                                                                                                                              CAGR: 3%
 Table 1: Palestinian Neighborhood in J1 and J2
 J1                                                   J2

 •    Beit Hanina             • Jabal Al – Mukabbir   •    Rafat                 • Hizma
 •    Sheikh Jarrah           • Ras Al-Amud           •    Mikhmas               • Beit Hanina Al Balad
 •    Shu’fat Refugees Camp   • As–Sawahira Al–       •    Qalandiya Camp        • Kharayib Umm al
 •    Wadi Al – Joz             Gharbiya              •    Qalandiya               Qatanna
 •    Shu’fat                 • Silwan                •    Beit Duqqu            • Beit Surik
 •    Bab Al-Sahira           • Beit Safafa           •    Jana                  • Beit Iksa
 •    Al’ Isawiya             • Ath–Thuri             •    Al Judaeira           • Anata
 •    Assuwwana               • Sharafat              •    Ar Ram & Dahiyat Al   • Al Ka’abina
 •    Jerusalem “Al - Quds”   • Sur Bahir                  Bareed                • A Za’ayyem
 •    At –Tur                 • Kufr A’qab            •    Beit’Anan             • Al ‘Eizariya
 •    Ash-Shayyah             • Um Tuba               •    Al Jib                • Abu Dis
                                                      •    Bir Nabala            • Arab Al Jahalin
                                                      •    Beit Ijza             • As Sawahira ash
                                                      •    Al Qubeiba              Sharqiya
                                                      •    Lahim                 • Ash Sheik Sa’d
                                                      •    Biddu                 • Jaba’
                                                      •    An Nabi Samwil

Real Estate and Housing Sector Opportunity Analysis - Al-Quds Economic Forum and the Office of                                                                                          6
the Quartet.
Population Movements
“Population Movements are mainly due to the availability of                                                                       Figure 2: Population Movement

more affordable houses either for rent or sale on one hand,
and the restriction to build within East Jerusalem on the other”

Population Movements
The population movements to outside of the municipal borders, represents one of
the major key demand drivers. These migration movements are presented since
the 80s, and are mainly due to the Israeli policies. In addition to this, there are two
other major factors boosting immigration to Ar Ram, Hizma and Abu Dis (which
represent principal final destinations of local movements):
• Lower Property Prices
• Restriction to build within East Jerusalem.
Nevertheless, since the second half of the 90s this flow reversed as result of the
enactment of the “Centre of Life Policy”, whereby Jerusalemites were required to
prove that they live within the borders of Jerusalem Municipality in order to
preserve their residency permits. This trend accelerated with the construction of
Separation Wall in 2003 as Jerusalemites feared the loss of their ID and
consequently, their access to the city.
This event not only impacted the actual population growth within municipal
borders but derived into a trend of unpermitted house construction. As
consequence, the Israeli Authorities developed and deployed harder restrictions,
tighter control mechanisms and stronger punitive measures.
The map on the right shows the internal migration from 2010-2012, represented
by persons by neighborhood. JIIS migration data shows a clear movement from
the central neighborhoods to the periphery, with neighborhoods beyond the wall
have the highest net migration. These movements are explained in depth on the
next slide.
                                                                                                 Source: IPCC 2013, Data From JIIS, Jerusalem Statistical Yearbooks 2012, 2013, Table V/15

Real Estate and Housing Sector Opportunity Analysis - Al-Quds Economic Forum and the Office of                                                                                               7
the Quartet.
Population Movements
“Population movement beyond the wall is encouraged by the accessibility to affordable houses within Municipal
boundaries while migration beyond the city boundaries is a consequence of the dual lifestyle”

Migration beyond the wall and city are the two major population movements                                    Population Movement beyond the City Boundaries
worth considering when discussing Real Estate and Housing.

                    Population Movement beyond the Wall                                          Households are moving to localities beyond the Jerusalem Governorate. This
                                                                                                 migration is a direct result of the dual lifestyle that most Jerusalemites live. The
                                                                                                 main destination is Ramallah and in the near future, Rawabi will probably also be
On the West Bank side of the Separation Wall, little to no enforcement of
                                                                                                 considered.
planning laws by the Municipality has enabled a proliferation of unpermitted
construction and with it attracted a large migration of families seeking an                      Since these movements are not official, they are not reported by the ICBS or the
affordable house within Municipal Boundaries.                                                    PCBS. Hence, they cannot be accurately estimated. One of the main reasons why
                                                                                                 it is hard to estimate the size of these migration flows is that Jerusalemites move
The total population beyond the wall remains inaccurate to date. Based on
                                                                                                 into Ramallah while registering at a family or household alibi in Jerusalem.
OCHA’s report (East Jerusalem Key Humanitarian Concerns, update Aug 2014),
Tens of thousands of Palestinian residents of East Jerusalem are physically                      The Government of Israel, through the ministry of Interior, monitors households
separated from the urban center by the Barrier. They must cross crowded                          and if it was discovered that a family lives outside the city limits, their residency
checkpoints to access health, education and other services to which they are                     will be revoked.
entitled as residents of Jerusalem.                                                              Over the years, this kind of migration has increased due to poor living conditions
More specifically, in the OCHA’s report (East Jerusalem Key Humanitarian                         (high densities and lack of public services) inside the neighborhoods beyond the
Concerns, update Dec 2012), it was estimated a total population of 55,000.                       wall. Nevertheless, poorer families that cannot respond to the increase of rents in
                                                                                                 Ramallah are forced to move back to neighborhoods within city limits. If housing
Moreover, based on data published by the JIIS, these population movements
                                                                                                 rents and selling prices in Ramallah continue to rise/fall, these trends are expected
represent 30% inter and intra city migration from 2010 to 2012.
                                                                                                 to be reinforced.
As stated by NGOs working in policy research and urban planning, zoning and
                                                                                                 In conclusion, it can be said that if it were not for the risk of residency revocation,
development, the growth in these neighborhoods is not sustainable. Moreover,
                                                                                                 the extent of migration would be greater.
there is a latent threat since there is a possibility that Israel Government will hand
over the control. In this scenario, residents will be at risk of losing residency
permits. This could trigger the return of thousands of households back inside the
city wall’s limits.

Real Estate and Housing Sector Opportunity Analysis - Al-Quds Economic Forum and the Office of                                                                                        8
the Quartet.
Characteristics of the Current
Housing Units

Real Estate and Housing Sector Opportunity Analysis - Al-Quds Economic Forum and the Office of
the Quartet.
Housing Stock
“Dwelling in Arab neighborhoods increased by 4.2 percentage points above the growth observed in Jewish
neighborhoods in the period between 2012 and 2013”
Table 2: Dwelling in J1 2011-2013
Housing Stock While the Arab population Area J1 Dwelling units
represents 37% of Jerusalem 2011 2012 2013
As stated in the “JIIS’s fact and trends: 2014”, in the end 2013, Jerusalem had a inhabitants, the proportion of Northern Neighborhoods 15,105 15,733 16,461
total of 208,770 dwellings which represents a slight increase of 2.2% since 2012. households is considerably lower Beit Hanina 6,193 6,762 7,192
Out of them: (24%. This is mainly due to the fact Shu'afat 3,744 3,751 3,829
• 158,620 apartments (76%) are located in Jewish neighborhoods (1.2% increase that Arab households typically Kafr'Aqab, Atarot 3,882 3,885 4,044
since 2012) include a greater number of persons
New Anata 1,286 1,335 1,396
(JIIS, 2014).
• 50,143 apartments (24%) are in Arab neighborhoods (5.4% increase since 2012 Central Neighborhoods 22,101 21,990 23,750
and with a compound Annual Growth rate of 4% between 2001-2013). The Northern and Southern Old City (Jews Quarter
5,266 5,321 5,578
neighborhoods are experiencing a Not Incl.)
faster growth caused by the Issawiyya 1,790 1,800 1,840
Figure 3: Dwelling in East Jerusalem increasing demand of areas in the At-Tur + As Sawana 4,075 3,676 4,231
outskirts of East Jerusalem which Wadi al Joz + Sheikh
Northern Neighbourhoods Central Neighbourhoods Southern Neighbourhoods 3,014 2,039 2,050
have better public services, Jarrah
23,750
22,101 21,990
CAGR: 3.7% infrastructure, and living conditions. Abu Tur 1,929 1,929 1,946
CAGR: 4.4%
The neighborhoods that Silwan 2,779 2,832 2,887
15,733 16,461 experimented a greater growth Ras al Amud + Wadi
3,248 3,413 4,245
15,105 Qadum
CAGR: 4.3% between 2012 -2013 are: At-Tur +
Bab A-Zahara,
As Sawana (15%), and Ras al Amud NA 980 973
9,835 9,932 Masudiya
9,123 and Wadi Qadum (24%). Southern Neighborhoods 9,123 9,835 9,932
It is worth highlighting that the Jabal Mukabber + As
4,257 4,072 3,903
Sawahra
neighborhood of Beit Hanina is the
Sur Bahir + Umm
largest with 7,000 housing units. 2,463 3,294 3,390
Tuba
Housing Units 2011 Housing Units 2012 Housing Units 2013 Beit Safafa + Sharafat 2,403 2,469 2,639
Source: JIIS, Jerusalem Statistical Yearbooks 2012, 2013, 2014
Total 46,329 47, 558 50,143
Real Estate and Housing Sector Opportunity Analysis - Al-Quds Economic Forum and the Office of 10
the Quartet.Housing Density
“In 2013, the average number of rooms per household was 3.7. 54.7% of households exceeded five members per
household while 25.1% consisted of 7 or more members”
Figure 4
Housing Density
According to JIISs’s “Jerusalem: trends and facts 2014”, there were 53,300 Arab
household in 2012 with an average size of 5.8 people. It is noteworthy that the
JIIS does not take into consideration that some of the growth is likely a result of
the increased usage of “alibi households”, and therefore indicative of outward
migration from the city.
Furthermore, 25% of Jewish households named one person, compared to only 4%
of Arab households. Households of six or more persons constituted 52% of the
total number of Arab households compared to 16% of the total number of Jewish
households. This can be seen in the table on the right.
Diving into the situational analysis of dwelling in East Jerusalem, the PCBS
reports that in 2013, the average number of rooms was 3.7. 54.7% of households
exceeded five members while 25.1% consisted of seven members or more.
On average, the housing density ranges from 1.5 to 1.9 persons per room
(depending on the source (PCBS or ICBS)) which represents a higher number
than all Palestinian cities in Israel and Palestine.
Source: JIIS, Jerusalem: Trends and Facts, 2014
Real Estate and Housing Sector Opportunity Analysis - Al-Quds Economic Forum and the Office of 11
the Quartet.Apartment Size
“Neighborhoods with the largest average apartment Figure 5
size are Beit Hanina, Shuafat and Beit Safafa”
Housing Size
Following the description of the housing market in East Jerusalem provided by
the JIIS (Fact and Trends, 2014), the average area of an apartment in Jerusalem
was 80 square meters (m2).
In neighborhoods with an Arab majority, the average is 76 m2. The smallest
average apartment size was found in the Muslim Quarter (45 m2), the Christian
Quarter (45 m2), the Armenian Quarter (61 m2) and Silwan (61 m2).
Within East Jerusalem, small apartments (60 m2 and below) are most common in
the old city (representing a percentage ranging from 71% - 100% of existing
units) followed by:
• Silwan ( in the range of 41% - 70% of existing units);
• Shuafat, Isawiyya, At-Tur, Sheik Jarrah, Wadi Al Joz, Abu Tor, Sawahira, Jabal
Mukabar, Sur Bahir, Uma Tuba, Beit Safafa and Sharafat (in the range of 21%
-40% of the existing units) and
• Beith Haninia, and Atarot (in the range of 0%-20% of existing units).
Regarding the estimation of large apartments (size 120 m2 and above) in
Jerusalem, as censored in 2012 and after deep studying of the status of housing in
East Jerusalem, it can be observed that large size apartments are most common in
Beit Hanina and Shuafat, Abu Tor, At-Tur and within Old City ranging from 6%
to 10% from the total existing housing units.
Less than 5% can be found in Atarot, Silwan , Sheik Jarrah, Sawahira, Jabal Al
Mukkaber, Sur Bahir, Bet Zafafa and Sharafat.
Source: JIIS, Jerusalem: Trends and Facts, 2013
Real Estate and Housing Sector Opportunity Analysis - Al-Quds Economic Forum and the Office of 12
the Quartet.Apartment Size
Figure 6
“Neighborhoods with the largest average apartment size
are Beit Hanina (97 m2), Kafr 'Akb (91 m2), New Anata
(88 m2), and Beit Safafa (87 m2)”
120 Figure 7: Average Area of Dwelling in m2 per Neighborhood
100 97
91
88 87
83 85
80 82
80
80 75 76 77
71
61 61
60
45 45
40
20
Source: JIIS, Jerusalem: Trends and Facts, 2014 Source: JIIS, Jerusalem: Trends and Facts, 2014
Real Estate and Housing Sector Opportunity Analysis - Al-Quds Economic Forum and the Office of 13
the Quartet.Affordability Real Estate and Housing Sector Opportunity Analysis - Al-Quds Economic Forum and the Office of the Quartet.
Affordability
“The primary cause of high selling prices is the shortage of land available for construction. It typically ranges
from 30%-40% from the overall cost of dwelling”

Housing Cost and Selling Price                                                                   Furthermore, it can also be observed from the evolution of prices in the past 14
                                                                                                 years which cost of building (understood as cost of labor and materials) does not
Over the last years and as result of housing shortage, apartment prices have
                                                                                                 dramatically affect the housing prices. In fact, the rise in land prices is the main
continuously been rising in Jerusalem.
                                                                                                 critical factor. And while this is a global phenomenon in Israel, in East Jerusalem
In retrospect, the evolution of housing prices indicates that nominal prices (prices             it plays the major role.
not adjusted for changes in the Consumer Price Index (CPI)) decline from the
                                                                                                 The results of the survey and a series of structured interviews conducted among
year 2000 to beginning of 2008. During this period, the change in the housing
price trend experienced a continuous ascent that lasted up till today.                           key real estate developers in East Jerusalem suggest that the average land cost in
                                                                                                 US Dollar per square meter is US$ 742.5 in neighborhoods with higher demand.
                                                                                                 It can range from
   Figure 8
                                                                                                 • US$ 300 – 500 per square meter in neighborhoods with low demand such as
                                                                                                   those located along the city limits (Issawiya, A-Tur, and Ras al Amud among
                                                                                                   others).
                                                                                                 • US$ 500-1,000 in neighborhoods such as Beith Hanina, Shuafat, Sheik Jarrah,
                                                                                                   Wadi Joz and Beith Safafa and Sharafat).
                                                                                                 The cost of land is equally distributed among the available units. It typically
                                                                                                 ranges from 30%-40% of the overall cost of dwelling. Therefore, any increase in
                                                                                                 the value of land, it would drastically affect the selling price.
                                                                                                 In conclusion, it can be said that the increase of cost of land is attributed to :
                                                                                                 • Shortage of land for construction
                                                                                                 • Private ownership of lands
                                                                                                 • Returns of Jerusalemites, after the completion of the Separation Wall in 2006.
                                                                                                 • Political Unrest
Source: State of Nation Report, 2014 TAUB Center for Social Policy Studies in Israel

Real Estate and Housing Sector Opportunity Analysis - Al-Quds Economic Forum and the Office of                                                                                        15
the Quartet.
Affordability
“The second cause for high selling prices is represented in difficulties in obtaining building permits. It typically
ranges from 12% - 14% from the overall cost of dwelling”
Table 3
For instance, assuming a land area of 1 dunum (1,000m2) with an average of 742 USD/m2 and a building ratio of
75%, Developers would have an available area of 750m2 and would be able to build up to 5 apartments of 150m2; # Building Permits Cost Breakdown USD/m2
or, up to 7 apartments of 100m2; or up to 10 apartments of 76m2. 1 Registration 9
The cost of land per unit varies according to the size. Hence, for apartments of 150m2, the proportion of the cost 2 Water Fees 18
would be about 148,000 US Dollars; for dwelling of 100m2 would be approximately 108,000 US Dollars; and for
units of 76m2, about 75,000 US Dollars. 3 Water Fees and services 3
In addition to the above, the cost of municipality building permits is considered the second reason for high selling 4 Sewage 11
prices. This fluctuates between 12% and 14% for each housing unit. The table on the left provides a detailed structure
5 Land fees for water usages 3
of the building permits. It is estimated to amount to 336 USD/m2. And hence, for a 150m2 apartment, the building
permit would cost about 50,000 US Dollars; for a dwelling of 100m2 about 30,000 US Dollars and for small 6 Land fees for sewage usages 8
apartments (76m2), it would cost about 25,000 US Dollars.
7 General services 5
Together, the cost of land and building permits, represent up to 49%-59% of the total housing cost.
8 Antiques 4
In comparison to the above, the cost of building is estimated to be about US Dollar 850 per square meter. It could
fetch up to 127,000 US Dollars for apartments of 150m2; 85,000 US Dollars for dwelling sized 100m2; and, 65,000 9 Excavation 8
US Dollars for units of 76m2. It represents 30% - 45% of the total housing cost.
10 Electricity 1
In conclusion, since the cost of building index experimented a stable growth in the last 14 years and it appears there
11 Waste and Garbage 5
is no correlation between this and the Housing Price Index, the trigger for the increase in the housing selling price is,
logically, the cost of land. Two studies ((Zussman, 2013) and Eckstein et al. (2012)) cited by the TAUB Center for 12 Concrete testing 8
Social Policy Studies in Israel demonstrate that the primary cause of the housing price increase is the shortage of land
for construction, rather than the impact of any other inputs; and, that commercial real estate prices have not increased 13 Taxes 211
alongside residential prices, as commercial real estate has not faced similar permit constraints to residential real 14 Roads 43
estate.
Total 336
Source: Al Quds holding
Real Estate and Housing Sector Opportunity Analysis - Al-Quds Economic Forum and the Office of 16
the Quartet.Affordability
Assumption Box Table 4
Building permits for non Construction according to International Infrastructure (architectural retaining
350 ILS/USD 3.8 Land Area in m2 1,000 Av. USD/m2 Land 742 100
collective development 336 and Municipal Standard (USD/m2 ) walls, electricity, gas) - USD/m2
Eng. Supervision over Developing a joint building layout
Land Purchasing taxes in
2% Av. Apartment Size m2 (A) 150 (over amount required 2% Building Ratio 75% Land Cost plan (Collective Development) - 13
Collective Project 742,000
for implementation) USD/m2
Building inspector Land Cost attribute to
Land Purchasing taxes in Building Area in
5% Av. Apartment Size m2 (B) 100 (over amount required 2% 750 building area in Project Accident Insurance USD/m2 7
Non-Collective Project m2 989
for implementation) USD/m2
Administrative and
Legal Fees for transferring
Financial Mgt (over
ownership, signing 2% Av. Apartment Size m2 (C) 76 5% Units to Build (A) 5 land Cost over Unit A Contingency on Cost - USD/m2 33
amount required for 148,400
contracts, registration implementation)
Accounting and Taxes
Adjusted Land Zoning and Increasing
House Finishing (USD/m2 ) 500 Profit Margin (%) 45 (over amount required 3% Units to Build (B) 8 land Cost over Unit B 20
98,933 building ratio - USD/m2
for implementation)
Units to Build (C) 10 land Cost over Unit C
75,189
As a result of the structured interviews (combined with survey techniques) among The model adopted also suggested that developers who have built without third
key players of East Jerusalem housing sector, it was possible to build an parties (contractors and/or construction companies), have significant savings and
assumption box (displayed above) gathering the “Key Cost Indicators” incurred therefore, have better profit margins.
by property developers.
Table 5 Total Amount Required for Implementation
It is worth mentioning that this calculation refers to a Non-Collective Housing Aprt. 150m2 Aprt. 100m2 Aprt. 76m2
Development scenario (collective development indicates groups of households USD USD USD
built on a single site together). The Union for Jerusalem Housing Assembly Individual / Property Developers (without third
357,696 238,464 181,233
suggests that collective development benefit for better cost in terms of land (400 parties)
USD/m2), and building permits (233 USD/m2). Individuals / Property Developers (with thirds parties) 400,619 267,080 204,115
Savings in Administration Cost 42,924 28,616 21,748
Real Estate and Housing Sector Opportunity Analysis - Al-Quds Economic Forum and the Office of 17
the Quartet.Affordability
“The cost price of the upcoming supply of new multi-family residential, which has an average size of 110m2, is
expected to fetch up between 260,000 – 290,000 US Dollar per unit”
Table 6 Table 7 Distribution
Cost Breakdown for building and transferring
housing unit to buyers over the Total Cost
Aprt. 150m2 Aprt. 100m2 Aprt. 76m2 Developers with Developers with
Third Parties Non-Third Parties
USD USD USD
Citizen Contribution in Purchasing the Land 148,400 98,933 75,189 Citizen Contribution in Purchasing the Land 37.0% 41.5%
Purchasing Taxes in Non-Collective Projects 7,420 4,947 3,759 Purchasing Taxes in Non-Collective Projects 1.9% 2.1%
Legal Fees for transferring Ownership, signing contracts, Legal Fees for transferring Ownership, signing contracts, registration a
2,968 1,979 1,504 0.7% 0.8%
registration a relevant authorities relevant authorities
Permits including architectural designs and all relevant fees Permits including architectural designs and all relevant fees (water,
(water, sewage, roads, improvements, etc)
50,408 33,605 25,540
sewage, roads, improvements, etc) 12.6% 14.1%
Infrastructure including architectural retaining walls, Infrastructure including architectural retaining walls, electricity
15,000 10,000 7,600 company, gas pipes, etc 3.7% 4.2%
electricity company, gas pipes, etc
Construction according to international standards and safety Construction according to international standards and safety
52,500 35,000 26,600 requirements imposed by the Municipality 13.1% 14.7%
requirements imposed by the Municipality
House Finishing 75,000 50,000 38,000 House Finishing 18.7% 21.0%
Project Accident Insurance 1,000 667 507 Project Accident Insurance 0.2% 0.3%
Contingency on Cost 5,000 3,333 2,533 Contingency on Cost 1.2% 1.4%
Total Amount required for Implementation 357,696 238,464 181,233 Administration Cost for Implementing Company 10.7% -
Administration Cost for Implementing Company (Third Party
42,924 28,616 21,748
constructor)
• The Price Cost of an apartment in m2 can range from 2,385 USD/m2 to 2,670
Eng. Supervision 7,154 4,769 3,625 USD/m2.
Building inspector 7,154 4,769
3,625 • The Land Cost represents the major proportion of the cost, followed by the cost
of building (Construction according to international and Municipal standards
Administrative and Financial Mgt 17,885 11,923 9,062 and House Finishing). The Cost of Building Permits rank the third.
Accounting and Taxes 10,731 7,154 5,437 • It is worth mentioning that this assumption and calculation have been made as
an indication of market price, and thus, it can vary from one project to another.
Total Cost of Each Housing Unit 400,619 267,080 204,115
Real Estate and Housing Sector Opportunity Analysis - Al-Quds Economic Forum and the Office of 18
the Quartet.Affordability
“Today, the average price of privately owned dwelling in the city of Jerusalem (West and East) is US Dollar
385,940”
In retrospect, the trend of housing prices has had a steady growth with a CAGR of In subsequent years, a lower price growth was observed, and while the value of
7.3% over the past ten years. Price developments with respect to housing between apartments with 1.5-2 rooms is expected to decrease, the price of those with 2.5-3
2.5-3 rooms can be considered more encouraging for property developers, given rooms will increase slowly. Today, the average price of privately owned dwelling
the differential of 0.7 and 1.5 percentage points, compared to the value of in Jerusalem (West and East) is US Dollar 385,940.
dwellings between 1.5-2 and 3-4.5 rooms respectively Figure 10
As mentioned above, the housing prices began to increase in 2008 but it was not Annual Percentage change of Privately Owned Dwelling in
until 2010 when an outstanding leap of 17.1% was observed over the previous Jerusalem 2004-2013
year.
20.0%
1.5-2 Rooms
The chart below provides a useful image of the increase of the dwelling price in 15.0%
2.5-3 Rooms
Thousands of US Dollar per number of rooms. 10.0%
Figure 9 3.5-4 Rooms
5.0%
Average Price of Privately Owned Dwelling in Jerusalem 0.0%
2003-2013 (Thousands USD) 2004 2005 2006 2007 2008 2009 2010 2011 2012 2013
600.0 CAGR:7.3% -5.0%
500.0
Figure 11
400.0
Average Prices of Privately Owned Dwellings in Jerusalem
300.0
(Thousand USD), 2013 $474.94
200.0 $382.14
$300.75
100.0
.0
2003 2004 2005 2006 2007 2008 2009 2010 2011 2012 2013
1.5-2 Rooms 2.5-3 Rooms 3.5-4 Rooms 1.5-2 Rooms 2.5-3 Rooms 3.5-4 Rooms
Source: JIIS, Table X/11 - Average Prices of Privately Owned Dwellings in Jerusalem , Tel Aviv - Yafo and Haifa, by Number of Source: JIIS, Table X/11 - Average Prices of Privately Owned Dwellings in Jerusalem , Tel Aviv - Yafo and Haifa, by Number of
Rooms, 1988-2013 Rooms, 1988-2013
Real Estate and Housing Sector Opportunity Analysis - Al-Quds Economic Forum and the Office of 19
the Quartet.Affordability
Figure 12
“Observing the average cost of small apartments in East
Jerusalem in comparison to the average price they are
sold at, a profit margin of 45% is roughly estimated”
Another aspect that must be considered is the large price difference that exists
between neighborhoods on either side of the Wall of Apartheid.
• Beyond the wall (such as Kafr ‘Aqab and ‘Anata have affordable prices of Average Prices of Privately Owned
between US$50-120,000). Dwellings in USD
• Within the wall, prices can be summarized into three location-based ranges: $400,000
o Central (such as Sheikh Jarrah and Wadi Joz where average prices range $350,000
between US$450-500 thousand) $300,000
o Northern (such as Beit Hanina and Shu’fat and the price ranges between $250,000
US$300-450 thousand) $200,000
o Southern (such as Jabal Mukabber and Sur Bahir with a price range between
$150,000
US$200- 300 thousand)
$100,000
An observation made over the prices in the localities beyond the wall and within $50,000
Jerusalem limits was that the housing units can cost 90% cheaper. This is possible
$-
due to the following: A lower land Cost; A high density construction; and,
Municipal license to build (permits) is not required.
The chart on the right shows the results of the analysis of data obtained from the
data collection process. Based on average apartment size per neighborhood, the
average selling price is around 260,000 US Dollar while the average cost is
180,000 US Dollar. This indicates a profit margin of 45%. These figures are
supported by IPCC estimates, 2013. It is worth mentioning that these percentages
can vary extremely from one neighborhood to the other.
In the next slide, the cost and selling price of new constructions of apartments
sized 100m2 and 76m2 is shown
Source: Dimensions Consulting Analysis and IPCC
Real Estate and Housing Sector Opportunity Analysis - Al-Quds Economic Forum and the Office of 20
the Quartet.Affordability
“Builders are selling new dwellings of 100m2 at an average price of 350,000 US Dollar”
Table 8 Table 9
Non-Collective Development Figures Breakdown Cost for building and transferring housing unit of Non-Collective Development Figures
Breakdown Cost for building and transferring housing unit of
100m2 to buyers Cost Price in USD Selling Price in USD 76m2 to buyers Cost Price in USD Selling Price in USD
Citizen Contribution in Purchasing the Land 98,933 143,453 Citizen Contribution in Purchasing the Land 75,189 109,025
Purchasing Taxes in Collective Projects 4,947 7,173
Purchasing Taxes in Collective Projects 3,759 5,451
Legal Fees for transferring Ownership, signing contracts,
1,979 2,869 Legal Fees for transferring Ownership, signing contracts,
registration a relevant authorities 1,504 2,180
registration a relevant authorities
Permits including architectural designs and all relevant fees Permits including architectural designs and all relevant fees
33,605 48,728 25,540 37,033
(water, sewage, roads, improvements, etc) (water, sewage, roads, improvements, etc)
Infrastructure including architectural retaining walls, electricity
Infrastructure including architectural retaining walls, electricity 7,600 11,020
10,000 14,500 company, gas pipes, etc
company, gas pipes, etc
Construction according to international standards and safety
26,600 38,570
Construction according to international standards and safety requirements imposed by the Municipality
35,000 50,750
requirements imposed by the Municipality House Finishing 38,000 55,100
House Finishing 50,000 72,500
Project Accident Insurance 507 735
Project Accident Insurance 667 967
Contingency on Cost 3,333 4,833 Contingency on Cost 2,533 3,673
Total Amount required for Implementation 238,464 345,773 Total Amount required for Implementation 181,233 262,787
Administration Cost for Implementing Company (Third Party Administration Cost for Implementing Company (Third Party
28,616 41,493 21,748 31,534
constructor) constructor)
Eng. Supervision 4,769 6,915 Eng. Supervision 3,625 5,256
Building inspector 4,769 6,915 Building inspector 3,625 5,256
Administrative and Financial Mgt 11,923 17,289 Administrative and Financial Mgt 9,062 13,139
Accounting and Taxes 7,154 10,373 Accounting and Taxes 5,437 7,884
Total Cost of Each Housing Unit 267,080 387,265 Total Cost of Each Housing Unit 202,980 294,322
Real Estate and Housing Sector Opportunity Analysis - Al-Quds Economic Forum and the Office of 21
the Quartet.Affordability
“By international standards, this price is unaffordable in comparison to average salaries of Palestinians in East
Jerusalem”
Ownership Affordability
Nonetheless, based on ICBS data, the percentage of ownership in East Jerusalem By international standards, affordability of housing is mainly defined by income
has remained stable along the years. Nowadays, this percentage has increased and living conditions.
severely where 83.9% of Palestinians own housing units against 16.1% who rent Figure 14
housing units (PCBS, 2014). The Foundations for Affordable Housing
Figure 13
Average Selling Price of Housing Units in Thousand USD
400.0
60% 64%
350.0 % ownership
52%
47%
300.0 44%
250.0
200.0
150.0
100.0
50.0
Most agencies and experts agree that housing is financially affordable if it does
.0 not absorb more than 30% of household income. Furthermore, international
2007 2008 2009 2010 2011
benchmark states that the lower the income, the higher the proportion of income
spent on housing.
It is worth mentioning that these exorbitant rates of housing prices could also be
considered a positive socioeconomic factor which enable households to Therefore, in East Jerusalem, where the Jerusalemites’ average income is $1,722
accumulate assets while also fostering their community involvement (TAUB, (IPCC, 2013) and housing prices are above US Dollar 300,000, it is estimated that
Andrews and Sanchez (2011)). the average percentage of income spent on housing could reach up to 59%.
Real Estate and Housing Sector Opportunity Analysis - Al-Quds Economic Forum and the Office of 22
the Quartet.Affordability
“ICBS data suggests that the housing prices grew by 19.2% between 2007- 2011 while in the same period,
incomes grew by 12.3% only”
In conclusion, these prices are unaffordable in comparison to average salaries. Furthermore, addressing the affordable housing gap will likely take on increasing
This result is expected as during the period between 2007 to 2012, the average urgency as the number of affected households grows and the negative spillover
wage in East Jerusalem grew at a much lower rate than the average housing price. effects multiply.
In addition to the above, not only should affordable housing be inexpensive but A market-based approach that creates value while reducing housing costs was
all housing, regardless of cost, should be: developed by McKinsey & Company in 2014 with the aim of addressing the
global affordable housing challenges.
• In good condition (no peeling paint and broken walls, electrical and plumbing
work, no broken glass windows, which open and close well; railings and stairs The proposed solution is one of the ascending goals, similar to Maslow’s
solid; maintenance; and, clean hallways among others). hierarchy of needs, with a four-tiered plan targeted towards households earning
80% or less of the median income for any given region. It sets its foundation on
• Big enough for the people who live there.
the following:
• Free of hazardous materials.
• Securing land for affordable housing at the right location.
• Safe.
• Developing and building housing at lower cost
• Suitable for residents, especially the elderly and people with disabilities.
• Operating and maintaining properties more efficiently.
• In appropriate areas (affordable housing, should not be automatically built in
• Improving access to financing for home, purchases, development, and rental
less desirable areas of the city or community).
assistance.
• Reasonably close to shopping centers, public transportation, recreation and
social services and health.
An important social impact worth highlighting in regards of Jerusalemites’
welfare is that families with no decent houses have poorer health outcomes;
children do less well in school and tend to drop out earlier; and unemployment
and under-employment rates are higher.
Real Estate and Housing Sector Opportunity Analysis - Al-Quds Economic Forum and the Office of 23
the Quartet.Affordability
Figure 15
“The model relies on community
engagement, gathering funding, appropriate delivery of
housing models and creation of governmental
infrastructure to sustain housing”
Although this model in its entirety may not be applicable to East
Jerusalem due to economic and political constraints; the maturity of the
private sector; and, the absence of an effective credit system for
Palestinians, this model produces a set of strategic thinking and
innovative solutions and its components can be articulated based on the
operating context among property developers.
In regards to the two major obstacles for the housing sector in East
Jerusalem (shortage of land and access to finance), it can be read from the
McKinsey’s model, the following:
Unlocking land supply: Government land could be released for
development or sold to buy land for affordable housing. And private land
can be brought forward for development through incentives such as
density bonuses—increasing the permitted floor space on a plot of land
and therefore, its value. In return, the developer must provide land for
affordable units
Lowering financing costs for buyers and developers: Improvements in
underwriting would help banks safely make more housing loans to lower-
income borrowers; contractual savings programs can help such buyers
accumulate down payments and therefore finance purchases with smaller
and less risky loans. Such programs can also provide capital for low-
interest mortgages to savers, and governments could help cut the
financing costs of developers by making affordable housing projects that
are less risky—for instance, by providing a guarantee of finished unites to
Source: McKinsey & Company buyer or tenants.
Real Estate and Housing Sector Opportunity Analysis - Al-Quds Economic Forum and the Office of 24
the Quartet.Housing Supply and Demand Real Estate and Housing Sector Opportunity Analysis - Al-Quds Economic Forum and the Office of the Quartet.
Housing Supply and Demand
“Many critics maintain that the Israeli government is promoting Jewish majority in the city. Nevertheless, East
Jerusalem has witnessed considerable urban development over the years”

Construction                                                                                     In 2013, 2,713 dwellings were sold in Jerusalem which is 74% greater than the
                                                                                                 number in 2012. The percentage of sold units is only slightly superior (only 4%
As stated in the JIIS’s Fact and Trends: 2014 report, in 2013, construction in
                                                                                                 difference) in relation to the overall new dwelling available in Jerusalem. The
Jerusalem city was initiated on 3,442 housing units (significantly higher than the
                                                                                                 overall supply of new dwellings in Jerusalem grew from 7,311 in 2012 to 9,885
number in 2012 (2,470) and 2011 (2,360)), while 2,430 residential units were
                                                                                                 residential units.
completed (38% more than the previous year).
                                                                                                 Furthermore, while the number of homes increased in Jerusalem as a whole, in East
The chart below shows a comparison between new dwellings sold (in which
compound annual growth reached up to 17.2%) and new dwellings for sale at the                    Jerusalem, the trend is reversed. The housing supply has continued to fall far below
                                                                                                 the level required to meet either demand or need. Studies presented by the IPCC
end of the period ( in which compound annual growth was 41.6%).
                                                                                                 suggest that between 2001-2010, there was a shortfall of over 3,800 units.
                                                Figure 15
                                                                                                 The supply of housing units in East Jerusalem takes on a political and cultural
14,000
                                                                   CAGR: 41.6%                   nuance due to the Israeli Settlements Policy. Between 2010-2013, the number of
12,000                                                                                           building permits in Palestinian Neighborhoods reached 1,449 while for the
                                                                                                 settlements neighborhoods, it reached up to 2,669 permits in the same period
10,000
                                                                                                 (Foundation for Middle East Peace, Bimonthly Report Mar-Apr 2014). This
  8,000                                                                                          indicates that the annual average of permits issued for Palestinian neighborhoods is
                                                                   CAGR: 17.2%

  6,000                                                                                          “362” .

  4,000                                                                                          Many critics maintain that the Israeli government is promoting Jewish majority in
                                                                                                 the city. In fact, the Israeli “Master Plan” mission statement states that “it is an
  2,000                                                                                          inclusive Plan aiming to develop the city of Jerusalem as a capital of Israel and an
                                                                                                 Israeli Metropolitan Center, preserving the image of the city, and the standard of
               2005        2006       2007   2008     2009     2010      2011     2012   2013    living of all its residents”. Nevertheless, despite land and development rights
                                                                                                 controversy, East Jerusalem has witnessed considerable urban development over the
                        New dwellings for sale at the end of the period in Jerusalem
                                                                                                 years. To date, and since 1995, urban planning of Jerusalem envisions 95,000
                        New dwellings sold during the period in Jerusalem                        residential units by 2020. However, there is another updated version of Jerusalem
 Source: JISS: Trend and Facts 2014
                                                                                                 Master Plan 2000 that is drafted but not yet approved.

Real Estate and Housing Sector Opportunity Analysis - Al-Quds Economic Forum and the Office of                                                                                    26
the Quartet.
Housing Supply and Demand
Figure 16
Figure 17
2001-2004 – 440
building permits
were issued in East 2005-2009 – 222 building
Jerusalem permits were issued in East
(Palestinian) Jerusalem (Palestinian)
Source: Foundation for Middle East Peace, Bimonthly Report Mar-Apr 2014, Map: © Jan de Jong Source: Chat from Foundation for Middle East Peace, Bimonthly Report Mar-Apr 2014.
Real Estate and Housing Sector Opportunity Analysis - Al-Quds Economic Forum and the Office of 27
the Quartet.Housing Supply and Demand
“An additional 2,590 dunums of new housing areas are expected to be added to East Jerusalem in response to
the Palestinian population growth”
In the master plan 2000, it was estimated that the population in East Jerusalem The residential units to be developed to respond to the need of the Jerusalemites’
would grow by an additional 92,000 persons to reach 380,000 inhabitants as a households is calculated by comparing trends of housing unit occupied and
result of the natural population growth and Jerusalemites migration back to the households, as follows:
neighborhoods within the Separation Wall. And consequently, an additional of Housing Units
2,590 dunums of new housing areas are expected to be added to East Jerusalem.
While in 2013 there were 5.4% more residential units than the previous year in
In addition to supply being limited, not all the built housing units are legal ((at East Jerusalem, considering the uncertainty of residential growth, the annual
least 302 structures have been demolished and more than 665 people were average growth rate of Jerusalem as a whole city which is 2.2% will be applied
forcibly displaced in East Jerusalem between the years 2011 – 2014 (OCHA and 2013 figures will be assumed for 2014.
2014). In retrospect, the number of units permitted for construction from 2001 to
Table 10
2010 were only 3,823 representing just 30% of new construction. 2012 2013
The Jerusalem 2000 Outline Plan estimated the presence of 15,000 unpermitted Housing Units in J1 47,558 50,143
units at the time of its writing in the early 2000s. IPCC estimates that unpermitted Av. Annual Growth in City of Jerusalem (West and East) (%) 2.2
housing must now total somewhere between 20,000 - 25,000 units, or 42-52% of
housing stock in East Jerusalem. 2014 2015 2016 2017 2018 2019 2020
The situation of unpermitted housing has been aggravated since the construction Estimated Housing Unit 50,143 51,246 52,374 53,526 54,703 55,907 57,137
of the Separation Wall as the Israeli Authorities have stopped all enforcement of
building laws in areas beyond the wall. This has greatly increased the supply of Households
housing in these areas. Municipality data shows that between 2006-10 Kafr ‘Aqab
The total population of East Jerusalem (J1), as estimated by the PCBS 2014,
alone accounted for 20% of residential construction in East Jerusalem.
reached 251,043 and grow at an average annual rate of 3%. Additionally, the
Housing Supply and Demand Market Analysis average household is expected to be 4.5 (PCBS 3.7%; JIIS 5.3%)
A precise estimate on housing need and supply requires a set of specific Table 11
demographics and housing data for East Jerusalem that is not available. And 2014 2015 2016 2017 2018 2019 2020
therefore, based on the approach and assumption followed, the figures could vary. Population 251,043 266,332 274,321 282,551 291,028 299,758 308,751
Households 55,787 57,461 59,185 60,960 62,789 64,673 66,613
Real Estate and Housing Sector Opportunity Analysis - Al-Quds Economic Forum and the Office of 28
the Quartet.Housing Supply and Demand
“The shortfall of dwelling will amount to approximately 70,000 residential units in 2020”
Figure 18
Vacancy Rate 80,000
The vacancy rate is a value calculated as the percentage of all available units in 70,000
a rental or on sale property that are vacant or unoccupied. IPCC suggest a 60,000
vacancy ratio of 4%. 50,000
Table 12 40,000
2014 2015 2016 2017 2018 2019 2020
30,000
Required Housing Units 58,019 59,759 61,552 63,399 65,301 67,260 69,278 20,000
10,000
-
The model suggests that from 2014 to 2020, the shortfall of dwelling will amount 2014 2015 2016 2017 2018 2019 2020
to 69,532 residential units; the annual average supply would shrink to 1,166
units while the annual average of housing needs would amount up to 10,276 units. Total Supply of Housing Units Shortfall of Housing Units
Table 13 2014 2015 2016 2017 2018 2019 2020
Estimated Housing Units in J1 50,143 51,246 52,374 53,526 54,703 55,907 57,137
Population J1 251,043 266,332 274,321 282,551 291,028 299,758 308,751
Av. Household Size 4.5
Households 55,787 57,461 59,185 60,960 62,789 64,673 66,613
Vacancy Rate 4%
Units Required 58,019 59,759 61,552 63,399 65,301 67,260 69,278
Shortfall of Housing Units 7,876 8,513 9,179 9,873 10,597 11,353 12,141
Real Estate and Housing Sector Opportunity Analysis - Al-Quds Economic Forum and the Office of 29
the Quartet.Profit Potential in the Housing Sector Real Estate and Housing Sector Opportunity Analysis - Al-Quds Economic Forum and the Office of the Quartet.
Profit Potential
“Higher prices and therefore, better profit margins can be founded in the neighborhoods of Bet Haninia,
Shuadat, Sheikh Jarrah and Bet Safafa”
                                                  Figure 19
                                                                                                 Table 14
$400,000                          Av. Housing Cost      Av. Housing Selling Price                                                          As a reminder, the graph on the left
                                                                                                 Neighborhood                     Av. m2   provides an indication of housing
$350,000                                                                                                     Kafr 'Aqb, Atarot     91
                                                                                                                                           selling prices relative to its cost.

                                                                                                                   Bet Hanina      97
                                                                                                                                           Selling prices of new dwellings are
$300,000                                                                                                                                   orbited in the central area of the city.
                                                                                                                      Shu'afat     83
                                                                                                                                           They could reach up to USD 340,000
$250,000                                                                                                           New Anata       88      for apartments of 80m2. These prices
                                                                                                                      Isawiyya     71      are an indication of the lifestyle that is
$200,000                                                                                                                                   in    these      neighborhoods.      Most
                                                                                                       At-Tur, Mount of Olives     80
                                                                                                                                           international institutions, consulates and
$150,000                                                                                            Wadi Al-Joz, Sheikh Jarrah     80      ministries are located in Sheikh Jarrah.

                                                                                                      Bab A-Zahara, Mas'udiya      75
                                                                                                                                           On the other hand, the demand for
$100,000                                                                                                                                   neighborhoods in northern East
                                                                                                    Old City - Moslem Quarter      45
                                                                                                                                           Jerusalem (Shuafat and Beit Hanina)
                                                                                                   Old City - Armenian Quarter     61      has grown exponentially, and prices
 $50,000
                                                                                                                                           could reach up to USD 350,000 for
                                                                                                   Old City - Christian Quarter    45
      $-                                                                                                                                   apartments of 94m2.

                                                                                                                        Silwan     61
                                                                                                                                           In the south of East Jerusalem, the
                                                                                                                                           housing prices decline drastically,
                                                                                                                      Abu Tor      76
                                                                                                                                           except in Bet Safafa on which demand
                                                                                                                Ras Al-'Amud       77      tends to increase gradually.
                                                                                                                Jabal Mukabar      82      The demand is driven by the social
                                                                                                        Sur Baher + Um Tubba       85      stratum of residents, access to
                                                                                                                                           infrastructure and better public services.
                                                                                                                    Bet Safafa     87

Real Estate and Housing Sector Opportunity Analysis - Al-Quds Economic Forum and the Office of                                                                                    31
the Quartet.
Profit Potential
“The estimate profit margin is an average of 45% accounting from US Dollar 80,000. In neighborhoods with
high demand, it could reach 75%”
Figure 19
$160,000 Profit in USD Table 15 As expected, the most attractive neighborhoods
for property developers’ investment are Beit
Neighborhood Profit
Hanina, Shuafat, Bet Safafa and above all, Wadi
$140,000 Kafr 'Aqb, Atarot 25%
Al Joz-Shiekh Jarrah. The av. Profit in these
Bet Hanina 50% locations could exceed 60% per unit.
$120,000 Shu'afat 68% Generally speaking, the profit margin is high in
New Anata 10% the East Jerusalem Real Estate market. The main
$100,000 Isawiyya 10% reasons that explain the high percentage is due to:
At-Tur, Mount of Olives 40% • High cost and shortage of land available for
$80,000 constructions.
Wadi Al-Joz, Sheikh Jarrah 75%
• Limited number of neighborhoods with basic
$60,000 Bab A-Zahara, Mas'udiya 50% infrastructure which boosts a high concentrated
demand.
Old City - Moslem Quarter 10%
$40,000 • A greater demand above the current supply
Old City - Armenian Quarter 25% resulted from the natural population growth,
immigration movements from places beyond
$20,000 Old City - Christian Quarter 25% the wall and the impossibility to build more
Silwan 40%
housing units.
$-
Abu Tor 40% • Large number of legal, administrative and
Ras Al-'Amud 40% engineering obstacles faced by property
developers.
Jabal Mukabar 40%
• The outstanding period of constructions that can
Sur Baher + Um Tubba 40%
reach up to seven years.
Bet Safafa 60%
Real Estate and Housing Sector Opportunity Analysis - Al-Quds Economic Forum and the Office of 32
the Quartet.Profit Potential
“ The estimated profit from the construction and sale of new dwelling in East Jerusalem would oscillate in
average from 60,000 US Dollar to 140 Million US Dollar”
The estimated accumulative supply of housing, in the period 2015-2020, is In addition, different profit percentages have been applied to draw different
estimated to reach up to 70,000 units, for a given percentage of growth. The scenarios that could be related to locations with higher and lower demand.
absence of data makes it impossible to determine the future actual supply in terms In accumulative terms, the profit can oscillate between 380 Million US Dollar and
of m2 and location. Therefore, it has been assumed that the average of apartment 890 Million US Dollar.
size would remain the same per neighborhood
Table 16 and Figure 20
2014 2015 2016 2017 2018 2019 2020
Estimated Housing Units 50,143 51,246 52,374 53,526 54,703 55,907 57,137
Estimated Supply 1,103 1,127 1,152 1,178 1,203 1,230
Profit Potential in USD
By 2020, it is estimated that there will be about 60,000 housing units in the Arab
$180,000,000
neighborhoods of East Jerusalem. The model suggests that in the upcoming six years, about
$160,000,000
7,000 new dwellings will be delivered . The profit margin of these new units will be related to
$140,000,000 the location, size and complexity of the projects.
$120,000,000
• In the following neighborhoods, housing projects will benefit of a profit margin up to 30%,
$100,000,000
in the best scenario: Atarot; New Anata; Isawiyaa; and the Old City.
$80,000,000
$60,000,000 • In neighborhoods such as At-Tur, Bab-Azahra, Silwan, Abu Tour, Ras Al-Amud, Jabal Al-
$40,000,000
Mukaber, and Sur Baher and Um Tuba will experiment a profit margin that can oscillate
$20,000,000
from 30%-45%.
$- • The more attractive neighborhoods: Wadi Joz and Sheik Jarrah; Shuafat; Bet Hanina; and,
2015 2016 2017 2018 2019 2020
Bet Safafa, the profit margin can be higher than the average and up to 70%.
Profit Bellow the Av. (30%) Av. Profit (45%) Profit Above the Av. (70%)
Real Estate and Housing Sector Opportunity Analysis - Al-Quds Economic Forum and the Office of 33
the Quartet.Obstacle to Housing Development Real Estate and Housing Sector Opportunity Analysis - Al-Quds Economic Forum and the Office of the Quartet.
Obstacles to housing development
“The Israeli municipality approves on average about 300-400 permits a year, forcing Palestinians to build illegally.
Only 13% of the total East Jerusalem area is available for Palestinian construction and the vast majority of East
Jerusalem’s land is unregistered”
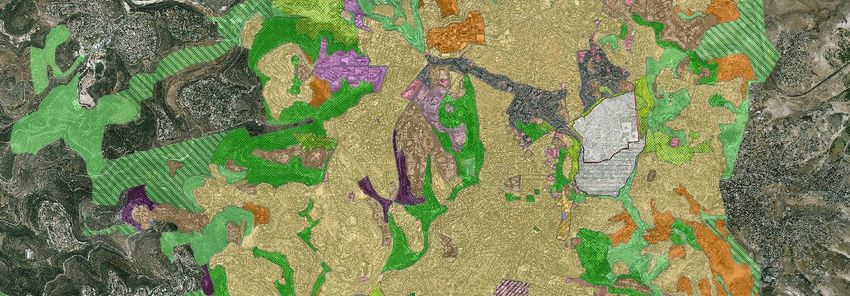
Planning This leaves only 13% of the total East Jerusalem area (9.2 km2) available for
Palestinian construction, and much of it is built-up already.
The first challenge faced by Palestinians residing in Jerusalem is obtaining a
Figure 21
housing permit from Jerusalem Municipality which is considered to be a lengthy, Zoning in East Jerusalem (Palestinian)
costly and uncertain procedure. As stated by the Jerusalem Centre for Legal Aid
and Human Rights: there is an annual shortage of 1,500 housing units in Expropriated for Israeli Settlements
30% 35%
Palestinian neighborhoods to accommodate natural growth. Whereas, the shortage Zoned for Green Areas and Public
of housing units to alleviate overcrowding in East Jerusalem is estimated in the Infraestructure
tens of thousands. 13% Zoned for Palestinian Consturction
22%
It is suggested by NGOs such as the IPCC, that an insufficient number of building Unplanned Areas
permits is issued annually which forces Palestinians to build illegally. It can take
up to three years to finish the process of applying for a building permit, and Source: Union for Jerusalem Housing Assembly, 2015 / OCHA Fact Sheet 2011, East Jerusalem Key Humanitarian Concerns
permission is often not granted. And hence, given the financial and bureaucratic
Infrastructure
obstacles, many Palestinians choose to build illegally, incurring the threat of
having their houses demolished by Israeli authorities. Inadequacies and deficiencies in the existing public infrastructure create further
difficulties to obtaining permits. Requirements such as minimum car parking
Zoning
space and building lines are typically difficult to meet in East Jerusalem’s dense
Of the 70.5 km of land in East Jerusalem, 35% (24.5 km2) has been expropriated neighborhoods.
for Israeli settlements. According to the Israeli human rights organization
It is worth mentioning that some areas in east Jerusalem, opposite to West
B’Tselem, most of this expropriated land was privately-owned Arab property.
Jerusalem, lack the basic infrastructure requirements.
Another 35% (24.7 km2) has plans that have been approved by the Jerusalem
District Committee for Planning and Building. The remaining 30 percent (21.3 A 2010 survey by the Jerusalem Municipality, estimated that East Jerusalem
km2) has not been included in any plan approved since 1967 (planning is taking needs NIS1.9 billion (US$531 million) to upgrade infrastructure to adequate
place in some areas, but not yet approved). Of the 24.7 km2 that are planned, levels (M. Margalit, Discrimination in the Heart of the Holy City, 2006).
approximately 15.5 km2 (22% of all land) are designated as ‘green’ or ‘open’ Based on the Municipalitie’s studies (Infrastructure Survey in East Jerusalem,
areas where no construction is allowed, or for public purposes such as roads and 2010), Palestinian neighborhoods have received a maximum of 12% of the
other infrastructure. Municipality’s budget.
Real Estate and Housing Sector Opportunity Analysis - Al-Quds Economic Forum and the Office of 35
the Quartet.Obstacles to housing development
“In order to accommodate public infrastructure, Figure 22
landowners are forced to donate 40% of their land
for public purposes”
In conclusion, the disparities between East and West Jerusalem are caused by both
under investment and inadequate planning. In addition, the condition of East
Jerusalem’s infrastructure will likely to degrade further as the proportion of
unpermitted housing increases.
Land Parcel
Palestinian land in East Jerusalem is almost entirely privately owned. In order to
accommodate public infrastructure, a process termed re-parcellation is required in
order to share the burden evenly across different owners. Typically, this requires
landowners to donate 40% of their land for public purposes. The Municipality has
only initiated the process in two neighborhoods, Beit Hanina and Shu’afat, and
despite starting in 2000 many plans have yet to be approved.
The small size of East Jerusalem’s parcels, typically less than one dunum, are now
a cause of further planning difficulties. In order to reduce the number of plans to
be processed, the District Committee introduced a minimum size of 10 dunums
for detailed plans. This has made households reliant on the willingness and
financial capability of other households to develop joint planning proposals.
Land Registration
While nearly all of West Jerusalem and Israeli Settlement areas have registered
parcels, the vast majority (92%) of East Jerusalem’s land has no form of land
registration. Those that do, typically have only partial registration. Only a few
central Palestinian neighborhoods such as Sheikh Jarrah and Wadi Joz contain
land that is fully registered.
Since the freezing of the Jordanian land registration process in 1967, it has been
impossible for Palestinians to fully register the land. This affects both the
approval of detailed plans and the issuance of building permits
Source: IPCC
Real Estate and Housing Sector Opportunity Analysis - Al-Quds Economic Forum and the Office of 36
the Quartet.You can also read