TAMALE METROPOLIS - Ghana Statistical Service
←
→
Page content transcription
If your browser does not render page correctly, please read the page content below
TAMALE METROPOLIS
Copyright © 2014 Ghana Statistical Service

                    ii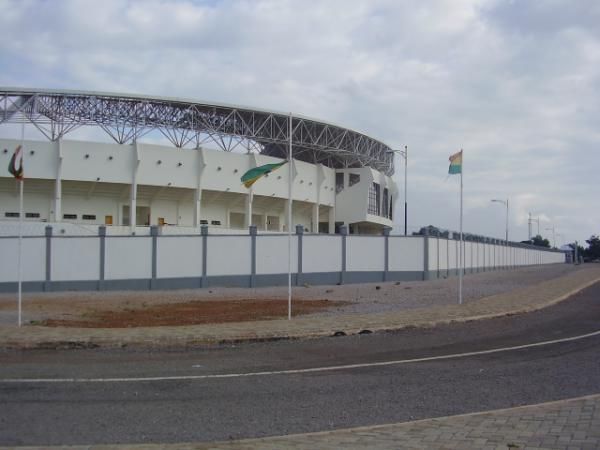
PREFACE AND ACKNOWLEDGEMENT

No meaningful developmental activity can be undertaken without taking into account the
characteristics of the population for whom the activity is targeted. The size of the population
and its spatial distribution, growth and change over time, in addition to its socio-economic
characteristics are all important in development planning.
A population census is the most important source of data on the size, composition, growth
and distribution of a country’s population at the national and sub-national levels. Data from
the 2010 Population and Housing Census (PHC) will serve as reference for equitable
distribution of national resources and government services, including the allocation of
government funds among various regions, districts and other sub-national populations to
education, health and other social services.
The Ghana Statistical Service (GSS) is delighted to provide data users, especially the
Metropolitan, Municipal and District Assemblies, with district-level analytical reports based
on the 2010 PHC data to facilitate their planning and decision-making.
The District Analytical Report for the Tamale Metropolis is one of the 216 district census
reports aimed at making data available to planners and decision makers at the district level. In
addition to presenting the profile of the metropolis, the report discusses the social and
economic dimensions of demographic variables and their implications for policy formulation,
planning and interventions. The conclusions and recommendations drawn from the report are
expected to serve as a basis for improving the quality of life of Ghanaians through evidence-
based decision-making, monitoring and evaluation of developmental goals and intervention
programmes.
For ease of accessibility to the census data, the report for Tamale Metropolis and other census
reports produced by the GSS will be disseminated widely in both print and electronic
formats. The report will also be posted on the GSS website: www.statsghana.gov.gh.
The GSS wishes to express its profound gratitude to the Government of Ghana for providing
the required resources for the conduct of the 2010 PHC. While appreciating the contribution
of our Development Partners (DPs) towards the successful implementation of the Census, we
wish to specifically acknowledge the Department for Foreign Affairs, Trade and
Development (DFATD) formerly the Canadian International Development Agency (CIDA)
and the Danish International Development Agency (DANIDA) for providing resources for
the preparation of all the 216 district reports. Our gratitude also goes to the Metropolitan,
Municipal and District Assemblies, the Ministry of Local Government, Consultant Guides,
Consultant Editors, Project Steering Committee members and their respective institutions for
their invaluable support during the report writing exercise. Finally, we wish to thank all the
report writers, including the GSS staff who contributed to the preparation of the reports, for
their dedication and diligence in ensuring the timely and successful completion of the district
census reports.

Dr. Philomena Nyarko
Government Statistician

                                              iii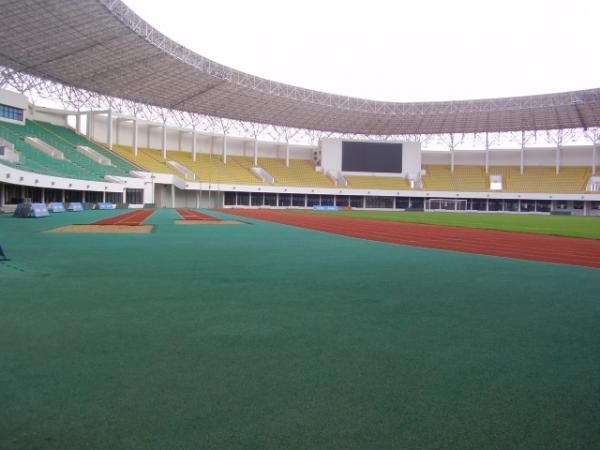
TABLE OF CONTENTS

PREFACE AND ACKNOWLEDGEMENT ........................................................................iii
LIST OF TABLES .................................................................................................................. vi
LIST OF FIGURES ...............................................................................................................vii
ACRONYMS AND ABBREVIATONS ..............................................................................viii
EXECUTIVE SUMMARY .................................................................................................... ix
CHAPTER ONE: INTRODUCTION ................................................................................... 1
   1.1      Background ................................................................................................................. 1
   1.2      Location, Size and Physical Features .......................................................................... 1
   1.3      Political and Administrative Structure ........................................................................ 4
   1.4      Social and Cultural Structure ...................................................................................... 4
   1.6      Census Methodology, Concepts and Definitions ........................................................ 8
   1.7      Organization of the Report ........................................................................................ 18
CHAPTER TWO: DEMOGRAPHIC CHARACTERISTICS......................................... 20
   2.1      Introduction ............................................................................................................... 20
   2.2      Population Size and Distribution .............................................................................. 20
   2.3      Age Dependency ....................................................................................................... 21
   2.4      Fertility and Morality, Migration .............................................................................. 22
CHAPTER THREE: SOCIAL CHARACTERISTICS .................................................... 28
   3.1      Introduction ............................................................................................................... 28
   3.2      Size, Household Composition and Headship ............................................................ 28
   3.3      Marital Status ............................................................................................................ 30
   3.4      Nationality ................................................................................................................. 34
   3.5      Religious Affiliation .................................................................................................. 35
   3.6      Literacy and Education.............................................................................................. 35
CHAPTER FOUR: ECONOMIC CHARACTERISTICS ............................................... 39
   4.1      Introduction ............................................................................................................... 39
   4.2      Economic Activity Status .......................................................................................... 39
   4.3      Occupation ................................................................................................................ 42
   4.4      Industry...................................................................................................................... 42
   4.5      Employment Status ................................................................................................... 43
   4.6      Employment Sector ................................................................................................... 44
CHAPTER FIVE: INFORMATION COMMUNICATION TECHNOLOGY .............. 46
   5.1      Introduction ............................................................................................................... 46
   5.2      Ownership of Mobile Phones .................................................................................... 46
   5.3      Use of Internet ........................................................................................................... 46
   5.4      Household Ownership of Fixed Telephone Lines ..................................................... 46
   5.5      Household Ownership of Desktop or Laptop Computer ........................................... 47
CHAPTER SIX: DISABILITY ........................................................................................... 48
   6.1      Introduction ............................................................................................................... 48
   6.2      Population with disability.......................................................................................... 48

                                                                    iv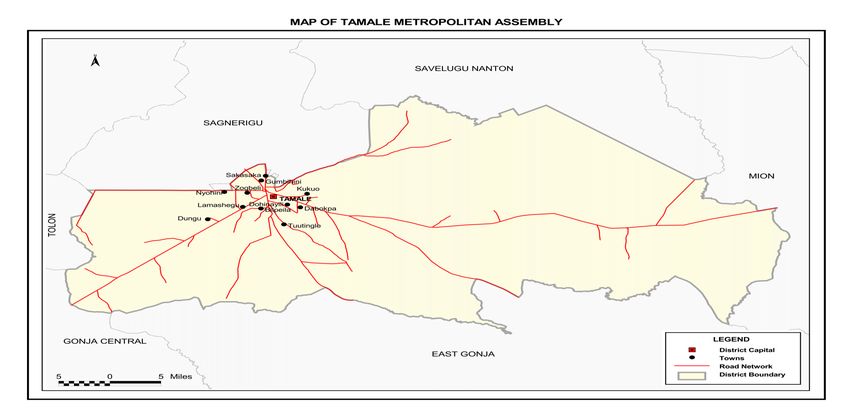
6.3       Types of disability ..................................................................................................... 48
   6.4       Disability by type of locality ..................................................................................... 48
   6.5       Disability and Economic Activity ............................................................................. 49
   6.5       Disability and level of education ............................................................................... 51
CHAPTER SEVEN: AGRICULTURAL ACTIVITIES ................................................... 54
   7.1       Introduction ............................................................................................................... 54
   7.2       Households in Agriculture ........................................................................................ 54
   7.3       Types of farming activities ........................................................................................ 54
CHAPTER EIGHT: HOUSING CONDITIONS ............................................................... 56
   8.1       Introduction ............................................................................................................... 56
   8.2       Housing stock ............................................................................................................ 56
   8.3       Types of dwelling, holding and tenancy agreements ................................................ 56
   8.4       Construction Material ................................................................................................ 58
   8.5       Room occupancy ....................................................................................................... 59
   8.6       Access to Household utilities and facilities............................................................... 60
   8.7       Main sources of water for drinking and other domestic purposes ............................ 61
   8. 8      Bathing and toilet facilities ....................................................................................... 62
CHAPTER NINE: SUMMARY OF FINDINGS, CONCLUSIONS AND POLICY
                               IMPLICATIONS ................................................................................. 65
   9.1       Introduction ............................................................................................................... 65
   9.2       Summary of findings ................................................................................................. 65
   9.3       Conclusion................................................................................................................. 68
   9.4       Policy Implications .................................................................................................... 69
REFERENCES ....................................................................................................................... 71
APPENDICES ........................................................................................................................ 72
LIST OF CONTRIBUTORS ................................................................................................ 74

                                                                    v
LIST OF TABLES

Table 2.1: Population by Age, Sex and type of locality ........................................................ 20
Table 2.2: Reported total fertility rate, general fertility rate and crude birth rate by district 23
Table 2.3: Female population 12 years and older by age, children ever born, children
            surviving and sex of child ..................................................................................... 24
Table 2.4: Total population, on deaths in household and crude death rate by district ........... 25
Table 2.5: Causes of death in households .............................................................................. 26
Table 2.6: Birthplace by duration of residence of Migrants .................................................. 27
Table 3.1: Stock of houses and households by type of locality ............................................. 28
Table 3.2: Household population by composition and sex .................................................... 29
Table 3.3: Household population by structure and sex .......................................................... 30
Table 3.4: Persons 12 years and older by sex, age group and marital status ......................... 31
Table 3.5: Persons 12 years and older by sex, marital status and level of education ............ 33
Table 3.6: Persons 12 years and older by sex, marital status and economic activity status... 34
Table 3.7: Population by nationality and sex ......................................................................... 35
Table 3.8: Population by Religion and Sex ........................................................................... 35
Table 3.9: Literacy level of persons 11 years and older by sex and age and literacy status .. 36
Table 3.10: Population 3 years and older by level of education, school attendance and sex .. 38
Table 4.1: Population, 15 years and older by activity status and sex .................................... 40
Table 4.2: Economic activity status of population 15 years and older by sex and age .......... 41
Table 4.3: Employed population 15 years and older by occupation and sex ......................... 42
Table 4.4: Employed population, 15 years and older by industry and sex ............................ 43
Table 4.6: Employed population 15 years and older by employment sector and sex ........... 45
Table 5.1: Population 12 years and older by mobile phone ownership internet
            facility usage, and sex ........................................................................................... 46
Table 5.2: Households having desktop/laptop computers, fixed telephone
            lines and sex of head ............................................................................................. 47
Table 6.1: Population by type of locality, disability type and sex ......................................... 49
Table 6.2: Population 15 years and older with disability by economic activity .................... 50
            status and by sex ................................................................................................... 50
Table 6.3: Population 3 years and older by sex, disability type and level of education ........ 52
Table 7.1: Households by agricultural activities and locality ................................................ 54
Table 7.2: Distribution of livestock and keepers ................................................................... 55
Table 8.1: Stock of houses and households by type of locality ............................................ 56
Table 8.2: Type of occupied dwelling unit by sex of household head and type of locality .. 57
Table 8.3: Ownership status of dwelling by sex of household heads and type of locality .... 57
Table 8.4: Main construction material for outer wall of dwelling unit by type of locality .... 58
Table 8.6: Main construction material for roofing of dwelling unit by type of locality ........ 59
Table 8.7: Household size and number of sleeping rooms occupied in dwelling unit .......... 59
Table 8.8: Main source of lighting of dwelling unit by type of locality ................................ 60
Table 8.9: Main source of cooking fuel, and cooking space used by households ................. 61
Table 8.10: Main source of water of dwelling unit for drinking and other domestic
              purposes .............................................................................................................. 62
Table 8.11: Bathing facility and toilet facilities used by household ....................................... 63
Table 8.12: Method of rubbish and liquid waste disposal by households .............................. 64
Table A1: Total population, sex, number of households and houses in the ......................... 72
             20 largest communities ........................................................................................ 72
Table A2: Population by age groups in the 20 largest communities .................................... 73
                                                                  vi
LIST OF FIGURES

Figure 1.1: Map of the Tamale Metropolis .............................................................................. 2
Figure 1.2: Temperature Ranges of the Metropolis ................................................................. 3
Figure 1.3: Rainfall and Temperature Ranges ......................................................................... 3
Figure 1.4: Picture of a Feeder Road ....................................................................................... 6
Figure 1.5: Picture of the New Tamale Sports Stadium .......................................................... 7
Figure 1.6: Adongo Art and Craft shop in Tamale .................................................................. 8
Figure 2.1: Population pyramid ............................................................................................. 21
Figure 2.2: Reported age specific death rates by sex ............................................................. 26
Figure 3.1: Marital status in the Metropolis........................................................................... 31
Figure 4.2: Employed population, 15 years and older by employment status and sex .......... 44

                                                             vii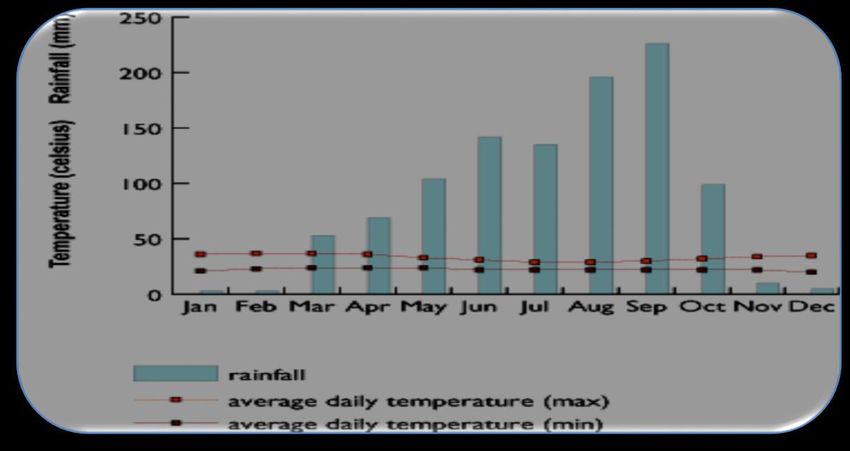
ACRONYMS AND ABBREVIATONS

CBR      Crude Birth Rate
CEB      Children Ever Born
CERGIS   Centre for Geographical and Information Systems
CIDA     Canadian International Development Agency
CS       Children Surviving
DANIDA   Danish International Development Agency
DCD      District Co-ordinating Director
DCE      District Chief Executive
EA       Enumeration Area
ECOWAS   Economic Community of West African States
FCUBE    Free Compulsory Universal Basic Education
GFR      General Fertility Rate
GSS      Ghana Statistical Service
ICT      Information Communication Technology
IMIS     Integrated Management Information System
JHS      Junior High School
JSS      Junior Secondary School
L.I      Legislative Instrument
MMDAs    Metropolitan, Municipal, District Assemblies
NGO      Non-Governmental Organisation
PHC      Population and Housing Census
PWDs     Persons with Disabilities
SHS      Senior High School
SSS      Senior Secondary School
TFR      Total Fertility Rate
UN       United Nation
WC       Water Closet

                                       viii
EXECUTIVE SUMMARY
Introduction
The Census Report for the Tamale Metropolis is the first of its kind since the first post-
independence census was conducted in 1960. The report provides basic information about the
Metropolis. It gives a brief background of the Metropolis, describing its physical features,
political and administrative structure, socio-cultural structure and economy. Using data from
the 2010 Population and Housing Census (2010 PHC), the report discusses the population
characteristics of the Metropolis, fertility, mortality, migration, marital status, literacy and
education, economic activity status, occupation, employment; Information Communication
Technology (ICT), disability, agricultural activities and housing conditions of the metropolis.
The key findings of the analysis are as follows (references are to the relevant sections of the
report).
Population size, structure and composition
The population of Tamale Metropolis, according to the 2010 Population and Housing Census, is
233,252 representing 9.4 percent of the region’s population. Males constitute 49.7 percent and
females represent 50.3 percent. The proportion of the population living in urban localities
(80.8%) is higher than that living in rural localities (19.1%) of the metropolis. The metropolis
has a sex ratio of 99.1. The population of the metropolis is youthful (almost 36.4% of the
population is below 15 years) depicting a broad base population pyramid which tapers off with
a small number of elderly persons (60 years and older) representing 5.1 percent. The total age
dependency ratio for the district is 69.4, the age dependency ratio for rural localities is higher
(86.5) than that of urban localities (65.7).
Fertility, mortality and migration
The Total Fertility Rate for the metropolis (2.8) is slightly lower, compared to the regional
fertility rate of 3.5. The General Fertility Rate is 79.9 births per 1000 women aged 15-49 years.
The Crude Birth Rate (CBR) is 21.2 per 1000 population. The crude death rate for the
metropolis is 5.6 deaths per 1000. Accident/violence/homicide/suicide account for 9.6 percent
of all deaths while other causes contribute to 90.5 percent of deaths. Majority of migrants (54.9
percent) living in the metropolis were born elsewhere in the region while 45.1 percent were
born elsewhere in another region. For migrants born elsewhere in another region, those born in
have the highest proportion (19.6%) followed by those who were born in Upper East (18.7).
Household Size, composition and structure
The metropolis has a total of 219,971 households, living in 19,387 houses. The average
household size in the metropolis is 6.3 persons per household. Children constitute the largest
proportion of the household structure accounting for 40.4 percent and heads of household
make-up 16.1 percent of the household population. Spouses form about 9.4 percent and other
relatives constitute 12.9 percent of the population. The proportion of households who live in
extended household structure (head, spouse(s), children and head’s relatives) constitute the
largest proportion (46.1%) than that of any other type of household structure. Nuclear
households (head, spouse(s) and children) constitute only 19.5 percent of households in the
metropolis.
ixMarital status
There are more people (48.6%), 12 years and older, who are married than those who have
never married (44.2%). Persons who are widowed constitute 4.0 percent of the population of
the metropolis. Population of divorced make-up 1.6 percent while those in consensual
relationships constitute only 0.7 percent. The highest percentages (57.5 and 23.3 respectively)
of married persons either had no education or attained only basic education. About 31 percent
of persons who have never married are employed, compared to 4.8 percent who are
unemployed. The largest proportion (63.8%) of them are economically not active
Nationality
There is a dominant proportion of Ghanaians by birth in the metropolis, constituting 94.6
percent of the population. Those who have naturalised constitute less than one percent (0.8)
while those who have dual nationality are 2.1 percent of the total population of the
metropolis.
Literacy and education
Of the population 11 years and above, 60.1 percent are literates and 39.9 percent are non-
literates. The proportion of literate males (69.2%) is higher than that of females (51.1%). Five
out of ten people (54.8%) indicate they can speak and write both English and Ghanaian
languages. Of the population aged 3 years and older (84,897) currently attending school in
the metropolis 52.9 percent are males and the remaining 45.1 percent are females. Among
those who have attended school in the past, males constitute 58.6 percent and the females
represent 41.4. It indicates that both among those who attended school in the past and those
who are currently, males have higher proportions. Among those currently attending school,
15.1 percent are in nursery, 18.2 percent in JSS/JHS, 12.5 percent in SSS/SHS and the largest
proportion (40.0%) is in primary. Only 5.7 percent of the population 3 years and older in the
metropolis are currently attending tertiary institutions.
Economic Activity Status
About 63.3 percent of the population aged 15 years and older in the metropolis are
economically active and 36.7 percent are economically not active. Of the economically active
population, 92.6 percent are employed while 7.4 percent are unemployed. For those who are
economically not active, a larger percentage of them are students (56.0%), 20.9 percent
perform household duties and 12.4 percent are either too young or old to work. About five
out of ten (52.9) of unemployed persons in the metropolis are seeking work for the first time.
Occupation
Of the employed population in the Tamale Metropolis, the highest proportion (33.0%) are
engaged as service and sales workers. The second largest occupation is craft and related trade
workers who constitute 21.5 percent of the employed population. The number of skilled
agricultural, forestry and fishery workers represent 17.6 percent of the employed population.
Those employed as professionals constitute only 8.1 percent.
Employment status and sector
Of the population 15 years and older, the highest proportion (60.6%) are self-employed
without employees, 19.5 percent are employees, 5.9 percent are contributing family workers
and 6.9 percent are self-employed with employees. Higher proportion of females are self-
xemployed without employees (70.5%), compared to 51.3 percent for males. The proportion of
females who are employees (11.3%) is however smaller than that of male employees
(28.2%). The private informal sector is the largest employer in the metropolis, employing
83.2 percent of the employed population. Public sector is the next highest employer,
engaging 11.3 percent of the employed population.
Information Communication Technology
Of the population 12 years and above, 53.7 percent have mobile phones. The proportion of
males who own mobile phones (55.5%) is higher than that for females which 44.4 percent.
Only about 7.4 percent of the population 12 years and older use internet facilities in the
metropolis and a 9.5 percent of the total households have desktop/laptop computers.
Disability
About 2.0 percent of the total population of the metropolis has one form of disability or the
other. Almost equal proportions of both females and male in the population suffer disability.
The types of disability in the metropolis include sight, hearing, speech, physical, intellect, and
emotion. Emotional disability is the commonest form of disability in the metropolis, affecting
29.1 percent of the disabled population. The second commonest is sight disability which also
affects 26.8 percent. About 48.7 percent of the disabled population are employed, 3.9 percent
unemployed and 47.3 percent are economically not active. In terms of education, less than 0.1
percent of persons with disability in the metropolis obtained post-graduate
certificate/diploma/ masters or PhD.
Agriculture
Only a small proportion (26.1%) of households in the metropolis are engaged in agriculture.
In the rural localities, the proportion of households engaged agricultural (43.3%) is less than
that of urban households which is 56.7 percent. Most (84.8%) of the agricultural households
in the metropolis are involved in crop farming, 52.9 percent in urban and 47.1 percent in rural
localities. Fishing farming is the agricultural activities that engages the least proportion (less
than 0.1%) of households in the metropolis.
Housing
The housing stock of Tamale Metropolis is 19,387 representing 7.5 percent of the total
number of houses in the Northern Region. There are a total of 35,408 households and the
average number of persons per house is 11.5. Average household size for the metropolis is
6.3, which is lower than the regional average of 7.8.
Type, tenancy arrangement and ownership of dwelling units
The most dominant type of dwelling in the metropolis is compound house, constituting 80.6
percent of dwellings. Separate house type of dwelling which is the next commonest only
constitute 7.5 percent of dwellings. Huts/building (same compound) type of dwellings
constitute 4.3 percent, semi-detached houses make-up 3.4 percent and flats/Apartment 2.1
percent. About 55 percent of the dwelling units in the metropolis are owned by members of
the household. Personal ownership of dwellings is higher among male headed households
(57.1%) than female headed households (47.1%). Public/Government owned dwellings
constitute only 2.9 percent of dwellings in the metropolis.
xiMaterial for construction of outer wall, floor and roof
The main construction material for outer walls of dwelling units in the metropolis are cement
blocks/concrete which constitute the material used for constructing the outer walls of a
proportion 55.9 percent of dwelling units. In urban localities, the proportion is higher (60.3%)
than that of rural localities where only 36.8 percent of outer walls of dwelling units were
constructed using cement blocks/concrete. The use of mud/brick/earth which constitute 35.2
is also significant in the metropolis. They constitute the main material used in constructing
the outer walls of 30.0 percent of dwelling units in urban localities and 57.5 percent in rural
localities. Cement (83.9%) and mud/earth (13.6%) are the two main materials used in the
construction of floors of dwelling units in the metropolis. Metal sheets are the commonest
main roofing materials, constituting about 85.3 percent of roofing materials of dwellings. The
second commonest is thatch/palm leaf or raffia which are used for roofing 9.1 percent of
dwellings.
Room occupancy
One sleeping room occupancy is the commonest among all households of various sizes.
About 87.7 percent of single member households occupy dwelling units with one sleeping
room. On one hand, 3.3 percent of households of sizes 10 or more occupy single rooms in
the metropolis. On the other hand, about two percent of single member households in the
metropolis occupy nine rooms or more.
Utilities and household facilities
The three main sources of lighting for most households are electricity (main grid),
constituting what lights 82.2 percent of households, kerosene lamp (11.6%) and
flashlight/torch, constituting the source of light for 4.7 percent of households in the
metropolis. Most households in the metropolis use two main sources of cooking fuel;
charcoal, which is used by 94.3 percent of households in urban location and 5.7 percent of
rural households and wood, which is used by 52.9 percent of households in urban localities
and 47.1 percent of rural localities. Gas is the third commonly used fuel for cooking used by
89.6 percent or urban households and 10.4 percent of rural households. Most households in
the metropolis depend on either pipe-borne water outside their dwelling or pipe-borne water
inside their dwelling (representing 41.4% and 39.8% respectively).
The commonest toilet facility is used by 56.2 percent of households in the metropolis and that
is public toilet (WC/KVIP/Pit latrine/pan). The use of KVIP is the second commonest used
by just 7.1 percent of households. As much as 26.1 percent of households in the district has
no toilet facility. The commonest bath facility for most households (39.3%) in the metropolis
is a shared separate bathrooms in the same house. Only 24.6 percent households own
bathrooms for their exclusive use.
Waste disposal
The most widely used method of solid waste disposal is by public dump (container)
accounting for 98.3 percent households in urban areas and 1.7 percent in rural in the
metropolis. About 72.5 percent of household in urban locations have their solid waste
collected and for rural households only 27.5 percent have their waste collected. The
commonest way of disposing of waste for most rural households (70.9%) is by indiscriminate
dumping, even though in urban areas, 29.1 percent of households also dispose of waste by the
same method. For liquid waste disposal, the largest proportion of households throw onto the
street/outside or onto the gutter. Seventy two percent of urban households dispose of by
throwing onto the street/outside and that for rural households is 27.3 percent.
xiiCHAPTER ONE
INTRODUCTION
1.1 Background
The Tamale Metropolitan Assembly was established by legislative instrument (LI 2068)
which elevated the then Municipal Assembly into a Metropolis in 2004. At present, it is one
of the six Metropolitan Assemblies in the country and the only Metropolis in the three
Northern regions namely: Upper East, Upper West and Northern regions. It has Tamale as the
Metropolitan capital city and at the same time the regional capital of the Northern Region.
1.2 Location, Size and Physical Features
The Tamale Metropolis is one of the 26 districts in the Northern Region. It is located in the
central part of the Region and shares boundaries with the Sagnarigu District to the west and
north, Mion District to the east, East Gonja to the south and Central Gonja to the south-west.
The Metropolis has a total estimated land size of 646.90180sqkm (GSS-
2010).Geographically, the Metropolis lies between latitude 9º16 and 9º 34 North and
longitudes 0º 36 and 0º 57 West.
Tamale is strategically located in the Northern Region and by this strategic location, the
Metropolis has a market potential for local goods from the agricultural and commerce sectors
from the other districts in the region. Besides the comparative location of the Metropolis
within the region, the area stands to gain from markets within the West African region from
countries such as Burkina Faso, Niger, Mali and the northern part of Togo and also en-route
through the area to the southern part of Ghana.
There are 115 communities in the Metropolis. Most of the rural communities have a large
expanse of land for agricultural activities and serve as the food basket for the Metropolis.
However, these communities still lack basic social and economic infrastructure such as good
road networks, school blocks, hospitals, markets and recreational centers, thereby hindering
socio-economic development, poverty reduction and reducing the general phenomenon of
rural-urban migration.
1Figure 1.1: Map of the Tamale Metropolis
Source: Ghana Statistical Service, GIS
21.2.1 Relief and Climate
Generally, the Tamale Metropolis is about 180 meters above sea level. The land is generally
undulating with a few isolated hills. The Metropolis receives only one rainfall season in a
year and this has affected effective agricultural production in the area. Daily temperature in
the Metropolis varies from season to season. During the rainy season residents experience
high humidity, slight sunshine with heavy thunder storms, compared to the dry season which
is characterized by dry Harmattan winds from November-February and high sunshine from
March-May.
This climatic feature offers a unique opportunity for the preservation industry in that it could
use the sunshine as a natural preservative. Another untapped potential of the Metropolis is the
development of artificial parks and gardens that could take the advantage of the high sun rays
by building swimming pools, parks for both children and adults to relax during the excessive
sunshine period. By this, most families would be able to enjoy good family reunion during
the weekends and holiday periods. The Metropolis could also derive needed revenue from
the development of these potentials. Below is the daily temperature ranges in the Metropolis.
Figure 1.2: Temperature Ranges of the Metropolis
Temperature Ranges during Night and Day
Max. Temp (C)
36 38 30 36 38 33 37 39 34
(C)
Min. Temp (C)
30 37 25 30 38 29 32 39 27
(C)
Source: Ghana Statistical Service, 2010 Population and Housing Census
Figure 1.3: Rainfall and Temperature Ranges
1.2.2 Drainage and Vegetation
3The Metropolis is poorly endowed with water bodies and this has affected the regular flow of
water into households within the Metropolis. The only natural water systems are a few
seasonal streams which have water during the rainy season but dry up during the dry season.
The Metropolis lies within the savannah woodland zone in the country. The trees in this zone
and for that matter the Metropolis are short scattered wood lots in nature. Major tree types in
the Metropolis are Dawadawa, Nim, Acacia, Mahogany, Baobab among others. The
Metropolis is endowed with naturally grown tall grasses during the rainy season which are
used to make the local mats popularly called,“Zanamat” . The making of the Zanamat by
most farmers during the dry season reduces the rural-urban migration levels of the youth from
the rural areas to urban areas. Besides, the only economic tree is the Shea tree which has
gained international recognition. The picking, processing and marketing of the shea nuts has
over the years engaged almost all households in the area. Undoubtedly these shea nut related
activities have contributed in employing the youthful population, increased household
incomes and reduced poverty.. Cashew is also widely grown in the Metropolis.
The main soil types in the Metropolis are sandstone, gravel, mudstone and shale that have
weathered into different soil grades. Due to seasonal erosion, soil types emanating from this
phenomenon are sand, clay and laterite ochrosols. The availability of these soil types have
facilitated real estate development in the area as estate developers have resorted to using
these materials in the building industry.
1.3 Political and Administrative Structure
The Metropolitan Chief Executive is the political head of the Metropolis. There are two
constituencies in Tamale thus Tamale South and Tamale Central and two sub-metros (Tamale
South and Central).The Metropolis has a total of 59 Assembly members comprising of 18
appointed and 41 elected members and also a total of 205 unit committee members.
The Assembly has very active Sub-Committee members who work hard to achieve the
objectives and the goal of the Assembly. Recently, a taskforce group known as the
“BILCHINSI” has been formed to assist in the governance of the metropolis by ensuring
discipline among the youth in the Metropolis. This voluntary group is also assisting the police
force in the Metropolis to reduce and prevent crime and violent acts by policing the
neighborhoods, especially at night.
Apart from the Local Government structures, there are eminent traditional chiefs and sub-
chiefs who are also working hand in hand with the Metropolis in promoting peace, stability
and development in the area. Traditionally, the Ya Naa is the overlord of the area but he
enskins the Gukpegu Naa as his subject over the traditional administration of the Metropolis.
1.4 Social and Cultural Structure
Historically, the Northern Regions of the country had vast land cover with smaller population
sizes and the Metropolis is of no exception. This area begun experiencing high population
growth after many people with different ethnic backgrounds started migrating from other
areas to settle there thus making it a cosmopolitan area. The Dagombas are the majority and
other ethnic groups such as Gonjas, Mamprusis, Akan, Dagaabas and groups from the Upper
East Region are also residing in the Metropolis. Also found in the Metropolis are other
nationals from Africa and other countries across the globe.
4The area has deep rooted cultural practices reflected in activities such as annual festivals,
naming and marriage ceremonies. Some of the festivals that are celebrated annually in the
Metropolis are Damba, Bugum (fire festival) and the two Muslim Eid festivals (Eid Fitr and
Eid Adha). The Metropolis is dominated by Muslims and followed by Christians, spiritualists
and traditionalists.
1.4.1 Markets and Financial Institutions
There are four major markets in the Metropolis namely: Central Market, Aboabo, Kukuo and
Lamashegu. In addition to these, there are satellite markets in other communities. The
Central market comprises of mini shops and stalls. Plans are underway, to upgrade the market
with modern facilities.
The Central Business District (CBD) is also fast developing with new business ventures.
There is an uncompleted modern super market block that was started during the 1970s but
has been abandoned due to lack of financial resources. This facility when completed would
provide space for offices, stores and shopping for businesses. When completed it would offer
permanent accommodation for a lot of traders roaming the streets and those occupying open
spaces in the CBD of the metropolis. The Assembly is therefore lobbying and soliciting
private collaboration to complete the project under Public-Private Partnership agreements.
There are sanitation facilities ranging from 1No. 24-seater water closet (WC), 1No. 10-seater
KVIP and aqua privy in some of the markets but these are inadequate. The Lamashegu and
Kukuo markets are yet to be provided with sanitation facilities. These facilities are however
inadequate for the rapidly growing population of the Metropolis.
The Assembly has an abattoir located at Shishiegu in the Tamale South-Sub Metro. This
abattoir has the capacity of generating waste for bio-gas production. Aside this facility is the
landfill site that receives 250 tons of waste daily. The procurement of a digester and
establishment of a recycling plant could be a good investment opportunity worth exploring
since it could bring economic gains to the Metropolis and other neighboring districts. The
landfill site is a huge potential for the generation of not only bio-gas but also for generation
of fertilizer which could be very useful to farmers. The landfill as at now is poorly developed,
and could in the near future have serious consequences on the health of the people.
There are many international, national and local financial institutions in the metropolis.
Prominent among these are the Bank of Ghana (the Regulator), Barclays Bank, Standard
Charted Bank, Stanbic Bank, Ghana Commercial Bank, Agricultural Development Bank,
Zenith Bank and Unibank amongst others. .
1.4.2 Utilities and Services
Utility services are available in the metropolis. Electricity, water, roads, markets and
communication services are available in urban communities in the Metropolis. However;
more need to be done in the rural communities.
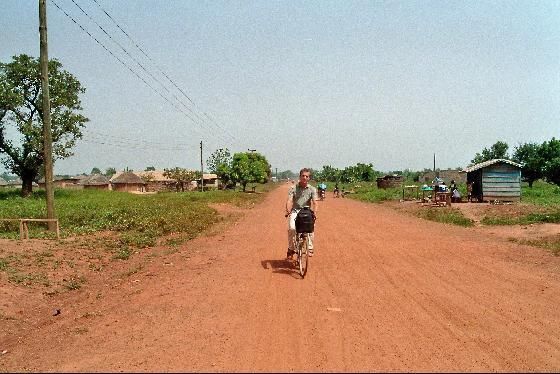
1.4.2 Roads
The roads in the Metropolis are fairly good especially those that link the Metropolis to other
adjoining district capitals. The tarred roads in the area facilitate easy commuting from one
place to the other. There is no traffic congestion. Most of the farming and the peri-urban
communities are linked to the marketing centers by feeder roads. The availability of access
roads linking farming communities to marketing centres enables farmers to transport their
5produce to the urban marketing centres with ease. Consequently their postharvest losses are
likely to be less or reduced. The picture below shows one feeder road within the Metropolis.
Figure 1.4: Picture of a Feeder Road
Source: Tamale Metropolitan Assembly
1.4.3 Transport
The major transport services in the area are taxi cabs with a main taxi station at the Central
Business District (CBD). State Transport Company, Metro Mass Transit, O. A. Travel and
Tours and other private bus services link the Metropolis with other cities and towns in the
country. Most of the people also use motorbikes as their means of transport within the
Metropolis. For easy transport of goods and services, EMS, FEDEX, DHL and others offer
fast and reliable express services from the Metropolis to other places.
1.4.4 Water
The Metropolis enjoys frequent water supply from the Dalun and the Nawuni Water
Treatment Plants. The main source of water in the Metropolis is pipe borne water which is
rationed and managed by the Ghana Water Company Limited in urban Tamale. The Ghana
Water Company Limited supplies 45,000 cubic meters daily. Reports from the company
indicate that there is a surplus in treated water supply in the Metropolis. This implies water
bottling companies could take this opportunity to establish bottling plants to utilize this
resource in the area. This would also create employment opportunities in the area for the
youth. Other water sources include; Town water systems, mechanized bore holes, wells, dams
and dugouts.
1.4.5 Electricity
The Metropolis enjoys electricity supply from the National Grid and about 70 percent of the
communities are connected. Electricity supply has been fairly stable. With the expansion of
electricity in the Metropolis, there is also an expansion of Small and Medium-Scale
Enterprises in the area.
61.4.6 Communication
The Tamale Metropolis also enjoys telecommunication services. New mobile communication
service providers such as Airtel, Expresso and Glo are now operating alongside the major
networks (MTN and Vodafone). Broad band service has been introduced in the Metropolis,
which is encouraging as it links the Assembly to the worldwide web. It has also proved very
useful in business transactions for both public and the private sector. The Metropolis has
lately witnessed an increase in media activities. For instance FM radio stations have
increased from 3 to 8; TV stations from 1 to 5 with a considerable jump in newspaper supply
vendors. The Media houses are avenues for organizing educative programmes especially on
government policies to the illiterate population in the local languages. The major problem
with the newspapers is that, they arrive from Accra and Kumasi in the Metropolis very late in
the day. With technological advancement there would be the need for a newspaper printing
press to be located in the Metropolis to serve the three Northern regions of the country.
1.4.7 Sports
There is an Ultra-modern Sports Stadium in the Metropolis which is being managed by the
Ghana Sports Council.
Figure 1.5: Picture of the New Tamale Sports Stadium
Source: Tamale Metropolitan Assembly
The Sports Stadium has contributed in boosting sporting activities in the Metropolis. Real
Tamale United is the biggest football club in the Metropolis with other smaller clubs. There
are other facilities such as conference rooms, restaurants and shops within the sports stadium
for public use. The inner perimeter of the stadium could also be used for entertainment
related activities such as musical displays and other major events.
1.4.8 Tourism and Hospitality
The Metropolis is a transit point to many tourist sites in other districts and regions in the
northern part of the Country. For instance, many tourists moving to the Mole National Park
do make a stopover in Tamale before embarking on their trip to the West Gonja District.
There are also a few tourist sites in the Metropolis namely: Tugu Crocodile Pond, the Python
Sanctuary, the German Cemetery as well as a Cultural Centre. The Centre for National
Culture is located right in the Central Business District of Tamale; a place many tourists
would cherish visiting to have a look at many items of local Arts and Craft exhibitions.
7There is also a vibrant v hospitality industry. More hotels, guest houses, restaurants are
springing up. Some of the prominent ones are Mariam Hotel, Picorna, Gariba Lodge, Modern
City Hotel, Radach Memorial Centre and Hamdallah Guest house among many others.
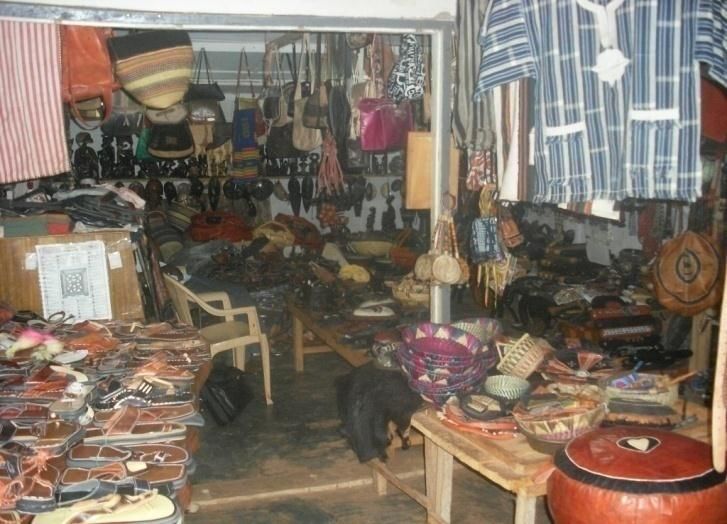
Below is a picture of an artefact shop at the Cultural Centre (Centre for National Centre) in
Tamale.
Figure 1.6: Adongo Art and Craft shop in Tamale
Source: Tamale Metropolitan Assembly
1.6 Census Methodology, Concepts and Definitions
1.6.1 Introduction
Ghana Statistical Service (GSS) was guided by the principle of international comparability
and the need to obtain accurate information in the 2010 Population and Housing Census
(2010 PHC). The Census was, therefore, conducted using all the essential features of a
modern census as contained in the United Nations Principles and Recommendations for
countries taking part in the 2010 Round of Population and Housing Censuses.
Experience from previous post independence censuses of Ghana (1960, 1970, 1984 and 2000)
was taken into consideration in developing the methodologies for conducting the 2010 PHC.
The primary objective of the 2010 PHC was to provide information on the number,
distribution and social, economic and demographic characteristics of the population of Ghana
necessary to facilitate the socio-economic development of the country.
1.6.2 Pre-enumeration activities
Development of census project document and work plans
A large scale statistical operation, such as the 2010 Population and Housing Census required
meticulous planning for its successful implementation. A working group of the Ghana
Statistical Service prepared the census project document with the assistance of two
consultants. The document contains the rationale and objectives of the census, census
organisation, a work plan as well as a budget. The project document was launched in
November 2008 as part of the Ghana Statistics Development Plan (GSDP) and reviewed in
November 2009.
8Census secretariat and committees
A well-structured management and supervisory framework that outlines the responsibilities
of the various stakeholders is essential for the effective implementation of a population and
housing census. To implement the 2010 PHC, a National Census Secretariat was set up in
January 2008 and comprised professional and technical staff of GSS as well as staff of other
Ministries, Departments and Agencies (MDAs) seconded to GSS. The Census Secretariat was
primarily responsible for the day-to-day planning and implementation of the census activities.
The Secretariat had seven units, namely; census administration, cartography, recruitment and
training, publicity and education, field operations and logistics management, data processing,
and data analysis and dissemination.
The Census Secretariat was initially headed by an acting Census Coordinator engaged by the
United Nations Population Fund (UNFPA) in 2008 to support GSS in the planning of the
Census. In 2009, the Census Secretariat was re-organized with the Government Statistician
as the National Chief Census Officer and overall Coordinator, assisted by a Census
Management Team and a Census Coordinating Team. The Census Management Team had
oversight responsibility for the implementation of the Census. It also had the responsibility of
taking critical decisions on the census in consultation with other national committees. The
Census Coordinating Team, on the other hand, was responsible for the day-to-day
implementation of the Census programme.
A number of census committees were also set up at both national and sub-national levels to
provide guidance and assistance with respect to resource mobilization and technical advice.
At the national level, the committees were the National Census Steering Committee (NCSC),
the National Census Technical Advisory Committee (NCTAC) and the National Census
Publicity and Education Committee (NCPEC). At the regional and district levels, the
committees were the Regional Census Implementation Committee and the District Census
Implementation Committee, respectively.
The Regional and District Census Implementation Committees were inter-sectoral in their
composition. Members of the Committees were mainly from decentralized departments with
the Regional and District Coordinating Directors chairing the Regional Census
Implementation Committee and District Census Implementation Committee, respectively.
The Committees contributed to the planning of district, community and locality level
activities in areas of publicity and field operations. They supported the Regional and District
Census Officers in the recruitment and training of field personnel (enumerators and
supervisors), as well as mobilizing logistical support for the census.
Selection of Census topics
The topics selected for the 2010 Population and Housing Census were based on
recommendations contained in the UN Principles and Recommendations for 2010 Round of
Population and Housing Censuses and the African Addendum to that document as well as the
needs of data users. All the core topics recommended at the global level, i.e., geographical
and internal migration characteristics, international migration, household characteristics,
demographic and social characteristics such as age, date of birth, sex, and marital status,
fertility and mortality, educational and economic characteristics, issues relating to disability
and housing conditions and amenities were included in the census.
Some topics that were not considered core by the UN recommendations but which were
found to be of great interest and importance to Ghana and were, therefore, included in the
92010 PHC are religion, ethnicity, employment sector and place of work, agricultural activity,
as well as housing topics, such as, type of dwelling, materials for outer wall, floor and roof,
tenure/holding arrangement, number of sleeping rooms, cooking fuel, cooking space and
Information Communication Technology (ICT).
Census mapping
A timely and well implemented census mapping is pivotal to the success of any population
and housing census. Mapping delineates the country into enumeration areas to facilitate
smooth enumeration of the population. The updating of the 2000 Census Enumeration Area
(EA) maps started in the last quarter of 2007 with the acquisition of topographic sheets of all
indices from the Survey and Mapping Division of the Lands Commission. In addition, digital
sheets were also procured for the Geographical Information System Unit.
The Cartography Unit of the Census Secretariat collaborated with the Survey and Mapping
Division of the Lands Commission and the Centre for Remote Sensing and Geographic
Information Services (CERSGIS) of the Department of Geography and Resource
Development, University of Ghana, to determine the viability of migrating from analog to
digital mapping for the 2010 PHC, as recommended in the 2000 PHC Administrative Report.
Field cartographic work started in March 2008 and was completed in February 2010.
Development of questionnaire and manuals
For effective data collection, there is the need to design appropriate documents to solicit the
required information from respondents. GSS consulted widely with main data users in the
process of the questionnaire development. Data users including MDAs, research institutions,
civil society organizations and development partners were given the opportunity to indicate
the type of questions they wanted to be included in the census questionnaire.
Documents developed for the census included the questionnaire and manuals, and field
operation documents. The field operation documents included Enumerator’s Visitation
Record Book, Supervisor’s Record Book, and other operational control forms. These record
books served as operational and quality control tools to assist enumerators and supervisors to
control and monitor their field duties respectively.
Pre-tests and trial census
It is internationally recognized that an essential element in census planning is the pre-testing
of the questionnaire and related instructions. The objective of the pre-test is to test the
questionnaire, the definition of its concepts and the instructions for filling out the
questionnaire.
The census questionnaire was pre-tested twice in the course of its development. The first pre-
test was carried out in March 2009 to find out the suitability of the questions and the
instructions provided. It also tested the adequacy and completeness of the responses and how
respondents understood the questions. The second pre-test was done in 10 selected
enumeration areas in August, 2009. The objective of the second pre-test was to examine the
sequence of the questions, test the new questions, such as, date of birth and migration, and
assess how the introduction of ‘date of birth’ could help to reduce ‘age heaping’. With regard
to questions on fertility, the pre-tests sought to find out the difference, if any, between proxy
responses and responses by the respondents themselves. Both pre-tests were carried in the
Greater Accra Region. Experience from the pre-tests was used to improve the final census
questionnaire.
10A trial census which is a dress rehearsal of all the activities and procedures that are planned
for the main census was carried out in October/November 2009. These included recruitment
and training, distribution of census materials, administration of the questionnaire and other
census forms, enumeration of the various categories of the population (household,
institutional and floating population), and data processing. The trial census was held in six
selected districts across the country namely; Saboba (Northern Region), Chereponi (Northern
Region), Sene (Brong Ahafo Region), Bia (Western Region), Awutu Senya (Central
Region), and Osu Klottey Sub-Metro (Greater Accra Region). A number of factors were
considered in selecting the trial census districts. These included: administrative boundary
issues, ecological zone, and accessibility, enumeration of floating population/outdoor-
sleepers, fast growing areas, institutional population, and enumeration areas with scattered
settlements.
The trial census provided GSS with an opportunity to assess its plans and procedures as well
as the state of preparedness for the conduct of the 2010 PHC. The common errors found
during editing of the completed questionnaires resulted in modifications to the census
questionnaire, enumerator manuals and other documents. The results of the trial census
assisted GSS to arrive at technically sound decisions on the ideal number of persons per
questionnaire, number of persons in the household roster, migration questions, placement of
the mortality question, serial numbering of houses/housing structures and method of
collection of information on community facilities. Lessons learnt from the trial census also
guided the planning of the recruitment process, the procedures for training of census field
staff and the publicity and education interventions.
1.6.3 Census Enumeration
Method of enumeration and field work
All post- independence censuses (1960, 1970, 1984, and 2000) conducted in Ghana used the
de facto method of enumeration where people are enumerated at where they were on census
night and not where they usually reside. The same method was adopted for the 2010 PHC.
The de facto count is preferred because it provides a simple and straight forward way of
counting the population since it is based on a physical fact of presence and can hardly be
misinterpreted. It is thought that the method also minimizes the risks of under-enumeration
and over enumeration. The canvasser method, which involves trained field personnel visiting
houses and households identified in their respective enumeration areas, was adopted for the
2010 PHC.
The main census enumeration involved the canvassing of all categories of the population by
trained enumerators, using questionnaires prepared and tested during the pre-enumeration
phase. Specific arrangements were made for the coverage of special population groups, such
as the homeless and the floating population. The fieldwork began on 21st September 2010
with the identification of EA boundaries, listing of structures, enumeration of institutional
population and floating population.
The week preceding the Census Night was used by field personnel to list houses and other
structures in their enumeration areas. Enumerators were also mobilized to enumerate
residents/inmates of institutions, such as, schools and prisons. They returned to the
institutions during the enumeration period to reconcile the information they obtained from
individuals and also to cross out names of those who were absent from the institutions on
Census Night. Out-door sleepers (floating population) were also enumerated on the Census
Night.
11You can also read