EQUAL BELLIES 'HUNGRY - Sinn Fein
←
→
Page content transcription
If your browser does not render page correctly, please read the page content below
‘HUNGRY
BELLIES
ARE NOT
EQUAL
TO FULL
BELLIES’
Exploring inequality
and deprivation in
Ireland
‘HUNGRY
BELLIES Exploring inequality and deprivation in Ireland
ARE NOT
EQUAL
TO FULL
BELLIES’

                                                          Getty Image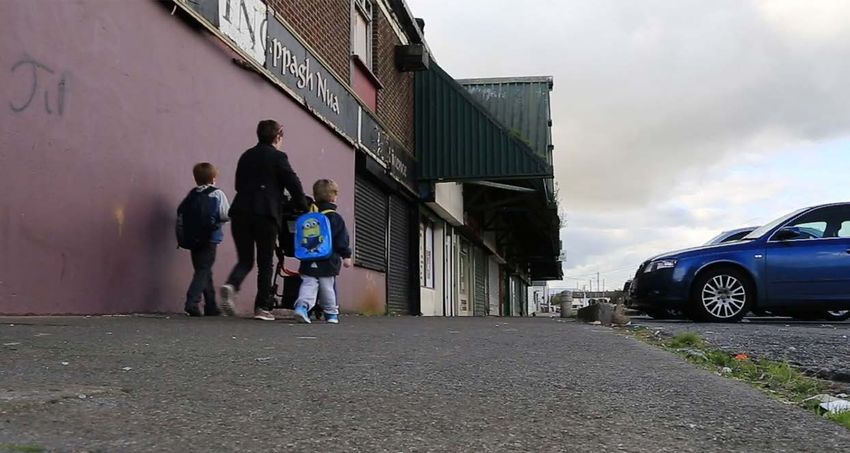
Contents
EXECUTIVE SUMMARY                                                      3

INTRODUCTION                                                           5

       MYTHMAKING AND HUBRIS – A BAD IRISH HABIT
       ECONOMIC INEQUALITY, DEPRIVATION, POVERTY AND DISCRIMINATION ARE REAL

MEASURING INEQUALITY IN IRELAND – THE BIG PICTURE                      9

       SETTING AN UNFAIR NARRATIVE
       LEAHY AND INEQUALITY – IRELAND ‘BUCKING A TREND’?
       THE USE OF THE WORD ‘INEQUALITY’
       SEAMUS COFFEY AND INEQUALITY
       THEWISSWEN AND RISING INCOME INEQUALITY
       GINI COEFFICIENT
       BARRA ROANTREE AND INEQUALITY
       DEPRIVATION AND POVERTY RATES
       HOUSING AND RENTS
       HEALTH CARE
       WAGE INCOME

TESTIMONIALS                                                           30

       BASKET BRIGADE
       INNER CITY HELPING HOMELESS (ICHH)
       MUSLIM SISTERS OF ÉIRE
       PENNY DINNERS – CORK
       SPARK (SINGLE PARENTS ACTING FOR THE RIGHTS OF KIDS)
       TRAVELLER VISIBILITY GROUP

Front and back cover Photography by Siobhan Walsh and Martin Blake.

                                                                               1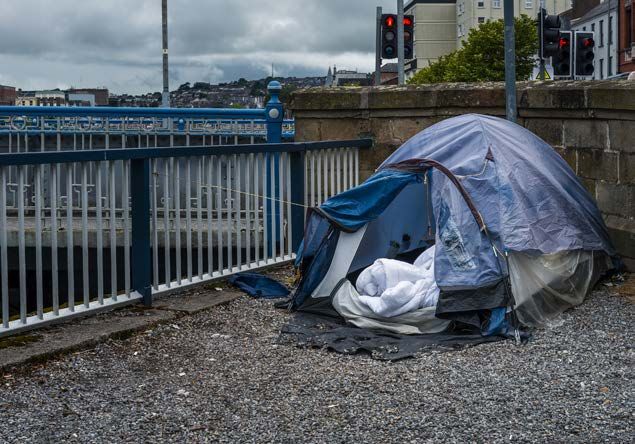
‘HUNGRY
BELLIES Exploring inequality and deprivation in Ireland
ARE NOT
EQUAL
TO FULL
BELLIES’
    Getty Image

2
Executive Summary
Income is just a single measure of economic inequality, of which TASC cite 7 aspects. The other 6
are wealth, access to public services, taxation, family composition, capacities and the cost of goods
and services. Economic inequality is rising in Ireland and those working on the front line are seeing
the need for their services change and grow. According to Social Justice Ireland there are 680,000
people, including 200,000 children, living in food poverty. The reason why a wider assessment of
inequality beyond mere incomes is necessary would appear to be obvious, but it can be stated as
follows – if that which we all need to live including shelter, food, healthcare and other essential
needs are removed from an assessment of inequality, and mere income is assumed to be given to us
free of these needs, then of course inequality can be presented as falling.

If only real life worked like that. The collective impact of the testimonies here from Basket Brigade,
Inner City Helping Homeless, SPARK, Traveller Visibility Group, the Muslim Sisters of Eire
and Penny Dinners speaks to an Ireland of growing economic inequality. We already know that
enforced deprivation rose in 2019. We know that pre-pandemic rents are at their highest rates ever,
running between 48% and 68% of the median wage in Dublin. We know that close to 1 million
people are waiting to see a Consultant. When the cost of essentials is removed from social welfare
or workers incomes we see real, acute and growing need for support in providing shelter, food, fuel
and healthcare. ICHH speak of:
       ‘an increase of over 400% between 2015-2019 in the number of homeless children’.

But those who aren’t homeless struggle badly too. In addition to providing the stark title to this
paper Penny Dinners (Cork) talk about:
           ‘poverty growing all the time, there is no equality where poverty is concerned’

They also tell us about the ‘trauma of inequality’, about workers struggling on a minimum wage or
how ‘even some families with two people working are struggling’, they tell us about suicide, a lack
of clothes, and emphatically tell us:
 ‘We know everything about inequality, and we know it’s on the rise. 2020 was a long tough year
          for Penny Dinners. 2021 will be even tougher, probably our toughest ever’

To present inequality as currently falling in Ireland is not only wrong in this context, but it is a
conclusion drawn and presented from incomplete and deeply flawed data. The data that has been
presented elsewhere to argue that such a fall in inequality has occurred is interrogated in depth
here:
   It is wrong to present the ‘Gini Coefficient’ as pointing to a fall in income inequality without
   any explanation of the serious and acknowledged systemic flaws in the ‘gini’ method. This
   method (gini) consists of a survey of a small number of self-selected households, such method
   being known to under-report high incomes
   A more universal set of figures based on actual taxation levels which points in the opposite
   direction, to a rise in income inequality, needs to be acknowledged and included

                                                                                                         3
‘HUNGRY
BELLIES Exploring inequality and deprivation in Ireland
ARE NOT
EQUAL
TO FULL
BELLIES’

           Income inequality data itself does not suffice as a measure of economic inequality anyway. It is
           but one of at least seven aspects
           There are serious issues with the historic nature of data presented as showing falling inequality
           in any event, with some key data relied upon dating back to the ‘Celtic Tiger’ period up
           to 2007 – before the financial crash of 2008, the unequal recovery, and now a global pandemic
           Other data which we present here that shows ‘zero real income growth’ from 2007 to 2017
           but is ignored in the reportage, even though the source of that data is relied upon in other ways.

       As Ireland emerges from this pandemic the cost of the necessary supports, healthcare, vaccination
       and recovery will be substantial. They will define the budget position of this and future
       Governments for a time to come. Who will pick up the tab? This question is put by Pat Leahy in his
       article in the Irish Times on 5 December 2020 when he states:
               ‘how to pay for the larger State that will result from the pandemic. They will be faced
                       with choices, and these choices will not always – or ever – be easy’.

       This question is indeed relevant, and will become more so. But if economic inequality is not fully
       contextualised , explained and understood then there are real dangers that the cost, as in the
       past, will primarily be borne by those who can least carry it. Who will pay? Will it be the Travellers
       represented by Traveller Visibility Group who:
            ‘are currently dealing with Travellers across the city (Cork) with multiple issues around health,
                                   mental health, education and accommodation’?

       Or will it be those helped by SPARK who state that:
       ‘2020 starkly showed the disproportionate impact care work has on Mothers. It is felt more acutely
        by lone parents. The National Childcare Scheme has had a hugely negative impact on lone parent
                                           families in greatest need’?

       Or perhaps it will be the children helped by Ber Grogan and her ‘Basket Brigade’ who find a
       growing need for:
                 ‘staples for a Christmas dinner such as meat, fresh veg, tins of veg, boxes of trifle,
                                                 selection boxes etc.’

       ..that they provide? Perhaps it will be the people that:
           ‘greeted them at the doors crying, children dancing in the rain, mothers breaking down crying,
                                          children waiting at the windows’

       Surely in a fair and just society it cannot be the poorest that bear the burden. In this neoliberal
       era economic inequality is growing and the acute need and suffering of our most vulnerable is
       growing too. If we are to discuss and address the real current examples of actual growing economic
       inequality we must consider all the data, up to date, and marry it with the real lived examples of
       what is happening in our society today.

4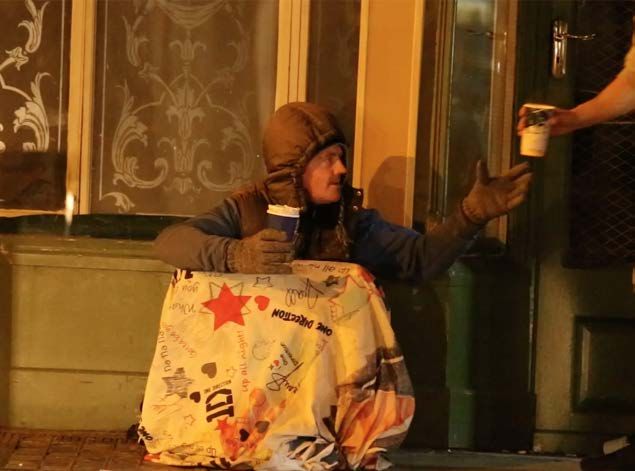
Introduction
An Oxfam report published in January 2021 entitled ‘The Inequality Virus’1 found that 87% of
respondent economists think that coronavirus will lead to an increase, or a major increase, in
income inequality in their country. This projected additional inequality is added to a ‘world that was
already extremely unequal’, a world where ‘a tiny group of over 2,000 billionaires had more wealth
than they could spend in a thousand lifetimes’, and where ‘the richest 1% have more than double
the income of the bottom half of the global population’.2 It is also a world where ‘the richest 1%
have consumed twice as much carbon as the bottom 50% for the last quarter of a century, driving
climate destruction’.3

In Naomi Klein’s stellar work ‘The Shock Doctrine – The Rise of Disaster Capitalism’4 the Author
‘explodes the myth that the global free market triumphed democratically’ and gives evidenced
historical context to the neoliberal maxim, ‘never waste a good crisis’. The global fiscal catastrophe
of 2008 saw Ireland adopt a model of socialising private speculators’ debts which was akin to
socialism for the rich, (disaster) capitalism for the poor. And predictably now too, the disaster of a
global pandemic is used to further embed inequality and profit a small elite at the expense of the
vast majority.

The Oxfam report captures this reality best in outlining how:
‘Since the onset of the pandemic, many large corporations have put profits before workers’ safety,
pushed costs down the supply chain and used their political influence to shape policy responses.
This has led to mega-corporations seeing their profits soar, driving up the wealth of their rich
shareholders, while small and medium sized enterprises (SME’s) and low wage workers and women
are bearing the brunt of the crisis.5 While the top 25 US corporations were on course to earn 11%
more profits in 2020 compared with the previous year, small business in the US looked likely to lose
over 85% of their profits in the second quarter of the year.’6

1
    The Inequality Virus, Oxfam January 2021 - https://oxfamilibrary.openrepository.com/bitstream/handle/10546/621149/
    bp-the-inequality-virus-250121-en.pdf
2
    World Inequality Lab. (2017). World Inequality Report 2018. http://wir2018.wid.world/
3
    T.Gore. (2020). Confronting Carbon Inequality: Putting climate justice at the heart of the COVID-19 recovery. Oxfam
    International. http://www.oxfam.org/en/research/confronting-carbon-inequality
4
    https://tsd.naomiklein.org/shock-doctrine.html
5
    U. Gneiting, N. Lusiani and I. Tamir. (2020). Ibid
6
    Oxfam America. (2020). Pandemic Profits Exposed. Media briefing, 22 July 2020. http://assets.oxfamamerica.org/media/
    documents/Pandemic_Profiteers_Exposed.pdf

                                                                                                                           5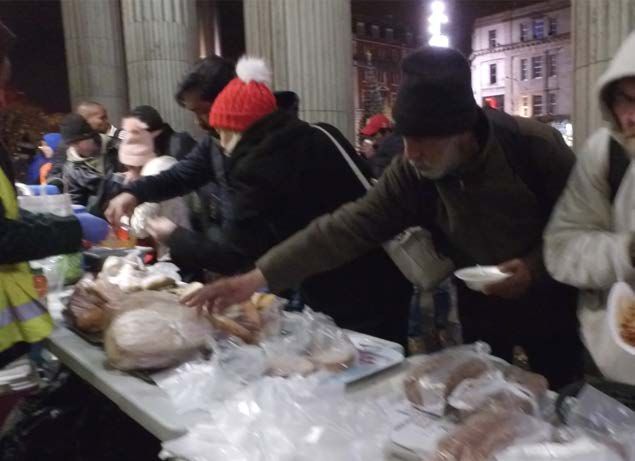
‘HUNGRY
BELLIES Exploring inequality and deprivation in Ireland
ARE NOT
EQUAL
TO FULL
BELLIES’

       MYTHMAKING AND HUBRIS – A BAD IRISH HABIT

             HUBRIS – EXTREME PRIDE OR ARROGANCE: Hubris
             often indicates a loss of contact with reality and
             an overestimation of one’s own competence or
             capabilities, especially when the person exhibiting it is
             in a position of power.

       This all feels very familiar. It feels like we have been here before. Prior to the global fiscal crash in
       Ireland in 2008 all was well with the Irish economy, or so we were told. Newspapers burgeoning with
       ‘property porn’, and other media, loudly heralded the ‘Celtic Tiger’ and presented the economy of
       this little island nation as nothing less than world beating. Our financial institutions were headed by
       people held up to us as paragons of fiscal rectitude and world leaders in their field. The likes of Sean
       Fitzpatrick and Michael Fingleton could do no wrong. They were feted by broadcast and print media
       as colossuses of the financial world, veritable wizards with inbuilt super powers leading the way for
       Ireland, showing the rest of the financial world how it was done. And what could possibly go wrong?
       Even if something bad happened somewhere, the financial system had ‘checks and balances’. And
       wasn’t the Central Bank in charge anyway? It was all so safe. Ireland was a world leader and we had
       so much cause to be confident, even proud. Hubris reigned supreme.

       Those who dared speak out about the ever increasing levels of personal debt and property prices
       rising to absurd degrees could find themselves being described as both a ‘left wing pinko’ by then
       European Commissioner Charlie McCreavy, and as being suitable for suicide ideation, by our then
       Taoiseach Bertie Ahern. Consensus was everything, ‘don the Green jersey’ was the mantra. And,
       even as a global crash loomed, the same voices told us we in Ireland were certain of a ‘soft landing’.

       After the ‘soft landing’ had occurred with all the subtlety of a meteor crashing into the Earth we
       had time to reflect on just how such bizarre agenda setting had come to be not only common
       place, but the only permissible narrative. How had it happened, and how had it pertained right up
       until the day disaster finally struck? Yet the methodology was simple and transparent:

           Firstly, an ‘Economist’ or appointed ‘expert’ (often self-appointed but given the freedom of the
           airwaves nonetheless) would produce an ‘economic analysis’ to tell us that what we were seeing
           before our eyes – an impending catastrophe – was in fact a mirage. It might even have been a
           mirage brought on by our excessive ‘partying’. This ‘partying’ was however to deflect us from
           the narrative that ‘the fundamentals of the Irish financial system’ (and property market) were
           ‘sound and robust’,

           Secondly, the media would take that ‘analysis’ and bestow upon it legitimacy and gravitas,
           patronage and publication, together with unhealthy dollops of scorn for any naysayers
           questioning the chosen orthodoxy

           Thirdly, Politicians would then lift this economic hocus pocus and media spin and use it to define
           political direction. The recklessness in the financial and property markets was thereby encouraged
           well beyond the point of no return. This ‘analysis’ also formed the bedrock of the political

6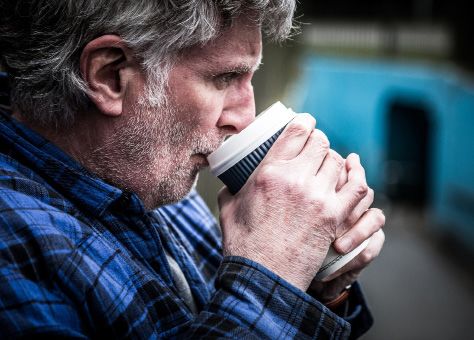
approach when disaster did strike. At that point a secondary narrative of protecting the gamblers
and speculators that had driven the country off a cliff edge led to even the debts of unsecured
bondholders being socialised. This was done to wide acclaim from the ‘experts’. Margaret Thatcher
would have approved of the accompanying narrative, ‘There Is No Alternative – ‘TINA’
When this occurred there was a resolve afterwards that it would never happen again. It felt like, but
was never formally expressed as, a social contract. We the people of Ireland had been lined up by
reckless and unscrupulous vested interests and their cheerleaders, the economy had been stripped
bare, our economic sovereignty ceded and our regulators exposed as simply a veneer behind which
wrongdoing had been running amok. But now lessons would be learned and we would do better in
future. Yet well over a decade on, it would appear nothing has been learned.
ECONOMIC INEQUALITY, DEPRIVATION, POVERTY AND
DISCRIMINATION ARE REAL
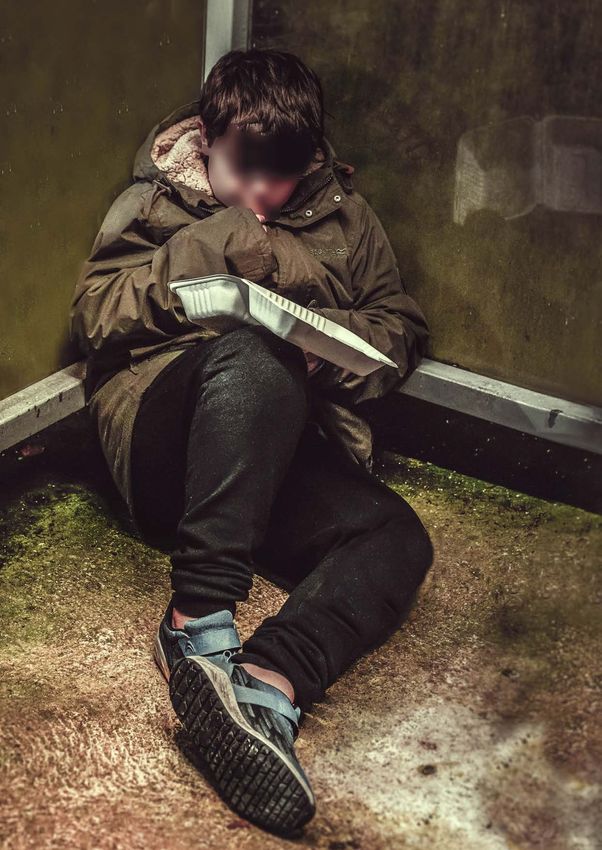
It is the view set out in this paper that economic inequality in Ireland in 2021 is horrendous and
growing and that poverty, deprivation and discrimination are seriously and unacceptably high. All
over our country real life heroes work at great personal cost and expense to ameliorate the impacts
of this inequality, deprivation, discrimination and poverty. Every night the streets of our cities and
towns see them doing soup runs, handing out food, hot drinks, blankets, tents. Medical advice is
sought and given. There are life and death fights against poverty, fights for mere survival, taking
place every day. Too many lose the fight. Homeless people dying on our streets was considered
obscene when Jonathan Corrie died in 2015. It caused a national outcry. Politicians rushed to make
it clear that it was unacceptable and the root causes would be addressed. Yet by 2021 we have now
reached a point where homeless people die on our streets at an average of well over one death per
week. Homeless people dying on our streets is now so routine that many deaths are barely even
reported in the news. While shelter is now considered a sometimes unattainable luxury, relief and
support is constantly provided by volunteers. Empathy and understanding, yes even love for our
fellow man, woman and child, is given without question.
Except the need is questioned. On 5 December 2020 the Irish Times, once known as the ‘paper of
record’ carried a gushing piece selling Ireland again as a world beating nation where wealth was
rising, and inequality falling, at the same time. The article was based on a selective interpretation
of data that was itself selectively assembled, but the narrative was clear – Ireland had broken the
mould and was a world beater again. In a further echo of the past the article also then specifically
targeted naysayers and sought to eliminate any further discussion on the matter by simply declaring
‘the facts are the facts’. The Irish Times subsequently refused to carry a lengthy rebuttal piece
challenging those ‘facts’. Predictably, within days, a Politician from the establishment parties,
Senator Jerry Buttimer, seized upon the narrative to celebrate these ‘facts’ namechecking the ‘paper
of record’ on the Oireachtas record in doing so. But falling inequality is not a ‘fact’. The opposite is
the case. Increasing economic inequality, poverty, deprivation and discrimination is a fact as is set
out in this paper.
In the first part of this paper we will outline, in considerable depth, the data underpinning these
issues in order to construct a true picture of Irish inequality and deprivation, and how to measure it.
We are grateful for the work of Dr. Conor McCabe in doing so and his ‘deep dive’ analysis into the
relevant data makes up the first part of this paper.
7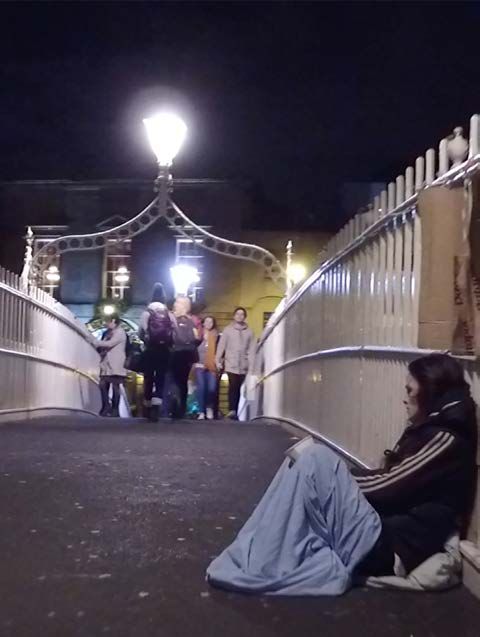
‘HUNGRY
BELLIES Exploring inequality and deprivation in Ireland
ARE NOT
EQUAL
TO FULL
BELLIES’
       We then move to analyse current economic inequality through the testimony of those who face
       it every day. We do so because, to selectively analyse data only (even substantial data as we seek
       to do) without considering the real lived evidence of those working on the ground addressing it –
       experts in their field – would not be an exercise in fully considering inequality in all its aspects. You
       can’t just ‘intellectualise away’ inequality, poverty, discrimination or deprivation – attractive as the
       prospect may seem.

             ‘You can’t just ‘intellectualise away’ inequality, poverty,
             discrimination or deprivation – attractive as the
             prospect may seem’

       The testimonies that make up the second part of the paper come from organisations and experts in
       the field with many years’ experience. They are:

           Basket Brigade (Dublin)
           Inner City Helping Homeless (ICHH)
           Muslim Sisters of Eire (MSOE)
           Penny Dinners (Cork)
           SPARK (Single Parents Acting for the Rights of Kids)
           Traveller Visibility Group (Cork)

       In this way the paper has, we submit, an important impact – it vindicates the work and sacrifice
       that Ireland’s volunteers, through their toil and love, provide to our most needy and
       vulnerable people and families. It demonstrates that their work, and the need for it, is
       growing and not declining. Their work and relief is not only necessary but essential, not
       alone selfless but heroic, and it should never be undermined or forgotten. It must be
       vindicated and supported.

       We all owe these organisations and many others, and all the volunteers working in and with them,
       a great debt of gratitude.

       On behalf of Unite Trade Union I thank them, and we submit this paper and their testimonies for
       your contemplation.

       Brendan Ogle
       Senior Officer – Republic of Ireland
       February 2021

8
Measuring inequality in Ireland
THE BIG PICTURE
SETTING AN UNFAIR NARRATIVE
On 5 December 2020 the Irish Times published an article by Pat Leahy which said that inequality
is falling in Ireland. RTE’s Brainstorm website had published a similar article on 19 November, this
time by the University College Cork (UCC) Economist Seamus Coffey. These were picked up by Fine
Gael Senator Jerry Buttimer who spoke in the Seanad on 14 December. He referenced both authors
and stated that they had both shown that in Ireland ‘people are getting richer and we were
becoming more equal’.1
The claims made by Leahy, Coffey, and Buttimer are misleading and unfair. They are unfair to all those
suffering from economic inequality, deprivation or poverty. They are also unfair to those, mostly unpaid
volunteers, who struggle might and main to provide necessary support to people suffering the real life
impacts of economic inequality. There is a danger that, unless challenged, these claims will become
accepted as facts. The purpose of this analysis which I have completed with, and for, Unite Trade
Union in the Republic of Ireland is to show in detail where and why these claims are misleading, and
to provide evidence of, and alternatives to, the growing inequality in our society.
This is not a straightforward process because the issues at hand are somewhat technical. Both
Coffey and Leahy use specialist terms and methodologies and in the process gloss over the
limitations, contradictions, and failings of the surveys they put forward in their articles as objective
and unassailable evidence of their claims. In the words of Leahy, ‘the data is the data, the facts are
the facts’;2 while for Coffey, ‘Everyone can have their own opinion on the best way forward,
but they cannot have their own facts’.3
1
Seanad Debates, 14 Dec 2020. Vol. 273, No. 8: 546.
2
Pat Leahy. ‘Ireland is becoming more unequal? Wrong’. Irish Times. 5 Dec 2020. All subsequent quotes from Leahy are
from this source.
3
Seamus Coffey. ‘Why has income inequality fallen in Ireland?’ RTÉ Brainstorm. 19 Nov 2020. All subsequent quotes from
Coffey are from this source. [https://www.rte.ie/brainstorm/2020/1119/1179134-ireland-income-inequality/] 9‘HUNGRY
BELLIES Exploring inequality and deprivation in Ireland
Ex-
ARE NOT
EQUAL
TO FULL
BELLIES’
Unfortunately, ‘having their
own facts’ is essentially what
Leahy and Coffey have done, and
unfortunately the distortions in
their assumptions have already
made it into the political arena.
This analysis will look at the claims
of Leahy, Coffey, and Buttimer, with
particular emphasis on those of Coffey as
his work informs the statements of the other
two. I will do so in some detail as it is necessary to
delve deep into the manner in which material was found to
fit the narrative and deliver statements as stark as ‘the data is the
data, the facts are the facts’.
Before beginning I want to just say that there are solutions to growing inequality which involve
greater investment in our social infrastructure, in particular in health, housing, childcare, and home
care; stronger trade union legislation and membership; and a just transition towards a sustainable
future. It is not rocket science: the barriers are simply ideological and political. But they can be
overcome, with trade unions and communities working together to build a better world.
We also have to be honest however and say this from the outset: there are sections of our
society that will fight and resist these solutions in any way they can, because the way
forward threatens the very inequalities that sustain their wealth and socially destructive
activities. Inequality is a profitable business model for many. The political will to address it
is missing for a reason.
This analysis, and the lived experiences that follow it, are put forward as a counter to those sections
of our society and their ways of thinking, and as a guide to the type of solutions we need today.
LEAHY AND INEQUALITY – IRELAND ‘BUCKING A TREND’?
‘In many countries, ordinary working people have seen their incomes stagnate while elites secured
larger and larger slices of the economic pie’ writes Leahy, but that ‘Ireland has bucked this trend.
Yes you read that right. Inequality is falling in Ireland and has been for years.’
Leahy cites two main sources of information to back up this statement.
The first is the OECD. He says that data from the organisation ‘published earlier this year found that
while inequality had increased from one generation to the next in most countries, in Ireland it was
the opposite’.
The second is the UCC economist Seamus Coffey. He has ‘written extensively about this
phenomenon’ says Leahy, ‘and what is truly remarkable about Ireland, as Coffey points out, is that
the falling inequality has come at a time of strong economic growth. In other words, we are getting
richer, and also more equal at the same time.’
10The third source that Leahy cites is the independent ‘Think-tank for Action on Social Change’
(TASC). Quoting the report he says
‘TASC, the left-wing economic think tank, publishes an
annual survey of inequality, and in the 2020 edition,
commented on Ireland’s “non-conformism” to the “trend
of rising inequality in most countries”, suggesting the
explanation lay in the extraordinary economic progress
of the Celtic Tiger period. Whatever the reason, the
TASC report says, “while inequality was on the rise
elsewhere, it was falling here”.’
Leaving aside his political positioning of TASC it appears that Leahy’s source for the OECD is from these
two reports – so with that in mind we will deal with the OECD at the same time as Coffey and TASC.
The current Irish phenomenon of ‘getting richer and also more equal at the same time’, according
to Leahy, ‘is the product of good decisions made over a period of time, by patience, by
far-sightedness, by the gradual accretion of acts of good government’. It shows that Irish
governments are not right-wing but social democratic, and good at it as well.
According to Leahy, these facts are drowned out by the voices of ‘powerful special interests’. These
are ‘the professions, the multinationals, the public sector trade unions (currently lining up for
another pay deal) or Ireland’s remarkably prolific NGO sector’.
He believes that these facts are important because the Irish government – either this one or the next
one – will have to decide ‘how to pay for the larger State that will result from the pandemic. They
will be faced with choices; and these choices will not always – or ever – be easy’.
This is the core of his argument: Ireland is getting richer and more equal; this has only been
achieved by very few countries; the Irish state has managed to do this because of the far-sighted
vision of successive Fine Gael and Fianna Fáil-led governments; and we need to keep that in mind as
we face into the future with some rocky roads and tough decisions ahead.
Finally, he says that when it comes to falling inequality in Ireland, ‘the data is the data, the facts are
the facts.’ It is, beyond doubt, a real thing according to Leahy. The evidence is there: we need to just
accept it and move on by keeping to the same policies and the same political parties in government
as we have now.
Once we go looking for the evidence, however, we find that here are significant problems with
Leahy’s article. The manifesto is clear, but the ‘data’ and ‘facts’ that underpin it is quite another
story.
11‘HUNGRY
BELLIES Exploring inequality and deprivation in Ireland
Ex-
ARE NOT
EQUAL
TO FULL
BELLIES’
Unfortunately, given the nature
of those issues, it requires a deep
dive into the data and reports
that underpin his argument. This
takes time and energy as well
as a familiarity with the core
documents, their terminology
and methodologies, which for
the average reader is not usually an
option. But it is vital. The stakes are high,
as Leahy himself pointed out.
But people lead busy lives. They expect articles in the Irish
Times on inequality to be at least authoritative. So when one is
published that says that inequality in Ireland is falling and that this is simply a fact, they are usually not
in a position to question that statement, even if it goes against their actual, everyday experience.
The purpose of this section is to do just that: to test Leahy’s argument against the evidence he relies
upon, and see whether it stands up and is, indeed, just ‘the facts’.
It also involves finding the evidence he cites, which as we will see is not a straightforward process
by any means. But put on your seatbelt, we will get there!
Before we even get to the evidence, however, we have to deal with terminology as used by Leahy:
in particular, the word ‘inequality’ itself.
THE USE OF THE WORD ‘INEQUALITY’
In his article, Leahy uses three different terms for inequality as if they are interchangeable. But they
are not.
He starts off with economic inequality. He says that ‘One of the most corrosive trends in western
democracies – a social and economic problem that has impoverished millions of ordinary people
and fuelled the rise of far-right populists from the US to Britain to Europe and beyond – is the rise of
economic inequality’.
Leahy does not provide a definition of the term but according to TASC, economic inequality ‘refers
to the unequal distribution of material resources — that is the resources people need to attain
goods and services to satisfy their diverse needs and to flourish as individuals’.4 It is clear therefore
that this refers not only to income, but also to access to essential services such as health, education,
childcare, homecare, and housing. It also relates to personal capacities and how this affects
inequality, such as illness or disability.
TASC says that ‘economic inequality is about more than income, since it is only one of the material
factors that affect people’s ability to flourish. Income disparities may matter less in a society with
strong universal public services than in a society without them’.5
4
Nat O’Connor and Cormac Staunton. Cherishing All Equally: Economic Inequality in Ireland. Tasc: Dublin, 2016: 12.
5
O’Connor and Staunton: 12.
12When measuring economic inequality, it looks at seven distinct yet interrelated factors. These are:
income; wealth; public services; tax; capacities; family composition; and the costs of goods and services.6
In his article, Leahy goes from economic inequality to immediately talking about incomes, which
is only one element of economic inequality. He then moves on to equate income inequality as
‘inequality’. What started off as a complex, interconnected dynamic involving income, wealth,
services, personal capacities, and access to public services, tax, and family composition, is therefore
reduced to income alone.
Leahy has to do this because the main evidence he provides comes from the economist Seamus
Coffey and his writings on income inequality.
Leahy says the following in his article:
‘The UCC economist Seamus Coffey has written
extensively about this phenomenon [Ireland having
the biggest fall in income inequality]. And while many
of the issues surrounding this debate – because of the
obvious political implications – are contested territory,
the data is the data, the facts are the facts… And what
is truly remarkable about Ireland, as Coffey points
out, is that the falling inequality has come at a time of
strong income growth. In other words, we are getting
richer, and also more equal at the same time. This is a
neat trick, managed by very few… only Ireland had high
income growth and falling inequality.’
Leahy does not say to which specific articles by Coffey he is referring; however, but on 19 November
2020 RTÉ’s Brainstorm website published an article by Coffey which tallies with Leahy’s line around
high income growth and falling inequality, and so it is to that we must now turn our attention.
SEAMUS COFFEY AND INEQUALITY
In his article for RTÉ, Coffey gives a definition of inequality. He says, ‘When used on its own, “inequality”
is typically a shorthand for inequality in disposable income, the money available for households after the
addition of social transfers, the deduction of taxes, and before any bills have been paid’.
This differs significantly from that used by TASC, and as with Leahy, it equates the length and
breadth of inequality with only one particular element only: disposable income.
He also gives a definition of market income, which he says is ‘income earned from labour and capital’.
Finally he explains the ‘gini coefficient’, which he says ‘measures the difference between the actual
income distribution versus a distribution with perfect equality. If everyone has the same income, the
gini coefficient will be zero; if one person has everything, the gini coefficient will be one’.
6
O’Connor and Staunton: 13.
13‘HUNGRY
BELLIES Exploring inequality and deprivation in Ireland
ARE NOT
EQUAL
TO FULL
BELLIES’
Coffey then makes three core statements:
Ireland is the only country in his sample to achieve both high income growth and falling income
inequality
Ireland has one of the most progressive income tax systems in the OECD and our tax system has
a greater impact on the gini coefficient relative to all other OECD countries
Repeatedly stating that inequality is rising does not make it so; people cannot have their own
facts
To make his arguments, Coffey uses a research paper published in the Journal of Income
Distribution in 2018, entitled ‘Rising Income Inequality and Living Standards in OECD Countries:
how Does the Middle Fare?’7 It was written by Stefan Thewisswen and colleagues (hereafter
referred to as “Thewisswen”). He also cites work by Barra Roantree of the Irish Economic and Social
Research Institute (ESRI), and although he does not reference the source itself, it appears to be a
paper entitled ‘Understanding Income Inequality in Ireland’ from March 2020.8
We can already see that there is a problem regarding verification of Leahy’s argument. In his original
article he cited Coffey; now we have reached Coffey but, frustratingly, we have to dig further to get
to the actual, verifiable data. And so we will.
THEWISSWEN AND RISING INCOME INEQUALITY
The purpose of the Thewisswen paper is to ‘examine how income inequality and median household
incomes have evolved over time and the extent to which rising inequality is associated with changes
in median incomes’.9 Its overall purpose is to ‘investigate the extent to which rising income
inequality is associated with stagnating middle incomes’.10
To do so, it draws upon the Luxembourg Income Study (LIS) database and the OECD Income
Distribution Database to get figures for equivalised disposable household income, which it then
adjusts via national consumer price indices and purchasing power parities, converting all income to
2011 PPP-adjusted dollars. Equivalised disposable household income is a statistical process whereby
household incomes are added together and then ‘equalised’ using a series of statistical weights and
measures.
It then uses not one, but two indicators of income inequality. The first is the gini coefficient which it
calculates from micro-data in the LIS and OECD databases. The second is the income share going to
the top 1%. The data for this is not sourced from the same database as household income as ‘both
the LIS and OECD databases really have difficulty capturing what is happening at the very top of the
income distribution’; so the authors ‘draw on the World Inequality Database, which uses data from
the administration of income taxes together with the national accounts’.11
7
Stefan Thewisswen et al. ‘Rising Income Inequality and Living Standards in OECD Countries: How Does the Middle
Fare?’ Journal of Income Distribution 26, no.2 (2018): 1-23.
8
Barra Roantree. ‘Understanding income inequality in Ireland’. March 2020. [http://www.ssisi.ie/SSISI_173_03-Roantree_
paper_PDF.pdf]
9
Thewisswen: 2.
10
Thewisswen: 2.
11
Thewisswen: 5.
14Thewisswen uses this data to produce a table of 31 countries showing changes in average median
income, average change in gini coefficient, and the average top 1% share. The data
range for each country varies, with some going back as far as 1977.
With regards to the household income data on Ireland, Thewisswen
focuses on the period 1987 to 2007 (14 years ago and before
the financial crash), noting that the annual change in median
disposable incomes in Ireland was 4.52%.12 Ireland also
experienced an average change in the gini coefficient of -0.13
points. In other words, Ireland experienced a rise in median
incomes and a fall in disposable household income (adjusted
to individual allocations) from 1987 to 2007.
Getty Image
In his article for RTÉ, Coffey himself builds a new graph
around this table which he labels as ‘Income Growth
and Inequality Changes 1980s to 2010s’ – even though
Thewisswen has data for Ireland from 1987 to 2007 only.
While data for other countries in some cases goes up to 2013,
that is not the case for Ireland – and yet Coffey provides no caveat to
the reader (nor any alternate source of data), leaving them to presume that
the data survey must include Ireland for the 2010s. Indeed, he says in his article,
‘In the three decades since the 1980s [i.e. from the 1990s to 2010s], Ireland is the
only country in the sample to achieve both high income growth
and falling income inequality’.
As we will see later, the period 2008 to 2017 was very different from the period1987 to 2007.
A data survey that ends at the cusp of the Celtic Tiger is different to one that takes in the economic
crash, the bailout of the banks, the arrival of the Troika, and the unemployment and emigration that
followed in their wake, as well as the muted recovery and now a global pandemic.
When we look at the OECD’s income distribution database, for example, we see that Ireland’s gini
coefficient was at 0.295 in 2008, and 0.295 in 2017 – essentially stagnant for ten years.13
All that Coffey has shown with his graph is that median incomes rose in Ireland from 1987 (when
unemployment was at 16.9%) to 2007 (when unemployment was at 4.8%), and that inequality as
measured by the gini coefficient fell as a result.
12
Thewisswen: 10.
13
OECD. Income Distribution Database. https://stats.oecd.org/Index.aspx?DataSetCode=IDD#
15‘HUNGRY
BELLIES Exploring inequality and deprivation in Ireland
ARE NOT
EQUAL
TO FULL
BELLIES’
However, in addition, the second measurement of inequality in the Thewisswen paper is that of the
share of income going to the top 1%. Thewisswen says,
‘Most of the English-speaking countries where top
income shares rose particularly rapidly (namely
Australia, Canada, the UK and the USA) also saw overall
inequality rise markedly. Ireland is an exception: the
share of the top 1% increased rapidly but overall
inequality declined.’14
But Ireland is one of a number of states where of the two measures of inequality referenced, one
shows inequality falling in Ireland (the gini coefficient, which Coffey uses), while the second one
shows income inequality rising (the share of income to the top 1%, which Coffey does not use). The
other states are Denmark, France, and Portugal.
Thewisswen is aware of the inconsistency in data, this inconsistency between the two
measurements of inequality – the gini coefficient and the share of income going to the
top 1%, and not only references it but seeks to consider the reasons for it: ‘it may arise for
a variety of reasons: changes at the top may be missed in household surveys to a varying
extent across countries and the gini measure is in any case more sensitive to changes
occurring around the middle than at either extreme of the distribution, so the gini may
mostly reflect inequality within the “bottom 99%”’.15
On top of this he adds,
‘It is important not to lose sight of differences [between
states] in the search for a common, consistent pattern
and overarching story. Furthermore, available estimates
of changes in inequality are subject to error, and
different sources and indicators do not always tell the
same story, so caution is required in using these data,
not least in studying their relationship with household
income growth.’16
But we know that despite TASC setting out 7 components of economic inequality Coffey and Leahy
focus solely on ‘income’, and go to some efforts to do so.
Throughout the paper, Thewisswen refers to issues with the household surveys that are used to
calculate the gini coefficient. With that in mind, it is important to look at that methodology of
measurement in an Irish context.
14
Thewisswen: 8.
15
Thewisswen: 9.
16
Thewisswen: 16.
16GINI COEFFICIENT
Unlike taxation based measurement of income the gini coefficient for Ireland is not
based on information on the 1.7 million households in the state but on a small
sample of them – 4,183 to be exact (around 0.2 per cent of the total).
The survey, as it itself makes clear, is voluntary. In 2019 the
CSO invited over 9,000 households to take part in the survey
but in the end only 40% agreed. Almost 2,000 households
refused outright, while another 2,800 gave various reasons
listed as ‘other’ by the CSO.17
This means that while the CSO conducts a random selection
of private households for the initial catchment, within that
random selection there is a form of self-selection, or self ‘de-
selection’. There are households that will not share their income
data, while there are others that will – and it is only those that
freely volunteer the information that end up in the survey.
Even here the issues with the gini co-efficient do not end. The data
from each household is collected throughout the year by interview. The
CSO employs around 100 people to carry out this work, but often they call to
a house and not everyone is at home. They then conduct interviews ‘by proxy’ – that
is, information is provided by ‘another resident of the household due to unavailability
of the person in question’.18 Up to 50 percent of all interviews for the income survey are by
proxy, which gives rise to issues ‘with the quality of data for proxy responses for certain variables’
according to the CSO.19
The voluntary nature of the survey, as well as issues with the interview process, lead to statistical
bias. ‘Changes at the top [incomes] may be missed in household surveys’ wrote the authors of the
2018 paper,20 while Robert Sweeney in his report on inequality for TASC said that such surveys
‘have well-known limitations when it comes to the measure of income, and hence inequality. Being
voluntary, non-response is a problem among the rich in particular, and high incomes tend to be
underreported when they do respond.’21
These issues help explain the difference between the gini coefficient, which is based upon a
voluntarist and incomplete sample survey of 0.2 per cent of Irish households, and the growth in
income share to the top one per cent, which is calculated from data provided by the Revenue
Commissioners of every income tax return in the state (over two million tax units). Only one of these
is genuinely national in scope, and it happens to be the one which suggests rising income inequality.
It is also the one that Coffey ignores.
17
CSO. Standard Report on Methods and Quality for the Survey on Income and Living Conditions (EU-SILC) 2019. CSO,
2020: 55.
18
Standard Report: 30.
19
Standard Report: 30.
20
Thewisswen: 8.
21
Robert Sweeney. The State We’re In: Inequality in Ireland 2020. Tasc: Dublin, 2020: 13-14.
17‘HUNGRY
BELLIES Exploring inequality and deprivation in Ireland
ARE NOT
EQUAL
TO FULL
BELLIES’
It is no surprise then to hear that
the data collected from household
surveys has to be ‘cleaned up’
Getty Image
by the CSO before it ends up in
the final survey. This requires the
use of various statistical weights
and assumptions to compensate
for missing data. It produces a
final product which is tentative
and provisional in its findings and should
not be used without caveats. None of these
caveats sit very well with definitive and far reaching
statements such as ‘the facts are the facts’.
In the end the gini coefficient is calculated through a random sample survey of 0.2 per cent of
all households in the state; within which there is a high degree of self-selection, or due to the
thousands of households selected that refuse to share their financial information; with up to 50
per cent of the data collated not through direct engagement but through interview by proxy; with
the raw data then subject to a series of statistical weights, measures, and guesswork in order to
compensate for gaps in the interviews; before being put through a formula with its own weights
and measures in order to produce a so-called measure of inequality.
This is why, in the words of Thewisswen and colleagues, ‘our findings can only be suggestive, but
they do imply that neither of the popular grand narratives featuring so strongly in current debates
– that high or rising inequality consistently boosts or reduces real economic growth for the middle –
reflects the variety of experiences actually observed across the rich countries in recent decades.’22
Having gone through the Thewisswen paper, we can say the following about Coffey’s use of it:
He presents inequality in disposable income as shorthand for inequality when this is not the case
He presents data from the Celtic Tiger years as it if pertains to today
He neglects to mention that while one measurement showed inequality falling in Ireland up to
2007, the other showed it on the rise
He neglects to mention the methodological issues with household surveys as highlighted by
Thewisswen
The Thewisswen paper is only one source used by Coffey. We now turn our attention to the second one.
BARRA ROANTREE AND INEQUALITY
In his paper, Roantree also highlights the fact that ‘household surveys tend to undersample those
in the extreme tails of the income distribution. As a result, they are not a reliable source of data for
examining the nature of income inequality at the very top’.23 With that caveat in place, he then
sets up three different though interrelated databases for measuring income inequality. The first is
22
Thewisswen: 17.
23
Roantree: 2.
18market income, which he defines as ‘household income before taxes, transfers or pensions’.24 Under
this measurement, Ireland’s gini coefficient ‘was the highest (most unequal) in the EU-28 at 0.544,
followed closely by Portugal, Bulgaria and Greece’.25
The second is market income plus welfare benefits and pensions (‘gross household income’). When
these are factored in, Ireland’s gini coefficient ‘falls slightly from being the most to the 5th most
unequal country’ in the EU-28.26
Thirdly he looks at gross household income minus taxes on income (‘disposable income’). He finds
that ‘it is only when taxes are deducted from gross income to get disposable income that inequality
in Ireland falls significantly relative to other EU countries’.27 It leaves Ireland ‘the 13th most unequal
country of the EU-28 as measured by the gini coefficient for disposable income, mid-table and just
above the median of 0.296’.28
As with Coffey, Roantree also makes the argument that income inequality has improved since 1987.
In making his calculations, Roantree runs into a problem in that the CSO’s Survey on Income and
Living Conditions (SILC),29 his main source of data, only goes back to 2003. In order to go back to
1987, he reverts to the publication, Poverty, Income and Welfare In Ireland, which was published
by the ESRI in 1989.30 This was also a sample survey, initially of 5,850 households, but after 24 per
cent refused to participate they were left with a pool of 3,294, once non-responses were factored
in.31 ‘The refusal rate was somewhat higher than that found in most other Institute surveys’ it said,
‘presumably due to the sensitivity of the subjects covered in this survey and the complexity of the
questionnaires involved.’32 As with the SILC, the random sample survey was subject to a significant
form of self-selection as those who did not want to discuss their finances effectively left the room.
The methodologies used to collate and frame the data in the 1987 report differ from those of the
SILC. This leads Roantree to adapt and modify some of the findings in order to ‘fit’ the SILC data.
He also draws upon the 1997 Living in Ireland survey which again was designed in the absence
of SILC definitions. I mention these methodological disjoints simply to show that the findings as
presented are not as clean and straightforward as Coffey makes out. Indeed, it seems foolhardy
to say ‘you cannot have your own facts’ when in reality that is what Roantree has done: no matter
how methodological his approach, the underlying surveys used different sampling, bias, weights,
and assumptions which Roantree has had to ‘fit’ together.
24
Roantree: 5.
25
Roantree: 7.
26
Roantree: 11.
27
Roantree: 11.
28
Roantree: 11.
29
https://www.cso.ie/en/statistics/socialconditions/surveyonincomeandlivingconditionssilc/
30
T. Callan, B. Nolan, B. Whelan, D. Hannan, and S. Creighton. Poverty, Income and Welfare in Ireland. No. 146. Dublin,
ESRI: 1989.
31
Callan et al: 42.
32
Callan et al: 43.
19‘HUNGRY
BELLIES Exploring inequality and deprivation in Ireland
ARE NOT
EQUAL
TO FULL
BELLIES’
Even here, there are issues. While Roantree’s headline figure has inequality falling over the past
thirty years, a more nuanced picture emerges when we delve into the decades themselves. Roantree
writes that the first period,
‘between 1987 and 1997 can be characterised as
regressive, with disposable incomes rising almost
twice as fast at the top of the distribution as the
bottom. The second – between 1997 and 2007 – can
be characterised as progressive, with disposable
incomes rising by more at the bottom than the top
as well as at a remarkably rapid rate; more than
10 per cent across the distribution. The final phase
– between 2007 and 2017, encompassing both the
recession and subsequent economic recovery –
can be described as neutral, with zero real income
growth across the distribution.’33
We can see that the heavy lifting, so to speak, in a drop in disposable income inequality, occurred
from 1997 to 2007 – the height of the Celtic Tiger years when Ireland experienced de facto full
employment. Since 2007 there has been no improvement in disposable income inequality as
measured by Roantree. It has been static, as we saw with the figures from the OECD.
Finally, unlike Leahy and Coffey, Roantree fully acknowledges that disposable income inequality
is only one measure of inequality. He says that ‘there are certain areas where our knowledge is
limited [and that among these is] the composition and extent of incomes at the very top…we also
know little about the joint distribution of income, consumption and wealth in Ireland. International
research has shown that wealth is much more unequally distributed than income, which is in turn
more unequally distributed than consumption.’34
Roantree highlights some of the other factors that are crucial to any holistic measurement of
inequality, such as wealth, and the ability to attain essential goods and services. Although he does
not mention all seven areas of economic inequality that TASC highlights, nonetheless he makes
sure to inform the reader that his paper is but one aspect of inequality. Such balance and nuance is
absent from Coffey’s article, which is determined to present net disposable income inequality as the
only measurement, despite what the research he relies upon says.
This provides a completely different scope to assess the article by Seamus Coffey that Pat Leahy
relies upon to make his argument that Ireland is becoming richer and more equal. The main findings
in Coffey’s article are based on statistics from the Celtic Tiger years, and ignore the fact there was
no net drop in the gini coefficient from 2008 to 2017. Nor does it take into account the tentative
and circumstantial nature of the gini coefficient due to the methodological shortcomings in the
household surveys that underpin it – shortcomings that underestimate the earnings of those at
33
Roantree: 4.
34
Roantree: 14-15.
20the top. How can we measure income inequality based solely on a survey that is known to under-
estimate earnings at the top? These shortcomings are well-acknowledged by the experts – indeed,
Thewisswen goes out of his way to try to compensate for them by bringing in figures for the top
1%. None of this seems to matter to Leahy or Coffey.
There is, however, one more source that Leahy draws upon: the 2020 TASC report on inequality.
This also needs to be analysed as Leahy is not entirely straightforward in his handling of the
material, or in his political positioning of TASC which describes itself as an ‘independent think tank’.
TASC and Inequality
The full title of the TASC report cited by Leahy is The State We Are In: Inequality in Ireland 2020.
The key line used by Leahy is contained in the full paragraph quoted below.
‘The wealth of available evidence points to a trend
of rising inequality in most countries. Ireland’s non-
conformism can be explained, in part, by its unique
development trajectory. Plagued by high unemployment
for most of the latter 20th century, the emergence of
the Celtic Tiger expanded access to the labour market,
with many well-paying jobs. While inequality was on
the rise elsewhere, it was falling here.’
The last sentence is the one that Leahy quotes to prove his point. However, the very next paragraph
in the report which Leahy doesn’t use qualifies the statement, to say the least:
‘Another explanation for Ireland’s stability is that it is
only apparent, and that inequality has actually been
increasing [my emphasis]. The data presented so far
have ultimately been drawn from surveys, which have
well-known limitations when it comes to the measure of
income, and hence inequality.’
Leahy quotes the line that inequality may be falling but neglects to quote the line that says that
inequality may be also on the rise.
Furthermore, he sidesteps the historical nature of the data – the focus on the Celtic Tiger period
which ended thirteen years ago – as well as the comparative nature of the surveys themselves. In
other words, inequality may only appear to be falling in Ireland because of its rise in other European
states and that historically Ireland has come from a low-income equality base.
This point was made by the Author of the report, Robert Sweeney, in a letter he wrote to the Irish
Times in response to Leahy’s article. He said that ‘Ireland’s performance with respect to its peer
21‘HUNGRY
BELLIES Exploring inequality and deprivation in Ireland
ARE NOT
EQUAL
TO FULL
BELLIES’
group is more a product of poor performance elsewhere than falling inequality here. If we compare
the level of inequality in Ireland with European levels in the 1980s and 1990s, we find Ireland to
have higher inequality than about two-thirds of countries in Western Europe.’35
As we already saw, Sweeney in his report for TASC highlights the methodological distortions that
are inherent in household surveys. The full quote is below:
‘Being voluntary, non-response [in these surveys] is a
problem among the rich in particular, and high incomes
tend to be underreported when they do respond.
Official statistics, which also rely on surveys, therefore
tend to underestimate inequality. If incomes at the top
are becoming more concentrated, the problem may
get worse as there is a greater incentive to hide and
underreport. There is evidence that the discrepancy
between income reported in surveys and the higher
incomes reported to tax authorities is growing. That
would suggest that the underestimation of inequality
is becoming more pronounced.’36
This means that all three academic papers cited either by Leahy or Coffey – Thewisswen, Roantree, and
TASC – have highlighted the problems with the collation and calculation of the gini coefficient from
these surveys. Yet, despite this, not once does Leahy, or indeed Coffey, make this known to the reader.
All the discussion on inequality up to now has been on income. We can see that there are
significant methodological flaws in the way the data those measurements are based upon is created
and processed. And yet, as TASC highlighted in its 2015 report on economic inequality, income
inequality is only part of the picture. We also need to look at wealth; public services; capacities;
family composition; and the costs of goods and services.
ECONOMIC INEQUALITY – A REALITY CHECK
Leahy, Coffey, and Buttimer are using the wrong tools to ask the wrong questions to come up with
the wrong answers.
They are ignoring the constitutive elements of economic inequality. Indeed, they have to do this,
otherwise they cannot say that Ireland is becoming more equal – even though that statement is
based on disposable income statistics from 13 years ago that are calculated from a survey of 0.2%
of households where high-income earners self-censor their earnings.
We have been here before. In the years leading up to the 2008 crash, Irish economists and policy makers
used their wisdom to miss the obvious: that we were in the midst of a speculative bubble; financed
through the foreign borrowings of private banks; where a blanket guarantee was seen as the solution.
35
Robert Sweeney, ‘Measuring inequality’. Irish Times. 12 Dec 2020.
36
Sweeney. State We’re In:14.
22You can also read