The Irish Not-for-Profit Sector: Fundraising Performance Report 2015 - Amy Power Dennis O'Connor Karena Walshe - 2into3
←
→
Page content transcription
If your browser does not render page correctly, please read the page content below

The Irish Not-for-Profit Sector:
Fundraising Performance Report
              2015

                Amy Power
              Dennis O’Connor
               Karena Walshe

                     2into3,
                  Benson Street,
          77 Sir John Rogerson’s Quay,
                    Dublin 2.
                 +353 1 640 1823
                www.2into3.com
Contents
Foreword................................................................................................................................................. 2
Executive Summary................................................................................................................................. 3
1      Introduction .................................................................................................................................... 4
    1.1        Regulation of Not-for-Profit Organisations............................................................................. 5
2      Data used in this Analysis................................................................................................................ 6
    2.1        Data Collection Challenges ..................................................................................................... 8
    2.2        Average vs. Median................................................................................................................. 9
3      Overview of Sample ...................................................................................................................... 10
    3.1        Division into Subsectors ........................................................................................................ 10
    3.2        Age of Organisations ............................................................................................................. 13
    3.3        Income of Organisations ....................................................................................................... 14
    3.4        Estimated Contribution to GNP ............................................................................................ 16
    3.5        State Income ......................................................................................................................... 16
    3.6        Change in State Income (2012 to 2013)................................................................................ 18
    3.7        Staff ....................................................................................................................................... 19
    3.8        Salaries .................................................................................................................................. 21
    3.9        Change in Staff Numbers (2012 to 2013).............................................................................. 23
4      Fundraising .................................................................................................................................... 24
    4.1        Fundraised Income................................................................................................................ 24
    4.2        Fundraising Composition ...................................................................................................... 26
    4.3        Estimated GDP and Per Capita Equivalent ............................................................................ 32
    4.4        Fundraising Costs .................................................................................................................. 33
    4.5        Fundraising Trends ................................................................................................................ 36
5      Conclusion ..................................................................................................................................... 39
6      References .................................................................................................................................... 40
7      Appendix A – Statistical Method................................................................................................... 43
8      Appendix B – Complete Sample of Organisations – Main Database ............................................ 45
9      Appendix C – Complete Sample of Organisations – Database of Large Organisations ................ 59
About 2into3 ......................................................................................................................................... 63
About the Sponsors............................................................................................................................... 63
About the Authors ................................................................................................................................ 64

                                                                              1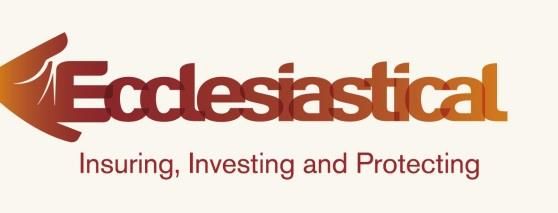
Foreword
This is the fifth annual Fundraising Performance Report prepared by 2into3 for the Irish not-
for-profit sector. It provides a detailed overview of a representative sample of organisations
and provides insights into their activities and experiences, especially in relation to
fundraising.

This report estimates both the size of the not-for-profit sector and the total amount of
fundraised income or philanthropy in Ireland, in 2013. The sector is important economically
yet under researched. Charitable giving is a significant source of income, and rose for the
fourth year in succession in 2013 yet lags behind the U.K on a per capita basis and as a
proportion of GDP. For the first time, this report outlines differences as to why charitable
giving is higher in the U.K which may prompt discussion on how, and to what extent, this
gap can be bridged.

There is still a significant dearth of quantitative information available on the Irish not-for-
profit sector. This report highlights the critical importance of making improvements to the
quality of data in the sector and we look forward to the impact of the Charities Regulatory
Authority on the availability of information on all not-for-profits.

We hope that this report will stimulate debate, discussion and reflection and will encourage
civic and private stakeholders to support the efforts of the sector in continuing to increase
fundraising performance.

Dennis O’ Connor,
Director, 2into3

November, 2015

                                                2
Executive Summary

Despite its importance in terms of GDP, employment and provision of services and facilities,
there is a significant dearth of quantitative information available on the Irish not-for-profit
sector. Lack of data hinders effectiveness and efficiency by making it difficult for
organisations to benchmark themselves against the rest of the sector, to identify best
practice or to develop appropriate fundraising targets.

This report is based on the annual accounts of a representative sample of Irish not-for-profit
organisations and is an attempt to provide a quantitative insight into the current status of
the sector, especially in relation to fundraising performance and costs. The aim of the report
is to provide objective information, to stimulate debate and discussion among and within
organisations and to promote more open and detailed reporting of fundraising data.

Key findings from the report are presented below:

 Key Findings
 Estimated total income of the not-for-profit sector in 2013     €12.4 billion
 Estimated size of the fundraising market in 2013                €740 million
 % change in fundraised income between 2012 and 2013             +0.8%
 Estimated rate of charitable giving per capita                  €161
 Average cost to raise €1 in 2013                                28 cents*
 State funding as a % of total income in 2013                    63%
 Change in state funding between 2012 and 2013                   -1%
 Salaries as a % of total expenditure in 2013                    45%
 Estimated contribution of the sector in GNP in 2013             9.1%

* Estimates based on a small, non-random sample and should be viewed with caution. See
 Section 4.4

                                                3
1 Introduction

The not-for-profit sector plays a defining role in society. From universities and hospitals, to
youth groups and sports clubs, individuals engage with not-for-profit organisations on a
daily basis. Local needs are met by housing and social service charities, while international
development organisations, advocacy groups and religious bodies strive for justice.
Meanwhile, art, sports and other special interest groups entertain, educate and create.
Whilst the not-for-profit sector shapes life in Ireland it also reflects Irish society, revealing
the priorities, passions and values of our national psyche.

Despite this, systematic research into the organisations that make up the Irish third sector is
scant and we know relatively little about the day-to-day realities faced by the not-for-profit
sector. The dearth of information about the activities, income, expenditure and challenges
faced by the not-for-profit sector stifles progress, ideas and advancements. Policy makers
make decisions based on estimates, and CEOs and fundraising managers are unable to
benefit from knowledge sharing and best practice of similar organisations. The on-going
dialogue about the importance of growing and supporting the not-for-profit sector runs the
risk of sounding hollow if not supported by a strong empirical foundation. This report aims
to bridge the knowledge gap somewhat by providing an insight into the composition of the
sector and its status in 2013; especially in terms of fundraising activities, performance and
cost. Our key aims are to provide objective information, to stimulate debate and discussion
within and among organisations, and to encourage further analysis of this important sector.

                                               4
1.1 Regulation of Not-for-Profit Organisations
There are a number of challenges associated with obtaining an accurate picture of the Irish
not-for-profit sector. Even determining the population of not-for-profit organisations is
quite difficult. In Ireland, charitable status does not exist as a legal concept and there is
currently no record of Irish not-for-profits. This ambiguity will be addressed by the now
established Charities Regulatory Authority (CRA) and through the Register of Charities. Once
compiled, only organisations on this register can conduct charitable fundraising. Unlike in
England, Wales and Northern Ireland, sport is excluded from the remit of the 2009 Charities
Act. Sports clubs or organisations that engage in fundraising will then be able to continue to
fundraise without registering with the CRA as they do not qualify for charitable status
(Federation of Irish Sports, 2013).
Organisations that qualify for charitable status will be expected to comply with a Statement
of Principles for Fundraising and specific Codes of Good Practice for Fundraising, once
developed. Currently however, there is a lack of clarity about the boundaries and
composition of the sector. Organisations can register with the Companies Registration
Office, but are not obliged to do so; the Revenue Commissioners do not require an
organisation to be incorporated before granting charitable tax exemption. Organisations
that are granted charitable tax exemption are allocated a CHY number, however, having a
charity number does not equate to being a registered charity.
In 2009, the Charities Act was enacted to address the lack of regulation in the sector. The
individual provisions of the Act will be implemented in stages and include:
The creation of a register of all charities operating in the State, including charities
from outside the State who wish to operate in Ireland. The Charity Register will be
made available to the public online.
A definition of charitable purposes for the first time in primary legislation.
5 The establishment of a Charities Regulatory Authority designed to ensure
compliance and encourage the better administration of charities.
Charities will be required to submit an Annual Activity Report to the new Authority.
Statutory accounting and audit (or independent examination) obligations imposed
on all charities which are not incorporated under the Companies Acts. The
Companies Acts continue to apply to charities incorporated under those Acts.
Since its establishment in October 2014, the CRA has not yet reached its potential in
implementing the above provisions, mostly due to a lack of resources. In April 2015 the
Minister for Justice, Frances Fitzgerald, received a submission from the CRA to extend the
deadline for registration of charities by twelve months. The Authority stated that, as of April
2015, approximately 200 organisations had initiated the registration process. However, with
the recent implementation of a simplified process for registration and preparation of Annual
Reports coupled with the addition of eight new staff members, charities will receive
additional supports to meet the April 2016 deadline.
2 Data used in this Analysis
A complete list of the 7,090 not-for-profit organisations registered with the Companies
Registration Office was supplied to 2into3 by INKEx in 2012. As each of these organisations
is incorporated, they are obliged to submit their annual accounts to the Companies
Registration Office. These accounts can be accessed by the public1. This list comprises of
3,636 entities with a charity number and 3,454 without. INKEx classified each organisation
into one of the 12 subsectoral groups devised by the Johns Hopkins Comparative Nonprofit
Sector Project, a classification system now adopted by the UN. As part of a previous report
in this series (see 2into3, 2014), this categorisation was analysed in detail by 2into3 resulting
in a number of organisations initially classified as Philanthropic Intermediaries and
Voluntarism Promotion being reclassified. The re-categorised INKEx classification is used in
1
These accounts were accessed via VisionNet’s database. http://www.vision-net.ie/
6this report. A further list of 3,810 organisations was supplied by the Revenue
Commissioners; a large number of which were found to be incorporated since its drafting in
2009. This indicates a trend that more not-for-profits are becoming incorporated over time.
Data is very difficult to obtain on unincorporated not-for-profits. Until the provisions within
the Charities Act 2009 are fully implemented, they are under no regulatory obligation to
make financial statements publically available, and, for reasons of confidentiality, Revenue
will only publish information on their registered name, charity number and registered
address. However, a large number of organisations are incorporated and their accounts
available. As seen in Table 1, a stratified random sample of not-for-profit organisations was
constructed. The sample reflects the sectoral makeup of the not-for-profit sector as given by
the INKEx report. However, due to difficulty in accessing the accounts of unincorporated
organisations we believe that there is an overrepresentation of larger unincorporated
bodies indicating that any computed figures will be upper bound.
Three samples of organisations were used in this study. The main sample used comprises of
8% of all not-for-profits in Ireland. The second is a 26% sample of all organisations with total
incoming resources exceeding €1 million. The third is a small sample of organisations with a
total income exceeding €1 million that responded to an anonymous survey.
A representative sample of 100 large organisations was invited to participate in this survey,
of which 27 responded. Unless explicitly stated otherwise, the figures presented in the
report are for the main sample. Stratified random sampling was used to ensure that the
samples can be extrapolated and are representative of their respective populations. This
technique is explained in detail in Appendix A.
7Table 1: Descriptions of Samples used in Analysis
Description of Data Population Sample Size Sample as % of
Size Population
All Organisations 10,900 872 8%
Organisations with Total 662 175 26.5%
Incoming Resources > €1million
Survey Sample of Organisations 662 27 27% of 100 invited
with Total Incoming Resources > organisations
€1million
2.1 Data Collection Challenges
Unfortunately, even when accounts are obtained, extracting key data about fundraised
income and costs of not-for-profits is still very challenging. Naturally, annual accounts were
not compiled with the intention of inclusion in our analysis, and in many cases very limited
information on fundraising is provided. As INKEx (2012) note, the Accounting Standards
Board permits income to be reported as a single line. However, such an aggregated format
does not permit analysis of income sources. Some organisations present their income in a
more disaggregated format but combine sources of funding (e.g. income from events and
corporate sponsorship), or subsume fundraised income under another heading. Moreover,
the level of detail provided by some organisations changes each year. While some
organisations have engaged in more transparent and detailed reporting, others have
significantly reduced the information provided. These inconsistencies in reporting impacted
on the availability of accurate comparative data, resulting in a large proportion of the
sample being replaced. Thus the subsequent findings outlined should be seen in isolation
from previous reports in this series.
Only a very small proportion of organisations utilise the Statement of Recommended
Practice for Charities (SORP) standards when preparing their accounts; INKEx (2012)
estimate 3% while The Wheel (2014) found a higher figure of 10%. These standards require
a high level of detail regarding sources of income and are mandatory for charities in the U.K
8but optional in the Republic of Ireland. Most organisations (76%), however, follow the
advice of their accountants in terms of the standard used to prepare annual accounts (The
Wheel, 2014). Moreover, between 2011 and 2012, over a third of the not-for-profit sector
was found to be aware of the Statement of Guiding Principles for Fundraising, and among
those the majority applied the principles (The Wheel, 2014).
2.2 Average vs. Median
The Irish not-for-profit sector is highly heterogeneous, comprising of a large number of
small organisations and a very small number of extremely large bodies. This diversity has an
impact on the validity of certain summary statistics; in particular the use of average figures
can be quite misleading. Instead, a more appropriate metric to use is the median.
Average: To find the average, all observations are added up, and divided by the number of
observations. However, this means that if a few numbers are particularly high or low
(‘outliers’) they will have a disproportionate effect on the calculated average, pulling it up
or down.
Median: The median is simply the value separating the upper half of a set of numbers
from the lower half. The median is calculated by arranging all of the observations from
lowest to highest value and selecting the middle value. As such, it is not affected by
especially high or low outliers.
Where appropriate, both the median and average figures are reported. The proportion of
observations that lie above and below the average will also be noted. These figures will give
some indication of the severity of the diversity: in an even distribution, 50% of the
observations should lie above the average, and 50% below.
This diversity is particularly evident in relation to income and staff numbers, as can be seen
in Sections 3.3 and 3.6.
93 Overview of Sample
3.1 Division into Subsectors
Organisations were divided into one of 12 subsectors by INKEx. Where we deemed it
appropriate, organisations within the Philanthropic Intermediaries and Voluntarism
Promotion category were reclassified. Organisations included in the sample were identified
using the process of stratified random sampling. This means that the proportion of
organisations in each subsector is the same for both the sample and the entire population of
firms. Figure 1 below shows the proportion of organisations by subsector. Development and
Housing is the largest subsector, comprising of over a quarter of not-for-profits in Ireland,
and therefore the largest in our sample. The Culture and Recreation and Social Services
subsectors are also very significant, with each accounting for one in five organisations. The
remaining subsectors are made up of a relatively small number of organisations.
Figure 1: Participating Organisations by Subsector – Main Sample
1%
Culture and Recreation ,185
5%
3%
2% Education and Research ,39
4%
21%
Health ,37
4%
Social Services ,173
Environment ,37
4%
Development and Housing ,249
4%
Law, Advocacy and Politics ,33
28% Philanthropic Intermediaries and
Voluntarism Promotion ,17
International ,32
20%
Religion ,24
4%
Business and Professional Associations ,40
Not Elsewhere Classified ,6
Sample Size: 872
10This pattern changes significantly when subsector size is determined by income rather than
number of organisations. While the Development and Housing subsector stays the largest,
accounting for more than one in every four euro of total income, the Education and
Research subsector is also very significant, accounting for 25% of the total, with Health
organisations yielding 21%.
Figure 2: Relative Size of Subsectors by Income – Main Sample
1%
0% Culture and Recreation, 2.3%
0%
1% 0% Education and Research, 24.8%
6% 2%
Health, 21.2%
25% Social Services, 9.1%
Environment, 8.7%
26%
Development and Housing, 25.8%
Law, Advocacy and Politics, 0.9%
Philanthropic Intermediaries and Voluntarism
Promotion, 0.4%
International, 5.7%
21%
9% Religion, 0.3%
9% Business and Professional Associations, 0.7%
Not Elsewhere Classified, 0.1%
Sample Size: 856
When comparing the size of subsector by number of organisations and income, some
Education and Research organisations appear very large, because, although they only
account for 4% of the organisations in the sample, they receive one quarter of total income.
By contrast, although one in every five organisations is in the Culture and Recreation space,
between them they only account for 2% of income. This pattern is clearly shown in Figure 3
11which illustrates the proportion of total income and total organisations accounted for by
each subsector. It is very clear that the average income of organisations varies across
subsector and, apart from the Development and Housing subsector, does not correspond
with the size of the sector. This is particularly the case for the Culture and Recreation
subsector and the Education and Research subsector.
Figure 3: Subsectors as Percentage of Total Income and of Total Organisations – Main
Sample
0% 5% 10% 15% 20% 25% 30%
Culture and Recreation 2%
21%
Education and Research 25%
4%
Health 21%
4%
Social Services 9%
20%
Environment 9% % of Total Income
4%
Development and Housing 26%
29% % of Total
Law, Advocacy and Politics 1% Organisations
4%
Philanthropic Intermediaries and… 0%
2%
International 6%
4%
Religion 0%
3%
Business and Professional Associations,… 1%
5%
Not Elsewhere Classified 0%
1%
Sample Size for % of Total Income: 856
Sample Size for % of Total Organisations: 872
123.2 Age of Organisations
The average age of organisations in our main sample is 20.6 years. However, there is
significant diversity in the age of not-for-profits with the oldest organisation founded in
1696 and the youngest just three years ago.
Figure 4: Age Distribution of Sample
350 311
Number of Organisations
300
250
200 165
133
150
100
38 27 21
50 19 17
0
< 5 years 5 to 9 years 10 to 19 20 to 29 30 to 39 40 to 49 50 to 99 > 100 years
years years years years years
Sample Size: 731
As illustrated in Figure 5 below, the Law, Advocacy and Politics subsector is on average the
youngest, while Education and Research organisations are the oldest. Of the 35
organisations in the Education and Research subsample, four were founded over 100 years
ago. Larger organisations tend to be older; the average age of organisations with total
incoming resources exceeding €1 million is 28.1 years.
Figure 5: Average Age by Subsector
45.0 42.6
40.0
35.0 30.1
Age in Years
30.0 23.7 24.0 22.8
20.6 22.7
25.0 19.2
20.0 17.2 15.6 15.4
14.4 14.8
15.0
10.0
5.0
0.0
Sample Size: 731
133.3 Income of Organisations
The majority of organisations in the not-for-profit sector are extremely small; over 40% of
the sample had an income of less than €100,000 in 2013. As seen in Figure 6, only 12% of
the sample had an income exceeding €1 million.
Figure 6: Income Distribution of Main Sample
> €10 million
€2.5 million to 3%
€1 million to €2.5 10 million
million 3%
6%
< €50,000
€500,000 to
31%
€1 million
10%
€250,000 to €500,000
17%
€50,000 to
€100,000
€150,000 to 12%
€250,000
11%
€100,000 to €150,000
7%
Sample Size: 856
Figure 7 shows the income of each organisation when ordered alphabetically. The bottom of
the graph is the most densely populated due to the high number of small organisations,
while the large-scale organisations feature intermittently. There is clear disparity of income
between the lowest and highest income brackets within the not-for-profit sector, with a
number of particularly small and extremely large organisations featuring in our sample.
14Figure 7: Scatterplot of Income
€90,000,000
€80,000,000
€70,000,000
€60,000,000
€50,000,000
€40,000,000
€30,000,000
€20,000,000
€10,000,000
€0
0 100 200 300 400 500 600 700 800 900
Sample Size: 851
The heterogeneous nature of the sector is also clear in the Summary Statistics in Table 2. For
the main sample, although the average income is €2,760,211, the median is just €152,882
showing that a few large organisations are inflating the average figure. Only 6% of
organisations have income above the average figure. This pattern is also evident for the
sample of organisations with total incoming resources exceeding €1 million; only 13% have
an income above the average figure.
Table 2: Summary Statistics – Income, 2013
Main Sample Sample of Organisations with
Total Incoming Resources
Exceeding €1 million
Average €2,760,211 €8,130,331
Median €152,882 €1,781,004
% Above Average 6% 13%
% Below Average 94% 87%
Sample Size 856 175
153.4 Estimated Contribution to GNP
The organisations in our main sample had a combined income of €2.36 billion in 2013. As
these organisations are an approximately representative sample, this number can be
extrapolated to the entire sector. As the sector is heterogeneous, a small number of very
large organisations have the potential to skew the aggregate figures. In order to reduce the
possibility of overestimation the top 1% of organisations were removed from extrapolation2.
Due to the bottom-heavy nature of the sector, an estimation of size is only possible at this
time. In order to report a definitive size of the market, more accurate and reliable data is
needed. With these caveats in place, it is suggested that the Irish not-for-profit sector had
an income of €12.4 billion in 2013. Irish GNP was €137 billion in 2013 (CSO, 2014),
suggesting that the not-for-profit sector contributed 9.1% to the Irish economy. While an
approximation, the authors note that this figure remains within the region of previous
research; the 1999 Johns Hopkins study yielded higher figures of 8.2% of GDP and 9.3% of
GNP in 1995 (Donoghue et al., 1999).
3.5 State Income
Irish not-for-profit organisations have a very high reliance on state income, as seen in Figure
8 below. While there are many organisations in the not-for-profit sector that do not receive
state income, for those that do, an average contribution of 63.3% of total income was
identified. The Development and Housing subsector and Law, Advocacy and Politics
organisations are the most reliant on the state, while Social Service organisations and the
Education and Research subsector are those most likely to source funding elsewhere. No
information on state funding was provided by any group in the Religious subsector.
However, this does not necessarily mean that they receive no income from the State or EU;
it may mean that they simply do not indicate this explicitly in their accounts.
2
The 99% of organisations below this threshold were multiplied by ≈12.5 to estimate the total market size.
Organisations above this threshold were then added to the total figure. As such, these large organisations
appear only once.
16Figure 8: State Income as a Proportion of Total Income by Subsector
100%
90%
90% 83%
80% 77%
68% 70%
70% 63%
60% 56%
49%
50%
40%
40% 36% 36%
30%
20%
10%
0%
Sample Size: 342
Organisations with total incoming resources exceeding €1 million appear to be somewhat
less reliant on state or EU funding, with this form of income accounting for 54.7% of total
receipts. This finding is slightly higher to that of the Wheel (2014), which found that the
state grants/contracts (local, national and EU) account for 53% of income in 2011/2012. The
U.K Almanac found that for less than one in ten organisations (9%) statutory bodies are the
majority provider of their income (National Council for Voluntary Organisations, 2015).
173.6 Change in State Income (2012 to 2013)
On average, state funding as a proportion of total income reduced by 1%. Specific sectors
show a different pattern however; state income as a proportion of total income fell by 6.5%
for Law, Advocacy and Politics organisations, and by 5.8% for Environmental organisations.
The Education and Research sector as well as Social Services also saw a reduction in receipts
from these sources.
Figure 9: Change in State Income by Subsector (2012 to 2013)
2.0%
1.3%
1.0%
1.0% 0.7%
0.5%
0.0%
Average
Culture and Recreation
Education and Research
Health
Social Services
Environment
Development and Housing
Law, Advocacy and Politics
Philanthropic Intermediaries and Voluntarism Promotion
International
Business and Professional Associations, Unions
-1.0%
-1.0%
-2.0%
-1.8%
-3.0%
-1.7%
-4.0%
-5.0%
-1.1%
-6.0% -5.8%
-6.5% -3.2%
-7.0%
Sample Size: 302
While the not-for-profit sector experienced a reduction in state funding in 2013, the rate of
reduction appears to be stabilising. Between 2008 and 2012, Harvey (2012) identified an
overall reduction of 2.82% in state income with a reduction of 2.2% between 2011 and
182012. The state funding landscape is set to change, however, with the implementation of
the Public Service Reform Plan (2014-2016). In line with the Public Service Reform Plan
2014-2016, ‘the Public Service must begin to transition away from the traditional system of
block grants to organisations providing public services and move instead to a new approach
based on releasing funds in return for delivering specified outcomes’ (Department of Public
Expenditure and Reform, 2014: 15). Such measures may impact on the proportion of state
funding received by the sector and for specific subsectors.
3.7 Staff
Similar to previous versions of this study, most organisations included in this sample have
very few paid staff members or none at all, with just over half employing five or less. Only
9% of not-for-profits have more than 50 staff.
Figure 10: Distribution of Organisations by Staff Numbers
> 100 Staff
51-100 Staff
5%
4%
0 Staff
18%
11-50 Staff
25%
1-5 Staff
34%
6-10 Staff
14%
Sample Size: 567
19The diversity of the sector can again be seen in Figure 11. Similar to the income of the
sector, the majority of organisations rest at the bottom of the graph. There are some clear
outliers however, with the greatest staffed organisation consisting of 2,585 employees.
Figure 11: Scatterplot of Staff Numbers
3000
2500
2000
1500
1000
500
0
0 100 200 300 400 500 600
Sample Size: 570
On average, organisations have about 36 staff members, a number just over seven times
that of the median of 5. Only 11% of organisations have staff levels above the average. As
would be expected, larger organisations have more staff, but they also show the same
diverse pattern, with an average figure of 77 and a median of just 31.
Table 3: Summary Statistics – Staff
Main Sample Sample of Organisations with Income
Exceeding €1 million
Average 36 77
Median 5 31
% Above Average 11.6% 18.2%
% Below Average 88.7% 81.8%
Sample Size 567 154
203.8 Salaries
Staff costs are a major component of spending for not-for-profit organisations, accounting
for an average of 45% of total expenditure. Salary costs vary across subsector, with just over
60 cent out of every euro spent on salaries in Health organisations. International
organisations and Development and Housing organisations have a very low salary
expenditure ratio, at 14% and 29% respectively. Both sectors include very large
organisations; therefore these findings may be due to economies of scale.
Figure 12: Salaries as a Proportion of Total Expenditure by Subsector
70%
61%
60% 56%
54%
52% 53%
49%
50%
45% 45% 44%
40% 37%
34%
29%
30%
20%
14%
10%
0%
Sample Size: 503
21Larger organisations appear to benefit from economies of scale in relation to employment
costs, with salaries accounting for 36% of total expenditure. The pattern is similar when
compared to the main data, with the lowest ratio found for International organisations
(21%). Comparatively, the highest salary expenditure ratio for large organisations was in
Social Services (71%).
Figure 13: Salaries as a Proportion of Total Expenditure (Total Incoming Resources >€1
million)
80%
71%
70%
60%
50% 44% 45% 44%
40% 41%
40% 36% 37% 37%
32%
29%
30%
21% 22%
20%
10%
0%
Sample Size: 158
223.9 Change in Staff Numbers (2012 to 2013)
The majority of organisations’ staff numbers stayed the same between 2012 and 2013, as
seen in Figure 14. A similar number of organisations’ staff numbers either increased or
decreased during this time; 115 organisations reported a reduction in staff while 118
reported growth in staff numbers.
Figure 14: Organisation Staff Numbers (2012 and 2013)
Increased
22%
Stayed the Same
56%
Decreased
22%
Sample Size: 529
Comparatively, more positions were created per organisation when compared to those that
were lost. Figure 15 illustrates that between 2012 and 2013, a net of 60 jobs were created;
591 lost and 651 created. Staff levels have remained steady, with a 0.4% increase in
employment between 2012 and 2013.
23Figure 15: Change in Staff numbers (2012 and 2013)
800
651
600
400
Staff numbers
200
60
0
Net change Jobs created Jobs lost
-200
-400
-600
-591
-800
Sample Size: 529
4 Fundraising
4.1 Fundraised Income
Internationally, Ireland is viewed as having a highly generous population. The World Giving
Index has consistently ranked Ireland in the Top 5 most charitable nations. In 2012 and
2013, Ireland was ranked the most generous nation in Europe (Charities Aid Foundation,
2012 and 2013). The country’s relationship with charity has been found to be consistent;
from 2008-2013 the proportion of the population giving to charity has been 70% or over,
with the frequency of donating increasing from 70% in 2012 to 74% in 2013. This section of
the report analyses fundraised income received by our sample of not-for-profits.
As indicated in Section 2, many sets of accounts are aggregated so that fundraised income is
subsumed under the ‘total income’ figure. Only a small number of organisations in our
sample gave additional information. It is on this small group that the analysis is carried out.
As such, the results are no longer necessarily representative of the experiences of the entire
sector.
24Figure 16 shows the breakdown of fundraised income across the different subsectors.
Similar to previous versions of this report (see 2into3, 2014), Social Services and
International subsectors were found to be especially prolific fundraisers in 2013; combined,
they account for nearly €7.50 out of every €10 raised. While Culture and Recreation
organisations only contribute 5.2% of total fundraised income, this subsector’s potential
may not be fully reached as sport is currently excluded from the remit of the 2009 Charities
Act. While sport plays a significant role in Irish society a with over 500,000 Irish adults
volunteering each year, the Federation of Irish Sport cites that sport is at a significant
disadvantage compared to other subsectors that qualify for charitable status when it comes
to accessing philanthropic support (Federation of Irish Sport, 2013).
Figure 16: Fundraised Income by Subsector
1% 0%
2% Culture and Recreation, 5.2%
2% 5%
3% Education and Research, 1.5%
Health, 2.9%
31% Social Services, 42.3%
Environment, 3.5%
Development and Housing, 2.4%
43% Law, Advocacy and Politics, 6.2%
Philanthropic Intermediaries and
1%
6% Voluntarism Promotion, 1.2%
2% International, 31.5%
4%
Religion, 2.2%
Sample Size: 379
254.2 Fundraising Composition
A wide range of techniques are used to raise funds in the not-for-profit sector. These include
direct mail, running events, soliciting large gift donations and selling items. Implementation
of each of these requires a different skillset, time commitment and cost. Each organisation
must identify what range of fundraising techniques best meets their funding needs and
capacity, measured in terms of overall income. The composition of the fundraising mix is
also dependent on the subsector and the specific cause of the organisation.
As can be seen in Figure 17, nearly 80% of donations are unspecified in the sample’s annual
accounts. Thus, while this form of fundraised income is included in the analysis, further
detail as to the type of donation or method used is unknown. For fundraising methods that
have been specified in the annual accounts of this sample of not-for-profits, contributions
from legacies are significant; accounting for 7% of total fundraised income. In addition,
event income and trusts and foundations feature strongly, generating 5% and 4% of this
form of income respectively. Donations received from legacies appear to be increasing when
compared to previous versions of this study, while major gifts and corporate income
continue to account for a very small proportion of total receipts.
Figure 17: Sources of Reported Fundraised Income, Main Sample
2% Event Income , 5%
5% 2%
Corporate Income/Sponsorship,
7%
2%
4% Selling Something , 2%
1%
Legacies, 7%
Foundations & NGOs, 4%
Major Gifts, 1%
79%
Unspecified/Other, 79%
Sample Size: 643
26The reported income from legacies is received by less than ten organisations. The average
legacy in this sample totals over €1.2m. Similarly, legacies account for £2 billion (11%) of
total fundraised income in the U.K but just over 8.4% of organisations received this form of
donation, amounting to an average of £169,000 per organisation in 2012/13 (National
Council for Voluntary Organisations, 2015).
For those organisations with income exceeding €1 million, a slightly smaller proportion of
donations are received from unspecified sources. This may be because larger organisations
engage in more detailed financial reporting. Selling something raises a higher proportion of
income for larger organisations in this sample, accounting for just over €1 of every €10
raised. Corporate income is also higher in larger organisations when compared to the main
sample. Larger organisations may receive higher levels of income from selling something
and corporates as a result of scale, with both methods involving lengthy preparation and
cultivation time.
Figure 18: Sources of Reported Fundraised Income (Large Organisations)
5%
4%
Event Income, 5%
11%
Corporate Income/Sponsorship, 4%
4%
Selling Something, 11%
4%
Legacies, 4%
Foundations & NGOs, 4%
72%
Unspecified/Other, 72%
Sample Size: 195
2727 large-scale organisations responded to our survey and provided data on their fundraising
mix. From these responses, a total of 90 observations were made. Figure 19 shows the
distribution of fundraised income by technique in 2013. Similar to the findings above, the
majority of fundraised income is derived from relationships, in particular, regular giving
(26%) and direct marketing appeals (21%). The Wheel (2014) reported that in 2011/2012,
there was an interest in the not-for-profit sector to move away from event-type fundraising
towards the use of standing orders/direct debits and online giving.
Figure 19: Sources of Reported Fundraised Income by Technique, 2013 (Survey Responses)
Endowments
Other Major Gifts
0%
11% 9%
Legacies
9%
Local/Community
Fundraising
Regular/Committed
6%
Giving
26%
Direct Marketing
Appeals/Campaigns
21%
Corporate
Donations
Trusts and 8%
Foundations
9%
Selling Something
1%
Sample Size: 90
Similarly, individual donations dominate the U.S fundraising mix. According to the recent
Giving USA report, individual donations made up 72% of US contributions in 2013; an
increase of 4.2% compared to 2012 (Indiana University Lilly Family School of Philanthropy,
2014). Several factors reportedly influenced this growth, including a 2.9% increase in
personal income, a lower unemployment rate, a 1.9% increase in personal disposable
28income and rising consumer confidence (Indiana University Lilly Family School of
Philanthropy, 2014). There is a notable difference in the proportion of total fundraised
income received from trusts and foundations in the U.S when compared to the survey
respondents in this sample. Foundations are much more prominent in the U.S, accounting
for 15% of fundraised income compared to 9% in Ireland. In the U.S, income from
corporates yields fewest receipts (5%); a decrease of 1.9% compared to previous years. The
Indiana University Lilly Family School of Philanthropy (2014) cite this decline due to slow
growth in corporate pre-tax profits in 2013.
Figure 20: U.S Fundraised Income by Technique, 2013
Corporates
5%
Bequests
8%
Foundations
15%
Individuals
72%
Source: Indiana University Lilly Family School of Philanthropy, 2014
Individual donations were also found to dominate the U.K fundraising mix, totalling £7
billion in 2012/2013 (National Council for Voluntary Organisations, 2015). However, as seen
in Figure 21, trusts and foundations are becoming increasingly prominent, accounting for
13.7% of fundraised income in 2012/2013. This signifies a rate of growth over twice that
compared to the U.S (Pharoah et al., 2014). In light of the ONE Foundation ceasing funding
29in 2013 and The Atlantic Philanthropies spending down in an effort to finish grant making by
2016, Irish not-for-profits should consider identifying appropriate funding opportunities
within the estimated 8,000 trusts and foundations in the U.K. Legacies account for a similar
proportion of fundraised income when compared to the survey respondents in this sample;
contributing just over £1 of every £10 raised.
Figure 21: U.K Fundraised Income by Technique, 2012/2013
Gift Aid
6%
Legacies
11%
Foundations
14%
Individual and
Company Giving
69%
Source: Pharoah et al., (2014)
While the proportion of fundraised income received in the U.K is somewhat similar to 27
large organisations that responded to our survey, disparities emerge when illustrated on a
per capita basis; legacy giving per capita in the U.K is €36.70 compared to €14.51 in Ireland.
Moreover, trusts and foundations account for €44.09 per capita in the U.K whereas in
Ireland, this method amounts to €14.513. There are a number of reasons as to why giving
levels are higher in the U.K compared to Ireland, with Table 4 below outlining similarities
and differences with these respective fundraising landscapes.
3
Per capita estimations are for illustrative purposes only and are not based on a representative sample
30Table 4: Fundraising Landscape - Ireland Versus UK Comparison
Incentive to Give
Tax Schemes Benefit Charities and UK Donors
IRL: Tax Relief; charity receives a re-grossed tax refund at 31% through the Charitable Donations Scheme. Minimum donation €250.
No personal tax benefit for the donor; this has been viewed as regressive (The Community Foundation for Ireland, 2015). Pre
2013 self-assessed taxpayers could claim tax relief. It is estimated that around 1,500 charities benefit from the scheme.
UK: Tax Relief; charity receives a re-grossed tax refund (20%) for gifts over £100 through Gift Aid. Personal tax benefit of 20%
refund if the donor pays tax at the higher rate (40%). It is estimated that around 64,000 charities benefit from the scheme. In
addition, the Gift Aid Small Donations Scheme allows a charity to claim 25% tax refund on cash donations of £20 or less.
IRL: Inheritance; Donations are exempt from gift tax and inheritance tax. Charities in receipt are exempt from paying tax donation.
UK: Inheritance; an estate pays inheritance tax at the rate of 36% (instead of 40%) provided 10% or more of the net value of the
estate is left to a charity. Charities are exempt from capital gains tax.
IRL: Corporate Donations; a company may claim a deduction for a charitable donation at the 12.5% corporation rate of tax i.e.
€1000 donation costs €875.
UK: Corporate Donations; after making a charitable donation, a company may deduct the value of the donation from the total
business profits before paying tax.
IRL: Payroll Giving; administered by Charitable Giving U.K through the Sustain scheme. Employees can donate a minimum of €6 per
month to charity. Charities can benefit from tax concessions on donations of €250 or more.
UK: Payroll Giving; £1 donation costs 80p unless the donor pays tax at the higher/additional rate; in which case £1 costs 60p/55p.
Giving Culture
Ireland Generous by Frequency but U.K Gives More
th
IRL: 5 most generous (Charities Aid Foundation, 2013). 0.8% of disposable income donated in 2012 (The Community Foundation
for Ireland, 2015).
th
UK: 6 most generous (Charities Aid Foundation, 2013). 1.2% of disposable income donated in 2012 (The Community Foundation
for Ireland, 2015).
Trusts and Foundations Established by Wealthy Individuals
IRL: Least amount of charitable trusts and foundations in Europe. (The Community Foundation for Ireland, 2015)
UK: Approx. 8,800 trusts and foundations (Association of Charitable Foundations, 2007). These contributed 14% (£2.4b) of total
giving in 2012/13. ‘Family foundations’ represented 59% of total foundation giving (Pharoah et al., 2014).
Legacy Giving Standardised in U.K
IRL: Contributed 9% of fundraised income in 2013 (See Figure 21). My Legacy campaign includes 80 charitable organisations.
UK: Contributed 11% of fundraised income in 2012/13 (Pharoah et al., 2014). Remember A Charity campaign; launched in 2000,
includes 140 charities. Legacy10 campaign launched in 2011, in addition to the government changes to inheritance tax. This
further embedded the incentive rules for people to leave legacies.
National Lottery Funding
IRL: €220m distributed for charitable purposes through 8 government bodies in 2013 (Dept of Public Expenditure & Reform, 2013).
UK: £1.5b was raised for charitable purposes in 2012/13. 60% distributed through Arts and Sports government bodies, and the
Heritage Lottery Fund. 40 % distributed through the Big Lottery Fund. (National Lottery Distribution Fund Account, 2012/13)
Transparency and Trust
Regulation
IRL: Charities Regulatory Authority; established in 2014 following the Charities Act 2009. Registration requires submission of
financial accounts but this has not yet been implemented.
UK: Charity Commission; established in 2007 following the Charities Act 2006. Registration requires submission of annual
accounts. The income, spending, assets and liabilities figures of charities are easily accessible via the Commission’s website.
Adhering to Standards and Guidance
IRL: 10% of charities use SORP (The Wheel, 2014). 204 charities signed up to ICTR Statement of Guiding Principles for Fundraising.
UK: SORP is mandatory. The Institute of Fundraising has changed requirements in their Code of Fundraising Practice to reflect this.
Improving Public Opinion
IRL: In 2014 62% of 1,000 individuals changed their perception of charities in light of scandals in the sector (Amárach, 2014).
Following its establishment, the Charities Regulatory Authority has requested an increase in staff numbers and specialist staff.
UK: 48,000 complaints were made against charities in 2013 indicating a loss of confidence in self-regulation (Etherington et al.,
2015). Recommendations were made for a Fundraising Regulator with responsibility for the Code of Fundraising Practice.
314.3 Estimated GDP and Per Capita Equivalent
The total fundraised income of our sample totalled €131 million in 2013. As these
organisations are an approximately representative sample, this number can be extrapolated
to the entire sector. Only one-third of the sample reported on fundraised income however,
resulting in a small proportion of the entire sector being included in this analysis. Similar to
the estimated contribution to GNP, this figure discounts the top 1% of organisations 4. Due
to the diversity of this form of income as well as a lack of consistent reporting, any figure
presented on market size is an estimate and should be viewed with caution. With these
caveats in place, it is estimated that the Irish not-for-profit sector had a fundraised income
of €740 million in 20135. Irish GDP was €162 billion in 2013 (CSO, 2014), suggesting that
fundraised income is equal to 0.46% of this amount. The not-for-profit contribution to GDP
is very small when compared to the U.S contribution of 2% in 2013 (Indiana University Lilly
Family School of Philanthropy, 2014). The authors note however that the U.S not-for-profit
and charitable giving landscape is much larger compared to Ireland.
It is estimated that Ireland’s rate of giving per capita was €161 in 2013. Again, this is lower
than the U.K and the U.S, at €321 and €765 respectively and indicates that although Irish
people give frequently, the scale of giving is lower than our international counterparts. As
Table 5 illustrates, the U.K’s charitable giving is nearly double per capita compared to
Ireland, while the U.S gives over four times more.
Table 5: Summary Statistics – Estimated GDP and per Capita Equivalent, 2012
Ireland U.K U.S
6
Total Fundraised Income €740 m £17.5 bn $335 bn
As a % of GDP 0.46% 0.87% 2%
Per Capita €161 €321 €765
4
The 99% of organisations below this threshold were multiplied by ≈12.5 to estimate the total market size.
Organisations above this threshold were then added to the total figure. As such, these large organisations
appear only once
5
Due to variances in the sample and methodology, this figure cannot be compared to previous reports in this
series
6
Pharoah et al., 2014
324.4 Fundraising Costs
It is essential that not-for-profit organisations fundraise in an efficient, professional manner
in order to maximise the benefit to the cause, the impact of an individual donation and to
ensure a positive public image. Many organisations are nervous about disclosing
administrative, overhead and fundraising costs to the public, especially following the series
of scandals to hit the charity sector in recent years. A lack of public trust was apparent in
2013; 62% of over 1,000 individuals hanged their perception of Irish charities in light of
controversies surrounding the use of public and fundraised income (Amárach Irish Charities
Research, 2014).
However, appropriate investment in overheads and staff are required to ensure on-going
organisational efficiency, effectiveness and sustainability, and to attract and retain staff.
Moreover, transparency surrounding the costs of fundraising is necessary to re-build public
confidence and trust. Zero fundraising costs are an illusion. Thus, although low fundraising
and low administration costs are clearly desirable in a not-for-profit organisation, the
relationship between efficiency and cost ratios is in no way linear. As such, this paper should
not be perceived or interpreted as equating low fundraising costs with organisational
effectiveness or organisational quality. Rather, it aims to reflect the current reality of the
not-for-profit sector in Ireland, providing Boards, CEOs and Fundraising Executives with
information which they can use to identify their own standing among their peers, whilst
remaining mindful of the wide range of factors which impact upon an organisation’s
administration costs and fundraising performance.
More practical limitations of the summary ‘cost to raise a euro’ measure include:
1. In general, and especially for this study, the figures are grounded in poor quality
data. As noted earlier, many accounts are highly aggregated making it difficult for
information on fundraising costs or income to be extracted.
2. Many activities undertaken by not-for-profits may have fundraising outcomes but
not be explicitly fundraising activities. For example, advertisements run to educate
33the public about a particular disease, or campaigning to have a particular law
changed, may also have the effect of raising awareness about the organisation and
their work.
3. Large annual fluctuations are a common feature of fundraising activities. This can be
due to large one-off donations or an investment in a new fundraising technique
which can be expensive initially but pays off over subsequent years. As such, figures
which capture the fundraising cost at one point in time may not be representative of
an organisation’s actual position.
4. Fundraising costs are correlated with a range of organisational characteristics. For
instance, larger fundraising departments have a number of advantages over smaller
ones. In particular, they can often afford to employ full-time, professional
fundraisers. In smaller bodies, the fundraising duties are often distributed between
all other staff.
5. There is also a relationship between an organisation’s age and their fundraising
costs. Newer organisations are often driven by highly dedicated, passionate
volunteers, leading to low fundraising costs. However, newly established bodies do
not have the networks, reputation, working relationships, clients, and proven ability
to reside in the public’s consciousness. All of these factors assist older organisations
in obtaining funds. Younger organisations may therefore have to spend more money
in order to build donor bases and establish organisational routines and staff
strengths. In addition, certain sources of funding, especially legacies and bequests,
generally require a long cultivation period and are less often available to younger
groups. Existing research suggests that fundraising costs start off very low, increase
as an organisation formalises and fall again when it has undergone a significant
learning curve.
6. Fundraising efficiency tends to vary quite significantly across different subsectors.
Certain causes are, by their nature, easier to engage with potential donors, while
some more marginal causes, or those with a stigma attached, may find it more
difficult to fundraise. This reflects nothing more than the base level of public interest
in the cause and is generally outside an individual organisation’s control.
34Very few organisations provide both cost and income data in relation to their different
fundraising technique. It should be emphasised that despite a sample size of 872, only 44
observations were available. These observations are across 37 organisations. Thus, this
fundraising cost, and subsequent figures are, at best, estimates based on a small, non-
random, sample and should be viewed with caution. With these caveats in place, this study
found that it costs an estimated 28 cent to raise one euro of fundraised income in Ireland.
For 27 large scale organisations, economies of scale were identified and an estimated cost
of 23 cent established.
The costs of raising money varies across fundraising technique, as can be seen below, with
selling items being especially costly followed by events; a finding consistently reported in
previous versions of this report (see 2into3 2013; 2014). Of the techniques for which we
have data, it appears that corporate fundraising is the most cost effective. However, major
gifts have been excluded as there is not sufficient information on major gifts we cannot
make a comparison.
Figure 22: Fundraising Cost by Technique, 2013
€0.70 €0.63
€0.60
€0.50
€0.41
€0.40
€0.32
€0.28
€0.30 €0.25
€0.20
€0.10
€0.00
Average (n=44) Undisclosed/Other Corporate (n=2) Selling Something Events (n=19)
(n=18) (n=5)
Sample Size: 44
35You can also read