Addressing Extreme Poverty in Hungary - How the Development Sector is working with, and for, Communities Author: György Lukács 2017 - Badur ...
←
→
Page content transcription
If your browser does not render page correctly, please read the page content below
Addressing Extreme Poverty in Hungary –
How the Development Sector is working with,
          and for, Communities

          Author: György Lukács

                   2017.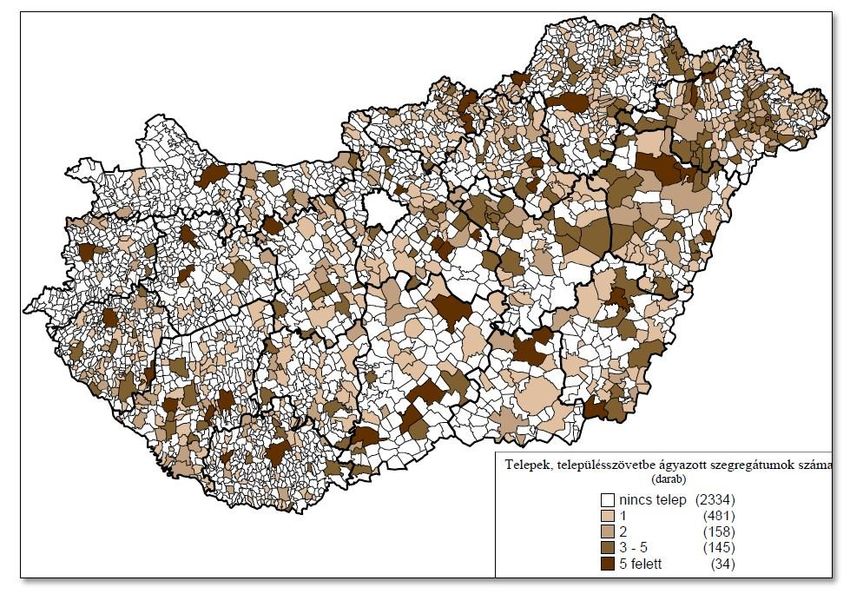
Table of Contents

  Table of Contents .................................................................................................................... 2
  Executive Summary ................................................................................................................. 3
  1.      Introduction ..................................................................................................................... 4
  2.      The Aspects of Poverty .................................................................................................... 4
  3.      Poverty Data in Europe .................................................................................................... 6
  4.      The Sources of Poverty Data in Hungary ....................................................................... 11
  5.      The Number and Proportion of Roma – Why is a Definition Challenging? .................... 11
  6.      Roma and Extreme Poverty............................................................................................ 15
       6.1 Poverty ......................................................................................................................... 15
       6.2 Employment................................................................................................................. 17
       6.3 Education ..................................................................................................................... 18
       6.4 Housing ........................................................................................................................ 19
  7.      Social Inclusion Assistance ............................................................................................. 22
  8.      Complex Development Programmes .............................................................................. 26
       8.1 Programme to Combat Child Poverty (PCCP) .............................................................. 26
       8.2 Extracurricular After School Programmes: The Tanoda Programmes ........................... 29
       8.3 Complex Housing Programmes .................................................................................... 35
  9.      Implementing Organisations and Development Funds Available.................................... 39
  10. Closing remarsk .............................................................................................................. 41
  Bibliography .......................................................................................................................... 43

                                                                                                                                             2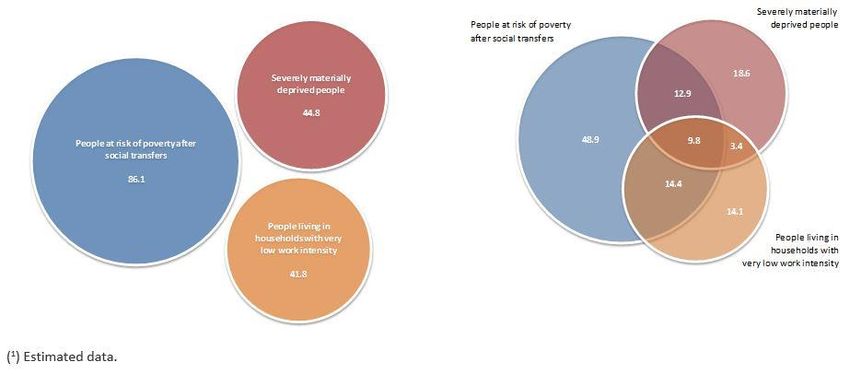
Executive Summary

One quarter of the European Union’s population is at risk of poverty or social exclusion, and this
proportion has not changed significantly over the past decade. Among those at the risk, the
number of people belonging to the following groups is particularly high: young people, children,
people with a low level of education, unemployed people and migrants. One tenth of the Union's
population is living in a disadvantaged situation, which means that two out of the three factors
(income, low work intensity or material deprivation) affect them.
In each dimension of poverty, Hungary ranks in the bottom tier of European Union members,
though, according to the latest CSO (Central Statistical Office) data, we can see a rapid
improvement in terms of work intensity and the lessening of material deprivation. In 2014, 30%
of Hungarian households were at risk of poverty or social exclusion, while 3% lived at a
disadvantage in all three dimensions, according to the EU definition. Poverty levels in Eastern
Europe differ from the EU average in the sense that it has a very significant ethnic ‘undertone’:
the Roma living in these countries are more likely to belong to the group of poor people than the
non-Roma.
According to the official data collection 310,000 Roma live in Hungary; while researchers
estimate this to be around 7-800,000. More than 80% of the Hungarian Roma lives in poverty;
they are overrepresented in all tested poverty categories. The causes of their social and economic
marginalisation are low educational attainment, low and typically low-payed employment, poor
housing conditions, and poor health - together forming a complex set of problems. All of this is
reinforced through the discrimination of the Roma people by non-Roma in society, and through
the frequent institutional segregation.
The national development policy has changed over time rather hectically, and it has not been
uniform in targeting extreme poverty. There are development programmes spanning government
and EU aid programme cycles, but their frameworks and approaches vary. The current
Hungarian government increasingly assigns tasks and sources to the churches - both in terms of
social and educational services. Besides this, a significant part of EU funds serves the operation
of public institutions, or these institutions are the implementing bodies of the EU programmes.
This is the result of a rather conservative image of society, in which the civil actors, who
participated meaningfully in the past decades at local or national level in the social development
processes, now get increasingly less significant a role and less interventional opportunity. The size
of grants available as development funds and accessible for civil society organisations, is annually
around HUF 84 billion (EUR 271 million) between 2014-2020.
The complex development programmes implemented within the framework of the State are
reserved about answering questions around tackling school segregation, or providing integrated
living environments. The needed professional background to implement these programmes has
not always been available, or was only available during any one grant period. Therefore, sustained
and significant improvement could not have been expected in the short term as a result of these
programmes.

                                                                                                   3
1. Introduction
The Badur Foundation (hereinafter the Foundation) started its work in 2014 in Hungary, and
produced an analysis of the Hungarian civil sector, especially focusing on those living in extreme
poverty, and on those organisations, that aim to support them. As the Roma are overrepresented
among people living in extreme poverty in Hungary, Roma organisations, associations and
funders supporting Roma communities also received greater emphasis in the analysis.
This study is an update, since it aims to provide more up-to-date data concerning the issues
covered in the earlier analysis, and some questions will be discussed in more detail. Any topic that
arises in this analysis, we wish to present from a point of view that is of interest and importance
to the present and future work of the Foundation.
This report also aims to present the national, regional, and local initiatives aimed at reducing
extreme poverty to a wider audience.
2. The Aspects of Poverty
Since this analysis discusses Hungarian poverty, and the sector that is in place to improve the
situation, the terms 'poverty', 'extreme poverty', 'exclusion' and 'multiple disadvantaged' appear
quite often. Their use in the public discourse is not uniform, and in many cases, professional
reports refer to the terms without accurate definitions either. The following part briefly
summarizes the meaning of each term, and subsequently we will refer to them accordingly.
Poverty is a term used here to describe the relative position of individuals and groups. The World
Bank prepares income-related global poverty assessments and statements and calculates the daily
and consolidated income poverty line, bound by the purchasing power parity method. This was
1.9 dollars in 2015.1 This poverty line methodically tries to eliminate the regional and cultural
differences, but it is clear that there is still a different meaning to the poverty line in different
parts of the world. (Converted to Forints, this amount is around HUF 15,600/ EUR 50 in a
month). The fact that globally - as cited in the World Bank report - the number of people living
under the unified poverty line has decreased does not mean that the situation of the Hungarian
people living in poverty has improved.
Researchers conventionally determine income poverty relative to a country's median2 income, but
it is very important to note that this definition is, in all cases, a political issue. The European
Union, including Hungary uses 60% of the median income as the poverty threshold. Extreme
poverty does not have a more precise definition, which would bind the index to a certain, relative
or objective value. So, any definition of extreme poverty is a subjective call by policymakers and
researchers. According to the CSO, those with an income below 40% of the median income live
1 Cruz-Foster-Quillin-Schellekens, Ending Extreme Poverty and Sharing Prosperity: Progress and Policies. World Bank Policy
Research Note, 2015, http://pubdocs.worldbank.org/en/109701443800596288/PRN03Oct2015TwinGoals.pdf.
2The median income does not equal to the average income. The median income divides the income distribution into two equal
groups i.e. half having income above that amount, and half having income below that amount. The average income indicates the
amount and standard deviation of the incomes, in contrast, the median shows the income distribution. The median income is in
most cases lower than the average income. All this in more detail, see: Havasi, Éva – Altorjai, Szilvia, A jövedelem mint az anyagi
jólét és a szegénység mérőszáma. Társadalomstatisztikai Füzetek 43. szám, KSH, Budapest, 2005.
4in extreme poverty, while other sociologists consider the amount of the minimum old age
pension as the limit of extreme poverty.3
In addition to income poverty, the European Union (including Hungary) applies a complex
indicator of other elements such as material deprivation and low work intensity in order to
measure the “risk of poverty and social exclusion”.4
Such an index attempts to show the absoluteness of poverty: that this life situation means not
only scarce income or access to material goods, but also the significant reduction of employees'
competencies and social capital – so that poverty can be measured and presented in a more
complex way.5 In addition, poverty - because of its complexity - can lead to psychological
handicaps such as the continuous sense of shame6, and can also result in the reduction of
cognitive competences.7
It is important to note that the research data cited here is the result of large-scale quantitative
statistical tests that are becoming increasingly nuanced and therefore better able to more deeply
describe the characteristics of poverty and exclusion. At the same time, they are often still unable
to present the dynamics and underlying drives underlying extreme poverty.8 However, these
figures are standardized and available at European level, and - within the above-described limits –
give the opportunity for comparison.
The previously presented relative poverty indicators have been contextualised alongside so-called
minimum subsistence figures compiled by statisticians, in which a consumer’s shopping basket ––
should include consumer products necessary for basic living and the average annual cost of such
items. Consequently, this indicator helps to define who is not reaching the required income level
for these basic purchases to be made. The CSO abolished the calculation of a subsistence figure
in 2015 - it now aims to measure the minimum living wage using a different method. 9
This report provides further details about all of the aforementioned categories and presents
European and Hungarian poverty data. Before that, this chapter will close by looking at how
3 See the interview of Czibere, Ibolya: http://hvg.hu/itthon/201449_valaszol_egy_szegenysegkutato_szociologus_a
4 Definitions:
a) Income poverty describes those earning less than 60% of the median income;
b) ‘Material deprivation’ means inadequate access to material goods and financial disadvantage. The materially deprived are
considered to be those that - by their own admission – are affected by at least four of the following nine conditions:
1) Being in payment arrears related to loan repayments or housing;
2) Lack of adequate heating at home;
3) Inability to face unexpected expenses;
4) Lack of meat, fish, or equivalent source of protein to consume every other day;
5) Lack of one-week annual holiday spent away from home,
6) Because of financial reasons do not have a car;
7) Because of financial reasons do not have a washing machine;
8) Because of financial reasons do not have a colour television;
9) Because of financial reasons do not have a telephone;
c)Low work intensity households are defined as those in which the working age population (18-59 years) adults have spent less
than 20% of their full work potential with work.
5 To read more about how the indexes refer to different poverty indicators in more detail, see in: Havasi, Éva, Szegénység,
számolva és számolatlanul, Kettős Mérce, 2017,
http://kettosmerce.blog.hu/2017/01/08/havasi_eva_szegenyseg_szamolva_es_szamolatlanul.
6 Havasi, Éva ibid.
7 Anandi Mani et al., Poverty Impedes Cognitive Function, Science, Vol. 341, 2013. Aug.
8 On critiques concerning these different methodological questions, see also in the referred article by Havasi, Éva.
9 To read more, see in KSH, Statisztikai Tükör 2015/46, 2015,
https://www.ksh.hu/docs/hun/xftp/idoszaki/letmin/letmin14.pdf
5different definitions of poverty appear in the context of local development programmes referred
to in this report. For example, in almost every case, social integration programmes present
detailed indicators when determining a target group, delineating a segment of the poor as the
intended beneficiaries of the programme.
In these target group definitions, the following indicators are typically included as filters: a) the
individual's (or household’s) income status, b) education level, c) labour market status, d) in the
case of some projects, the housing circumstances. These indicators are typically in either-or
relation, so that it is “enough to meet” one dimension of the needed criteria for someone to
become a beneficiary of a specific project. Another method of determining the target group is,
when instead of social targeting, the delineation is geographical, so the entire population of the
least-developed micro-regions and settlements are involved in the proposed development. These
issues will be discussed in more detail later on.
A central definition of extreme poverty has been developed only once before, in the frame of the
“Community Upgrade for the Integration of People Living in Extreme Poverty” development
programme (Social Renewal Operational Programme -SoROP 5.1.3-09), which described that:
“… Communities that have sunk into deep poverty are characterised by very low education and
employment rates, strong local and regional residential concentration, segregation and – resulting
from all of the above - severe social deficits, and the very high probability of reproduction of
these adverse social conditions. Based on these criteria those living in extreme poverty, meet at
least two of the following criteria:
- They have been unemployed for at least three years, or, during this period have at most
participated in the public work scheme
- Their highest education level is 10th grade, and even if they have additional vocational
qualification it is not-marketable
- They belong to the working age population (18-60 years), but are professionally inactive
- They are raising more than two children.10
As can be seen, this definition used a more complex approach rather than simply the income
borderline approach to describe poverty. As such, this report employs this methodology, that is,
when ‘extreme poverty’ or communities living in extreme poverty are mentioned, what is meant
is the complex definition. When citing statistical data, the report will also specify definitions and
methodology behind data collection.
3. Poverty Data in Europe
As mentioned in Chapter 2, Eurostat measures the poverty of the EU's population on three
dimensions. The combined set of the three categories gives an impression of the group of people
most at risk of poverty or social exclusion, and the intersections of the individual dimensions
indicate the people living in multiple disadvantaged situation. Based on the Eurostat data for
2014, one quarter of the EU’s population belongs to the first group; this rate has changed only
10TÁMOP 5.1.3.-09/2 - Közösségi felzárkóztatás a mélyszegénységben élők integrációjáért, Pályázati útmutató, 10.o,
https://www.palyazat.gov.hu/doc/1892.
6slightly over the past decade.
It is important to highlight that the EU poverty statistics became worse as CEE countries
accessed the EU. That said, even without the CEE data, the ratio of inhabitants at risk of
poverty is 21-23%. Therefore, poverty in Europe is a general problem, which smites even the
richest EU countries, as much as it does those recently-joined member states.
The analysis of Eurostat underlines the following points11:
- More than 30% of young people aged 18 to 24 and 27.8% of children aged less
than 18 were at risk of poverty in 2014. The rate was 17.8% amongst those aged
65 or over.
- Of all groups examined, the unemployed faced the greatest risk of poverty or
social exclusion, at 66.7%.
- Almost 50% of all single parents were at risk in 2014. This was double the average
and higher than for any other household type analysed.
- 35% of adults with lower secondary school educational attainment levels were at
risk of poverty or social exclusion in 2014.
- 63.8% of children of parents with pre-primary and lower secondary education
levels were at risk as well.
- The migrant background was also a key factor: in 2014, 40.1 % of adults born in a
country outside the EU-28 were at risk of poverty or social exclusion. For native
citizens, however, only 22.5% of the population was at this risk.
- On the average not too significant, but measurable is the settlement-level
difference. EU-28 citizens in rural areas were on average more likely to live in
poverty or social exclusion than those living in urban areas (27.2% compared with
24.3%) in 2014.
- Income poverty was the most widespread form of poverty with 17.2% of EU
citizens affected in 2014. Next were low work intensity and severe material
deprivation affecting 11.2% and 9% of EU citizens.
- One third of people at risk of poverty and social exclusion are affected at least in
two poverty dimensions; 9.8 million people (3% of EU citizens) are affected by all
three.
11Eurostat, Europe 2020 indicators - poverty and social exclusion, 2016, http://ec.europa.eu/eurostat/statistics-
explained/index.php/Europe_2020_indicators_-_poverty_and_social_exclusion.
7People at Risk of Poverty or Social Exclusion
(Million cap., EU-28)
Source: Eurostat, Groups at Risk of Poverty or Social Exclusion, 2014,
http://ec.europa.eu/eurostat/statistics-explained/index.php/File:Aggregation_of_sub-
indicators_of_%27People_at_risk_of_poverty_or_social_exclusion%27,_EU-28,_2014.JPG.
Hungary ranks in the lowest tier in all poverty dimensions among EU Member States, and this
situation has not fundamentally changed over the past decade. The rate of those, affected by the
certain dimensions of poverty is the highest in Hungary among the Visegrad countries. 10 years
ago, the same indicators of Slovakia were similar and in Poland were much worse than the
Hungarian ones. In the last decade, they have improved significantly in both countries. In
contrast, the Hungarian data on the risk of poverty or social exclusion is still around 30%, while
in the mentioned countries it decreased to 18-25%. In Hungary, the rate of those living in
poverty and at risk of social exclusion could not be reduced in the past decade. In other words,
while ten years ago Hungarian data was comparable with those of the Visegrad countries,
nowadays Hungary appears in the same group as Bulgaria and Romania, at the end of the EU
lists.
The reasons for, and impact of poverty in Hungary as in the rest of Europe are similar:
households with children and low work intensity are at risk. The dimensions of poverty in
Eastern European countries are complimented by an additional element, the Roma population.
Although in this analysis only Hungarian data is discussed in detail, it should be recapitulated
that, in the Balkan countries as well as in Central Europe, the Roma communities have a higher
probability of being in poverty.12
12See: Decade of Roma Inclusion Secretariat Foundation, Roma Inclusion Index, 2015,
http://www.rcc.int/romaintegration2020/files/user/docs/Roma%20Inclusion%20Index%202015.pdf, and European Union
8Proportion of People at Risk of Poverty or Social
Exclusion
in % of the population
50
40
30
20
10
0
2005 2006 2007 2008 2009 2010 2011 2012 2013 2014
EU (27 countries) Euro area (17 countries)
Czech Republic Hungary
Poland Slovakia
Source: Eurostat, 2016
People living in Severe Material Deprivation
in % of the population
40
30
20
10
0
2005 2006 2007 2008 2009 2010 2011 2012 2013 2014
EU (27 countries) Euro area (17 countries)
Czech Republic Hungary
Poland Slovakia
Source: Eurostat, 2016
Agency for Fundamental Rights, Second European Union Minorities and Discrimination Survey (EU-MIDIS II) Roma – Selected
findings, http://fra.europa.eu/en/publication/2016/eumidis-ii-roma-selected-findings.
9People living in Households with Low Work
Intensity
in % of the whole population
20
15
10
5
0
2005 2006 2007 2008 2009 2010 2011 2012 2013 2014
EU (27 countries) Euro area (17 countries)
Czech Republic Hungary
Poland Slovakia
Source: Eurostat, 2016
Poverty Dimensions in Hungary in 2014
Relative income poverty
569 thousand
5.9%
491 thousand
96 thousand Severe material
10.2%
1% 293 deprivation
thousand
988 thousand
193 thousand
3% 10.2%
2%
105 thousand
Very low work 1.1%
intensity
Source: Eurostat, 2016
104. The Sources of Poverty Data in Hungary
Although polls on poverty in Hungary have been taking place since the '80s, they were
methodologically not consistent, continuous, and the data taken up in the different years, by
various research institutes are not necessarily comparable. The mostly sociographic, interview
analysis-based, qualitative researches were supplemented later on by large-scale, statistical surveys;
however, poverty was equivalent to a low status in the social and economic hierarchy. The most
continuously undertaken data collection and analysis was the Hungarian Household Panel,
conducted by TÁRKI Research Institute in the early '90s - the results inevitably reported about
the social exclusion of some groups because of the political changes. The mapping, description,
and measurement of the evolving poverty after the political change have almost two decades of
history.
The aforementioned research was carried out simultaneously with other surveys on Roma also
looking into the issue of poverty - these were analytical works describing the social hierarchies. In
the early 90’s, data protection laws were very restrictive about the collection of ethnic data - this
is one reason why, although the same large-scale, detailed studies were made regularly, the ethnic
identity was not questioned in those.
The 2011 census brought changes to this issue, when the first series of questions permitted to
assess multiple identities - these are still part of the CSO’s data recordings. Because of its EU
membership, the CSO had to provide data for the European Statistical System. In these, data on
ethnicity has also been collected since 2014.13 (The most detailed data of these types is from the
EU-SILC – Examination of Income and Living Conditions in the framework of European
Labour Force Survey. The same type of data collection is not available yet on housing, education
or health, although the level of education is present as a category in the labour market
questionnaire.)
It is important to point out that both governmental and non-governmental reports and analyses
differ considerably. Governmental reports are mainly based on the data of the CSO (or on
Eurostat survey results, measured by the CSO), and typically highlight the decreasing number of
people living with multiple disadvantages, as well as the declining unemployment data. In
contrast, non-governmental, civil reports focus on long-term processes and, in addition to the
improved indicators of the current year, they emphasize that the outbreak from extreme poverty
is, at minimum a mid-term process; additionally, he relativity and fragility of livelihood strategies
are highlighted.14
5. The Number and Proportion of Roma – Why is a Definition Challenging?
One can have significantly different figures relating to the number of Hungarian Roma
depending on whether one takes official statistical data into account, or that estimated by
researchers. The reason for the difference - which could be up to two or three times - mainly
13 The relevant data - broken down by ethnic origin – is presented in the next chapter.
14 This process is explored further in the chapter on unemployment.
11stems from the methodology: the official statistics (the census data) are based on self-declaration
since 1990, while social research used the methodology of external classification for the sampling.
In the late 1990s, a large-scale debate emerged among Hungarian social scientists in connection
with whether it is possible to carry out empirical research on Roma and, if yes, exactly on what
basis, and how it could be determined that someone belongs to that ethnic group. The discussion
highlighted how much constructed the concept of ethnicity is - although this very important
finding could not break through the rigid boundaries either of the policy-making or of public
opinion. However, in Hungarian social research, complex sampling methods and target definition
are increasingly established.15
In the census, only those respondents were considered Roma who declared themselves as such.
As recently as 2011 the census used a more nuanced questionnaire to allow the nomination of a
multiple identity, which means that the respondents could mark that they simultaneously
identified as Hungarian and Roma. The former social studies used the method of the so-called
external classification, which considered those as Roma whom the environment and the
interviewers - based either on external characteristics, or on self-declaration – defined so. The
chosen research methodology should serve the research objectives - in this respect, the external
classification is also a valid choice. These researches described mainly the demographic
characteristics of the Roma ethnic group and intended to map the discriminatory mechanisms
that do not operate based on self-declaration but are typically based on physical features. This
means that if the non-Roma society discriminate those whom it considers as Roma, even if based
on external characteristics, then this group should be the target group of the research. However,
this type of research is currently no longer suited to the Roma population in Hungary, as it
cannot provide a description about the whole group, due to the sample selection problem.
Individuals with higher socio-economic status are increasingly inclined to conceal their identity,
and often they are not regarded as being Roma by the public either - for this reason, researches
typically "distort downwards" and the data of only Roma living in extreme poverty are likely to be
included. Regarding the external classification, naturally, very serious criticisms of fundamental
rights exist, and - amongst other reasons -this sampling method is in itself therefore no longer
used.16
In sum, determining the number of Roma in Hungary is complicated because of the data
protection laws, because of the obvious novelty for the Hungarian society to assume multiple
identities and because of the changing intensity of discriminatory mechanisms and the specific
individual or group behavioural responses to them.
15 See: Ladányi János - Szelényi Iván, A kirekesztettség változó formái: Közép – és délkelet-európai romák történetei és
összehasonlító szociológiai vizsgálata. Napvilág Kiadó, Budapest, 2004; respectively NCSSZI survey 2010.
16 In a 2010 survey, the researchers worked with two sub-samples: with one group, in which were people classified as Roma by
Roma, and with another group, in which were people classified as Roma by non-Roma. For this see: Kurucz Erika (Ed.),
Élethelyzetek a társadalom peremén, NCSSZI, 2010 , http://www.ncsszi.hu/tamop-5_4_1-08_/v_-piller---kutatas/romakutatas.
12Data on the Number of Hungarian Roma17
Year Data Source Method Estimated number
of Roma
1971 Sociological Survey External Classification 320,000
1990 Census Self-Declaration 142,000
1993 Sociological Survey External Classification 468,000
2001 Census Self-Declaration 190,000
2003 Sociological Survey External Classification 540,000
2011 Census Self-Declaration – multiple 315,600
identity
2010 Sociological Survey Self-Declaration + External 650,000
Classification
Demographic Projection18
Year Number of the Estimated number Estimated rate of
whole Hungarian of Roma population Roma population
population
1991 10,374,800 448,100 4.3%
2001 10,198,300 549,700 5.4%
2011 9,985,700 657,600 6.6%
2021 Basic 9,492,600 774,200 8.2%
Low 733,100
High 814,300
The question of identity has not only social science measurement-related importance, but also
serious consequences on development policy. For many years, in national development policy,
one core issue has been the dichotomy of affirmative action vs. geographic targeting. In other
words, how the broadly defined policy should support the less developed municipalities and
communities: targeting only the most disadvantaged social groups including the Roma living in
extreme poverty, or should it try to improve the whole area, based not on social, but on
geographic targeting.
The answers obviously have consequences for financial resources too (a territorial approach
obviously requires more resources). However, through geographic targeting, people living in
17 The results of the sociological researches of 1971, 1993 and 2003 in detail:
Kemény, István – Havas, Gábor, Cigánynak lenni. Társadalmi riport, 1996, http://www.tarki.hu/adatbank-h/kutjel/pdf/a894.pdf
Kemény, István – Janky, Béla – Lengyel Gabriella, A magyarországi cigányság 1971-2003. Gondolat, Budapest, 2004,
http://kisebbsegkutato.tk.mta.hu/a-magyarorszagi-ciganysag-1971-2003
About the research in 2010 see: Élethelyzetek a társadalom peremén, http://www.ncsszi.hu/tamop-5_4_1-08_/v_-piller---
kutatas/romakutatas
18 Data on the entire Hungarian population is from the calculations of the Demographical Institute of CSO, Népesség-
előreszámítás, http://demografia.hu/hu/tudastar/nepesseg-eloreszamitas. The source of data on the Roma population is:
Hablicsek László, Kísérleti számítások a roma lakosság területi jellemzőinek alakulására és 2021-ig történő előrebecslésére.
Demográfia, 2007. 1. sz. p.7-54, http://demografia.hu/kiadvanyokonline/index.php/demografia/article/viewFile/540/483.
13extreme poverty have much less access to the resources, proportionally, even on a smaller scale
than when using a method of affirmative action.
The territorial principle means, not only a geographical impoundment but also the social network
of an area, with all its constraints, its operational principle, and its petrified or ever dynamic local
hierarchy. This means that resources have to travel through too many steps before reaching those
in need. On the other hand, the affirmative action might turn into a kind of unintended side
effect and becomes counterproductive: citizens living in poor conditions can turn against the
supported ethnic groups living in extreme poverty, thereby increasing the already existing social
distances. This makes the effective utilisation of local networks problematic without which the
implementation and maintenance of local development becomes questionable.
The Hungarian National Social Inclusion Strategy specifies the Hungarian Roma population as an
ethnic group, which needs a separate development support policy. The funds do not specify
specific national or ethnic quotas; however, the participating organisations need to continuously
provide data on how many of the participants consider themselves as Roma in the project
planning process as well as during the implementation phase. (Even at an individual level, they
must complete and collect declarations, followed by adequate data protection procedures. The
collected national identity and self-declarations do not always coincide with the data of self-
declaration based census or even with the minority government data.) At the same time, it is quite
random and depends from site to site, if the local community defines a project as a Roma
programme.
146. Roma and Extreme Poverty
6.1 Poverty
According to research data, 30% of the Hungarian population is at risk of poverty, representing
nearly 3 million people. With this ratio, Hungary was the fifth worst in the EU in 2014. Between
the country differences amounting to 2-3%, it is perhaps more important that Hungary with its
current data has stood in the lower third of the Union in a consistent manner.
If we look at the specific poverty data broken down by ethnicity19, the high over-representation
of Roma stands out: whilst 27% of those living in poverty Hungary in 2015 were non-Roma in
the same year,84% were Roma. (This is an incredibly high figure, even in comparison to the 90%
relative statistic in the previous year.)
Rate of People at Risk of Poverty or Social Exclusion
between Roma and non-Roma Population (%)
2014 2015
Roma 89.9 83.7
non-Roma 29.8 26.8
Source: EU-SILC, 2014
As indicated previously, poverty or social exclusion can be seen to be compiled of three
dimensions with three indicators: relative income poverty, low work intensity and severe material
deprivation. If one examines the ethnic breakdown of these indicators, one sees the following
picture:
Relative Income Poverty Rate between
Roma and non-Roma Population (%)
2014 2015
Roma 67.9 63.1
non-Roma 13.1 13.7
Source: EU-SILC, 2014
Rate of People living in Severe Material Deprivation
between Roma and non-Roma Population (%)
2014 2015
Roma 78.1 67.8
non-Roma 22.1 18.1
Source: EU-SILC, 2014
19The data refered in this chapter is taken from different data collections of the CSO, in which ethnicity was measured by
questions relating to multiple identity – respectively this builds upon previous Census data. This means, that this data refers to the
respondents, who declare themselves as Roma (too). - See Chapter 5.
15Rate of People Living in Households with Low Work Intensity between
Roma and non-Roma Population
2014 2015
Roma 45,300 26,700
non-Roma 8,400 6,600
Source: EU-SILC, 2014
The data shows that - in all the indicators - the Roma population has multiple disadvantages,
even if the current year's data shows signs of improvement. The greatest development is in the
case of labour market conditions; however, this improvement is due the extension of the public
work scheme20 and less to do with the impact of integration into the primary labour market.
Because of the aforementioned public employment scheme, and because of the effect of
increasing employment abroad, Hungary’s national unemployment statistics became one of the
best in the EU. Nonetheless, the rate of people employed for very low wages - has not reduced.
Some research suggests that nearly a million people are earning less in a month than those on the
minimum subsistence.21 Early school leavers, career starters, participants of the public work
scheme, and public sector-employees are particularly at risk.22
This is especially interesting in the sense that, according to current surveys, the Roma households
live on half as much money as non-Roma. Therefore, Roma are included in the secondary labour
market, and this is associated with the income growth per household. But this level of income is
not sufficient to break away from the other dimensions of poverty. Their housing conditions, or
their access to durable consumer goods, could not significantly change. However, it is worth
noting, that public opinion about the public work scheme is not uniform, and mostly, political
affiliation determines opinions. Critics23highlight the sanctional nature of the public work scheme
(it must be undertaken to get the minimum social assistance; all this is linked to a local, unequal
power status), or focus on its dead-end character (public workers do not have access to the
primary labour market; the public work scheme simply keeps those in it just above a subordinate,
economically unviable situation). However, there is a Hungarian sociologist who states that, in
recent decades, Hungarian social policy has been unable to counter extreme poverty by creating
and operating a more effective tool than the public work scheme.24
20 The Hungarian labour system uses the term of the public work scheme, and the work done in its framework is called public
work, but it is not to be confused with public labor - one of the last ways of punishment laid down in the Criminal Code! See:
http://kozfoglalkoztatas.kormany.hu/mi-a-kulonbseg-a-kozfoglalkoztatas-es-a-kozerdeku-munka-között, respectively for the
history of Hungarian public work scheme systems we recommend: Bördős Katalin, A közfoglalkoztatás intézményi környezete
– történeti áttekintés. Közelkép, 2014, http://econ.core.hu/file/download/mt_2014_hun/kozelkep_21.pdf.
21 About the calculation of minimum subsidy and about the current situation see: Kiss Ambrus, A dolgozói szegénység és a
létminimum, http://ujegyenloseg.hu/dolgozoi-szegenyseg-es-a-letminimum-2/2/?nopagination.
22 Nagy Viktória, Mit lehet tenni a dolgozói szegénység ellen?, http://www.szef.hu/hirek/dolgozoi_szegenyseg.
23 Cseres-Gergely Zsombor – Molnár György.Közmunka, segélyezés, elsődleges és másodlagos munkaerőpiac. Társadalmi Riport
2014, Tárki, Budapest, 2015, http://www.tarki.hu/adatbank-h/kutjel/pdf/b331.pdf.
24 „I have been for a long time against the public work scheme. But then Roma told me not to brag, they like it, because they have
a little more money, get up in the morning, go to work, even if it does not make much sense of what they are doing. Factually,
since 2013, poverty decreased. The public work scheme of course, does not produce the national income, the economy does not
improve, but the parks never looked so good, the streets were not so clean since I can remember. The fact is that since the
political change the public work scheme is the most workable government deed in extreme poverty alleviation.” Interview with
Szelényi, Iván; http://24.hu/kozelet/2016/05/27/szelenyi-ivan-es-akkor-orban-viktor-ugy-szolt-hogy-a-fak-nem-nohetnek-az-
egig/
16It is worth noting, in relation to the public work scheme, that - in its present form - it is actually a
conditional form of aid, which has a long-standing history and with this an abundance of
literature. The 'workfare' scheme introduced in the '60s in the US, for example, was an alternative
to the 'welfare' subsidy system.)
In the '90s in Europe, the social democratic Third Way movement25 brought this type of public
employment into ‘fashion’ again. The Gyurcsany government in 2008 initiated the forerunner of
the current Hungarian public work scheme, the “Pathways to Work Programme”, although the
programme’s extension and transformation is reflective of the current conservative (FIDESZ-
KDNP) government.)
Annual Average Net Income per Consumption Unit (OECD2*)
Annual Monthly average income
average income (HUF)
(HUF)
Non-Roma 1,550,000 129,583
Roma 868,000 72,333
Total Population 1,522,000 126,833
Source: EU-SILC, 2014 (reference year: 2013)
*OECD2: The size of the consumption unit represented by the household-dwelling unit is
indicated as the sum of the weights of its members.
- first adult aged 18 and over = 1.0
- subsequent adults aged 18 and over = 0.5
- each person aged under 14 = 0.3
Analysing the causes of poverty, one can see a complex picture, which shows that educational,
social, employment, housing and health status closely relate to each other in a system. This means
that any intervention that focuses only on one dimension cannot remedy the complete system of
causes and bring about an end to extreme poverty - only complex, simultaneous interventions
and management promise more success. From the causes of poverty, let us now examine three in
further detail: employment, education and housing.
6.2 Employment
The low rate of employment has, for decades, been one of Hungary’s major social problems. The
country is far from the EU objective of a 75% employment rate, having a rate of 54% at national
level. But, within that, the employment rate of Roma is very low (32%). It follows that the
inactivity rate is relatively high in Hungary; the data of the Roma is 13% higher than of the non-
Roma. These proportions are more balanced, however, between the long-term unemployed:
within unemployed Roma and non-Roma groups, 54% and 57% are long-term unemployed
(although one has to take into account that this proportion applies within 6.7% non-Roma and
30% Roma respondents).
25 Antony Giddens, The Third Way: The renewal of Social Democracy, 1998.
17The low employment rate of Roma dates back to Hungary’s political transition. In the early '90s
mining, heavy industry and public construction were the biggest employers of Hungarian Roma.
After the fall of the Berlin wall, Hungary’s labour market narrowed significantly and has not
expanded ever since (7 million employed decreased to 4 million). There were no structural
changes that could have enabled mass employment of Roma.
Employment Data (%)
Non-Roma Roma Total
Population Population Population
Employment rate 54.8 32.0 54.1
Inactivity rate 41.2 54.1 41.7
Unemployment rate26 6.7 30.2 7.3
Long-term Unemployed Rate 57.2 54.1 56.9
Source: KSH, Labour Fore Survey 2014
6.3 Education
Another reason for the low level of employment is the low educational levels and non-marketable
qualifications of Roma people. The education level of the Roma population has increased
substantially in recent decades, but it is still significantly lower than that of the non-Roma.
According to the Labour Force Survey of the CSO in 2014, more than 80% of the Roma
population has completed a maximum of eight years of elementary schooling and did not obtain
a higher degree of education. It is important to note that the Hungarian education system is one
of the slowest changing sectors, which means that a few years of educational expansion can only
slightly improve distribution of an entire population. Theoretically, it could be expected that,
among younger generations, there is not as big a difference as in the total population - but
unfortunately, this is not that the case. The category of early school leavers refers to young
people between the ages of 18 and 24, who leave the education system without a secondary
degree. The strategic aim of the EU is that this ratio should be under 10% by 2020 - in Hungary
this figure is 12.8% nationally. If we look at the Roma - non-Roma breakdown, however, we find
that 57% of Roma youths aged between 18-24 years belong to the early school leaver group, so
there is a high chance that they will not acquire neither secondary nor vocational qualifications.
Similar data is measured by the so-called NEET rate27, which includes young people aged
between 15 and 24 years, who do not go to any school or training, nor are working – i.e those,
who are inactive dependants. Within the total population, the rate is 14% whilst among the Roma
it is 38%. The fact that Roma youths drop out so soon, without any formal result from the
education system, anticipates that their subsequent positions in the labour market are not
promising either. In other words, the education system is very effectively reproducing a group of
potentially unemployed. (In recent months, the Ministry of Human Capacities will launch a major
26 The unemployment rate is the ratio of unemployed within the economically active population. Those are considered to be
unemployed who did not work during the reference week (the week of questioning), who do not have a job which they were
temporarily away from during the four weeks before the interview, who were not actively looking for work, who would be able to
work within two weeks on finding a suitable job or, if having already found a job, could start working within 90 days.
Furthermore, those who have been unemployed for 12 months or longer, are considered to be long-term unemployed.
27 NEET: Nor in Education Employment or Training (“not learning and not working either”).
18programme to reduce early school leaving28 - the results will only be available in a few years. The
programme details are not public yet, but it is questionable as to whether it would be able to
substantively change the problems and anomalies of the current school system - such as the age
limit of compulsory education lowered to 16 years, the operation of so-called ‘collecting’ schools
in ghettoized areas, or the maintenance of a segregated education system).
Highest Completed Level of Education amongst 15-74 year olds,
2014, (%)
Highest completed level of Non-Roma Roma Total
education Population Population Population
Less than 8 elementary classes 1 17.6 1.5
8 elementary classes 22 63.6 23.2
Vocational school, secondary 25 14.3 24.8
school
High school degree 32.2 3,9 31.3
Diploma 19.7 0.7 19.2
Total 100.0 100.0 100
Non-Roma Roma Total
Population Population Population
Early school leavers (18-24 years) 10.3 57 12.8
NEET rate (15-24 years) 12.7 38.2 14.1
Source: Central Statistical Office, Labour Force Survey 2014
6.4 Housing
Housing poverty is also a complex social phenomenon. It encompasses access to housing, its
cost, size and structure, the size of housing-related costs, the housing quality itself and the related
quality of life, and of course, the segregated or integrated nature of housing, too. Since the survey
conducted by István Kemény all data confirms that the housing situation of Roma is significantly
worse than of the non-Roma population. This appears in various forms of housing exclusion:
worse (in many cases critical) housing quality, housing in peripheral location, territorial
concentration, often accompanied by illegal or uncertain legal status. One of the key questions
related to housing of Roma, are the segregated settlements, on which we cannot provide recent
data.
According to a survey commissioned by the National Development Agency in 2010, there are
around 1,600 segregated areas, in 800 settlements, occupied by 300,000 people, which is 3% of
the total Hungarian population.29 It is important to note that the survey collected data from
segregated places, but not about the inhabitants' ethnicity – as such, this does not necessarily
mean having 1,600 Roma settlements. The researchers also rely on studies of István Kemény and
28A végzettség nélküli iskolaelhagyás elleni középtávú stratégia,
http://www.kormany.hu/download/5/fe/20000/V%C3%A9gzetts%C3%A9g%20n%C3%A9lk%C3%BCli%20iskolaelhagy%C3
%A1s%20.pdf
29 Domokos, Vera – Herczeg, Béla, Terra Incognita. Szociológiai Szemle, 2010/3.
19his colleagues, who in 2004 stated30 that residential segregation has not improved, but its form
has been transformed in the last 30 years – and two-thirds of Roma continue to live in segregated
circumstances.31
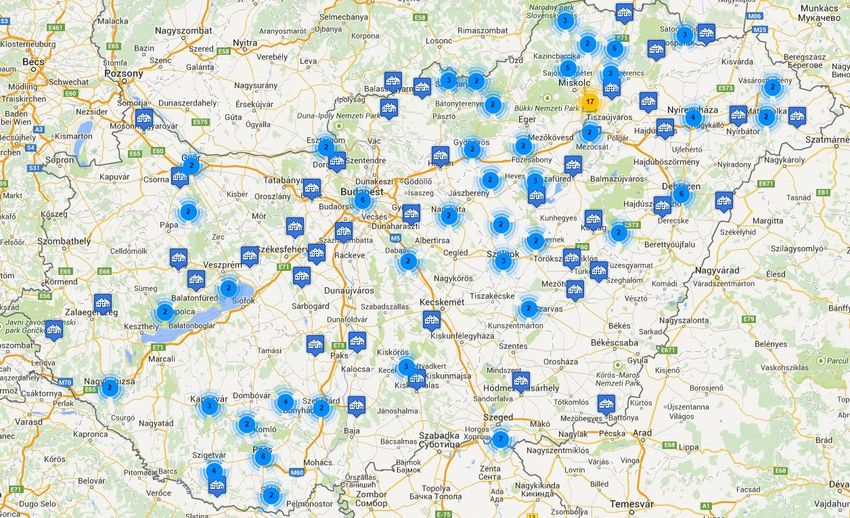
Settlements, segregated areas: numbers and locations
Source: Domokos, Veronika, The location and infrastructural condition of poor slums, Roma
settlements and urban segregated areas. 2010. Unpublished manuscript.
In connection with housing poverty and segregated areas it is currently possible to get accurate
data at municipal level (local governments may request the CSO’s segregated area-containment,
and their basic demographical, ethnic data), but this data is not nationally aggregated and
analysed. Based on the 2011 census data, one could create a countrywide map of segregated areas
including ethnic data, but this has not taken place yet. However, from the data of the 2011
census, one can see what the differences are between the Roma and non-Roma living conditions
(taking into consideration the limits of the ethnic data break down as detailed in Chapter 5.). On
this basis, one can see that nearly one third of Roma are affected by severe housing poverty,
meaning that they live in buildings with no or very low level of comfort. The official data on
infrastructure measured by the CSO, is somewhat contradicted by the daily field experience:
according to the census data, only in 1.4% of the Roma households, there is no electricity. This
30Kemény, István – Janky, Béla, Települési és lakásviszonyok, 2004, http://beszelo.c3.hu/04/04/13kemeny.htm.
31 The transformation of segregated housing can be characterized as follows: the so-called Cs [abbreviation for lowered comfort
level]-colonies were set up in the 60-70s. These were later partially abolished and newly built through ''social welfare building''
(but still consisting from low-quality buildings). As a result, "gypsy house lines" were established. After the elimination of social
policy support in 2009 the resurgence of the so-called wild sites can be increasingly observed, and in the villages the buildings
inhabited by Roma go through a generational expansion (i.e. that the newer generations build rooms without comfort connected
to the houses of their parents – thereby recreating classic settlement conditions).
20is, however, very low and at odds with the frequency with which field workers see houses without
electricity due to debts and so-called ‘electricity theft’ in segregated areas.
In 18% of the households inhabited by Roma, there is no running water. In close to 30% there is
no bathroom and in 78% of the buildings there is no central heating. In general, it can be said
that, whilst 3.5% of the non-Roma population live in crowded conditions (more than two people
per room), this ratio is 34% in the case of Roma households. According to the (albeit not
representative) survey of UNDP32 carried out in 2011, 29% of the Roma population in Hungary
lives in poor quality (ruined) dwellings; 30% have no access to public water supplies, one third
has no access to public sanitation, and a huge amount (81%) use wood for heating. The Roma
live in more crowded households than the national average. According to the UNDP survey, in
Roma households there are 0.68 rooms per person compared to 1.3 rooms in the case of non-
Roma households. According to the 2012 report of Habitat, half of the Roma population (52%)
live in households that, in most cases, delay upkeep payments to their water or electricity
providers.33
Infrastructural and Comfort Level-related
differences between Households
with non-Roma and Roma Head of Household in 2011
Head of Household
non-Roma Roma Total
Bathroom
Not available 4.7% 29.0% 5.2%
Available 95.3% 71.0% 94.8%
WC
Not available 5.2% 31.3% 5.8%
Available 94.8% 68.7% 94.2%
Electricity
Not available 0.3% 1.4% 0.3%
Available 99.7% 98.6% 99.7%
Water
No running water 2.1% 18.1% 2.4%
Water from public utility, conduit 95.7% 78.6% 95.3%
Water from house conduit (e.g. from 2.2% 3.3% 2.2%
well with pump)
Heating
No heating opportunity 0.2% 0.3% 0.2%
Each room with convector or stove 36.7% 77.9% 37.6%
Central - one or more dwellings 47.5% 17.8% 46.9%
heating boiler
District heating (through pipeline 15.5% 3.9% 15.3%
from heat centre)
Comfort level
32 The cited UNDP survey is not representative; there were questionnaire interviews conducted with Roma living in segregated
areas and with non-Roma respondents living in similar circumstances.
33 Hegedüs, József – Horváth, Vera, Éves jelentés a lakhatási szegénységről, 2012, 2013,
http://www.habitat.hu/files/jelentes_veglszoveg_web.pdf .
21With all amenities 62.1% 20.6% 61.3%
With principal amenities 30.7% 40.7% 30.9%
With part of amenities 2.5% 10.8% 2.7%
Without comforts heating 3.9% 26.0% 4.4%
Tenure status
Owner (beneficiary) 91.6% 82.8% 91.4%
Tenant 7.1% 14.7% 7.2%
Other grounds 1.3% 2.5% 1.4%
Differences between Roma and non-Roma Households
with Roma and non-Roma Head of Households regarding the
Size of Dwellings, Room Number per capita and Crowding in 2011
Head of Household
non-Roma Roma Total
Number of rooms 2.80 2.40 2.79
Basic area (sq. m) 79.10 73.38 78.90
Number of residents 2.50 4.60 2.60
Number of residents/room 0.98 2.10 1.01
sq. m/capita 39.90 22.10 39.60
Crowding (more than 2 3.50 34.60 4.20
people/room)
Source: Central Statistical Office, Census, 2011.
7. Social Inclusion Assistance
In the following section, the various support structures are reviewed through which the support
of communities living in extreme poverty is realisable followed by the results of some complex
support programmes.
Since Hungary’s accession to the EU in 2004, its national development policy is determined by
the support structure and associated conditionality of the EU - the vast majority of the
developments in Hungary are realised using EU funds. (The allocation of EU funds depends on
decisions at a national domestic level, but certain development directions and targets are put in
place by, and must get pre-approval from the EU). The EU plans in seven-year budget periods;
between 2014 and 2020, Hungary can obtain EUR 35 billion for support. (The rate of support
per citizen is the second highest in the EU.)
EU funds are accessible through Operational Programmes (OP).34 From these funds, the
following projects aimed at Roma communities living in extreme poverty are the most relevant:
34Each OPs is renamed in any new grant period. 2004-2007: HR OP: Human Resource OP, 2007-13: SoROP: Social Renewal
Operational Programmeme; 2014-20: HRD OP: Human Resource Development OP. All this does not necessarily mean content-
wise change, but new design, branding, logo, etc.
22- HRD OP (in Hungarian EFOP)- Human Resource Development Operational
Programme (programmes related to the improvement of human resources, education,
trainings and social supplies);
- EDI OP (in Hungarian GINOP) – Economic Development and Innovation
Operational Programme (enterprise development, including social enterprises and
social cooperatives, too);
- TSD OP (in Hungarian TOP) – Territorial and Settlement Development Operational
Programme (the former regional development resources, local infrastructure
development, e.g. complex settlement upgrading programmes);
- ARD OP (in Hungarian VP) – Agricultural and Rural Development OP (to this
category belongs e.g. the LEADER programme, which enables the implementation of
locally planned and evaluated projects).
The government publishes timings and allocated budget frameworks of the OPs at the beginning
of each year, after the adoption of the budget law. Generally, the government’s preferences for
the period 2014-20 are business development, in order to increase employment rates and improve
market competitiveness. The civil society actors, working on deep poverty alleviation and for the
equal opportunities of Roma, are mostly eligible to apply for HRD OP sources.35 However,
within that OP, the role of the state is increasingly significant, meaning that more and more
programmes get prioritised support, and these programmes are exclusively implemented by
public institutions. EU funds are available not only through the national structure, but through
so-called direct applications. However, regarding the number of funded projects, and the total
amount of these sources, the overall volume of these direct applications represents a much
smaller proportion than the resources available at national level (the next chapter addresses the
implementation of organisations in detail).
In addition to EU funds, the Norwegian Civil Fund and the Swiss Fund distribute resources for
social development in Hungary. These funds support some large-scale investments too, but it is
also possible to bid for the so-called civil funds to realise small-scale, local projects.
The range of non-governmental supporters is becoming more and more important in Hungary.
Large corporations provide the most support, often as part of the Corporate Responsibility
strategy of multinational companies. For now, only a few private donors are working in Hungary,
but this part of the sector is also emerging and developing. 36 It is significant that some of the
private foundations are both donors and applicants - an adoption of a profit maximisation - cost
minimisation business model (E.g. Vodafone, T-Mobile, Velux, TEVA, Erste Bank, MOL, OTP
Bank, Szerencsejáték Zrt.).
In connection with the private donors, one should acknowledge, in particular, the Soros
Foundation37, though it is rather a global institutional system, than a national donor. The
foundation currently has no regular calls for Roma civil organisations; funds are accessible on ad-
35 Not exclusively, but typically, the calls of the HRD OP are aimed to support human development services, which Roma and
pro-Roma organizations are also eligible to apply for. The RD OP may appeal to them in a much smaller proportion, and within
that especially the LEADER programme. This OP aims more at business and economic development.
36 See also: Hungarian Donors Forum, http://www.donorsforum.hu/hu/tagok.
37 The Hungarian bureau of the Soros Foundation has been closed for almost a decade; the network is still active through the
Open Society Institute and through the CEU.
23You can also read