Ocean Governance: Our Sea of Islands - A Sustainable Future for Small States: Pacific 2050 - The Commonwealth
←
→
Page content transcription
If your browser does not render page correctly, please read the page content below
Ocean Governance:
Our Sea of Islands
A Sustainable Future for Small States: Pacific 2050
Overview
A Sustainable Future for Small States: Pacific 2050 is part of the
Commonwealth Secretariat’s regional strategic foresight programmes
that examines whether current development strategies set a region on a
path to achieve sustainable development by 2050. The publication follows
a previous study on the Caribbean entitled Achieving a Resilient Future for
Small States: Caribbean 2050, which was launched at the Commonwealth
Global Biennial Conference on Small States in May 2016.

The study commences with an analysis of whether          Realising the Pacific Vision by 2050:
the Commonwealth Pacific small states (Fiji, Kiribati,
Nauru, Papua New Guinea, Samoa, Solomon                  Building on the Basics
Islands, Tonga, Tuvalu and Vanuatu) are set to
                                                         In Chapter 1, Dr Jimmie Rodgers and Resina
achieve the Sustainable Development Goals (SDGs)
                                                         Katafono explore the thematic areas of the study
(Chapter 2). It then focuses on a number of critical
                                                         (political governance, development effectiveness
areas impacting on the region’s development:
                                                         and co-ordination, ocean governance, NCDs,
•    Governance, focusing on political governance        ICT, migration and climate change and energy),
     (Chapter 3), development effectiveness              summarising the key issues and challenges relating
     and co-ordination (Chapter 4) and ocean             to each of them before highlighting common
     governance (Chapter 5).                             threads running through all of them. The authors
                                                         find that these shared features can also be
•    Non-communicable diseases (NCDs)
                                                         recognised in further thematic areas not covered
     (Chapter 6).
                                                         in the study, which are also present in other small
•    Information and communications technology           states. While not new or ground-breaking, these
     (Chapter 7).                                        common challenges reflect the essential building
                                                         blocks of development. For the Commonwealth
•    Climate change, focusing on migration and
                                                         Pacific small states, responses to these are already
     climate change (Chapter 8) and energy issues
                                                         in place, although at different stages of maturity and
     (Chapter 9).
                                                         with none completely on solid footing. The authors
In each of these areas, possible trajectories to 2050    propose a few key recommendations to build on
are explored, gaps in the current policy responses       this groundwork in order to achieve the SDGs and
are identified and practical recommendations are         realise the Pacific Vision.
offered.
Chapter 1 of the study analyses the common               The Commonwealth Pacific Small
threads in each of the thematic areas (Chapters          States: The Future in the Mirror of
3 to 9), providing overall cross-cutting
                                                         the Past
recommendations to steer the region towards
the Pacific Vision of ‘a region of peace, harmony,       In chapter 2, Resina Katafono examines whether
security, social inclusion, and prosperity, so that      the nine Commonwealth Pacific small states can
all Pacific people can lead free, healthy, and           achieve the SDGs by 2030, extending to 2050 if
productive lives’.                                       that is not achieved. The assessment is based on
                                                         the Tier 1 indicators considered by the Inter-Agency
                                                         Expert Group on the SDGs in December 2016. Goal
                                                         17 and targets for each of the goals related to the
means of implementation are excluded from the progress, including through the Framework for
assessment as these depend not just on national Pacific Regionalism and the Forum Compact
efforts, but also on regional and international on Strengthening Development Co-ordination,
efforts. The trends are computed through a simple the author finds that there are remaining gaps
linear regression forecast function of the indicator that need to be considered in the face of the
against time. The impact of population projections three potential scenarios (deterioration, status
is also analysed. For many of the SDGs, the author quo, transformation) as the countries progress
finds insufficient data to make an assessment but toward 2050. The author concludes with
provides a qualitative judgment instead, based, in recommendations that address these gaps.
some cases, on the countries’ past performance on
the related Millennium Development Goal. Ocean Governance: Our Sea
of Islands
Political Governance and the Quest
In Chapter 5, Hugh Govan brings out issues
for Human Development of governance at the sectoral level through
In chapter 3, Graham Hassall focuses on political the examination of ocean governance and
governance, a major underlying determinant for management arrangements. As abundant as the
the success or failure of any economy. The author uses and users of the Pacific Ocean are, so too
reviews the key challenges that the Commonwealth are the global, regional and national mechanisms
Pacific small states currently face with regards to that govern them. The author discusses these
the structure and operations of their governance governance arrangements before examining the
institutions. It is noted that while there is consensus key issues and challenges in the fisheries, transport,
on the challenges, there is less agreement on the tourism and emerging sectors (deep sea mining and
possible solutions. In looking to 2050, the chapter bioprospecting), also highlighting environmental
offers three scenarios for the Commonwealth pressures and threats, geopolitical interests and
Pacific small states and possibly for the region gender perspectives. The Pacific has had promising
as a whole. Faced with these, the author argues responses to the challenges faced, with successful
that attention should be focused on developing Pacific advocacy and leadership on oceans issues
capacity at sub-national, national and regional in the global arena, the growth of regional oceans
levels, in addition to continuing efforts in building policy commitments, capitalisation of the tuna
institutions. The chapter concludes with practical resources through the Parties to the Nauru
recommendations on how to strengthen local, Agreement, and advances in community-led natural
national and regional governance. resource management. Looking to 2050, the
author highlights the major challenges to overcome
Development Effectiveness & and offers practical actions to address these.
Co-ordination: Partnerships on
Non-Communicable Diseases:
Pacific Terms
Unlocking the Constraints to
In chapter 4, Garry Wiseman tackles governance
Effective Implementation of Policy
from the perspective of development effectiveness
and co-ordination. This is an important issue for the Interventions
Commonwealth Pacific small states and the region
In Chapter 6, Dr Jimmie Rodgers outlines the
as a whole, given the relatively high dependence of
Pacific region’s battle against NCDs, the leading
many countries
cause of death in all the Commonwealth Pacific
on official development assistance. The author small states (except PNG). The author highlights
outlines a range of issues that relate to the level of that there are more than adequate policies and
development effectiveness achieved by the nine strategies in place to combat NCDs at the global,
countries, underscoring the importance of the regional and national levels but the major gap
economic and social determinants in explaining is to do with the effective implementation of
the differences in progress. While national and these. The author also highlights the interlinkages
regional steps have been undertaken to enhance between NCDs, poverty, gender, youth and climatechange, as well as the effects that the improved populations and remittances. The particular
urban design of towns and cities, as well as ICT, circumstances of atoll states (Kiribati and Tuvalu)
can have in combating NCDs. In looking to 2050, are also highlighted, given their significant
two possible paths are offered. In light of the two development challenges and extreme vulnerability
possible scenarios and the gaps highlighted, the to climate change and severe climatic events.
author concludes with recommendations that Key responses and opportunities are discussed
can help unlock the constraints on the effective in the context of skilled migration and seasonal
implementation of effective policy at national, worker schemes, while key issues and challenges
regional and international levels. are centred on issues of displacement and
resettlement, and data for evidence-based
Connectivity and Information and policy. The journey towards 2050 is expected
to be complicated and challenging, as well as
Communications Technology dependent on the policies of the metropolitan
In chapter 7, Ravi Raina looks at the key challenges states adjoining the Pacific region. The author
that Commonwealth Pacific small states face concludes with practical recommendations for
in maximising the potential of ICT. While many action at the regional and national level to address
developed countries have capitalised on the these challenges.
advances in ICT, small states have lagged
behind. In the Pacific, remote island geography Strengthening Communities and
and population dispersion are major barriers to
improving connectivity and ICT infrastructure.
Economies through Sustainable
Nevertheless, ICT penetration through mobile and Energy
broadband connectivity has increased significantly,
In chapter 9, Anthony Polack sets out to analyse
although there are wide intra-regional differences.
the key energy-related issues and challenges facing
Most Commonwealth Pacific small states have
the Commonwealth Pacific small states. The author
strategies in place to develop and regulate the ICT
finds that the common challenges faced by the nine
sector but gaps remain. In 2050, ICT is expected to
countries include difficulties in achieving energy
have developed radically from its current form and
security and effective co-ordination, population
while progress is slower than elsewhere, uptake of
dispersion and geographical barriers, lack of energy
ICT in the region is expected to follow the global
data, weak institutional and technical capacity,
trend. The author concludes by proposing a few
non-market electricity tariffs, irregular electricity
practical recommendations to prepare the region
supply, lack of attention to energy efficiency and
for a technology-driven knowledge-based society
sustainable transport, financing constraints and
in 2050.
a lack of gender perspectives. For each of these
challenges, the author outlines the regional and
Migration and Climate Change: national responses in place but highlights that
Towards a Secure Future gaps remain. Addressing these gaps will be
crucial in determining the outcome from the three
In chapter 8, John Connell examines issues
possible scenarios envisaged for 2050. The author
of migration and climate change, discussing
concludes with practical recommendations that can
international migration, migration structures,
change the current trajectory, as well as address the
inter-regional migration, and rural-urban migration
gaps in the regional and national responses.
patterns, and their impact on economies,A Sustainable Future for Small States: Pacific 2050
Chapter 5: Ocean Governance – Our Sea of Islands
Hugh GovanADVANCE COPY – PLEASE CITE AS: Govan, H. (2017), ‘Ocean Governance – Our Sea of Islands’ in Katafono, R. (ed.), A Sustainable Future for Small States: Pacific 2050 (forthcoming), Commonwealth Secretariat, London. Commonwealth Secretariat Marlborough House Pall Mall London SW1Y 5HX United Kingdom © Commonwealth Secretariat 2017 All rights reserved. No part of this publication may be reproduced, stored in a retrieval system, or transmitted in any form or by any means, electronic or mechanical, including photocopying, recording or otherwise without the permission of the publisher. Published by the Commonwealth Secretariat
Contents

5.1 Introduction ..................................................................................................... 1
5.2 Context........................................................................................................... 1
  5.2.1 Pacific Ocean resources .................................................................................. 1
  5.3 Global and regional oceans governance................................................................ 13
  5.4 Maritime boundaries and jurisdiction .................................................................. 19
  5.5 National governance, policy and institutions ......................................................... 20
5.6 Key issues ...................................................................................................... 23
  5.6.1 Fisheries .................................................................................................. 23
  Transport ........................................................................................................ 27
  Tourism .......................................................................................................... 28
  Emerging sectors ............................................................................................... 29
  Environmental pressures and threats ....................................................................... 31
  Geopolitical interests .......................................................................................... 31
  Gender perspectives ........................................................................................... 32
5.7 Promising responses .......................................................................................... 33
  5.7.1 Pacific advocacy and leadership in the global arena .............................................. 33
  5.7.2 Regional Oceans Policy commitments ............................................................... 33
  5.7.3 Optimising the region’s tuna resources .............................................................. 33
  5.7.4 Community-led natural resource management ..................................................... 34
5.8 Looking to 2050 ............................................................................................... 34
  5.8.1 Major challenges ........................................................................................ 34
  5.8.2 Ways forward ............................................................................................ 38
5.9 Recommendations ............................................................................................ 43
  5.9.1 Shift the ocean paradigm from ‘explore and exploit’ to ‘sustain and be sustained by’ ..... 43
  5.9.2 Refining regional approaches to ‘communities of interest’ and reviewing the role of
  technical agencies.............................................................................................. 43
  5.9.3 Whole-island and whole-ocean approaches ......................................................... 43
  5.9.4 Improving national service delivery and natural resource governance arrangements ....... 44
Notes ................................................................................................................ 45
Annex 1. The Roles of Regional Organisations in Oceans Governance .................................... 48
Annex 2. Excerpt from the 2030 Agenda for Sustainable Development .................................. 51
References ......................................................................................................... 52
5.1 Introduction
The Pacific Island Countries and Territories (PICTs)1 are large ocean states with jurisdiction over 28
million square kilometres of ocean in their Exclusive Economic Zones (EEZs)2 or 8 per cent of the
global ocean. This also covers 20 per cent of the global EEZs and 25 per cent of the world’s coral
reefs (Burke et al. 2011). These figures contrast markedly with the small combined land mass of
only half a million square kilometres. The nine Commonwealth Pacific small states (Fiji, Kiribati,
Nauru, Papua New Guinea, Samoa, Solomon Islands, Tonga, Tuvalu and Vanuatu)3 have the lion’s
share of land resources (95%), coastline (72%), area accessible to inshore fisheries (70%) and coral
reefs (60%) but only 40 per cent of the region’s EEZ. The major share of the EEZ is fairly evenly
distributed between non-Commonwealth countries and dependent territories.

The Pacific is extremely culturally diverse, as exemplified by the more than 1,000 languages
spoken. The ocean and coastal seas have long been integral to the Pacific way of life and world
view. Indeed, there has been a growing call by countries of the Pacific Island region for recognition
as guardians of the Pacific Ocean, as eloquently expressed by Epeli Hau’ofa in ‘Our Sea of Islands’
(Hau’ofa 2008):

         No people on earth are more suited to be guardians of the world’s largest ocean
                     than those for whom it has been home for generations.

Pacific peoples originally migrated and some traditionally voyaged over an area totalling around 70
million square kilometres extending from Easter Island in the east to New Zealand in the south, the
Northern Hawaiian Islands and Papua in the west4. Thus, tens of millions of square kilometres
currently considered beyond national jurisdictions have traditionally been the domain of the
inhabitants of PICTs.

Pacific islanders’ strong reliance on the ocean is exemplified by a consumption of fish 2-3 times
more than the global average with 47 per cent of coastal households earning their first or second
income from selling fish they catch. Commercial fishing access fees contribute up to 60 per cent of
national revenue for some Pacific island nations and tourism may be the largest contributor to
formal employment (Bell et al. 2011; Gillett 2016; World Bank 2016a).

The importance of the Pacific Ocean to the future of its island inhabitants is inescapable. This
chapter sets out to briefly review the state and importance of its contributions to Pacific island
countries, outline its governance and management arrangements, and after identifying some key
issues and promising responses, suggest some ways forward to achieve a sustainable future.

5.2 Context
5.2.1 Pacific Ocean resources
The Pacific Ocean is currently an important resource for fisheries, transport and tourism, and there
are also emerging opportunities for deep sea minerals, energy and bioprospecting.

Fisheries5
Fisheries production can be broadly categorised as coastal, offshore, freshwater and aquaculture
(see Box 5.1). The volume of fisheries production in the Pacific region6 is around 1.7 million tonnes,
with an estimated value of US$3.6 billion dollars, 75 per cent of which is accounted for by
Commonwealth Pacific small states (Table 5.1). The larger proportion is accounted for by offshore
tuna fisheries, mainly by foreign-based vessels,7 particularly in Kiribati and PNG.

                                Ocean Governance – Our Sea of Islands \ 1
Box 5.1 Types of fisheries
Coastal commercial: The catch that is sold (i.e. enters commerce) and that derives
from fishing operations that take place in lagoon, reef, deepslope or shallow sea
areas. This category also includes fish caught by trolling/handing from small vessels
in the open sea adjacent to islands.
Coastal subsistence: The catch that is retained for consumption by the fisher or
given away to family or friends. For simplicity, the catches from recreational fishing
are considered as production for home consumption, and therefore as a component
of subsistence fisheries.
Offshore locally based: The catch from industrial-scale tuna fishing operations that:
(a) are based at a port in the relevant Pacific Islands country; and (b) are generally
harvested more than 12 nautical miles offshore.
Offshore foreign-based: The catch from industrial-scale tuna fishing operations that
are based at ports outside of the relevant country.
Aquaculture: The production from the farming of aquatic organisms, including fish,
molluscs, crustaceans and aquatic plants. Farming implies some form of intervention
in the rearing process to enhance production, such as regular stocking, feeding or
protection from predators.
Freshwater: The catch from streams, rivers and lakes, whether for subsistence or
commercial purposes.
Source: Gillett, 2016
Table 5.1 Fishery production by category in 2014 (US$ million)
Coastal Offshore Fresh- Aqua- Total
water culture
Commercial Subsistence Locally Foreign
Based Based
Fiji 38 29 54 - 4 1 127
Kiribati 15 16 4 1,111 -products (such as pearls), and freshwater fisheries production contribute very little value to
economic growth in Commonwealth Pacific small states.
Figure 5.1 Relative importance of off-shore and coastal fisheries to the Pacific Region
Source: Data from Gillett (2009) interpreted in Govan (2013)
Fisheries contribution to GDP is generally thought to be underestimated for most countries.
Consequently, Gillett (2016) has attempted to re-estimate fisheries contribution to GDP given the
weaknesses in official data. It was found that while official estimates varied from 1 to 9 per cent,
re-estimates varied from 2 to 16 per cent. For countries where there are significant differences,
the official estimates tended to rely on dated surveys, weak indicators and/or poorly understood
methods (Gillett 2016). Based on the re-estimates, Kiribati, Solomon Islands, Tuvalu and Tonga all
recorded fisheries contribution of above 4 per cent of GDP (Table 5.2).
Table5.2 Official estimates and re-estimates of fishing contributions to GDP
Official fishing contribution Re-estimate of fishing Year of GDP estimate
(% of Official GDP) contribution
(% of Official GDP)
Fiji 1.8% 1.6% 2014
Kiribati 8.6% 16.2% 2014
Nauru 2.3% 1.3% 2014
PNG 1.7% 2014
Samoa 3.0% 3.4% 2014
Solomon Is 2.5% 7.2% 2014
Tonga 2.3% 4.4% 2013/2014
Tuvalu 9.4% 4.7% 2012
Vanuatu 0.6% 1.5% 2014
Source: Gillett, 2016
Except for PNG, Solomon Islands and Fiji, coastal fisheries account for 90 per cent of the fishing
contribution to GDP (Figure 5.2). Coastal fisheries account for more than 50 per cent of the fishing
contribution to GDP in PNG (>60%), Solomon Islands and Fiji (>70%).
Figure 5.2 Re-estimated fishing contribution to GDP by fishery category (US$)
Fiji
Kiribati
Nauru
PNG
Samoa
Solomon Is
Tonga
Tuvalu
Vanuatu
0% 10% 20% 30% 40% 50% 60% 70% 80% 90% 100%
Coastal Commercial Coastal Subsistence Offshore Locally Based
Freshwater Aquaculture
Source: Gillett, 2016
Ocean Governance – Our Sea of Islands \ 3Offshore Fisheries8
More than half of the world production of tuna is from the Western and Central Pacific Ocean
(WCPO)9 and the Pacific Island Countries’ (PICs) waters supply around 34 per cent of the world’s
tuna catch each year, worth some US$3.4 billion to processors and generating net economic
benefits to PICs of about US$500 million in 2013 (World Bank 2016b). Just over two thirds was from
domestic harvesting and processing by PICs, with the remainder from access fees.
The main species fished, status and current management recommendations are10:
Skipjack: fast-growing and short-lived, in warmer tropical waters, the main species
landed and regarded as relatively resilient to fishing pressure. Fishing mortality has
been increasing but the stocks are not considered overfished, although in recent years
catches have been around the maximum sustainable yield (MSY).11 Current
recommendations are to keep the skipjack stock around the current levels with tighter
purse-seine control rules.
Yellowfin: relatively fast-growing species and the second largest component of catches
found in tropical and sub-equatorial waters. Stocks are not considered overfished,
although latest catches are close to or exceed the MSY. Current recommendations are
that catches should not exceed 2012 levels, which had surpassed the MSY, and
appropriate measures implemented to maintain current spawning biomass levels.
Albacore: found in two discrete stocks, north and south of the equatorial zone, long
lived and generally caught in deeper waters. The northern stock is not considered
overfished, and while the same applies to the southern stock, recommendations are to
reduce longline catches to maintain economically viable catch rates.
Bigeye: long-lived and among the largest tuna species with broad distribution. There
has been overfishing for more than ten years and current management measures appear
to be insufficient to end overfishing in the short term. Recommendations are to reduce
fishing by 36 per cent compared to 2008-2011 levels.
The main tuna fishing methods are industrial, though small amounts are taken by small-scale
artisanal fisheries in coastal waters:
Industrial purse-seining: a large fishing vessel sets a net in a circle around a school of
tuna. Largely targets skipjack and to a lesser extent yellowfin but may catch multiple
species.
Industrial longline: vessels set baited hooks from long lines with thousands of baited
hooks attached at regular intervals. Larger vessels usually have their own freezing
equipment and are based outside the Pacific and smaller vessels which use ice and are
based in Pacific ports. Representing around 10 per cent of catches, tropical longliners
target mainly yellowfin and bigeye, while southern longline fishers target albacore.
Pole and line fishing: catching fish by a pole with a single hook, while sprinkling sea
with live bait targeting skipjack.
The movements of the region’s four main tuna stocks cover a vast area of the WCPO and the fishing
fleets have to cover thousands of kilometres in search of schools. However, the emergence of
modern technology, particularly fish aggregating devices,12 is continually improving cost-
effectiveness. The Commonwealth Pacific small states control over a third of these waters and
together with the other PICs control over two thirds.13
The purse-seine sector has seen important growth over the past 35 years with a tenfold increase in
vessels (Figure 5.3) and nearly 20 times the landings to over 2 million tonnes in 2014. Other fishing
methods have not seen similar growth or have declined (ISSF 2016). The distribution and abundance
of tuna stocks are influenced by the currents, water temperature, dissolved oxygen and nutrient
supply (Bell et al. 2011), particularly the effects of the El Nino-Southern Oscillation.14 Subject to
these variables, the major proportion of purse-seine catches take place in the waters of Kiribati
and PNG, with lesser proportions in Nauru, Solomon Islands, Tuvalu and non-Commonwealth Pacific
small states of Federated States of Micronesia (FSM), Marshall Islands and Palau. Collectively, these
Ocean Governance – Our Sea of Islands \ 4states, which are also members of the Parties to the Nauru Agreement (PNA) (see Box 5.2), control
the world’s largest sustainable tuna purse-seine industry. Only around 20 per cent of catches occur
outside the waters of the Commonwealth Pacific small states, including in Indonesia’s and the
Philippines’ waters, and up to 7 per cent occurs in international waters.
Figure 5.3 Evolution of tuna catches in the WCPO by fishing gear
Catch (mt)
3,500,000
Longline Pole and line Other Purse seine
3,000,000
2,500,000
2,000,000
1,500,000
1,000,000
500,000
0
1978
2012
1960
1962
1964
1966
1968
1970
1972
1974
1976
1980
1982
1984
1986
1988
1990
1992
1994
1996
1998
2000
2002
2004
2006
2008
2010
2014
Source: Williams and Terawasi (2015)
Though there is a growing Pacific islands purse-seine fleet (locally based), they were responsible
for only 23 per cent of the WCPO purse-seine catch in 2013, of which around half was caught by
PNG. Foreign-based fleets accounted for the rest of the catch, with Taiwan, Japan, Korea and the
USA accounting for 47 per cent, while Indonesia’s and the Philippines’ largely domestic fleets
accounted for 20 per cent. Other distant water fleets (China, Ecuador, New Zealand, El Salvador,
Spain, Vietnam) accounted for the remaining catch (World Bank 2016b).
For the smaller longline industry, between a quarter and third of the tuna catches are in
international waters, with other significant catches in the waters of Fiji, Kiribati, Solomon Islands
and Vanuatu, as well as in the waters of non-Commonwealth Pacific small states (Cook Islands, FSM
and French Polynesia) (World Bank 2016b using FFA 2015b data). Although PICs have jurisdiction
over a relatively smaller proportion of the WCPO longline fishery, it generates higher value
products (approximately triple by weight), such as albacore for higher priced canned tuna, and
yellowfin and bigeye for sashimi. About half the catches are made by vessels from China, Taiwan
and Japan while vessels from Indonesia, Korea, Vietnam, Vanuatu and Fiji catch between 5 and 10
per cent of the total each (World Bank 2016b).
Only around 12 per cent (US$1.9 billion) of the total value of the offshore fisheries (US$2.2 billion)
is actually captured by the Commonwealth Pacific small states in terms of government revenue
through access fees or levies (Table 5.3). Commonwealth Pacific small states receive access fees
through fisheries treaties, particularly the PNA and the United States Tuna Treaty (see section on
Regional Oceanic Fisheries Policy). Kiribati and PNG receive the majority of the US$263 million in
access fees (Table 5.3). Access fees make up a significant per cent of government revenue for
Kiribati (75%) and Tuvalu (58%), and to a lesser extent in Nauru (14%).
Ocean Governance – Our Sea of Islands \ 5Table 5.3 Access fees for foreign fishing in 2014
Access fees Access fees
(US$ million) (% of government revenue)
Fiji*Coastal fisheries
Coastal fisheries permeate all aspects of Pacific Island life. However, because it is difficult to
quantify the value of coastal fisheries, they have a much lower political profile than oceanic
fisheries. Nevertheless, as discussed earlier, coastal fisheries contribute significantly to GDP,
government revenue and nutrition (Figure 5.5).
Figure 5.5 Fishing contribution by fishery category to the regional GDP in 2014
7%
6% 19%
22%
42%
Coastal Commercial Coastal Subsistence Offshore Locally Based
Freshwater Aquaculture
Source: Gillett, 2016
Sea cucumbers (or bêche de mer) are the second most valuable fishery after tuna and have been
exploited as a high-value export commodity for at least 170 years (Conand 1990; Kinch et al. 2008,
Purcell et al. 2013, Purcell et al. 2016). However, unlike tuna, this fishery is directly open to, and
benefits, coastal dwellers, with an estimated 300,000 fishers in the region. For Fiji, PNG, Solomon
Islands, Tonga and Vanuatu, sea cucumber production in the past decade had an average value of
some USD$20 million per year and it was estimated that improvements in resource management
and processing could double the value accrued to communities (Figure 5.6) (Carleton et al. 2013).
However, declining stocks manifest in boom-and-bust cycles, which has prompted governments to
set moratoria on sea cucumber production in many countries.
Figure 5.6 Sea cucumber potential in Fiji, PNG, Solomon Islands, Tonga and Vanuatu
US$ million
40
35
30
25
20
15
10
5
0
Current Situation Potential
Current Production Sustainable Management
Processing Improvements
Source: Carleton et al. 2013
Ocean Governance – Our Sea of Islands \ 7Coastal fisheries have a significant impact on local livelihoods for many of the Pacific coastal
communities. While coastal fishing is mainly a subsistence activity to provide fish and invertebrates
for household food, an average of 47 per cent of households in coastal communities are reported to
earn their first or second income from selling surplus fish and invertebrates caught from coastal and
nearshore waters (Bell et al. 2011).
In addition, coastal fishing contributes to the bulk of locally consumed fish, though in some places
there are important contributions from offshore fishing (including tinned or discards/bycatch) and
inland aquaculture (tilapia in PNG, Vanuatu and Fiji). Local consumption of fish in the Pacific
region is estimated to be two to three times the global average but varies widely, being generally
much higher in atoll nations (Kiribati, Nauru, Tuvalu) and lower in larger countries with significant
inland populations (PNG, Vanuatu) (Gillett 2016).
Fish is rich in protein, essential fatty acids, vitamins and minerals and is thought to provide 50-90
per cent of dietary animal protein in rural areas across many PICTs (Bell et al. 2011). This ‘healthy
protein’ is an alternative to nutritionally poor imported foods that increasingly form part of Pacific
diets and is thought important to combat the high prevalence of non-communicable diseases in the
region (Charlton et al. 2016). As a large proportion of the Pacific population lives in remote rural
areas with poor transport infrastructure and lack of cash, they are heavily dependent on coastal
fisheries in maintaining healthy diets. Healthy coastal fisheries also provide a source of emergency
food during disaster recovery when agricultural production may be disproportionally affected.
Moreover, other activities that rely on the availability of coastal fisheries, such as tourism and
cultural obligations, depend on the inextricable link to the healthy functioning of the ecosystems.
Culturally, local communities attach a high value to preserving ecosystems for use by future
generations (bequest value). This may reflect the ‘duty of care’ that underpins the relationship
between the people and land in many regions (O’Garra 2012). Coastal fisheries also play an
important role in social cohesion (WWF 2016). These are some of the important non-market values
of coastal fisheries and it is indisputable that these important ‘intangibles’ are of great value to
people and industries in the Pacific (WWF 2016).
Aquaculture
For more than 50 years, aquaculture has been promoted as a development opportunity, presumably
owing to the abundance of appropriate environmental conditions, as well as to divert pressure from
wild fisheries stocks. However, despite many years of research and investment, the production of
aquaculture in the region is relatively small. According to Gillett (2016), aquaculture is valued at
around USD$116 million (Table 5.1), mainly led by French Polynesia (pearls) and New Caledonia
(shrimps). Commonwealth Pacific small states account for only US$4 million of the regional catch or
0.1 per cent of the value of fisheries production (Table 5.1), with Fiji and PNG accounting for the
bulk of that value, at USD$1.5 million and USD$1.2 million, respectively.
Interestingly, while the Food and Agriculture Organization (FAO) had similar estimates for the
regional value of aquaculture, albeit slightly higher, at USD$135 million (FAO 2016), the country-
level estimates were quite different, particularly for PNG. FAO estimated the aquaculture value for
PNG at USD$10 million in 2014 (Figure 5.7), led by tilapia (Figure 5.8). It is unclear, though, as to
the source of FAO’s data. Although not strictly relating to oceans governance, given the potential
that freshwater aquaculture may have, particularly in the larger islands, to substitute or
supplement protein sources from marine fisheries, it is important to clarify the differences in the
data.
Ocean Governance – Our Sea of Islands \ 8Figure 5.7 Value of marine and freshwater aquaculture by country
USD$'000
14,000
12,000
10,000
8,000
6,000
4,000
2,000
0
1984
1985
1986
1987
1988
1989
1990
1991
1992
1993
1994
1995
1996
1997
1998
1999
2000
2001
2002
2003
2004
2005
2006
2007
2008
2009
2010
2011
2012
2013
2014
Fiji Kiribati Nauru PNG Samoa Solomon Is Tonga Tuvalu Vanuatu
Source: FAO 2016
More than 40 species have been subject to experimental and sometimes commercial-scale pilots,
including bivalves, shrimps, crabs, coral, seaweed and fish. Production of seaweed (eucheuma) has
on occasion shown some promise in rural settings but has been characterised by large fluctuations
over the past 30 years relating to variations in market price, project cycles and government policy
priorities (Figure 5.7).
Figure 5.8 Value of aquaculture by species
USD$'000
14,000
Nile tilapia Common carp
12,000 Eucheuma seaweeds nei Rainbow trout
Blue shrimp Giant river prawn
10,000 Elkhorn sea moss Giant tiger prawn
Other
8,000
6,000
4,000
2,000
0
1984
1985
1986
1987
1988
1989
1990
1991
1992
1993
1994
1995
1996
1997
1998
1999
2000
2001
2002
2003
2004
2005
2006
2007
2008
2009
2010
2011
2012
2013
2014
Source: FAO 2016
Subject to data reliability, the FAO’s data indicates extremely disappointing trends in marine
aquaculture or mariculture production (Figure 5.9), especially in light of continued investment by
donors, governments and, perhaps consequently, regional organisations; and the often-stated hopes
for marine aquaculture. The situation for freshwater aquaculture is more hopeful in terms of
successes in PNG for tilapia and carp, but these data may be subject to verification.
Ocean Governance – Our Sea of Islands \ 9Figure 5.9 Value of aquaculture by environment
USD$'000
14,000
12,000
10,000
Brackishwater Freshwater Marine
8,000
6,000
4,000
2,000
0
1984
1985
1986
1987
1988
1989
1990
1991
1992
1993
1994
1995
1996
1997
1998
1999
2000
2001
2002
2003
2004
2005
2006
2007
2008
2009
2010
2011
2012
2013
2014
Source: FAO 2016
Transport
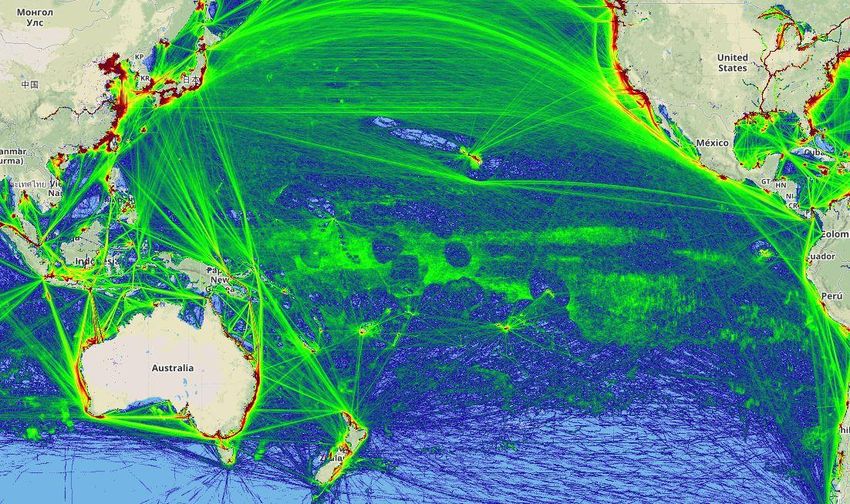
The Pacific Ocean has long been vital to the indigenous people as a mode of communication, and
more recently has acquired global importance for international and domestic transport and other
shipping activities, such as fishing and cruise tourism. Spurred by global trade, global shipping has
increased significantly in the last 20 years, with nearly four times as many ships at sea. The Pacific
Ocean saw ship traffic spike after 2008, especially near China, with cargo shipping accounting for
much of the growth (Tournadre 2014; Kinch et al. 2010). More than a third of the East-West global
container traffic crosses the Pacific (UNCTAD 2015) (Figure 5.10) and the importance of trans-
Pacific trade is intimately linked to the major defence spending in the region by bordering states,
which dwarfs the economies of island states in comparison – this is further addressed in the
discussion on geopolitical issues below.
Figure 5.10 Maritime traffic in the Pacific Ocean in 2015
Source: marinetraffic.com
Ocean Governance – Our Sea of Islands \ 10The high and increasing reliance of PICs on imports has created high dependency on domestic and
international shipping. However, the unique characteristics of Pacific shipping (minute economies
at the end of long routes, imbalance in inward/outward loadings, financing barriers, high
operational risk and high infrastructural costs) present a greater challenge than for most other
countries and regions (Nuttall et al. 2014). The majority of countries, apart from PNG and Fiji,
unable to benefit from ‘wayport calls’ (e.g. from services between Australasia and North America)
(ADB 2007), are particularly challenged and there have been calls for more sustainable transport
options (Newell et al. 2016).
The growth of cruise ships is also high in the South Pacific region, up 18.7 per cent in 2014 from
2013, and more than double the number in 2010 (World Bank 2016a). In 2014, cruise ships brought
over 400,000 cruise passengers from the two top source markets of Australia and New Zealand to
the region. Of the total, Fiji, PNG, Samoa, Tonga and Vanuatu received 350,197 cruise passengers,
with the greatest share going to Vanuatu.
Developing countries are increasingly turning to open ship registries as a source of revenue. These
registries, which allow registration of foreign-owned vessels for a fee, are also known as ‘flags of
convenience’, with 71 per cent of the world’s total shipping tonnage registered in such a way.
Panama, Liberia and the Marshall Islands are the largest vessel registries, which together accounted
for 42 per cent of the world tonnage in 2015, with the Marshall Islands having recorded an
impressive growth of over 13 per cent over 2014 (UNCTAD 2015). Tuvalu and, until recently, Tonga,
are the Commonwealth Pacific small states that have operated small open registries.
Tourism15
Tourism has emerged as an important sector for the Commonwealth Pacific small states with 1.2
million visitor arrivals, worth US$500 million in 2014 (World Bank 2016d). Fiji is by far the most
popular destination, followed by PNG, Samoa and Vanuatu. Most of the market comprises visitors
from Australia and New Zealand.
Many, if not most, of these visitors are attracted to the region’s predominant resource, the ocean.
For instance, more than 75 per cent of tourists surveyed in Fiji reported that swimming was one of
the primary activities of their vacation, with over 50 per cent reporting a variety of other water- or
beach-related activities (Verdone et al. 2012). The attraction of these marine resource based
activities will be affected by factors including carrying capacity and reduced environmental quality.
The World Bank (2016a) estimates that potentially by 2040, transformational tourism opportunities
could bring an additional US$1.89 billion in revenue and 127,600 jobs to Pacific island countries
through an additional million tourists. The cruise ship industry is growing rapidly at near 20 per
cent per year to 400,000 passengers in 2014. Home-basing cruise ships alone could bring over
133,000 tourists per year, up to US$75 million in receipts and port fees and 4,500 jobs.
Emerging uses
Energy
Interest in renewable energy production from ocean resources has a long history, most notably
ocean thermal energy conversion (OTEC) and wave energy. At present there are no large-scale
commercial operations16 anywhere in the world but, theoretically, Commonwealth Pacific small
states could all benefit from these technologies (Hourcourigaray et al. 2014; Lohani and Vega
2014). Wave energy converters are deemed unproven as the small tidal range in most Pacific islands
limits this technology. However, a recent study (Bosserelle et al. 2016) found that Pacific islands
south of latitude 20 degrees receive sufficient wave energy for generation costs to be:
on a par with the cost of generation of other renewable energies, such as wind
and solar, and, for exposed sites, on a par with the cost of diesel generation.
These findings suggest that wave energy is a genuine contender for the
development of renewable energy in the Pacific.
Ocean Governance – Our Sea of Islands \ 11In other areas, land-based wind generation is increasingly being deployed in the region and, though
limited to sufficiently windy zones, there are opportunities for offshore wind farms, particularly
where land availability is a constraint. In French Polynesia, seawater air conditioning has been used
at several resorts, which have the appropriate conditions of nearby deep water (Hourcourigaray et
al. 2014).
There are considerable economic factors to be taken into account to harness the oceanic energy
potential for commercial production, and a regional investment approach may be more appropriate
in ensuring that investment in large-scale pilots is appropriately targeted. However, there appears
to be limited justification to deploy complex and unproven technologies in the Pacific until proven
elsewhere (e.g. Hawaii) and there is sufficient capacity built in the Pacific.
PNG is the region’s only exporter of fossil fuels and continues to carry out offshore oil exploration,
where terminal facilities and undersea pipelines also affect the surrounding ocean environment.
Other Commonwealth Pacific small states have historically been interested in offshore oil
exploration (e.g. Fiji, Tonga and Solomon Islands) though attention is currently focused on deep sea
minerals.
Deep sea minerals17
Prospecting of the deeper sea floor in the late nineteenth century and again in the twentieth
century has provided evidence of the existence of metallic minerals across large sections of the
ocean floor, including in the EEZs and extended continental shelves of the PICs. These deep sea
minerals (DSM) occur in deep water (400-6,000 metres), with three main types identified within the
national jurisdiction of PICs:
Seafloor massive sulphides: Minerals precipitated around seafloor hydrothermal or
volcanic vents, including copper, iron, zinc, silver and gold. Known to occur in Fiji,
PNG, Solomon Islands, Tonga and Vanuatu.
Polymetallic manganese nodules: Nodules containing minerals such as cobalt, copper,
iron, lead, manganese, nickel and zinc, which usually occur at great depths (4,000-
6,000 metres). These have been found in the waters of Cook Islands and Kiribati, as
well as the Clarion Clipperton Fracture Zone in the eastern Pacific, beyond national
jurisdictions.
Cobalt rich crusts (CRC): As well as cobalt, these may contain precious metals such as
silver and some of the strategically important rare earth elements. These are found
between 400 and 4,000 metres depth and have been prospected in Kiribati, Samoa,
Tuvalu, Marshall Islands and Federated States of Micronesia.
The renewed interest in DSM, not seen since the 1970s, has been driven by a number of factors,
including the gradual decline of the grade of onshore minerals, the high commodity prices of 2008
and again in 2010-11, as well as technical advances in DSM exploration. PNG is the only country so
far to grant a deep-sea mining licence under the Solwara 1 Project in a world-first lease to Nautilus
Minerals. Fiji, Solomon Islands, Tonga and Vanuatu have previously granted DSM exploration
permits.
There were increasing expectations that DSM mining may soon become a reality in the Pacific, but
these have been thrown into question by the persistently low mineral commodity prices of recent
years. In addition, given the uncertainty surrounding the amounts and value of minerals on the
seabed, costs associated with their extraction, and the cost of potential social and environmental
impacts, it is hard to assess the economic potential of DSM.
A recent study (SPC 2016b) suggests that the Solwara 1 Project in PNG could produce US$130 million
present value for Nautilus, after taking out capital and operating expenses, as well as generating
around US$83 million over two years for the PNG government based on royalties, corporate tax and
the Government’s 15 per cent share of Nautilus’s profits. The same study calculated negligible
costs in terms of lost environmental services or unplanned spills. A more complex analysis for
manganese nodules in Cook Islands found, in the best scenario, a present value of US$494 million
accruing to Government over 20 years though considerably less under other scenarios. However, for
Ocean Governance – Our Sea of Islands \ 12the case of CRC in the Marshall Islands, given current technology and market conditions, the
benefits associated with DSM mining were unlikely to exceed the costs. Though there is still a major
need for cost models and more information, potential revenue of these magnitudes would clearly
be attractive to Pacific Island governments, particularly in the smaller countries.
Bioprospecting and marine genetic resources
Recent Commonwealth Secretariat reviews (Day et al. 2016; Commonwealth Secretariat 2014)
highlight that:
oceans and seas are the source of a huge variety of living marine resources that
have huge potential for developing new food, biochemical, pharmaceutical,
cosmetics and bioenergy applications. About 18,000 natural products have been
developed to date from about 4,800 marine organisms, and the number of
natural products from marine species is growing at a rate of 4 percent per year.
Thus, marine genetic resources (MGR) are deemed to represent an important opportunity for small
island developing states (SIDS)18 and PICs in particular.
5.3 Global and regional oceans governance
Commonwealth Pacific small states have acceded to or ratified many multilateral agreements.
Some provide access to global funds which facilitate implementation. However, in general,
implementation is a major challenge for most PICs. International (and many regional) policy
commitments in general do not correlate with national emphasis on implementation (Chasek 2009;
2010; Pratt and Govan 2010), but in the field of oceans governance (and more recently climate
change), PICs have punched far above their weight in terms of influencing global policy in their
favour (Quirk and Hanich 2016), particularly in the area of tuna. The following sections outline the
policy instruments of most relevance to ocean governance in the region,19 as well as those
institutions responsible for its implementation (see Annex 1 for a detailed account of the various
roles of regional organisations in oceans governance).
5.3.1 Global oceans conventions and relevant international agreements
United Nations Convention on the Law of the Sea (UNCLOS), 1982
This global convention defines the rights and responsibilities of nations with respect to their use of
the world's oceans, establishing guidelines for businesses, the environment, and the management of
marine natural resources. The convention has been ratified by 168 parties, including all the
Commonwealth Pacific small states.20 Fiji was the first country to ratify in 1982.
The United Nations (UN) supports the implementation of the Convention through inter-agency
mechanisms such as UN Oceans. The Division for Ocean Affairs and the Law of the Sea (DOALOS)
serves as the Secretariat for the Convention, reporting annually to the General Assembly, making
recommendations promoting better understanding of the Convention and supporting States in
implementing its provisions. Other aspects are handled by bodies such as the Commission on the
Limits of the Continental Shelf (CLCS) or specific international organisations; those of most
relevance are: the International Maritime Organisation (IMO), the International Whaling Commission
(IWC), Western and Central Pacific Fisheries Commission (WCPFC), and the International Seabed
Authority (ISA).
International Maritime Organisation Conventions
Except for Nauru, all the Commonwealth Pacific small states are party to the various IMO
conventions (SPC 2016d):
International Convention for the Prevention of Pollution from Ships (MARPOL) is the
main international convention covering prevention of pollution of the marine
environment by ships from operational or accidental causes.
Ocean Governance – Our Sea of Islands \ 13 Intervention on Oil Pollution Preparedness, Response and Cooperation (OPRC) and
Protocol on Preparedness, Response and Co-operation to Pollution Incidents by
Hazardous and Noxious Substances (OPRC-HNS).
International Convention relating to Intervention on the High Seas in Cases of Oil
Pollution Casualties (INTERVENTION Convention) and the 1973 Protocol Relating to
Intervention on the High Seas in Cases of Marine Pollution by Substances Other Than Oil
(INTERVENTION Protocol).
International Convention on the Control of Harmful Anti-fouling Systems in Ships (AFS
Convention), 2001 (in force 2008).
2004 International Convention for the Control and Management of Ships’ Ballast Water
and Sediments (not yet in force).
At the regional level, the South Pacific Regional Environment Programme (SPREP) supports
countries with implementing strategies and contingency plans, as well as facilitates the
development of legislation consistent with the IMO Conventions.
United Nations Convention on Biological Diversity (CBD), 1993
The CBD is a global agreement addressing all aspects of biological diversity: genetic resources,
species, and ecosystems, with the specific goals of the conservation of biological diversity (or
biodiversity), the sustainable use of its components; and the fair and equitable sharing of benefits
arising from genetic resources. There are number of protocols under the CBD addressing issues such
as Biosafety and Access to Genetic Resources and the Fair and Equitable Sharing of Benefits. All the
Commonwealth Pacific small states have signed and ratified the Convention.
In 2010, countries adopted a Strategic Plan for Biodiversity, including the Aichi Biodiversity Targets
to be achieved by 2020. These targets include applying ecosystem-based approaches to ensure
sustainable fisheries (Target 6) and targeting the conservation of 10 per cent of coastal and marine
areas through protected areas and other effective area-based measures (Target 11).
The Western and Central Pacific Fisheries Commission
The WCPFC was established by the Convention for the Conservation and Management of Highly
Migratory Fish Stocks in the Western and Central Pacific Ocean (WCPF Convention), which entered
into force on 19 June 2004,21 to implement the Provisions of the UN Straddling Fish Stocks
Agreement (UNFSA).22 The WCPFC adopts ‘resolutions’ which are non-binding statements and
‘conservation and management measures’ which are binding, with about 40 management measures
currently in force.
The WCPFC meets annually and decisions are taken on the basis of consensus, which can be
problematic for members:
Pacific Island countries form the largest block of members in the WCPFC, and
most often agree on common positions on issues before a WCPFC meeting – but
this does not equate to those countries getting what they want in Commission
meetings. The convention that established the commission states that as a
general rule, decision-making in the Commission shall be by consensus. The
convention indicates that ‘consensus’ means the absence of any formal
objection made at the time the decision is taken. Given the diversity of
interests by WCPFC member countries, this provision has created problems for
the WCPFC (and all the other regional tuna commissions in the world) as it
often means that a small number of countries can block measures that are
perceived by other countries to be important. It should be noted that when
fisheries commissions “fail” it is not because of lack of action of the
secretariats of those commissions (in this case, the WCPFC office in Pohnpei).
(Gillett 2014)
There is a widespread perception that ‘the fishing industry has an overly large influence in the
delegations of several distant-water fishing country members’, which hinders decision-making
Ocean Governance – Our Sea of Islands \ 14relating to sustainable resource management on the High Seas and places an unfair ‘conservation
burden’ on PICs (Aqorau in Gillett 2014), which implement more effective management in their
EEZs.
The 2030 Agenda for Sustainable Development, 2015
The 2030 Agenda sets out to strengthen universal peace, eradicate poverty, protect the planet and
revitalise global partnership, through the achievement of 17 Sustainable Development Goals (SDGs)
by 2030. Goal 14 focuses on the conservation and sustainable use of the oceans, seas and marine
resources for sustainable development (Annex 2). The Goals relating to poverty (Goal 1), hunger
and food security (Goal 2), gender (Goal 5), climate change (Goal 13) and governance and
participation (Goal 16) also have links with oceans issues.
Pacific Islands Forum leaders have committed to the implementation of the SDGs, with particular
attention to the region’s ‘unfinished business’ on the Millennium Development Goals. The region is
currently undertaking a country-driven process to tailor the global indicators to the national and
Pacific context. These tailored indicators will be used to monitor the region’s progress on the SDGs,
as well as to monitor the implementation of the SIDS Accelerated Modalities of Action (SAMOA)
Pathway and initiatives of the Framework for Pacific Regionalism (FPR; see Box 5.2).
SAMOA Pathway, 2014
The Third International Conference on Small Island Developing States held in Apia, Samoa, in 2014
adopted the SAMOA Pathway, which specifically addresses oceans, covering inter alia sustainable
use, conservation, pollution, research, coral reefs, illegal, unreported and unregulated (IUU)
fishing, small-scale fisheries development and management, subsidies, capacity, co-operation and a
series of environmental commitments, including a 10 per cent commitment to protected areas.
Box 5.2 Framework for Pacific Regionalism
The Framework for Pacific Regionalism was endorsed by Pacific Islands Forum
leaders in July 2014. The Framework replaced the Pacific Plan for Strengthening
Regional Cooperation and Integration. In seeking regional collective action, the
Framework explicitly values the ‘integrity of our vast ocean and our island
resources’. Based on objectives relating to sustainable development, governance,
security and economic growth, Forum leaders will each year prioritise a limited
number of regional initiatives (with no more than five, ongoing or new, to be
selected at any one time) in support of deepening regionalism. The process involves
open submissions, which are screened by a Specialist Sub-Committee on
Regionalism. To date, several ocean-related submissions have been received and
approved by Leaders in the form of the Roadmap for Sustainable Fisheries in 2015
and a commitment to coastal fisheries in 2016.
Source: PIFS, 2014
5.3.2 Regional ocean policy instruments
Pacific Islands Regional Ocean Policy (PIROP), 2002
After a relatively lengthy process of consultation, PIROP was endorsed by Pacific Islands Forum
Leaders in 2002 and its Framework for Integrated Strategic Action (PIROF-ISA) in 2005 (Pratt and
Govan 2010). The PIROP envisions a healthy ocean that sustains the livelihoods and aspirations of
Pacific Island communities and defines the ocean in a broad sense to include the waters of the
ocean, the living and non-living resources and the seabed, as well as the ocean interfaces with
islands and atmosphere. This broad definition can be taken to include the areas beyond national
jurisdiction (ABNJ).23
Ocean Governance – Our Sea of Islands \ 15You can also read