Carbon-nitrogen interactions in European forests and semi-natural vegetation - Part 1: Fluxes and budgets of carbon, nitrogen and greenhouse gases ...
←
→
Page content transcription
If your browser does not render page correctly, please read the page content below
Biogeosciences, 17, 1583–1620, 2020
https://doi.org/10.5194/bg-17-1583-2020
© Author(s) 2020. This work is distributed under
the Creative Commons Attribution 4.0 License.

Carbon–nitrogen interactions in European forests and semi-natural
vegetation – Part 1: Fluxes and budgets of carbon, nitrogen and
greenhouse gases from ecosystem monitoring and modelling
Chris R. Flechard1 , Andreas Ibrom2 , Ute M. Skiba3 , Wim de Vries4 , Marcel van Oijen3 , David R. Cameron3 ,
Nancy B. Dise3 , Janne F. J. Korhonen5,6 , Nina Buchmann7 , Arnaud Legout8 , David Simpson9,10 , Maria J. Sanz11 ,
Marc Aubinet12 , Denis Loustau13 , Leonardo Montagnani14,15 , Johan Neirynck16 , Ivan A. Janssens17 , Mari Pihlatie5,6 ,
Ralf Kiese18 , Jan Siemens19 , André-Jean Francez20 , Jürgen Augustin21 , Andrej Varlagin22 , Janusz Olejnik23,24 ,
Radosław Juszczak25 , Mika Aurela26 , Daniel Berveiller27 , Bogdan H. Chojnicki25 , Ulrich Dämmgen28 ,
Nicolas Delpierre27 , Vesna Djuricic29 , Julia Drewer3 , Eric Dufrêne27 , Werner Eugster7 , Yannick Fauvel1 ,
David Fowler3 , Arnoud Frumau30 , André Granier31 , Patrick Gross31 , Yannick Hamon1 , Carole Helfter3 ,
Arjan Hensen30 , László Horváth32 , Barbara Kitzler33 , Bart Kruijt34 , Werner L. Kutsch35 , Raquel Lobo-do-Vale36 ,
Annalea Lohila37,26 , Bernard Longdoz38 , Michal V. Marek39 , Giorgio Matteucci40 , Marta Mitosinkova41 ,
Virginie Moreaux13,42 , Albrecht Neftel43 , Jean-Marc Ourcival44 , Kim Pilegaard2 , Gabriel Pita45 , Francisco Sanz46 ,
Jan K. Schjoerring47 , Maria-Teresa Sebastià48,49 , Y. Sim Tang3 , Hilde Uggerud50 , Marek Urbaniak23 , Netty van Dijk3 ,
Timo Vesala37,6 , Sonja Vidic29 , Caroline Vincke51 , Tamás Weidinger52 , Sophie Zechmeister-Boltenstern53 ,
Klaus Butterbach-Bahl18 , Eiko Nemitz3 , and Mark A. Sutton3
1 Institut National de la Recherche en Agriculture, Alimentation et Environnement (INRAE), UMR 1069 SAS,
65 rue de Saint-Brieuc, 35042 Rennes, France
2 Department of Environmental Engineering, Technical University of Denmark,

Bygningstorvet, 2800 Kgs. Lyngby, Denmark
3 UK Centre for Ecology and Hydrology (UK CEH), Bush Estate, Penicuik, EH26 0QB, UK
4 Wageningen University and Research, Environmental Systems Analysis Group, P.O. Box 47,

6700 AA Wageningen, the Netherlands
5 Department of Agricultural Sciences, Faculty of Agriculture and Forestry, Environmental Soil Science,

P.O. Box 56, 00014 University of Helsinki, Helsinki, Finland
6 Institute for Atmospheric and Earth System Research/Forest Sciences, Faculty of Agriculture and Forestry,

P.O. Box 27, 00014 University of Helsinki, Helsinki, Finland
7 Department of Environmental Systems Science, Institute of Agricultural Sciences, ETH Zurich, LFW C56,

Universitatstr. 2, 8092 Zurich, Switzerland
8 Institut National de la Recherche en Agriculture, Alimentation et Environnement (INRAE), BEF, 54000 Nancy, France
9 EMEP MSC-W, Norwegian Meteorological Institute, Oslo, Norway
10 Department of Space, Earth and Environment, Chalmers University of Technology, Gothenburg, Sweden
11 Ikerbasque Foundation and Basque Centre for Climate Change, Sede Building 1, Scientific Campus of the University of the

Basque Country, 48940, Leioa, Biscay, Spain
12 TERRA Teaching and Research Centre, Gembloux Agro-Bio Tech, University of Liège, Gembloux, Belgium
13 Bordeaux Sciences Agro, Institut National de la Recherche en Agriculture, Alimentation et Environnement (INRAE), UMR

ISPA, Villenave d’Ornon, 33140, France
14 Forest Services, Autonomous Province of Bolzano, Via Brennero 6, 39100 Bolzano, Italy
15 Faculty of Science and Technology, Free University of Bolzano, Piazza Università 5, 39100 Bolzano, Italy
16 Environment and Climate, Research Institute for Nature and Forest (INBO), Gaverstraat 35, 9500 Geraardsbergen, Belgium
17 Department of Biology, Centre of Excellence PLECO (Plant and Vegetation Ecology),

University of Antwerp, 2610 Wilrijk, Belgium

Published by Copernicus Publications on behalf of the European Geosciences Union.
1584                              C. R. Flechard et al.: Carbon–nitrogen interactions in European ecosystems – Part 1

18 Karlsruhe   Institute of Technology (KIT), Institute of Meteorology and Climate Research, Atmospheric
Environmental Research (IMK-IFU), Kreuzeckbahnstr. 19, 82467 Garmisch-Partenkirchen, Germany
19 Institute of Soil Science and Soil Conservation, iFZ Research Centre for Biosystems, Land Use and Nutrition,

Justus Liebig University Giessen, Heinrich-Buff-Ring 26–32, 35392 Giessen, Germany
20 University of Rennes, CNRS, UMR6553 ECOBIO, Campus de Beaulieu,

263 avenue du Général Leclerc, 35042 Rennes, France
21 Leibniz Centre for Agricultural Landscape Research (ZALF), Eberswalder Straße 84,

15374 Müncheberg, Germany
22 A.N. Severtsov Institute of Ecology and Evolution, Russian Academy of Sciences,

119071, Leninsky pr.33, Moscow, Russia
23 Department of Meteorology, Poznań University of Life Sciences, Piatkowska
                                                                         ˛        94, 60-649 Poznań, Poland
24 Department of Matter and Energy Fluxes, Global Change Research Centre, AS CR,

v.v.i. Belidla 986/4a, 603 00 Brno, Czech Republic
25 Department of Ecology and Environmental Protection, Laboratory of Bioclimatology,

Poznań University of Life Sciences, Piatkowska 94, 60-649 Poznań, Poland
26 Finnish Meteorological Institute, Climate System Research, PL 503, 00101, Helsinki, Finland
27 Ecologie Systématique Evolution, Univ. Paris-Sud, CNRS, AgroParisTech,

Université Paris-Saclay, 91400 Orsay, France
28 Weststrasse 5, 38162 Weddel, Germany
29 Air Quality Department, Meteorological and Hydrological Service, Gric 3, 10000 Zagreb, Croatia
30 TNO, Environmental Modelling, Sensing and Analysis, Petten, the Netherlands
31 Institut National de la Recherche en Agriculture, Alimentation et Environnement (INRAE), UMR1434 Silva, Site de Nancy,

Rue d’Amance, 54280 Champenoux, France
32 Greengrass – Atmospheric Environment Expert Ltd. fellowship, Kornélia utca 14/a, 2030 Érd, Hungary
33 Federal Research and Training Centre for Forests, Natural Hazards and Landscape,

Seckendorff-Gudent-Weg 8, 1131 Vienna, Austria
34 Wageningen University and Research, P.O. Box 47, 6700AA Wageningen, the Netherlands
35 Integrated Carbon Observation System (ICOS ERIC) Head Office, Erik Palménin aukio 1, 00560 Helsinki, Finland
36 Centro de Estudos Florestais, Instituto Superior de Agronomia, Universidade de Lisboa,

Tapada da Ajuda, 1349-017 Lisbon, Portugal
37 Institute for Atmospheric and Earth System Research/Physics, Faculty of Science,

P.O. Box 68, 00014 University of Helsinki, Helsinki, Finland
38 Gembloux Agro-Bio Tech, Axe Echanges Ecosystèmes Atmosphère, 8, Avenue de la Faculté, 5030 Gembloux, Belgium
39 Global Change Research Institute, Academy of Sciences, Bělidla 4a, 603 00 Brno, Czech Republic
40 National Research Council of Italy, Institute for Agriculture and Forestry Systems in the Mediterranean

(CNR-ISAFOM), Via Patacca, 85, 80056 Ercolano (NA), Italy
41 Department of Air Quality, Slovak Hydrometeorological Institute, Jeseniova 17, 83315 Bratislava, Slovakia
42 Institute for Geosciences and Environmental research (IGE), UMR 5001, Université Grenoble Alpes, CNRS, IRD,

Grenoble Institute of Technology, 38000 Grenoble, France
43 NRE, Oberwohlenstrasse 27, 3033 Wohlen bei Bern, Switzerland
44 CEFE, CNRS, Univ. Montpellier, Univ. Paul Valéry Montpellier 3, EPHE, IRD, Montpellier, France
45 Mechanical Engineering Department, Instituto Superior Técnico (Technical University of Lisbon),

Ave. Rovisco Pais, IST, 1049-001 Lisbon, Portugal
46 Fundación CEAM, C/Charles R. Darwin, 46980 Paterna (Valencia), Spain
47 Department of Plant and Environmental Sciences, Faculty of Science, University of Copenhagen,

Thorvaldsensvej 40, 1871 Frederiksberg C, Denmark
48 Laboratory of Functional Ecology and Global Change (ECOFUN), Forest Science and Technology Centre

of Catalonia (CTFC), Carretera de Sant Llorenç de Morunys, 25280 Solsona, Spain
49 Group GAMES & Department of Horticulture, Botany and Landscaping, School of Agrifood and Forestry Science

and Engineering, University of Lleida, Av. Rovira Roure 191, 25198 Lleida, Spain
50 Norsk institutt for luftforskning, Postboks 100, 2027 Kjeller, Norway
51 Earth and Life Institute (Environmental sciences), Université catholique de Louvain, Louvain-la-Neuve, Belgium
52 Department of Meteorology, Eötvös Loránd University, 1117 Budapest Pázmány Péter s. 1/A, Hungary
53 Department of Forest and Soil Sciences, Institute of Soil Research, University of Natural Resources

and Life Sciences Vienna, Peter Jordan Str. 82, 1190 Vienna, Austria

Biogeosciences, 17, 1583–1620, 2020                                               www.biogeosciences.net/17/1583/2020/
C. R. Flechard et al.: Carbon–nitrogen interactions in European ecosystems – Part 1                                          1585

Correspondence: Chris R. Flechard (christophe.flechard@inrae.fr)

Received: 22 August 2019 – Discussion started: 11 September 2019
Revised: 11 December 2019 – Accepted: 10 February 2020 – Published: 26 March 2020

Abstract. The impact of atmospheric reactive nitrogen (Nr )       organic Nr losses were also increasingly large, NEP levelled
deposition on carbon (C) sequestration in soils and biomass       off and then decreased. The apparent increase in NEP at low
of unfertilized, natural, semi-natural and forest ecosystems      to intermediate Ndep levels was partly the result of geograph-
has been much debated. Many previous results of this dC/dN        ical cross-correlations between Ndep and climate, indicating
response were based on changes in carbon stocks from pe-          that the actual mean dC/dN response at individual sites was
riodical soil and ecosystem inventories, associated with es-      significantly lower than would be suggested by a simple,
timates of Nr deposition obtained from large-scale chem-          straightforward regression of NEP vs. Ndep .
ical transport models. This study and a companion paper
(Flechard et al., 2020) strive to reduce uncertainties of N ef-
fects on C sequestration by linking multi-annual gross and
net ecosystem productivity estimates from 40 eddy covari-         1   Introduction
ance flux towers across Europe to local measurement-based
estimates of dry and wet Nr deposition from a dedicated col-      The global terrestrial net sink for atmospheric carbon diox-
located monitoring network. To identify possible ecological       ide (CO2 ) is approximately 1.7 Pg C yr−1 , i.e. roughly one-
drivers and processes affecting the interplay between C and       fifth of global CO2 -C emissions by fossil fuel combustion
Nr inputs and losses, these data were also combined with in       and industry (9.4 ± 0.5 Pg C yr−1 ). This corresponds to the
situ flux measurements of NO, N2 O and CH4 fluxes; soil           land-based carbon (C) uptake of 3.2 ± 0.8 Pg C yr−1 minus
NO− 3 leaching sampling; and results of soil incubation ex-       emissions from deforestation and other land-use changes of
periments for N and greenhouse gas (GHG) emissions, as            1.5 ± 0.7 Pg C yr−1 . The ocean sink is of the same order
well as surveys of available data from online databases and       (2.4 ± 0.5 Pg C yr−1 ), while twice as much CO2 -C (4.7 ±
from the literature, together with forest ecosystem (BAS-         0.02 Pg C yr−1 ) is added yearly to the atmosphere (Le Quéré
FOR) modelling.                                                   et al., 2018). Data from atmospheric CO2 inversion meth-
   Multi-year averages of net ecosystem productivity (NEP)        ods (e.g. Bousquet et al., 1999; Ciais et al., 2010), from na-
in forests ranged from −70 to 826 g C m−2 yr−1 at total           tional to global forest C inventory approaches (Goodale et al.,
wet + dry inorganic Nr deposition rates (Ndep ) of 0.3 to         2002; Pan et al., 2011) and from eddy covariance (EC) flux
4.3 g N m−2 yr−1 and from −4 to 361 g C m−2 yr−1 at Ndep          networks (Luyssaert et al., 2007) have suggested that a dom-
rates of 0.1 to 3.1 g N m−2 yr−1 in short semi-natural veg-       inant part of this terrestrial CO2 sink is currently occurring in
etation (moorlands, wetlands and unfertilized extensively         forests, and especially in boreal and temperate forests of the
managed grasslands). The GHG budgets of the forests were          Northern Hemisphere (Ciais et al., 2010; Pan et al., 2011).
strongly dominated by CO2 exchange, while CH4 and N2 O            Tropical forest areas are believed to be closer to carbon neu-
exchange comprised a larger proportion of the GHG balance         tral (Pan et al., 2011), or even a net C source globally (Bac-
in short semi-natural vegetation. Uncertainties in elemental      cini et al., 2017), due to emissions from deforestation, forest
budgets were much larger for nitrogen than carbon, espe-          degradation and land-use change offsetting their sink poten-
cially at sites with elevated Ndep where Nr leaching losses       tial. However, others (Stephens et al., 2007) have argued that
were also very large, and compounded by the lack of reli-         the tropical land CO2 sink may be stronger – and the north-
able data on organic nitrogen and N2 losses by denitrifica-       ern hemispheric land CO2 sink weaker – than was generally
tion. Nitrogen losses in the form of NO, N2 O and especially      believed. At the European scale, Schulze et al. (2010) calcu-
NO− 3 were on average 27 % (range 6 %–54 %) of Ndep at sites      lated that the net biome productivity (NBP, the mean long-
with Ndep < 1 g N m−2 yr−1 versus 65 % (range 35 %–85 %)          term carbon sink at a large spatial scale) of temperate and
for Ndep > 3 g N m−2 yr−1 . Such large levels of Nr loss likely   boreal forests was 81 % of the total continental-scale land
indicate that different stages of N saturation occurred at a      sink.
number of sites. The joint analysis of the C and N budgets           The large European and North American CO2 sinks have
provided further hints that N saturation could be detected in     been attributed to a combination of factors including af-
altered patterns of forest growth. Net ecosystem productiv-       forestation of abandoned land and formerly cut forests, re-
ity increased with Nr deposition up to 2–2.5 g N m−2 yr−1 ,       duced forest harvest, CO2 fertilization, changes in manage-
with large scatter associated with a wide range in carbon se-     ment and age structure legacy effects in Europe (Vilén et
questration efficiency (CSE, defined as the NEP / GPP ra-         al., 2016), and atmospheric reactive nitrogen (Nr ) deposition
tio). At elevated Ndep levels (> 2.5 g N m−2 yr−1 ), where in-    (Reay et al., 2008; Ciais et al., 2013, and references therein;

www.biogeosciences.net/17/1583/2020/                                                     Biogeosciences, 17, 1583–1620, 2020
1586                                  C. R. Flechard et al.: Carbon–nitrogen interactions in European ecosystems – Part 1

De Vries et al., 2017). However, some studies (Nadelhoffer            Additionally, nitrogen losses may significantly offset at-
et al., 1999; Gundale et al., 2014; Fernández-Martínez et al.,     mospheric Nr inputs at eutrophicated and acidified sites, with
2017) have questioned the widespread theory that elevated          the consequence that dC/dN may correlate better with net,
Nr deposition boosts forest C sequestration, and the magni-        rather than gross, atmospheric Nr inputs. Depending espe-
tude of the N fertilization effect on forest C sequestration has   cially on the extent of ecosystem N saturation (De Schri-
been a matter of much debate (Magnani et al., 2007, 2008;          jver et al., 2008), substantial N losses may occur in the form
Högberg, 2007; De Schrijver et al., 2008; de Vries et al.,         of nitrate (NO− 3 ) leaching (Dise et al., 2009), nitric oxide
2008; Sutton et al., 2008; Dezi et al., 2010; Binkley and Hög-     (NO) and nitrous oxide (N2 O) emissions (Pilegaard et al.,
berg, 2016). A better understanding of the impact of nitrogen      2006); ammonia (NH3 ) bidirectional exchange (Hansen et
deposition on natural and semi-natural ecosystems, in partic-      al., 2013); and emissions of di-nitrogen (N2 ) from total den-
ular over forests, and the impact on the carbon and nitrogen       itrification (Butterbach-Bahl et al., 2002) (Fig. 1). The im-
cycles as an indirect effect resulting from anthropogenic ac-      plication is that the carbon response to Ndep would be non-
tivities (Canadell et al., 2007) remains key to improving the      linear, with larger dC/dN at low Ndep rates and a lower-
forecast of regional (de Vries et al., 2017) and global (Du and    ing of dC/dN as Ndep increases, as suggested in the review
de Vries, 2018) models.                                            by Butterbach-Bahl and Gundersen (2011) and further elab-
   The relevance of Nr deposition for the global C seques-         orated in De Vries et al. (2014). The latter authors show
tration potential, or more explicitly the dC/dN response           in their review that above a certain N deposition level, the
(change in C storage with change in Nr deposition), has            dC/dN response declines due to adverse effects of excess
been estimated typically through meta-analyses of Nr addi-         Nr deposition and high soil ammonium (NH+         4 ) concentra-
tion experiments (e.g. Schulte-Uebbing and de Vries, 2018),        tion and nitrification (e.g. acidification, nutrient base cation
or by combining forest growth inventories, together with esti-     losses, aluminium mobility), which are known to reduce soil
mates of Nr deposition obtained from large-scale forest mon-       fertility and affect ecosystem health and functioning (Aber,
itoring plots (Solberg et al., 2009; Laubhann et al., 2009;        1992).
De Vries et al., 2008). Both methods have many sources                Carbon losses through dissolved organic carbon (DOC)
of uncertainty. One key difficulty in the latter approach lies     and biogenic dissolved inorganic carbon (DIC) leaching can
in estimating total (wet + dry) Nr deposition (Ndep ), espe-       also be significant, especially for wetlands (Dinsmore et al.,
cially dry deposition, which is highly variable spatially, very    2010) and also grassland and cropland ecosystems (Kindler
challenging to measure and consequently hard to parame-            et al., 2011; Gielen et al., 2011). This is relevant for the net
terize in regional-scale chemical transport models (CTMs)          ecosystem carbon balance (NECB) or the net biome produc-
(Flechard et al., 2011; Simpson et al., 2014; Schwede et al.,      tivity (NBP) estimates obtained on the basis of EC flux sys-
2018). The annual or long-term dry deposition component            tems and needs to be accounted for as a part of the net ecosys-
of Ndep to forests, in all the diversity of N-containing forms     tem productivity (NEP) that is not actually stored in the sys-
(gaseous vs. aerosol, reduced vs. oxidized, inorganic vs. or-      tem (Chapin et al., 2006; Schulze et al., 2010) (Fig. 1). Dis-
ganic, e.g. Zhang et al., 2009), has been actually measured        solved and/or emitted methane (CH4 ) may further represent
(by micrometeorological methods) in very few forests world-        a significant loss from organic soils (Hendriks et al., 2007),
wide (Neirynck et al., 2007; Erisman et al., 1996). Due to         while CH4 oxidation, which is often observed in well-aerated
the large diversity of atmospheric compounds that contribute       soils and can be suppressed by Nr addition, especially NH+     4
to total Nr and the complexity of the measurement tech-            (Steudler et al., 1989), may affect the net greenhouse gas
niques required for each compound (Flechard et al., 2011),         (GHG) budget. Nitrogen-deposition-induced N2 O emissions
it is even debatable that complete measurements of all Nr          from the forest floor (Pilegaard et al., 2006; Liu and Greaver,
deposition terms have ever been achieved anywhere. Thus            2009), or from denitrification triggered by deposited NO−   3 in
virtually all studies of the forest dC/dN response so far have     peatland (Francez et al., 2011), can also offset the gain in the
relied on modelled atmospheric Nr deposition estimates, at         ecosystem GHG balance resulting from a hypothetical nitro-
least for the dry and occult deposition fractions, and further     gen fertilization effect.
the Nr deposition data being used were systematically pro-            Nitrogen deposition or addition is known to affect soil
vided by the outputs of large-scale regional (e.g. Sutton et       microbial C cycling in many different ways, for example
al., 2008; Fernández-Martínez et al., 2017) or even global         high-level N enrichment generally leading to reduced micro-
(Fleischer et al., 2013) models, with resolutions of typically     bial biomass and suppressed soil CO2 respiration (Treseder,
10 km × 10 km or 1◦ × 1◦ , respectively. Grid averaging in         2008); a reduction of basal respiration without significant de-
such large-scale models introduces a large uncertainty in lo-      cline in total microbial biomass, following N addition to in-
cal (ecosystem-scale) Nr dry deposition rates (Schwede et al.,     cubated peat cores (Francez et al., 2011); and added NO−   3 al-
2018), particularly when the forest sites are located near agri-   tering directly the oxidative enzyme production by microbial
cultural or industrial Nr sources (Loubet et al., 2009; Fowler     communities and hence controlling extracellular enzyme ac-
et al., 1998).                                                     tivity (Waldrop and Zak, 2006). Nitrate addition can lead to
                                                                   a reduction in CH4 emissions from wetlands and peatlands

Biogeosciences, 17, 1583–1620, 2020                                                     www.biogeosciences.net/17/1583/2020/
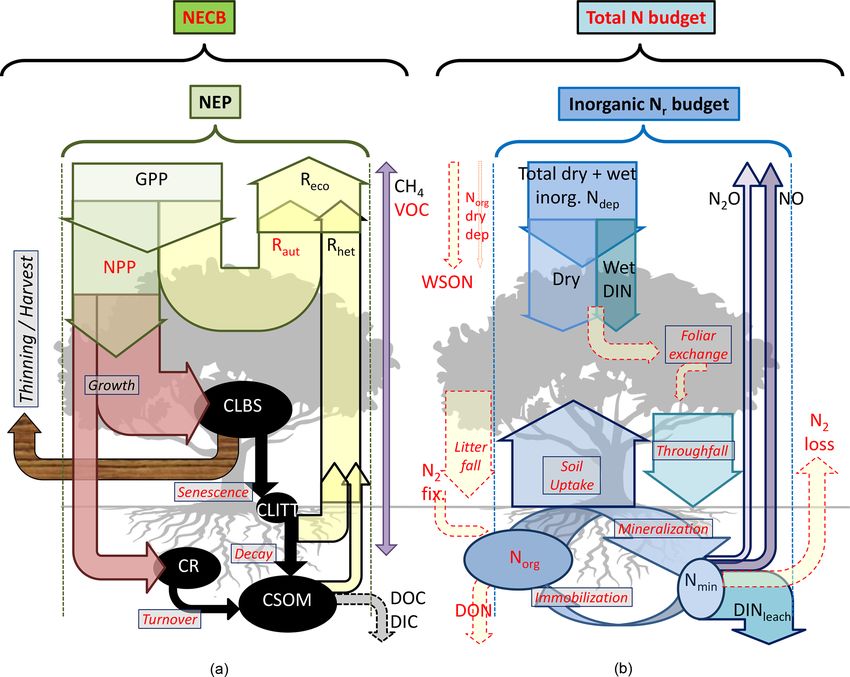
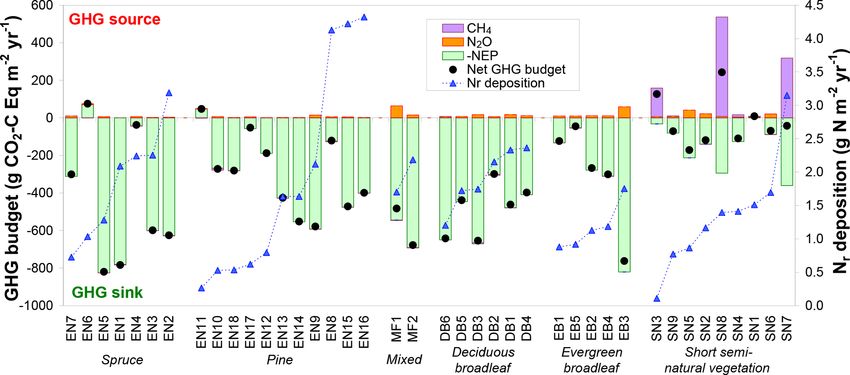
C. R. Flechard et al.: Carbon–nitrogen interactions in European ecosystems – Part 1                                                       1587

Figure 1. Flux terms and boundaries of the carbon (a) and nitrogen (b) budgets discussed in this paper. Net ecosystem productivity
NEP = GPP − Reco (≈ NPP − Rhet ) based on multi-annual eddy covariance CO2 flux data. The net ecosystem carbon balance (NECB)
includes in addition other C loss fluxes such as DIC/DOC, CH4 and VOC, as well as harvest, thinning or other disturbances (e.g. fire). In-
organic reactive nitrogen (Nr ) budget = Ndep − DINleach − NO − N2 O. The total N budget includes in addition organic nitrogen deposition
(WSON) and leaching (DON), as well as N2 inputs and losses from biological fixation and denitrification, respectively. CLBS, CSOM, CR,
CLITT: carbon stocks in leaves, branches and stems; in soil organic matter; in roots; and in litter layers, respectively. Terms highlighted in
red indicate that direct or measurement-based estimates were not available for some or all sites in our datasets (see also Table 2 for a list of
acronyms, Table 3 for a summary of methods and Table S6 for data availability).

(Francez et al., 2011), since in anaerobic conditions and in              net GHG budgets. Ideally, all C and N gain and loss pathways
the presence of NO−   3 as an electron acceptor, denitrifying             (including infrequently or rarely measured fluxes such as Nr
bacteria can oxidize organic C substrates (e.g. acetate) and              dry deposition, organic C and N leaching fluxes, and GHG
thus outcompete methanogenic communities (Boone, 1991).                   fluxes; see Fig. 1) should be quantified at long-term exper-
However, if chronic N enrichment of peatland ecosystems                   imental sites to improve and calibrate process-based mod-
leads to floristic changes, especially an increase in vascular            els. Closing the C and N budgets experimentally at each site
plants at the expense of bryophytes, the net effect may be                of large (e.g. FLUXNET) monitoring networks is unlikely
an increase in CH4 emissions (Nykänen et al., 2002), as the               to occur in the near future, but realistic and cost-effective
aerenchyma of tracheophytes provides a direct diffusion path              measurement approaches can be used to progressively re-
to the atmosphere for soil-produced CH4 , bypassing oxida-                duce the uncertainties for the large terms of the budgets.
tion in the peat by methanotrophs. Excess-nitrogen-induced                Such approaches were tested and implemented in this study,
vegetation composition changes in Sphagnum moss peatland                  as part of a large-scale effort, within the NitroEurope Inte-
are believed to reduce C sequestration potentials, and the ef-            grated Project (NEU, 2013; Sutton and Reis, 2011), to quan-
fect is likely to be exacerbated by climate change (Limpens               tify Nr deposition and N losses from ecosystems, in paral-
et al., 2011).                                                            lel and coordinated with the CarboEurope Integrated Project
   This complex web of interactions between the C and N cy-               (CEIP, 2011) to estimate the net C and GHG balance, for for-
cles and losses shows the need for integrated approaches for              est and semi-natural ecosystems in Europe.
studying the impacts of Nr deposition on C sequestration and

www.biogeosciences.net/17/1583/2020/                                                                Biogeosciences, 17, 1583–1620, 2020

1588                                 C. R. Flechard et al.: Carbon–nitrogen interactions in European ecosystems – Part 1

   A main objective of this paper is to build tentative C, N      ranean evergreen broadleaf (EB). Forest species composi-
and GHG budgets, as well as analyse C–N interactions em-          tion, stand characteristics, C and N contents of different
pirically, for a wide range of European monitoring sites, by      ecosystem compartments (leaves, wood, soil), soil physi-
using measurements or observation-based data as far as pos-       cal properties and micro-climatological characteristics are
sible, complemented by modelling. Important methodologi-          described in Tables S2–S5. Semi-natural short vegetation
cal goals are to critically examine uncertainties in measure-     ecosystems included unimproved (mountainous and semi-
ment methods and elemental budgets, to identify knowledge         arid) grasslands, wetlands and peatlands; they are included
and data gaps, and to assess the current state of process un-     in the study as unfertilized, C-rich soil systems, providing a
derstanding as encoded in models. To this end, we compiled        contrast with forests where storage also occurs above ground
the C, N and GHG flux data from NEU, CEIP and other com-          (thus with different C/N ratios). Among the 40 EC-CO2 flux
plementary datasets, using a combination of in situ measure-      measurement stations, most sites (36) were part of the CEIP
ments, empirical relationships, ecosystem modelling, litera-      CO2 flux network. A further three CO2 flux sites were op-
ture and database surveys, at the scale of the CEIP and NEU       erated as part of the NEU network (EN2, EN16, and SN3),
flux monitoring networks. This study presents the method-         and one site (DB4) was included from the French F-ORE-T
ologies and discusses the different terms of the budgets, in-     observation network (F-ORE-T, 2012). Table S6 provides an
cluding atmospheric deposition from gas, aerosol and pre-         overview of the available C, N and GHG flux measurements,
cipitation Nr concentration monitoring, soil NO−   3 leaching     detailed hereafter.
measurements and modelling, GHG and Nr emission es-
timates from chamber measurements and laboratory-based            2.2     Nitrogen fluxes
soil bioassays, EC-tower-based C budgets, and historical
published data. Forest ecosystem modelling (BASFOR) is            Input and output fluxes of the ecosystem nitrogen and carbon
used to simulate C, N and GHG fluxes, with the double ob-         budgets are represented schematically in Fig. 1. The follow-
jective to compare with actual measurements and to fill some      ing sections describe the methods used to quantify the differ-
gaps in the datasets. Wherever possible, alternative measure-     ent terms, summarized in Table 3.
ments, datasets or modelled data are shown alongside the pri-
mary data in order to provide an estimate of the uncertainty in   2.2.1    Atmospheric deposition
the different terms. In the companion paper (Flechard et al.,
2020), the response of C sequestration to Ndep is quantified      To obtain realistic estimates of total (dry + wet) Nr deposi-
using the same datasets.                                          tion at the 40 sites of the network, it was necessary to mea-
                                                                  sure ambient air concentrations of the main N-containing
                                                                  chemical species at each location, due to the large spatial het-
2     Materials and methods                                       erogeneity in gas-phase concentrations, especially for NH3 .
                                                                  The requirement for local measurements of wet deposition
2.1    Monitoring sites                                           was relaxed because this is much less spatially variable. For
                                                                  both dry and wet components, measurements had to be com-
The study comprised 40 terrestrial ecosystem-scale, car-          plemented by models, either to calculate fluxes based on lo-
bon and nitrogen flux monitoring sites, including 31 forests      cal concentration data at each site or to obtain local estimates
(F) and nine natural or semi-natural (SN) short vegeta-           from a large-scale CTM when data were missing.
tion ecosystems, primarily moorlands, wetlands and exten-            Atmospheric inorganic Nr concentrations, available from
sively managed, unfertilized grasslands (Table 1). The sites      the NEU (2013) database, were measured monthly for 2–
spanned a European geographical and climatic gradient from        4 years in the gas phase (NH3 , HNO3 , HONO) and in
the Mediterranean to the Arctic and from the Atlantic to          the aerosol phase (NH+          −
                                                                                           4 , NO3 ), using DEnuder for Long-
western Russia (Fig. S1 in the Supplement), an elevation          Term Atmospheric sampling (DELTA) systems (Sutton et al.,
range of −2 m to 1765 m a.m.s.l., a mean annual temperature       2001; Tang et al., 2009). Concentrations of nitrogen diox-
(MAT) range of −1.0 to 17.6 ◦ C, and a mean annual precip-        ide (NO2 ), not covered by DELTA sampling, were mea-
itation (MAP) range of 500 to 1365 mm. Selected references        sured by chemiluminescence at a few sites only and were
are provided for each site in Table S1 in the Supplement. A       otherwise taken from gridded concentration outputs of the
list of the main acronyms and abbreviations used in the paper     European-scale EMEP CTM (details given below). The Nr
is provided in Table 2.                                           data initially reported in Flechard et al. (2011) covered the
   The forest sites of the study ranged from very young (< 10     first 2 years of the NEU project (2007–2008); here, the data
years old) to mature (> 150 years old) and can be broadly         from the entire 4-year NEU monitoring period (2007–2010)
classified into four plant functional types (PFTs) or five dom-   were used and averaged to provide a more robust long-term
inant tree categories (Table 1): deciduous broadleaf (DB), ev-    4-year estimate of Nr dry deposition. The inferential mod-
ergreen needleleaf (EN, comprising mostly spruce and pine         elling method was used to calculate dry deposition for N-
species), mixed deciduous–coniferous (MF), and Mediter-           containing gas and aerosol species, whereby measured am-

Biogeosciences, 17, 1583–1620, 2020                                                    www.biogeosciences.net/17/1583/2020/
Table 1. Overview of ecosystem and climatic characteristics and inter-annual mean ecosystem–atmosphere exchange fluxes for forest and semi-natural short vegetation sites.
Site Site name, PFTa Dominant Forest age Hmax b LAImax c Lat. Long. Elevationd MATe MAPf Ndep g GPPh Reco i NEPj
acronym country short name vegetation (2010) (m) (m2 m−2 ) (◦ N) (◦ E) (m a.s.l.) (◦ C) (mm) (g N m−2 yr−1 ) (g C m−2 yr−1 ) (g C m−2 yr−1 ) (g C m−2 yr−1 )
DE-Hai Hainich, Germany DB1 Fagus sylvatica 142 23 4.0 51.079 10.452 430 8.4 775 2.3 1553 1074 479
DK-Sor Sorø, Denmark DB2 Fagus sylvatica 91 31 4.6 55.487 11.646 40 8.9 730 2.2 1883 1581 301
FR-Fon Fontainebleau-Barbeau, France DB3 Quercus petraea 111 28 5.1 48.476 2.780 92 11.0 690 1.7 1850 1185 665
FR-Fgs Fougères, France DB4 Fagus sylvatica 41 20 6.0 48.383 −1.185 140 10.3 900 2.4 1725 1316 409
FR-Hes Hesse, France DB5 Fagus sylvatica 45 16 6.7 48.674 7.066 300 10.2 975 1.7 1634 1187 446
IT-Col Collelongo, Italy DB6 Fagus sylvatica 120 22 5.7 41.849 13.588 1560 7.2 1140 1.2 1425 776 650
www.biogeosciences.net/17/1583/2020/
CZ-BK1 Bily Kriz, Czech Rep. EN1 Picea abies 33 13 9.8 49.503 18.538 908 7.8 1200 2.1 1548 767 781
DE-Hoe Höglwald, Germany EN2 Picea abies 104 35 6.3 48.300 11.100 540 8.9 870 3.2 1856 1229 627
DE-Tha Tharandt, Germany EN3 Picea abies 120 27 6.7 50.964 13.567 380 8.8 820 2.3 1997 1396 601
DE-Wet Wetzstein, Germany EN4 Picea abies 56 22 7.1 50.453 11.458 785 6.6 950 2.2 1809 1767 43
IT-Ren Renon, Italy EN5 Picea abies 111 29 5.1 46.588 11.435 1730 4.6 1010 1.3 1353 528 826
RU-Fyo Fyodorovskoye, Russia EN6 Picea abies 190 21 2.8 56.462 32.922 265 5.3 711 1.0 1488 1559 −70
UK-Gri Griffin, UK EN7 Picea sitchensis 29 12 6.5 56.617 −3.800 340 7.7 1200 0.7 989 677 311
BE-Bra Brasschaat, Belgium EN8 Pinus sylvestris 82 21 1.9 51.309 4.521 16 10.8 850 4.1 1272 1149 123
ES-ES1 El Saler, Spain EN9 Pinus halepensis 111 10 2.6 39.346 −0.319 5 17.6 551 2.1 1552 960 593
FI-Hyy Hyytiälä, Finland EN10 Pinus sylvestris 48 18 3.4 61.848 24.295 181 3.8 709 0.5 1114 845 268
FI-Sod Sodankylä, Finland EN11 Pinus sylvestris 100 13 1.2 67.362 26.638 180 −0.4 527 0.3 551 598 −47
FR-Bil Bilos, France EN12 Pinus pinaster 9 4 0.5 44.522 −0.896 50 12.4 930 0.8 1178 989 189
FR-LBr Le Bray, France EN13 Pinus pinaster 41 22 1.9 44.717 −0.769 61 12.9 972 1.6 1906 1479 427
IT-SRo San Rossore, Italy EN14 Pinus pinaster 61 18 4.0 43.728 10.284 4 14.9 920 1.6 2256 1702 554
NL-Loo Loobos, Netherlands EN15 Pinus sylvestris 101 18 1.5 52.168 5.744 25 10.0 786 4.2 1617 1141 476
NL-Spe Speulderbos, Netherlands EN16 Pseudotsuga menziesii 51 32 7.5 52.252 5.691 52 10.0 834 4.3 1416 1015 401
SE-Nor Norunda, Sweden EN17 Pinus sylvestris 112 28 4.6 60.083 17.467 45 6.8 527 0.6 1414 1356 58
SE-Sk2 Skyttorp, Sweden EN18 Pinus sylvestris 39 16 3.2 60.129 17.840 55 7.4 527 0.5 1235 953 282
ES-LMa Las Majadas, Spain EB1 Quercus ilex 111 8 0.6 39.941 −5.773 258 16.1 528 0.9 1091 958 133
FR-Pue Puéchabon, France EB2 Quercus ilex 69 6 2.9 43.741 3.596 270 13.7 872 1.1 1309 1030 279
IT-Ro2 Roccarespampani, Italy EB3 Quercus cerris 21 16 3.8 42.390 11.921 224 15.7 876 1.8 1707 886 821
PT-Esp Espirra, Portugal EB4 Eucalyptus globulus 25 20 2.7 38.639 −8.602 95 16.1 709 1.2 1473 1163 311
PT-Mi1 Mitra, Portugal EB5 Quercus ilex, Quercus suber 91 8 3.4 38.541 −8.000 264 14.5 665 0.9 870 817 53
BE-Vie Vielsalm, Belgium MF1 Fagus sylvatica, Pseudotsuga menziesii 86 30 5.1 50.305 5.997 450 8.1 1000 1.7 1792 1247 545
CH-Lae Lägeren, Switzerland MF2 Fagus sylvatica, Picea abies 111 30 3.6 47.478 8.365 689 7.7 1100 2.2 1448 757 692
DE-Meh Mehrstedt, Germany SN1 Afforested grassland n/a 0.5 2.9 51.276 10.657 293 9.1 547 1.5 1171 1175 −4
ES-VDA Vall d’Alinya, Spain SN2 Upland grassland n/a 0.1 1.4 42.152 1.448 1765 6.4 1064 1.2 669 528 140
C. R. Flechard et al.: Carbon–nitrogen interactions in European ecosystems – Part 1
FI-Lom Lompolojänkkä, Finland SN3 Peatland n/a 0.4 1.0 67.998 24.209 269 −1.0 521 0.1 377 345 32
HU-Bug Bugac, Hungary SN4 Semi-arid grassland n/a 0.5 4.7 46.692 19.602 111 10.7 500 1.4 1044 918 126
IT-Amp Amplero, Italy SN5 Upland grassland n/a 0.4 2.5 41.904 13.605 884 9.8 1365 0.9 1241 1028 213
IT-MBo Monte Bondone, Italy SN6 Upland grassland n/a 0.3 2.5 46.029 11.083 1550 5.1 1189 1.7 1435 1347 89
NL-Hor Horstemeer, Netherlands SN7 Peatland n/a 2.5 6.9 52.029 5.068 −2 10.8 800 3.1 1584 1224 361
PL-wet POLWET/Rzecin, Poland SN8 Wetland (reeds, sedges, mosses) n/a 2.1 4.9 52.762 16.309 54 8.5 550 1.4 937 642 295
UK-AMo Auchencorth Moss, UK SN9 Peatland n/a 0.6 2.1 55.792 −3.239 270 7.6 1165 0.8 786 705 81
a PFT (plant functional types): DB – deciduous broadleaf forest; EN – evergreen needleleaf coniferous forest; EB – evergreen broadleaf Mediterranean forest; MF – mixed deciduous–coniferous forest; SN – short semi-natural, including moorland, peatland, shrubland and unimproved/upland grassland. b Maximum canopy height. c Maximum leaf
area index, defined as one-sided or half of the total. d Above mean sea level. e Mean annual temperature. f Mean annual precipitation. g Nitrogen deposition. h Gross primary productivity. i Ecosystem respiration. j Net ecosystem productivity. n/a: not applicable.
Biogeosciences, 17, 1583–1620, 2020
1589
1590                                  C. R. Flechard et al.: Carbon–nitrogen interactions in European ecosystems – Part 1

Table 2. Main acronyms and abbreviations used in the study.

   Carbon fluxes and stocks
   NEE                               Net ecosystem exchange
   GPP                               Gross primary productivity
   NPP                               Net primary productivity
   NEP                               Net ecosystem productivity
   NECB                              Net ecosystem carbon balance
   NBP                               Net biome productivity
   Reco                              Ecosystem respiration
   Raut                              Autotrophic respiration
   Rhet                              Heterotrophic respiration
   Rsoil                             Soil (heterotrophic and rhizospheric) respiration
   SCE                               Soil CO2 efflux measured by chamber methods
   CSEobs , CSEmod                   Carbon sequestration efficiency, calculated from EC observations or by modelling
   SOM                               Soil organic matter
   CSOM                              Carbon stock in soil organic matter
   CR                                Carbon stock in roots
   CLITT                             Carbon stock in litter layers of the forest floor
   CLBS                              Carbon stock in leaves, branches and stems
   LeafC                             Leaf carbon content
   DIC, DOC                          Dissolved inorganic or organic carbon
   dC/dN, dNEP/dNdep                 Response (slope) of ecosystem C productivity versus atmospheric Nr deposition
   Nitrogen fluxes and stocks
   Ndep                              Total (wet + dry) atmospheric reactive nitrogen deposition
   Nr                                Reactive nitrogen
   Nmin , Norg                       Mineral or organic reactive nitrogen forms
   LeafN                             Leaf nitrogen content
   DIN, DON                          Dissolved inorganic or organic nitrogen
   DINTF                             Throughfall inorganic Nr deposition
   WSON                              Wet deposition of water-soluble organic nitrogen
   Water budget terms
   SWC                               Soil water content
   WFPS                              Water-filled pore space
   ET                                Evapotranspiration
   Ecosystem characteristics
   PFT                               Plant functional type
   ENF                               Evergreen needleleaf forest
   DBF                               Deciduous broadleaf forest
   MF                                Mixed (needleleaf–broadleaf) forest
   EBF                               Evergreen broadleaf forest
   SN                                Short semi-natural vegetation
   H                                 Canopy height
   DBH                               Tree diameter at breast height (forests)
   LAI                               Leaf area index
   SD                                Stand density (forests): number of trees per unit area
   MAT                               Mean annual temperature
   MAP                               Mean annual precipitation
   Methods and general terminology
   EC                                Eddy covariance
   DELTA                             DEnuder for Long-Term Atmospheric sampling
   BASFOR                            BASic FORest ecosystem model
   CTM                               Chemical transport model
   EMEP                              European Monitoring and Evaluation Programme (http://www.emep.int, last access: 22 August 2019)
   GHG                               Greenhouse gas
   GWP                               Global warming potential
   CEIP                              CarboEurope Integrated Project
   NEU                               NitroEurope Integrated Project
   FLUXNET                           Worldwide carbon flux monitoring network

Biogeosciences, 17, 1583–1620, 2020                                                               www.biogeosciences.net/17/1583/2020/
C. R. Flechard et al.: Carbon–nitrogen interactions in European ecosystems – Part 1                                                                                              1591

Table 3. Summary of the main methods used to quantify carbon, nitrogen, and greenhouse gas fluxes and budgets for the 31 forests and nine
short semi-natural vegetation sites included in this study. Horizontal bars (green: forests; blue: short semi-natural vegetation) indicate the
percentage of study sites with available data (filled bars) or without available data (open bars). See also Tables S6–S7 for details at individual
sites.

1 Aubinet et al. (2000). 2 Dämmgen (2006). 3 Dinsmore et al. (2010). 4 Dise et al. (2009). 5 Flechard et al. (2011). 6 Gielen et al. (2011). 7 Hendriks et al. (2007). 8 Ilvesniemi et
al. (2009). 9 Kindler et al. (2011). 10 Kowalska et al. (2013). 11 Legout et al. (2016). 12 Luo et al. (2012). 13 Pilegaard et al. (2006). 14 REddyProc (2019). 15 Schaufler et al. (2010).
16 Simpson et al. (2012). 17 Tang et al. (2009). 18 van Oijen et al. (2005). 19 See Table S7.

bient Nr concentrations were multiplied by a vegetation-                                        wet deposition of water-soluble organic compounds (see be-
, meteorology- and chemical-species-dependent deposition                                        low).
velocity (Vd ) (Flechard et al., 2011, 2013; Bertolini et al.,                                     For wet deposition, several sources of data were used, and
2016; Thimonier et al., 2018). In the case of NH3 , a canopy                                    the final wet deposition estimate was derived from the arith-
compensation point scheme was applied in some models, al-                                       metic mean of the different sources, where available. First,
lowing bidirectional exchange between the surface and the                                       within the NEU project, a survey was made of the available
atmosphere. Considering notoriously large uncertainties in                                      national and/or transnational (e.g. EMEP, 2013; ICP, 2019)
deposition velocities and large discrepancies between the                                       wet deposition monitoring network concentration data for in-
surface exchange schemes currently used in different CTMs,                                      organic N (NH+          −
                                                                                                                4 , NO3 ) in the different European countries
we tried here to minimize such uncertainties by using the                                       hosting one or several CEIP/NEU flux sites. These data were
ensemble average dry deposition predicted by four different                                     checked for consistency and outliers, harmonized, and then
models, as in Flechard et al. (2011).                                                           spatially interpolated by kriging to provide measurement-
   The dry deposition of atmospheric organic Nr (ON)                                            based estimates of solute concentrations in rainfall for each
species not accounted for by the EMEP model (e.g. amines,                                       of the 40 sites of this study. Wet deposition was then calcu-
urea), and not included in DELTA measurements, can con-                                         lated as the product of interpolated concentration times mea-
tribute a fraction of total Nr deposition. However, Kanakidou                                   sured precipitation at each site.
et al. (2016) suggest that particulate ON largely dominates                                        Next, 13 sites (DB1, DB3, DB4, EN4, EN9, EN13, EN14,
the atmospheric ON load, and for particles the main atmo-                                       EB2, EB3, MF1, MF2, SN3, SN8) were identified as lack-
spheric removal mechanism is through precipitation. Thus,                                       ing local or nearby wet deposition measurements. These sites
dry deposition of ON is expected to be much smaller than                                        were equipped for three years (2008–2010) with bulk (open

www.biogeosciences.net/17/1583/2020/                                                                                             Biogeosciences, 17, 1583–1620, 2020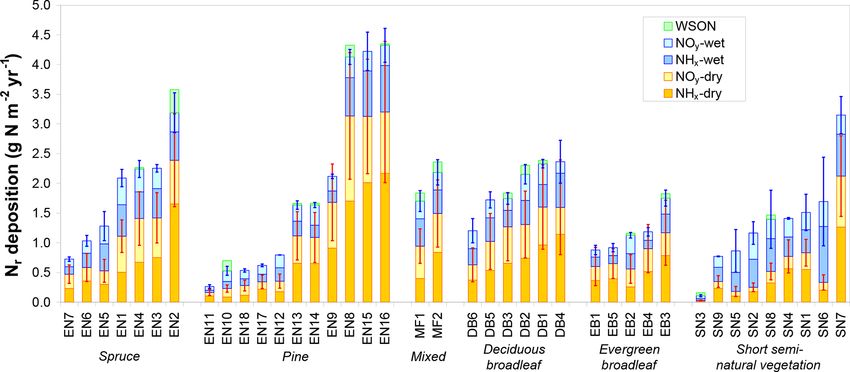
1592                                 C. R. Flechard et al.: Carbon–nitrogen interactions in European ecosystems – Part 1

funnel) precipitation samplers (Model B, Rotenkamp, Ger-          were available for N2 O at seven forest sites and four semi-
many; Dämmgen, 2006), mounted above the canopy or inside          natural sites, as well as at five forest sites for NO (Table S6).
a clearing for some of the forest sites, with monthly sample      Manual static chamber N2 O measurements were made man-
change and analysis. The precipitation samples were stabi-        ually at a typically fortnightly (growing season) or monthly
lized by addition of thymol at the beginning of each expo-        (winter half-year) frequency at many sites. Automatic cham-
sure period and were analysed subsequently for inorganic Nr       ber systems, allowing continuous N2 O measurements at a
                                  2−           3−
(NH+            −                       −
     4 and NO3 ) as well as SO4 , Cl , PO4 , base cations         frequency of four times per day, were deployed at EN2,
     2+      2+   +     +
(Mg , Ca , K , Na ) and pH. A few other sites (EN2,               EN10, DB2 and SN3. Fluxes of NO were only measured by
EN8, EN10, EN16, DB2, SN9) were already equipped with             automatic dynamic (open) chambers. Measured fluxes were
wet-only or bulk precipitation collectors. No correction was      scaled up to yearly values by linear interpolation or using
applied to the bulk deposition estimates to account for a pos-    the arithmetic mean of all flux measurements. There may be
sible contribution by dry deposition within the sampler glass     considerable uncertainty in the annual flux if gap-filling is
funnel (e.g. Dämmgen et al., 2005), since there did not ap-       based on linear interpolation between discrete values, when
pear to be any systematic overestimation compared with wet        flux measurements are made manually and are therefore dis-
deposition estimates from the monitoring networks or EMEP         continuous and infrequent (Parkin, 2008). This is due to the
data (see Results and Fig. S2), even if a more significant bias   episodic nature and log-normal distribution of NO and N2 O
may be expected in dry (Mediterranean) regions.                   emissions, observed particularly in fertilized croplands and
   In addition to inorganic nitrogen, the wet deposition of       grasslands. However, this episodicity is less pronounced in
water-soluble organic Nr (WSON) compounds was also in-            semi-natural ecosystems, or at least the magnitude of the
vestigated in precipitation samples at 16 sites (Cape et al.,     episodic fluxes is generally much smaller than in fertilized
2012). However, since WSON data were not available for            agro-systems (Barton et al., 2015). The uncertainty in annual
all sites and the measurements were subject to considerable       emissions estimated in our study from manual chamber mea-
uncertainties (Cape et al., 2012), and also because the contri-   surements is related to the observation frequency (fortnightly
bution of WSON to total Nr deposition was on average less         or monthly) and is likely larger than in the case of automatic
than 5 %, WSON was not included in the final estimates of         (continuous) chamber measurements.
total Nr deposition.                                                  Direct in situ Nr and non-CO2 GHG gas flux measure-
   The last data source was the ca. 50 km × 50 km gridded         ments were unavailable at many sites. These soil N2 O and
modelled wet inorganic Nr deposition (also NO2 concen-            NO (and also CH4 ) fluxes were therefore also estimated, as
trations, discussed above), simulated by the European-scale       part of NEU, from empirical temperature and moisture re-
EMEP CTM (Simpson et al., 2006a, b, 2012, 2014) for the           sponses of soils. These responses were established in a series
years 2007–2010, available from EMEP (2013). The data             of factorial soil incubation experiments in controlled condi-
were downloaded in 2013, and it should be noted that in this      tions with four levels of temperature (5–20 ◦ C) and water-
data series different model versions were used for the differ-    filled pore space (20–80 WFPS %), following the protocol
ent years. This leads to some uncertainty, especially in the      described in Schaufler et al. (2010). Twenty-four undisturbed
dry deposition estimates, but it is hard to say which model       soil cores (top 5 cm of the mineral soil, Ah horizon) were
version is the most realistic. Evaluation of the model against    taken from each of 27 forests and eight semi-natural sites in
measurements over this period has shown quite consistent re-      spring after soils had warmed up above 8 ◦ C for 1 week in
sults for the wet-deposited components and NO2 concentra-         order to guarantee phenological comparability of the differ-
tions, but the dry deposition rates cannot be evaluated versus    ent climatic zones. Sampling was conducted in 2008, 2009
actual measurements at the European scale. We chose there-        and 2010, and cores were sent to a common laboratory at
fore to make use of all versions and years, giving a small        the Federal Research and Training Centre for Forests (BFW,
ensemble of simulations.                                          Vienna, Austria) for the controlled environment bioassays,
                                                                  which were carried out straight away. The 5 cm topsoil layer
2.2.2   Soil gaseous and leaching losses                          was selected as it represents the highest microbial activ-
                                                                  ity and correspondingly high GHG production/consumption
Nitrogen losses to the atmosphere (gaseous emissions) and to      rates, although processes in deeper soil layers should not
groundwater (N leaching) are especially hard to quantify and      be neglected (Schaufler et al., 2010). Site-specific, empirical
thus typically cause large uncertainties in ecosystem N bud-      bivariate (temperature, WFPS) relationships describing soil
gets. These Nr losses were estimated by direct flux measure-      fluxes for CO2 , N2 O, NO and CH4 were derived from the in-
ments or by indirect empirical methods. Soil NO and N2 O          cubation results and then applied to multi-annual time series
emissions were measured in the field using closed static and      of soil temperature and moisture measured at the sites, mim-
dynamic chamber methods, as part of NEU (e.g. EN2, EN10,          icking field conditions and providing scaled-up estimates of
EN16, DB2, SN3, SN8, SN9) and/or collected from the liter-        potential annual trace gas emissions.
ature (e.g. EN2, EN10, EN14, EN16, DB2, Pilegaard et al.,             Leaching of dissolved inorganic nitrogen (DIN = NH+      4 +
2006; long-term data at EN2 in Luo et al., 2012). Such data       NO−  3 ) was measured    using   lysimeter   setups, or estimated

Biogeosciences, 17, 1583–1620, 2020                                                    www.biogeosciences.net/17/1583/2020/
C. R. Flechard et al.: Carbon–nitrogen interactions in European ecosystems – Part 1 1593
from a combination of suction cup measurements (typically (BPE = BP / GPP; Vicca et al., 2012), which is a CUE proxy.
∼ 1 m soil depth) and a hydrological drainage model, at a few By analogy, we define here an ecosystem-scale, medium-
sites during the NEU monitoring period (EN2, EN4, EN10, term indicator of carbon sequestration efficiency (CSE) as
EN15, EN16, DB1, DB2) and as part of parallel projects the NEP / GPP ratio, calculated from measurable fluxes over
(EN8, DB4). One-dimensional (1-D) drainage models were the CEIP/NEU project observation periods.
based on the soil water balance equation using evapotran- The EC technique is based on fast-response (sampling
spiration, observed precipitation and changes in soil water rates typically 10–20 Hz) open-path or closed-path infrared
content (Kindler et al., 2011; Gielen et al., 2011). For the gas analyser (IRGA) measurements of turbulent fluctuations
forest sites where no leaching measurements were available, in CO2 concentration (c) in the surface layer above the
the empirical algorithm by Dise et al. (2009) was applied ecosystem, coupled with ultrasonic anemometer measure-
to predict DIN leaching based on key variables (through- ments of the three components of wind (u, v, w) and tem-
fall inorganic Nr deposition DINTF , organic horizon C/N perature. The NEE flux is calculated as the average product
ratios, MAT). The algorithm, developed from the extensive of c and w fluctuations, i.e. the covariance (Swinbank, 1951;
Indicators of Forest Ecosystem Functioning (IFEF) database Lee et al., 2004).
(> 300 European forest sites), simulates the non-linearity of The EC-CO2 flux measurements reported here followed
DIN leaching with respect to DINTF and soil C/N ratio, the protocols established during the CEIP project, largely
with critical thresholds for the onset of leaching of DINTF = based on the EUROFLUX methodology (Aubinet et al.,
0.8 g N m−2 yr−1 and C/N = 23, respectively. Since the al- 2000). Briefly, post-processing of the raw high-frequency EC
gorithm requires DINTF as input, as opposed to total (above data included typically de-spiking to remove outliers, 2-D
canopy) Ndep , in the present study we applied a reduction rotation of the coordinate system, time lag optimization by
factor of 0.85 from Ndep to DINTF (i.e. a canopy retention maximization of the covariance between CO2 concentration
of 15 % of atmospheric N), which was calculated as the av- and the vertical component of wind speed (w), and block-
erage of all available individual DINTF / Ndep ratios in the averaging over the flux-averaging interval of 30 min. Cor-
IFEF database. A comparison with values of DINTF / Ndep rections were applied for various methodological artefacts,
ratios actually measured at the EN2, EN8, EN10, EN16 including notably (i) flux losses at the different frequencies
and DB2 sites (0.71, 0.80, 0.29, 0.85 and 1.11, respectively; of flux-carrying eddies, caused e.g. by attenuation/damping
mean ± SD 0.75 ± 0.30) shows that the applied ratio of 0.85 in the inlet/tubing system (Ibrom et al., 2007; Fratini et
is plausible but also that much variability in canopy reten- al., 2012), path averaging, sensor separation, analyser re-
tion/leaching may be expected between sites. sponse time, and high- and low-pass filtering; (ii) effects
of temperature fluctuations and dilution by water vapour
2.3 Carbon fluxes on measured fluctuations in concentrations of CO2 (Webb–
Pearman–Leuning corrections; Webb et al., 1980); and (iii)
2.3.1 Ecosystem–atmosphere CO2 exchange CO2 storage below sensor height. Quality assurance and
quality control procedures were further developed and agreed
Half-hourly rates of net ecosystem–atmosphere CO2 ex- upon within CEIP, including statistical tests, non-stationarity,
change (NEE) were measured over several years (on aver- integral turbulence characteristics (Foken et al., 2004) and
age 5 years; see Table S6) by the eddy covariance (EC) tech- footprint evaluation (Göckede et al., 2008). Friction velocity
nique at all sites. The long-term net ecosystem productivity (u∗ ) threshold filtering was implemented using the moving
is defined following Chapin et al. (2006) as the difference be- point test according to Papale et al. (2006) and as described
tween gross primary production (GPP) and ecosystem respi- in REddyProc (2019), in order to discard flux data from pe-
ration (Reco ) and is thus calculated as the straightforward an- riods of low turbulence.
nual sum of NEE fluxes (with opposite sign). The net ecosys- Different EC post-processing software was used at the dif-
tem carbon balance may differ from the NEP if C fluxes ferent sites within the project, such that the data were not
other than assimilation and respiration, such as DIC/DOC evaluated in exactly the same way across the CEIP network,
leaching, CH4 and other volatile organic compound (VOC) but a reasonably good overall agreement was found among
emissions, as well as lateral fluxes (harvest, thinning) and the different software, within 5 %–10 % difference for 30 min
other disturbances (fire), are significant over the long term CO2 flux values (Mauder et al., 2008; Mammarella et al.,
(Chapin et al., 2006). For convenience in this paper, we use 2016). Similarly, for the gap-filling of the 30 min flux time
the following sign convention for CO2 fluxes: GPP and Reco series, during periods of instrument malfunction or unsuit-
are both positive, while NEP is positive for a net sink (a able measurement conditions (low turbulence, insufficient
C gain from an ecosystem perspective) and negative for a net fetch, etc.), and for the partitioning of NEP into GPP and
source. Previous studies have normalized C flux data through Reco , a number of alternative algorithms have been devel-
the carbon use efficiency (CUE), commonly defined from a oped in the past, based on different sets of principles (Falge
plant’s perspective as the ratio of net to gross primary pro- et al., 2001; Barr et al., 2004; Reichstein et al., 2005; Lass-
ductivity (NPP / GPP), or the biomass production efficiency lop et al., 2010). The gap-filling and partitioning algorithm
www.biogeosciences.net/17/1583/2020/ Biogeosciences, 17, 1583–1620, 20201594 C. R. Flechard et al.: Carbon–nitrogen interactions in European ecosystems – Part 1
used by default in this study was the generic online REd- the atmosphere only later, either on-site or even off-site if dis-
dyProc (2019) software, implemented also in the European solved CO2 (DIC) leaches to groundwater. Annual Rsoil data,
Fluxes Database Cluster. REddyProc was based on (i) Re- scaled up from SCE measurements, are available for 19 for-
ichstein et al. (2005) for the filling of gaps in the NEE flux est sites and were collected from the CEIP or GHG-Europe
data on the basis of information from environmental con- databases and/or from various peer-reviewed publications for
ditions, (ii) Reichstein et al. (2005) for the night-time-data- the different sites (see Table S7). The ratio of heterotrophic
based Reco parameterization (using an Arrhenius-type func- respiration (Rhet ) to Rsoil was determined on an annual scale
tion of temperature), and (iii) on Lasslop et al. (2010) for the at 16 sites by different techniques (root-exclusion meshes,
daytime-data-based GPP evaluation (using a rectangular hy- trenching experiments, radiocarbon or stable isotope tracing,
perbolic light response curve for NEE and including a tem- tree girdling; e.g. Subke et al., 2006) (Table S7).
perature sensitivity of respiration and limitation of GPP by Methane fluxes were measured by chamber methods or
vapour pressure deficit). eddy covariance at six forest sites and five semi-natural (peat-
In this study, for all CEIP flux sites, we have retrieved the land, wetland) sites (Hendriks et al., 2007; Skiba et al., 2009;
fully analysed and validated half-hourly (level-3) and daily Drewer et al., 2010; Shvaleva et al., 2011; Luo et al., 2012;
to annual (level-4) CO2 flux (NEP, GPP, Reco ) data as avail- Kowalska et al., 2013; Juszczak and Augustin, 2013) (Ta-
able, initially from the CEIP database and later from the Eu- ble S6). These data were complemented by bioassay mea-
ropean Fluxes Database Cluster (2012) or from the GHG- surements of CH4 emission or uptake (net oxidation) by the
Europe portal (GHG-Europe, 2012). For these data, although laboratory soil cores, as described previously for NO and
the evaluation methods were not necessarily harmonized be- N2 O estimates (Schauffler et al., 2010).
tween sites, we hold that the data available in the database
were obtained using the best possible, state-of-the-art evalu- 2.3.3 Dissolved carbon losses
ation methods at the time of retrieval. For the four non-CEIP
flux sites, flux evaluation closely followed CEIP protocols; Dissolved inorganic (excluding CO2 from weathering of car-
in the case of DB4 the EddyPro (v6.2) software was used, bonate rocks) and organic carbon (DIC/DOC) fluxes were
which was based on a synthesis of calculation and correc- measured at six forest sites (DB1, DB2, EN4, EN8, EN10,
tion methods from CEIP and other FLUXNET flux networks EN15), using suction cups for sampling soil water and com-
around the globe. bined with soil drainage data, or by monitoring water runoff
The EC-CO2 flux measurements used in this study mostly through weirs, as part of CEIP, NEU and other projects (Il-
spanned the 5-year period of CEIP (2004–2008), except for vesniemi et al., 2009; Kindler et al., 2011; Gielen et al., 2011;
a dozen sites where measurements continued until 2010, i.e. Verstraeten et al., 2014). Data were also available for peat-
the end of NEU and of atmospheric Nr sampling. Older EC land at SN7, with DIC, DOC and also dissolved CH4 con-
data (since the mid-late 1990s) were also available at DB5, centrations in pore water of the clayey peat, in groundwater
EN6 and EN13. Data collection started and ended later at from the sand aquifer and in ditch water, as described in Hen-
DB4, at which both EC-CO2 flux and DELTA-Nr measure- driks et al. (2007). For the peatland within SN9, Dinsmore
ments spanned the 7-year period 2009–2015. Data analyses et al. (2010) measured stream concentrations and export of
presented in the paper, based on inter-annual mean CO2 bud- DIC, DOC and particulate organic carbon (POC), and they
gets and mean Nr deposition, assume that five or more years also estimated stream evasion of CO2 , CH4 and N2 O in ad-
of monitoring yield reasonably robust estimates of long-term dition to the land-based flux (EC, chamber) measurements in
fluxes for the different sites and that the small time shift be- the tower footprint.
tween the CEIP and NEU project periods (2–3 year overlap)
2.4 Ecosystem greenhouse gas balance
does not affect the results significantly. At some sites, such as
DB2, long-term NEE measurements showed multi-decadal Net GHG budgets were constructed from inter-annual mean
variations (Pilegaard et al., 2011; Wu et al., 2013); thus it EC-based NEP combined with measured and scaled-up N2 O
was essential to use the years overlapping with NEU. and CH4 fluxes wherever available (nine and six sites, re-
spectively), or with bioassay-derived fluxes (most sites) or
2.3.2 Soil CO2 and CH4 fluxes modelled data (BASFOR, forests/N2 O only), using 100-
year global warming potentials (GWPs) of 265 and 28 for
In situ soil CO2 efflux (SCE) measurements by opaque (static N2 O and CH4 , respectively (Fifth Assessment Report, IPCC,
or dynamic) manual chambers were carried out at 25 of the 2013). The sign convention for non-CO2 GHG fluxes and for
forest sites, with typically weekly to monthly sampling fre- the net ecosystem GHG balance in this paper adopts an at-
quency, with fluxes being measured continuously (hourly) by mospheric warming perspective, i.e. positive fluxes for emis-
automated chambers at a few sites (e.g. EN2). The SCE is sions toward the atmosphere (warming) and negative for up-
usually considered a proxy for CO2 production by soil respi- take by the surface (cooling).
ration (Rsoil ), though the two may not be equal as part of the
CO2 production is dissolved into pore water and may reach
Biogeosciences, 17, 1583–1620, 2020 www.biogeosciences.net/17/1583/2020/You can also read