The European mountain cryosphere: a review of its current state, trends, and future challenges - Core
←
→
Page content transcription
If your browser does not render page correctly, please read the page content below
The Cryosphere, 12, 759–794, 2018
https://doi.org/10.5194/tc-12-759-2018
© Author(s) 2018. This work is distributed under
the Creative Commons Attribution 3.0 License.

The European mountain cryosphere: a review of its current state,
trends, and future challenges
Martin Beniston1,2 , Daniel Farinotti3,4 , Markus Stoffel1,5,6 , Liss M. Andreassen7 , Erika Coppola8 , Nicolas Eckert9 ,
Adriano Fantini8 , Florie Giacona1,9 , Christian Hauck10 , Matthias Huss10 , Hendrik Huwald11 , Michael Lehning11,12 ,
Juan-Ignacio López-Moreno13 , Jan Magnusson7 , Christoph Marty12 , Enrique Morán-Tejéda14 , Samuel Morin15 ,
Mohamed Naaim9 , Antonello Provenzale16 , Antoine Rabatel17 , Delphine Six17 , Johann Stötter18 , Ulrich Strasser18 ,
Silvia Terzago19 , and Christian Vincent17
1 Institute for Environmental Sciences, University of Geneva, Switzerland
2 Department    of Physics, University of Geneva, Switzerland
3 Laboratory of Hydraulics, Hydrology and Glaciology (VAW), ETH Zurich, Zurich, Switzerland
4 Swiss Federal Institute for Forest, Snow and Landscape Research (WSL), Birmensdorf, Switzerland
5 Department of Earth Sciences, University of Geneva, Switzerland
6 Department F-A Forel for Aquatic and Environmental Sciences, University of Geneva, Switzerland
7 Norwegian Water Resources and Energy Directorate, Oslo, Norway
8 Abdus Salaam International Centre for Theoretical Physics, Trieste, Italy
9 Institut National de Recherche sur les Technologies pour l’Environnement et l’Agriculture (IRSTEA),

Saint Martin d’Hères, France
10 University of Fribourg, Department of Geosciences, Fribourg, Switzerland
11 École Polytechnique Fédérale de Lausanne, Laboratory for Cryospheric Sciences, Lausanne, Switzerland
12 Swiss Federal Institute for Avalanche Research (SLF), Davos, Switzerland
13 Institute for Pyrenean Ecology (IPE-CSIC), Zaragoza, Spain
14 University of the Balearic Islands, Palma de Mallorca, Spain
15 Météo France, Centre d’Études de la Neige, Saint Martin d’Hères, France
16 CNR, Institute of Geosciences and Earth Resources, Pisa, Italy
17 Univertisé Grenoble-Alpes, CNRS, IRD, G-INP, IGE (UMR 5001), 38000 Grenoble, France
18 University of Innsbruck, Institute of Geography, Innsbruck, Austria
19 CNR, Institute of Atmospheric Sciences and Climate (ISAC-CNR), Turin, Italy

Correspondence: Martin Beniston (martin.beniston@unige.ch) and Markus Stoffel (markus.stoffel@unige.ch)

Received: 20 December 2016 – Discussion started: 9 January 2017
Revised: 16 January 2018 – Accepted: 18 January 2018 – Published: 1 March 2018

Abstract. The mountain cryosphere of mainland Europe is         lated impacts. By the end of the century, Europe’s mountain
recognized to have important impacts on a range of environ-     cryosphere will have changed to an extent that will impact the
mental processes. In this paper, we provide an overview on      landscape, the hydrological regimes, the water resources, and
the current knowledge on snow, glacier, and permafrost pro-     the infrastructure. The impacts will not remain confined to
cesses, as well as their past, current, and future evolution.   the mountain area but also affect the downstream lowlands,
We additionally provide an assessment of current cryosphere     entailing a wide range of socioeconomical consequences. Eu-
research in Europe and point to the different domains re-       ropean mountains will have a completely different visual ap-
quiring further research. Emphasis is given to our under-       pearance, in which low- and mid-range-altitude glaciers will
standing of climate–cryosphere interactions, cryosphere con-    have disappeared and even large valley glaciers will have ex-
trols on physical and biological mountain systems, and re-      perienced significant retreat and mass loss. Due to increased

Published by Copernicus Publications on behalf of the European Geosciences Union.
760                                                                    M. Beniston et al.: The European mountain cryosphere

air temperatures and related shifts from solid to liquid pre-      Both political and scientific programs are calling for better
cipitation, seasonal snow lines will be found at much higher       preparedness and for the development of strategies aimed at
altitudes, and the snow season will be much shorter than to-       averting possible conflicts of interest, such as between eco-
day. These changes in snow and ice melt will cause a shift         nomic goals and environmental protection (Beniston et al.,
in the timing of discharge maxima, as well as a transition of      2014).
runoff regimes from glacial to nival and from nival to plu-           In the following, we provide an overview of the current
vial. This will entail significant impacts on the seasonality of   knowledge of European mountain permafrost, glaciers, and
high-altitude water availability, with consequences for wa-        snow and the observed changes. We focus on mainland Eu-
ter storage and management in reservoirs for drinking wa-          rope, in particular the European Alps and Scandinavia, but
ter, irrigation, and hydropower production. Whereas an up-         also include – where possible – the Pyrenees and other mid-
ward shift of the tree line and expansion of vegetation can        latitude European mountains. An assessment of the chal-
be expected into current periglacial areas, the disappearance      lenges that need to be addressed in cryosphere research is
of permafrost at lower altitudes and its warming at higher         provided, and we identify areas where further progress is re-
elevations will likely result in mass movements and process        quired to improve our understanding of climate–cryosphere
chains beyond historical experience. Future cryospheric re-        interactions. We argue that such improved understanding is
search has the responsibility not only to foster awareness of      the key for better predicting future changes and impacts and
these expected changes and to develop targeted strategies to       for appropriate adaptation measures to be developed. Our
precisely quantify their magnitude and rate of occurrence but      views largely reflect the opinions of a body of scientists that
also to help in the development of approaches to adapt to          convened during the “Riederalp Cryosphere Workshop“ held
these changes and to mitigate their consequences. Major joint      in Switzerland in 2016. We therefore do not claim that all as-
efforts are required in the domain of cryospheric monitoring,      pects of cryosphere sciences are exhaustively covered or that
which will require coordination in terms of data availabil-        all possible elements of the cryosphere are discussed (we ne-
ity and quality. In particular, we recognize the quantification    glect, for example, lake ice, river ice, and ice in caves), but
of high-altitude precipitation as a key source of uncertainty      we have summarized, in an effective manner, both the current
in projections of future changes. Improvements in numerical        state and the future challenges in the domain of European
modeling and a better understanding of process chains affect-      mountain cryosphere research.
ing high-altitude mass movements are the two further fields
that – in our view – future cryospheric research should focus
on.                                                                2     Past and future trends in European mountain
                                                                         cryosphere and their impacts

                                                                   2.1     Changes in snow
1   Introduction                                                   Snow cover is the most important interface between the
                                                                   atmosphere and the ground, strongly influencing the sur-
Ongoing climate change and the importance of its anthro-           face energy balance of the cryosphere. Snow affects glaciers
pogenic component have gained wide recognition (IPCC,              through albedo and mass balance and affects permafrost
2013). Thereby, some regions are likely to be more vulner-         through its thermal insulation properties and meltwater in-
able than others, in both the expected physical changes and        put. It also plays a key role for sustaining ecological and so-
the consequences for ways of life. Mountains are particularly      cioeconomic systems in mountains as well as in the lowlands
subject to rapid and sustained environmental changes (Gob-         downstream of the mountain ranges. The extreme spatiotem-
iet et al., 2014), and the cryosphere is the physical compart-     poral variability of the snow cover remains one of the key un-
ment that exhibits the most rapid ones. Changes in mountain        certainties when quantifying the impact of climate change on
snow, glaciers, and permafrost have resulted in significant        the cryosphere. Snow observations are therefore a prerequi-
downstream impacts in terms of the quantity, seasonality, and      site for understanding the related processes and for providing
quality of water (Beniston et al., 2011a). This is particularly    more reliable assessments of future changes.
true for areas where snow and ice melt represent a large frac-
tion of streamflow. Countless studies have reported glacier        2.1.1    Observed changes of the snow cover
retreat, permafrost warming, and snowfall decrease across
mountain regions in Europe, with implications for stream-          Most studies show negative trends in snow depth and snow
flow regimes, water availability, and natural hazards. These       duration over the past decades (Table 1). These negative
can in turn negatively impact hydropower generation, agri-         trends are well documented in the Alps due to the abun-
culture, forestry, tourism, and aquatic ecosystems. Conse-         dance of long-term observations. The changes are typically
quently, downstream communities will also be under pres-           elevation dependent, with more (less) pronounced changes
sure, and mountain forelands with densely populated areas          at low (high) elevations (Marty, 2008; Durand et al., 2009;
will be highly affected (Kaser et al., 2010; Huss et al., 2017).   Terzago et al., 2013). Decrease in spring snow water equiv-

The Cryosphere, 12, 759–794, 2018                                                       www.the-cryosphere.net/12/759/2018/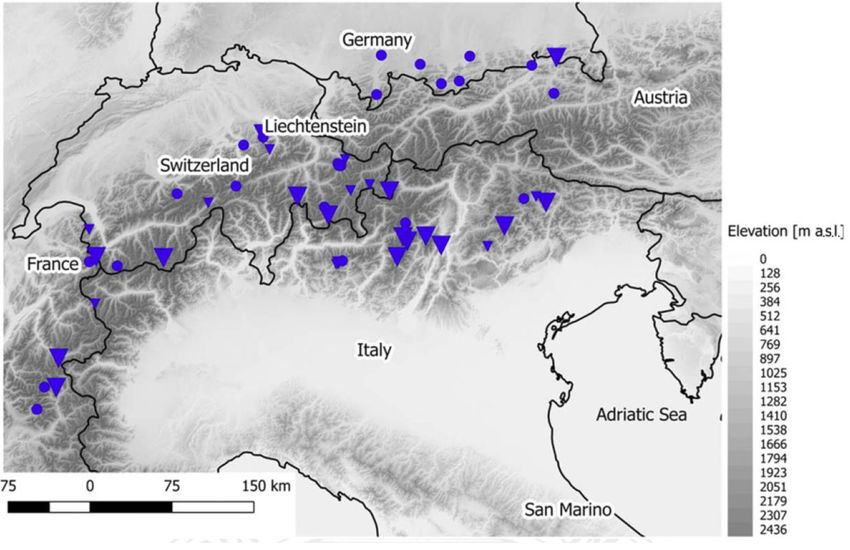
M. Beniston et al.: The European mountain cryosphere                                                                                      761

Table 1. Recent studies of current snow cover trends in the major European mountain regions. Only significant trends are listed. Note that
a direct comparison of the sites is difficult since the considered time period and snow variable can differ.

                   Time           Snow variable                        Trend at low and high elevation        Source
   Alps                                                            below 2000 m          above 2000 m
   Switzerland     1958–1999      DJF snow cover duration          majority negative     no clear trend       Scherrer et al. (2004)
   Italy           1950–2009      DJFMA snow cover duration        majority negative     no clear trend       Valt and Cianfarra (2010)
   France          1959–2005      annual snow cover duration       majority negative     many negative        Durand et al. (2009)
   Scandinavia                                                     below 1000 m          above 1000 m
   Norway          1961–2010      maximum snow depth               majority negative     some positive        Dyrrdal et al. (2013)
   Finland         1978–2012      annual snow cover duration       majority negative     –                    Kivinen and Rasmus (2015)
   Carpathians                                                     below 1000 m          above 1000 m
   Bulgaria        1931–2000      annual snow cover duration       no clear trend        no clear trend       Brown and Petkova (2007)
   Poland          1954–2001      maximum snow depth               no clear trend        no clear trend       Falarz (2008)
   Romania         1961–2003      annual snow cover duration       no clear trend        no clear trend       Micu (2009)
   Pyrenees                                                        below 1000 m          above 1000 m
   Spain           1975–2002      annual snow cover duration       majority negative     majority negative    Pons et al. (2010)

Figure 1. Geographical distribution of the 45-year trend (1968–2012) for 1 April snow water equivalent (SWE) in the Alps. All stations
show a negative trend. Large triangles indicate significant trends (p = 0.05) and small triangles indicate weakly significant trends (p = 0.2).
Circles represent stations with no significant trend (p = 0.2). The elevation is given in gray. (Adapted from Marty et al., 2017b.)

alent (SWE) is equally found for the Alps (Bocchiola and                  studies also report declining snowpacks. The latter is particu-
Diolaiuti, 2010; Marty et al., 2017b; Fig. 1) as well as for              larly true for mountains in Romania (Birsan and Dumitrescu,
low elevations in Norway (Skaugen et al., 2012). Only the                 2014; Micu, 2009), Bulgaria (Brown and Petkova, 2007),
higher and colder regions of the Fennoscandian mountains                  Poland (Falarz, 2008), and Croatia (Gajić-Čapka, 2011).
exhibit positive trends of maximum snow depth and maxi-                      The observed changes in snow depth and snow duration
mum SWE, although trends have recently become negative                    are mainly caused by a shift from solid to liquid precipitation
in these regions too (Johansson et al., 2011; Skaugen et al.,             (Serquet et al., 2011; Nikolova et al., 2013) and by more fre-
2012; Dyrrdal et al., 2013; Kivinen and Rasmus, 2015). In                 quent and more intense melt (Klein et al., 2016), both result-
the Pyrenees, a significant reduction of the snowpack is re-              ing from higher air temperatures during winter and spring. In
ported since the 1950s (Pons et al., 2010), and in other Eu-              addition to a general warming trend, large-scale atmospheric
ropean mountains – where observations are less abundant –                 circulation patterns such as the North Atlantic Oscillation

www.the-cryosphere.net/12/759/2018/                                                                 The Cryosphere, 12, 759–794, 2018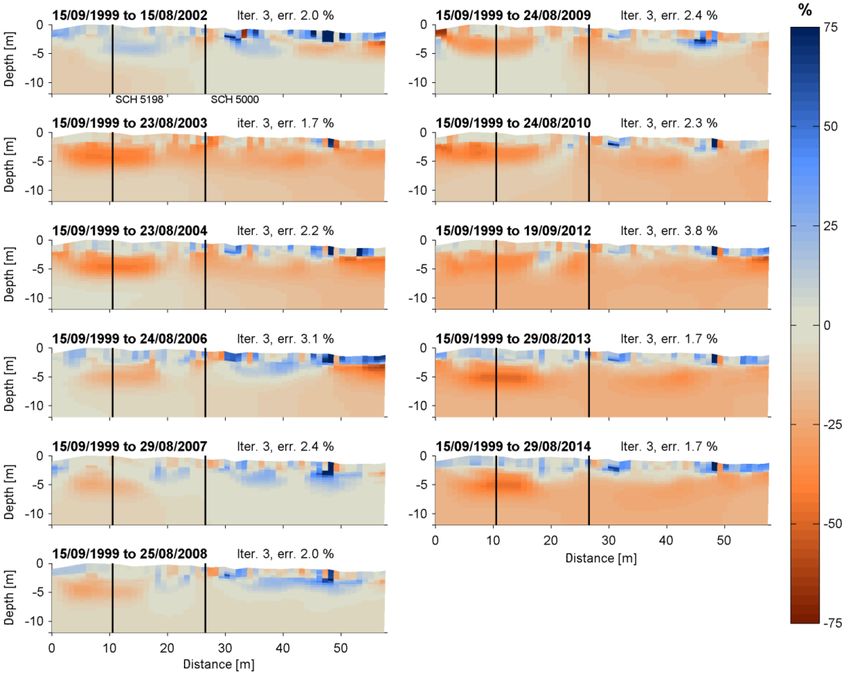
762 M. Beniston et al.: The European mountain cryosphere
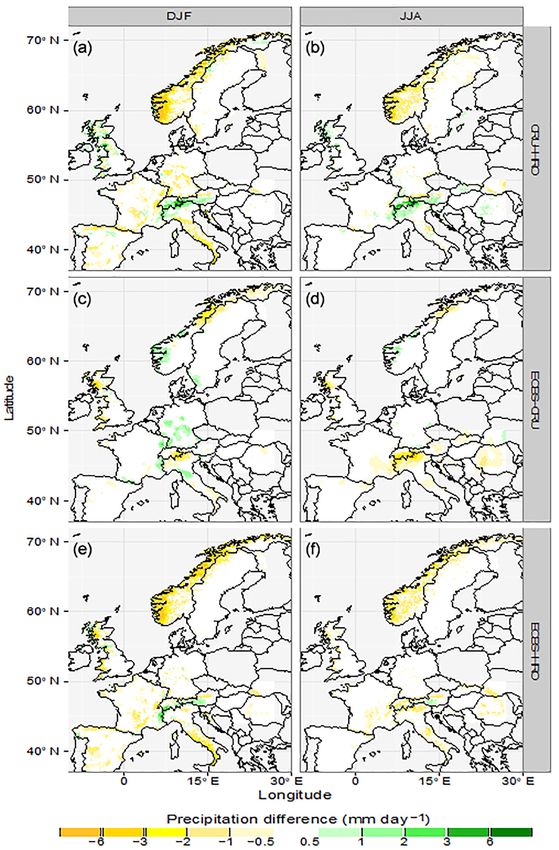
(NAO) have been shown to influence the snow cover in Eu- 2.1.2 Future changes of the snow cover
rope (Henderson and Leathers, 2010; Bednorz, 2011; Skau-
gen et al., 2012; Birsan and Dumitrescu, 2014; Buisan et al., Regional climate model simulations show a dramatic de-
2015). For the Alps, 50 % of the snowpack variability seems crease both in snow cover duration and SWE for Europe
to be related to the establishment of atmospheric blocking by the end of the 21st century (Jylhä et al., 2008). It has
patterns over Europe, although in this case the correlation to be noted, however, that the projected increase in air tem-
between the annual snowpack variability and the NAO is perature for coming decades is accompanied by large uncer-
weak and limited to low elevations (Scherrer and Appen- tainties in changes of winter precipitation. For mainland Eu-
zeller, 2006; Durand et al., 2009). At higher elevations, the rope, climate models show no clear precipitation change until
NAO influence can be detected a through a “cascade” of pro- the 2050s and slightly increasing winter precipitation there-
cesses that include the manner in which the positive or neg- after. Projections for regional changes in snow cover are thus
ative NAO modes translate into surface pressure in the Alps, highly variable and strongly depend on applied emission sce-
Pyrenees, or Scandes and thus influence temperature and pre- narios and considered time period (e.g., Marke et al., 2015).
cipitation according to the resulting pressure patterns in the For the Alps at an elevation of 1500 m a.s.l. (above sea
different European mountain regions. Together with the ef- level), recent simulations project a reduction in SWE of 80–
fect of air temperature, this determines the amount of snow- 90 % by the end of the century (Rousselot et al., 2012; Ste-
fall. In recent decades, this cascade has led to an increased ger et al., 2013; Schmucki et al., 2015a). According to the
number of warm and dry winter days, which obviously is same simulations, the snow season at that altitude would
unfavorable for snow accumulation (Beniston et al., 2011b). start 2–4 weeks later and end 5–10 weeks earlier than in the
In addition, the Atlantic Multidecadal Oscillation – a natural 1992–2012 average, which is equivalent to a shift in elevation
periodic fluctuation of North Atlantic sea surface tempera- of about 700 m (Marty et al., 2017a). For elevations above
ture – has been shown to affect the variability of alpine spring 3000 m a.s.l., a decline in SWE of at least 10 % is expected
snowfall, contributing to the decline in snow cover duration by the end of the century even when assuming the largest pro-
(Zampieri et al., 2013). jected precipitation increase. Future climate will most prob-
The observed changes in snow amounts are often abrupt. ably not allow for the existence of a permanent snow cover
Several studies have reported a step-like change for snow during summer even at the highest elevations in the Alps,
depth occurring in the late 1980s (Marty, 2008; Durand et al., with obvious implications for the remaining glaciers (Mag-
2009; Valt and Cianfarra, 2010) and for snow-covered areas nusson et al., 2010; Bavay et al., 2013) and the thermal con-
of the Northern Hemisphere (Choi et al., 2010). This step- dition of the ground (e.g., Marmy et al., 2016; Draebing
like development, also observed for other compartments of et al., 2017; Magnin et al., 2017).
the environment (Reid et al., 2016), has been suggested to be Projections for Scandinavia show clear decreases for snow
linked to atmospheric internal variability (Li et al., 2015) and amount and duration. Exceptions are the highest moun-
shrinking sea-ice extent (Mori et. al. 2014). Since that step tains in Northern Scandinavia, where strongly increasing
change, the monthly mean snow-covered area in the Alps has amounts in precipitation could compensate the temperature
not decreased significantly (Hüsler et al., 2014), and win- rise and result in marginal changes only (Räisänen and Ek-
ter temperatures in large areas of the Northern Hemisphere lund, 2012). Simulations for the Pyrenees indicate a decline
(Mori et. al. 2014) and in the Swiss Alps (Scherrer et al., of the snow cover similar to that found for the Alps (López-
2013) have been stagnating. Moreno et al., 2009). Again, the dependency on future emis-
Studies analyzing high-magnitude snowfalls are rare, but sions is significant: for a high emission scenario (RCP8.5),
they indicate that extreme snow depths have decreased in Eu- SWE decreases by 78 % at the end of the 21st century at
rope (Blanchet et al., 2009; Kunkel et al., 2016), with the ex- 1500 m a.s.l. elevation are expected, whereas a lower emis-
ception of higher and colder sites in Norway (Dyrrdal et al., sion scenario (RCP6.0) projects a decline of 44 %.
2013). The decrease in extreme snowfall rates is less clear, Extreme values of snow variables are often the result of
except for low elevations where the influence of increasing a combination of processes (e.g., wind and topographic in-
air temperature is predominant (Marty and Blanchet, 2012). fluence for drifting snow), making predictions of their fre-
Studies related to past changes in snow avalanche activity quency highly uncertain (IPCC, 2012, 2013). By the end of
are scarce as well, but observations indicate that over the the 21st century, models suggest a smaller reduction in daily
last decades (a) the number of days with prerequisites for maximum snowfalls than in mean snowfalls over many re-
avalanches in forests decreased (Teich et al., 2012), (b) the gions of the Northern Hemisphere (O’Gorman, 2014). An
proportion of wet snow avalanches increased (Pielmeier investigation for the Pyrenees (López-Moreno et al., 2011),
et al., 2013), and (c) the runout altitude of large avalanches however, finds a marked decrease in the frequency and in-
retreated upslope (Eckert et al., 2010, 2013; Corona et al., tensity of heavy snowfall events below 1000 m a.s.l. and no
2013) as a direct consequence of changes in snow cover char- change in heavier snowfalls for higher elevations. Changes
acteristics (Castebrunet et al., 2012). in extreme snowfall and snow depth are also likely to de-
pend on compensation mechanisms between higher temper-
The Cryosphere, 12, 759–794, 2018 www.the-cryosphere.net/12/759/2018/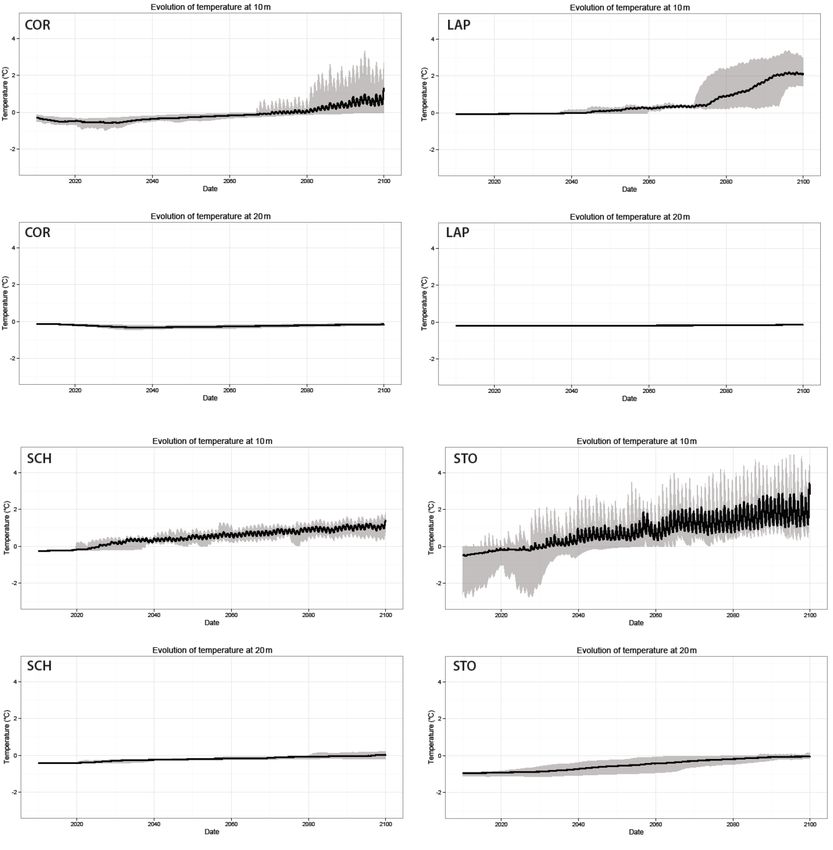
M. Beniston et al.: The European mountain cryosphere 763
atures (Nicolet et al., 2016), more intense precipitation, and 2009). Due to the highly nonlinear nature of avalanche trig-
increased climate variability, rendering any prediction of fu- gering response to snow and weather inputs (Schweizer et al.,
ture snow storm frequency, magnitude, and timing difficult. 2003) and to the complex relations between temperature,
In addition, most available studies either deal with marginal snow amounts, and avalanche dynamics (Bartelt et al., 2012;
distributions or postulate stationarity (Blanchet and Davison, Naaim et al., 2013), it remains unclear whether warmer tem-
2010; Gaume et al., 2013), two approaches that are question- peratures will indeed lead to fewer avalanches because of less
able in the context of a changing climate. snow. The most destructive avalanches, moreover, mostly in-
Changes in snow cover duration and snow depth, as well as volve very cold and dry snow resulting from large snowfall,
other snow properties, will have an effect on various ecosys- but they may also result from wet snow events whose fre-
tems: earlier snowmelt is associated with an anticipation of quency has increased in the past (Sovilla et al., 2010; Caste-
plant phenology (Pettorelli et al., 2007) which can poten- brunet et al., 2014; Ancey and Bain, 2015). Finally, mass
tially induce a mismatch between plant blooming and herbi- movements involving snow often occur at very local scales,
vore activity, similar to observations in Arctic regions (Post making them difficult to relate to climate model outputs, even
et al., 2009). In the case of alpine ibex, for example, snow with downscaling methods (Rousselot et al., 2012; Kotlarski
has been found to have a dual effect: too much winter snow et al., 2014).
limits adult survival, whereas too little snow produces a mis-
match between alpine grass blooming and herbivore needs 2.2 Changes in glaciers
(Mignatti et al., 2012). Abundance of alpine rock ptarmigan
populations, in contrast, has been shown to depend on the on-
Mountain glaciers are a key indicator of rapid and global cli-
set of spring snowmelt and the timing of autumn snow cover
mate change. They are important for water supply as they
(Imperio et al., 2013). The increasing number of hard (icy)
modulate the water cycle at different temporal and spa-
snow layers due to higher temperatures, however, can have
tial scales, affecting irrigation, hydropower production, and
a significant effect on the life of plants and animals (Johans-
tourism. Evaluating the retreat or complete disappearance of
son et al., 2011).
mountain glaciers in response to climate change is impor-
In addition, human activities will be influenced by the an-
tant to estimate impacts on water resources (e.g., Kaser et al.,
ticipated changes. The reduction of the snow season dura-
2010; Pellicciotti et al., 2014) and to anticipate natural haz-
tion, for example, will have severe consequences for win-
ards related to glacier retreat, e.g., ice avalanches or the for-
ter tourism (Uhlmann et al., 2009; Steiger and Abegg, 2013;
mation of new lakes (Frey et al., 2010; Gilbert et al., 2012;
Schmucki et al., 2015b), water management (Laghari et al.,
Faillettaz et al., 2015; Haeberli et al., 2016, 2017).
2012; Hill-Clarvis et al., 2014; Gaudard et al., 2014; Kö-
plin et al., 2014), and ecology (Hu et al., 2010; Martz et al.,
2016). Similarly, change in moisture content or density of 2.2.1 Observed changes in glaciers
snow will affect infrastructure stability under extreme load-
ing (Sadovský and Sykora, 2013; Favier et al., 2014). Glaciers in mainland Europe cover an area of nearly
The effect of climate change on avalanche risk is 5000 km2 (Table 2) and have an estimated volume of almost
largely unknown; although empirical relations between snow 400 km3 (Huss and Farinotti, 2012; Andreassen et al., 2015).
avalanche activity and climate exist (Mock and Birkeland, From historical documents such as paintings and photogra-
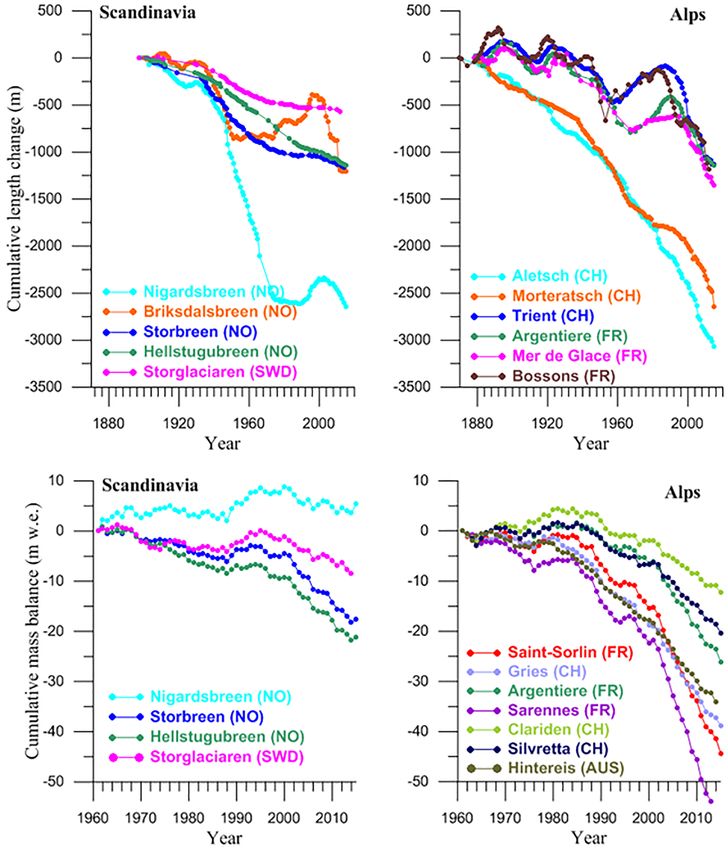
2000), the knowledge is insufficient for sound long-term phy (Zumbühl et al., 2008), it is clear that glaciers have un-
projections. With a few exceptions, existing studies on dergone substantial mass loss since the 19th century (Fig. 2)
avalanche–climate interactions focus on recent decades and and that the pace of mass loss has been increasing (Zemp
are very local in scope (Stoffel et al., 2006; Corona et al., et al., 2015). A loss of 49 % in the ice volume was es-
2012, 2013; Schläppy et al., 2014, 2016). Direct effects of timated for the European Alps for the period 1900–2011
climate change on avalanche frequency, timing, magnitude, (Huss, 2012). Repeat inventories have shown a reduction in
and type mainly exist in form of changes in snow amounts, glacier area of 11 % in Norway between 1960 and the 2000s
snowfall succession, density, and stratigraphy as a function (−0.28 % yr−1 ) (Winsvold et al., 2014) and 28 % in Switzer-
of elevation. The trend towards wetter snow avalanches is land between 1973 and 2010 (−0.76 % yr−1 ) (Fischer et al.,
expected to continue, although the overall avalanche activ- 2014). Periods with positive surface mass balance have, how-
ity will decrease, especially in spring and at low elevations ever, occurred intermittently, notably from the 1960s to the
(Martin et al., 2001; Castebrunet et al., 2014). In contrast, mid-1980s in the Alps and in the 1990s and 2000s for mar-
an increase in avalanche activity is expected at high eleva- itime glaciers in Norway (Zemp et al., 2015; Andreassen
tions in winter due to more favorable conditions for wet snow et al., 2016). Glacier area loss has led to the disintegration
avalanches earlier in the season (Castebrunet et al., 2014). of many glaciers, which has also affected the observational
Even if the expected rise of tree line elevation may reduce network (e.g., Zemp et al., 2009; Carturan et al., 2016). In
both avalanche frequency and magnitude, present knowledge the more southerly parts of Europe, glacier retreat in Pyre-
on avalanche–forest interactions is incomplete (Bebi et al., nees has accelerated since the 1980s and the small glaciers
www.the-cryosphere.net/12/759/2018/ The Cryosphere, 12, 759–794, 2018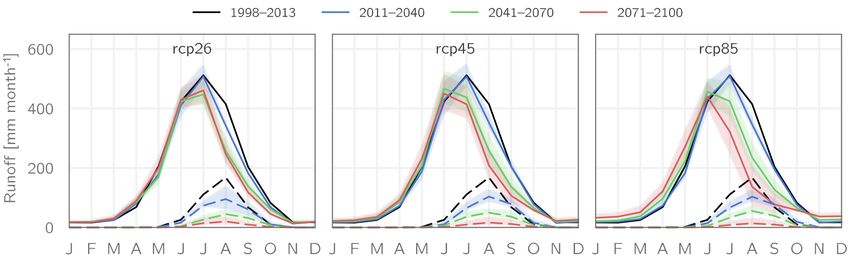
764                                                                        M. Beniston et al.: The European mountain cryosphere

Table 2. Distribution of glacier area and volume in continental Europe and mainland Scandinavia. Years of reference and respective publica-
tions are given for the glacier area. Ice volume estimates refer to 2003 for continental Europe and Sweden (Huss and Farinotti, 2012) and to
1999–2006 for Norway (Andreassen et al., 2015). Uncertainties in ice volume are on the order of 10–20 %.

                 Country                    Area (km2 )    Volume (km3 )     Year          Reference
                 Norway                           2692               271     1999–2006     Andreassen et al. (2012b)
                 Sweden                            262                12     2002          Brown and Hansson (2004)
                 Switzerland                       943                67     2008–2011     Fischer et al. (2014)
                 Austria                           415                17     2006          Abermann et al. (2009)
                 Italy                             370                18     2005–2011     Smiraglia and Diolaiuti (2015)
                 France (Alps)                     275                13     2006–2009     Gardent et al. (2014)
                 France–Spain Pyrenees               3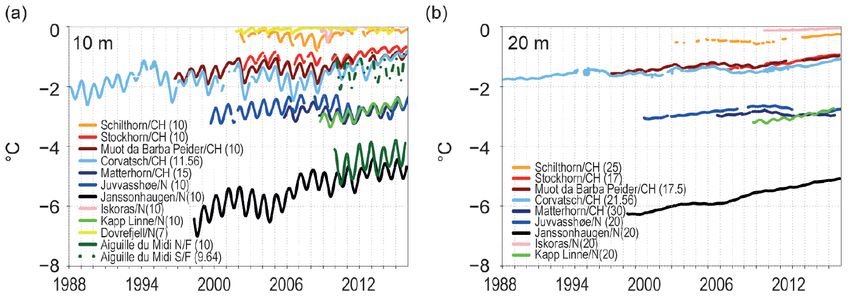
M. Beniston et al.: The European mountain cryosphere                                                                           765

ated air temperature changes. A good correlation between air        ness changes and the basal hydrological system, which in
temperature and melt exists, making long-term air temper-           turn affects basal sliding. The large decrease in ice thick-
ature time series the favorite option to explain 20th century       nesses over the last three decades has led to a strong re-
glacier retreat (Haeberli and Beniston, 1998). High melt rates      duction in ice flow velocities (Berthier and Vincent, 2012).
in the 1940s have, however, also been associated to changes         Increased water pressure, in contrast, reduces the frictional
in solar radiation (Huss et al., 2009). Several studies used cal-   drag and thus increases the sliding rate. Sliding velocities
ibrated temperature-index methods to simulate snow and ice          are low when the water under glaciers drains through chan-
melt responses to atmospheric forcing (Braithwaite and Ole-         nels at low pressure and high when the water drains through
sen, 1989; Pellicciotti et al., 2005) although the appropriate-     interconnected cavities (Röthlisberger, 1972; Schoof, 2010).
ness of such approaches for long-term studies has often been        Although changes in seasonal ice flow velocities are driven
debated (Huss et al., 2009; Gabbi et al., 2014; Réveillet et al.,   by subglacial hydrology, it seems that, at the annual to
2017). Glacier response to atmospheric forcing is driven by         multiannual timescales, the ice flow velocity changes do
different factors, ranging from synoptic weather patterns to        not depend on changes in subglacial runoff (Vincent and
local effects enhanced by topography. The latter influences,        Moreau, 2016). A few temperate alpine glaciers, such as the
among others, the distribution of precipitation, solar radia-       Belvedere Glacier in Italy, have shown large accelerations
tion, and wind. Several studies have shown that glacier mass        due to a change in subglacial hydrology (Haeberli et al.,
balance can be influenced by the NAO. Glacier advances in           2002), whereby the mechanisms of this surge-type move-
Scandinavia during 1989–1995, for example, are attributed           ment remain unclear. In some rare cases, the reduction of
to increased winter precipitation linked to the positive NAO        the efficiency of the drainage network followed by a pulse of
phase during that period (Rasmussen and Conway, 2005). In           subglacial water triggered a catastrophic break-off event as
the European Alps, the relationship between the NAO and             in the case of Allalingletscher in 1965 and 2000 (Faillettaz
glacier surface mass balance is less pronounced (Marzeion           et al., 2015).
and Nesje, 2012; Thibert et al., 2013). This is essentially            Studies of cold glaciers in the Monte Rosa and Mont Blanc
because the Alps are often a “pivotal zone” between south-          area revealed that englacial temperatures have strongly in-
ern and northern Europe, where the correlations between the         creased over the last three decades due to rising air tem-
NAO index and temperature or precipitation tend to be gen-          peratures and latent heat released by surface meltwater re-
erally stronger (i.e., in the Mediterranean zone and in Scan-       freezing within the glacier (Lüthi and Funk, 2000; Hoelzle
dinavia).                                                           et al., 2011; Gilbert et al., 2014). A progressive warming of
   Glacier evolution during the 20th century also highlights        the ice is expected to occur and propagate downstream. As
the importance of the surface albedo feedback, as albedo            a result, changes of basal conditions could have large con-
governs the shortwave radiation budget at the glacier sur-          sequences on the stability of hanging glaciers (Gilbert et al.,
face, which is the dominant energy source for melting. The          2014). Such changes in basal conditions are understood to be
sensitivity of ablation to albedo has generally been assessed       responsible for, e.g., the complete break-off of Altels Glacier
using energy-balance considerations (Six and Vincent, 2014)         in 1895 (Faillettaz et al., 2015).
or degree-day approaches (e.g., Pellicciotti et al., 2005). Oer-
lemans et al. (2009) and Gabbi et al. (2015) investigated the       2.2.2   Future evolution of European glaciers
influence of accumulation of dust or black carbon on melt
rates for Swiss glaciers in the last decades, revealing annual      Over the last two decades, various studies on potential fu-
melt rates increased by 15–19 % compared to pure snow.              ture glacier retreat in Europe have been published. These can
Monitoring, reconstructing, or modeling the surface albedo          be broadly classified into site-specific (e.g., Giesen and Oer-
of glaciers is challenging (Brock et al., 2000) as its spatial      lemans, 2010) and regional studies (e.g., Salzmann et al.,
and temporal evolution is linked to changes in surface prop-        2012). Methods range from simple extrapolation of past
erties (mainly snow grain size and grain shape) and to the          surface or length changes to complex modeling of glacier
deposition of impurities on the ice. Albedo changes are also        mass balance and ice flow dynamics. Similarly, applied mod-
determined by snow deposition (amount and spatial distribu-         els range from simple degree-day approaches (e.g., Braith-
tion), making the annual surface mass balance highly sensi-         waite and Zhang, 1999; Radic and Hock, 2006; Engelhardt
tive to snow accumulation (Réveillet et al., 2017). Properly        et al., 2015) to complete surface energy-balance formula-
quantifying the amount and distribution of accumulation over        tions (e.g., Gerbaux et al., 2005) or from simple parame-
glaciers is therefore a key to better assess the glacier surface    terizations of glacier geometry change (Zemp et al., 2006;
mass balance sensitivity to changes in climate and to simu-         Huss et al., 2010; Linsbauer et al., 2013), over flow line
late its future evolution (Sold et al., 2013).                      models (e.g., Oerlemans, 1997; Oerlemans et al., 1998), to
   Glacier dynamics are influenced by numerous variables            three-dimensional ice flow models solving the full Stokes
such as mass change and basal hydrology for temperate               equations (Le Meur et al., 2004; Jouvet et al., 2011; Zekol-
glaciers and by ice temperature changes for cold glaciers. In       lari et al., 2014). All models indicate a substantial reduc-
temperate glaciers, ice dynamics is mainly driven by thick-         tion of glacier ice volume in the European Alps and Scan-

www.the-cryosphere.net/12/759/2018/                                                         The Cryosphere, 12, 759–794, 2018
766                                                                     M. Beniston et al.: The European mountain cryosphere

Figure 3. Temperature evolution of mountain permafrost in Norway (N), France (F), and Switzerland (CH) measured in boreholes at 10 m (a)
and 20 m (b) depth (exact depth given in the parentheses). Adapted from Noetzli et al. (2016).

dinavia by the end of the century. Small glaciers are likely          2.3     Changes in permafrost
to completely disappear (Linsbauer et al., 2013), and even
large valley glaciers, such as Great Aletsch Glacier, Rhône           Permafrost is defined as lithospheric material with temper-
Glacier, Morteratsch Glacier (Switzerland), or ice caps such          atures continuously below 0 ◦ C and covers approximately
as Hardangerjøkulen and Spørteggbreen (Norway), are ex-               20 million km2 of Earth’s surface, with a fourth of it be-
pected to lose up to 90 % of their current volume (Jouvet             ing located in mountainous terrain (Gruber, 2012). Although
et al., 2009, 2011; Giesen and Oerlemans, 2010; Farinotti             the understanding of the thermal state of permafrost has in-
et al., 2012; Laumann and Nesje, 2014; Zekollari et al., 2014;        creased significantly within the recent past, knowledge gaps
Åkesson et al., 2017). Many glacier tongues will disappear,           still exist regarding the volume of permafrost ice stored in
including the one from Briksdalsbreen, the outlet glacier of          Europe, its potential impact on future water resources, and its
mainland Europe’s largest ice cap Jostedalsbreen (Laumann             effect on slope stability, including processes leading to per-
and Nesje, 2009).                                                     mafrost degradation and talik formation (Harris et al., 2009;
   At the scale of mountain ranges, model studies relying on          Etzelmüller, 2013; Haeberli, 2013).
medium-range emission scenarios consistently predict rela-
tive volume losses of 76–97 % for the European Alps and of            2.3.1    Observed changes in permafrost and in
64–81 % for Scandinavia (Marzeion et al., 2012; Radic et al.,                  rock-glacier flow velocities and ice volume
2014; Huss and Hock, 2015) for the 21st century. Since the
mountain glaciers in Europe are far out of balance with the           Permafrost borehole temperatures are monitored in many
present climate (e.g., Andreassen et al., 2012a; Mernild et al.,      European mountain ranges (documented and available in
2013), such volume losses must be expected even with strong           the Global Terrestrial Network for Permafrost (GTN-P)
efforts to reduce CO2 emissions and to stabilize global warm-         database; Biskaborn et al., 2015), several of the sites being
ing at less than +2 ◦ C as recommended by the Paris COP-21            accompanied by meteorological stations and ground surface
climate accord (Huss, 2012; Salzmann et al., 2012). Due to            temperature measurements (Gisnås et al., 2014; Staub et al.,
their limited altitudinal extent, many glaciers are unable to         2016). However, as mountain permafrost is usually invisible
reach a new equilibrium with climate even if air tempera-             from the surface, various indirect methods need to be em-
tures were stabilized by the end of this century. Furthermore,        ployed to detect, characterize, and monitor permafrost oc-
ice caps in Norway that contribute to a large part of the total       currences. These methods include surface-based geophysi-
ice volume in Europe (Table 2) are highly sensitive to mass           cal measurements to determine the physical properties of
balance–altitude feedback due to their hypsometry and large           the subsurface, including water and ice content distributions
ice thicknesses. Model experiments suggest that Hardanger-            (Kneisel et al., 2008; Hauck, 2013), and geodetic and kine-
jøkulen will not regrow with its present mass balance regime          matic measurements to detect subsidence, creep, and slope
once it has disappeared (Åkesson, 2017). However, uncer-              instabilities (Kääb, 2008; Lugon and Stoffel, 2010; Kauf-
tainties in projections of future glacier evolution are still con-    mann, 2012; Kenner et al., 2014; Arenson et al., 2016).
siderable and improvements are required in both the quality              The longest time series of borehole temperatures in Eu-
of the input data and the physical basis upon which glacio-           rope started in 1987 at the Murtèl-Corvatsch rock glacier
logical models are built (see Sect. 3.1).                             in the Swiss Alps (Haeberli et al., 1998; Fig. 3), a period
                                                                      that is much shorter compared to the available ones for the
                                                                      other cryospheric components such as snow (see Sect. 2.1)
                                                                      or glaciers (see Sect. 2.2). The past evolution of permafrost

The Cryosphere, 12, 759–794, 2018                                                            www.the-cryosphere.net/12/759/2018/
M. Beniston et al.: The European mountain cryosphere 767 at centennial timescales can to some extent be reconstructed et al., 2013). Improved integrative assessments are therefore from temperature profiles in deep permafrost boreholes (e.g., necessary. Isaksen et al., 2007), pointing to decadal warming rates at the Further evidence of climatic impacts on high mountain permafrost table on the order of 0.04–0.07 ◦ C for Northern rock slope stability comes from the analysis of historical Scandinavia. Permafrost has been warming globally since the events. For the Alps, inventories documenting such events beginning of the measurements (Romanovsky et al., 2010; exist since 1990 (Ravanel and Deline, 2011; Huggel et al., Noetzli et al., 2016; Fig. 3). This warming was accompanied 2012) and indicate a sharp increase in the number of events by an increase of the thickness of the seasonal thaw layer since 1990. This makes the temporal distribution of rock (hereafter referred to as the active layer; Noetzli et al., 2016). slope failures resembles the evolution of mean annual tem- The considerable year-to-year variability can be linked to peratures. Given the fact that monitoring and documentation variations in the snow cover, as a reduction in snow cover efforts have been intensified during the past decades, it re- thickness reduces thermal insulation. Latent heat effects as- mains unclear to which degree this correlation is affected by sociated with thawing mask the recent warming trend for varying temporal completeness of the underlying datasets. “warm” permafrost sites (temperatures close to the freezing Data on the ice volume stored in permafrost and rock point), which is otherwise clearly visible in cold permafrost glaciers are still scarce. To date, hydrologically oriented per- (see Fig. 3). mafrost studies have been utilizing remote-sensing and mete- The increasing trend in permafrost temperatures and es- orological data for larger areas or have had a regionally con- pecially the deepening of the active layer has been hypoth- strained scope such as the Andes (Schrott, 1996; Brenning, esized to lead to an increased frequency of slope instabili- 2005; Arenson and Jacob, 2010; Rangecroft et al., 2015), ties in mountain ranges, including debris flows and rockfalls the Sierra Nevada (Millar et al., 2013) or Central Asia (Sorg (Gruber and Haeberli, 2009; Harris et al., 2009; Bommer et al., 2015; Gao et al., 2016). To our knowledge, no system- et al., 2010; Stoffel, 2010; Fischer et al., 2012; Etzelmüller, atic studies exist on permafrost–hydrology interactions for 2013; Stoffel et al., 2014a, b). The disposition conditions and the European mountain ranges to date. triggering mechanisms of slope instabilities can be diverse In site-specific model studies, subsurface data are only and depend on subsurface material (e.g., unconsolidated sed- available from borehole drillings and geophysical surveying. iments vs. bedrock), its characteristics (fractures and fissures, The models used often have originated from high-resolution ice and water content, slope angle, geological layering), and hydrological models (e.g., GEOtop; Endrizzi et al., 2014), changes of these properties with time (Hasler et al., 2012; soil models (e.g., COUP model; Jansson, 2012; Marmy Krautblatter et al., 2012; Ravanel et al., 2013; Phillips et al., et al., 2016), or snow models (such as Alpine3D/Snowpack; 2017). Water infiltration into newly thawed parts of per- Lehning et al., 2006; Haberkorn et al., 2017) and have been mafrost is often mentioned as a possible triggering mecha- successfully extended to simulate permafrost processes. Re- nism (Hasler et al., 2012), but only few observational data cently, explicit permafrost models have been developed as are available to confirm this hypothesis. By means of tree- well (e.g., Cryogrid 3; Westermann et al., 2016). ring reconstructions (Stoffel et al., 2010; Stoffel and Corona, Because of its complexity, permafrost evolution cannot be 2014), the temporal evolution of debris-flow frequencies has assessed by thermal monitoring alone. Kinematic and geo- been addressed for a series of high-elevation catchments in physical techniques are required for detailed process studies. the Swiss Alps. These studies point to increased debris-flow Kinematic methods are used to monitor moving permafrost activity as a result of climate warming since the end of the bodies (e.g., rock glaciers) and surface geometry changes. Little Ice Age (Stoffel et al., 2008; Bollschweiler and Stof- Hereby, methods based on remote sensing allow for kine- fel, 2010a, b; Schneuwly-Bollschweiler and Stoffel, 2012) matic analyses over large scales (Barboux et al., 2014, 2015; and a dependence of debris-flow magnitudes due to instabil- Necsoiu et al., 2016) and the compilation of rock-glacier in- ities in the permafrost bodies at the source areas of debris ventories (e.g., Schmid et al., 2015), whereas ground-based flows (Lugon and Stoffel, 2010; Stoffel, 2010). and airborne kinematic methods focus on localized regions Several studies have documented recent events of rock and on the detection of permafrost degradation over longer slope failures in the Alps (Ravanel et al., 2010; Ravanel and timescales (Kaufmann, 2012; Klug et al., 2012; Barboux Deline, 2011; Huggel et al., 2012; Allen and Huggel, 2013). et al., 2014; Müller et al., 2014; Kenner et al., 2014, 2016; Some of these failures are clearly related to deglaciation Wirz et al., 2014, 2016). Long-term monitoring of creeping processes (Fischer et al., 2012; Korup et al., 2012; Strozzi permafrost bodies shows an acceleration in motion during et al., 2010). Unusually high air temperatures have addition- recent years, possibly related to increasing ground tempera- ally been associated with these processes as the penetration tures and higher internal water content (Delaloye et al., 2008; of meltwater from snow and ice into cleft systems results in Ikeda et al., 2008; Permos, 2016; Scotti et al., 2016; Hartl a reduction of shear strength and enhanced slope deforma- et al., 2016). The kinematic monitoring methods mentioned tion (Hasler et al., 2012). Considering the multiple factors above, however, cannot be used for monitoring of permafrost that affect rock slope stability, however, it is generally dif- bodies without movement or surface deformation (e.g., sedi- ficult to attribute individual events to a single one (Huggel ments with medium to low ice contents, rock plateaus, gentle www.the-cryosphere.net/12/759/2018/ The Cryosphere, 12, 759–794, 2018
768                                                                M. Beniston et al.: The European mountain cryosphere

rock slopes). Remote sensing has so far not enabled thermal          The projected increase in permafrost temperatures is
changes in permafrost to be assessed.                             mainly due to the anticipated increase in air temperatures.
   Geophysical methods can detect permafrost and charac-          The latter also causes the snow cover duration to decrease,
terize its subsurface ice and water contents (Kneisel et al.,     thereby reducing the thermal insulation effect (Scherler et al.,
2008; Hauck, 2013). They also provide structural informa-         2013; Marmy et al., 2016). In spite of similar trends in
tion such as active layer and bedrock depths. In recent years,    RCM-driven permafrost studies, comprehensive regional-
repeated geoelectrical surveys have been applied to deter-        scale maps or trends for projected permafrost changes in
mine ice and water content changes, thus complementing            Europe are not available to date. This is partly because of
temperature monitoring in boreholes (Hilbich et al., 2008a;       the insufficient borehole data, but mainly because of the
Pellet et al., 2016). Results from such electrical resistivity    large heterogeneity of the permafrost in European mountain
tomography (ERT) monitoring show that permafrost thaw             ranges. The latter strongly depends on surface and subsur-
in mountainous terrain is often accompanied by a drying of        face characteristics (e.g., fractured and unfractured rock, fine
the subsurface, as the water from the melted permafrost of-       and coarse-grained sediments, porosity), microclimatic fac-
ten leaves the system downslope and is not always substi-         tors (snow cover, energy balance of the whole atmosphere–
tuted in the following summer (Hilbich et al., 2008a; Isak-       active layer system, convection in the active layer, etc.), and
sen et al., 2011). A 15-year ERT time series from Schilthorn,     topo-climatic factors (elevation, aspect, slope angle).
Swiss Alps, shows for example a clear decreasing trend of            The largest and most important impacts related to per-
electrical resistivity, corresponding to ice melt, throughout     mafrost thawing have yet to occur. Along with changes
the entire profile below the active layer (Fig. 4). The corre-    in precipitation, permafrost thawing is projected to affect
sponding temperature at 10 m depth is at the freezing point       the frequency and magnitude of mass wasting processes in
and shows no clear trend. ERT is increasingly used in op-         mountain environments (IPCC, 2012). This is especially true
erational permafrost monitoring networks to determine long-       for processes driven by water, such as debris flows (Stof-
term changes in permafrost ice content (Hilbich et al., 2008b,    fel and Huggel, 2012; Borga et al., 2014). Based on statis-
2011; Supper et al., 2014; Doetsch et al., 2015; Pogliotti        tically downscaled RCM data and an assessment of sediment
et al., 2015).                                                    availability, Stoffel et al. (2011, 2014a, b) concluded that the
                                                                  temporal frequency of debris flows is unlikely to change sig-
2.3.2   Future evolution of European permafrost                   nificantly by the mid-21st century, but is likely to decrease
                                                                  during the second part of the century, especially in summer.
Physically based models of varying complexity are em-             At the same time, the magnitude of events might increase
ployed for process studies of permafrost (for a review see        due to larger sediment availability. This is particularly true in
Riseborough et al., 2008; Etzelmüller, 2013) and specifi-         summer and autumn when the active layer of the permafrost
cally for the analysis of future permafrost evolution. These      bodies is largest, thus allowing for large volumes of sedi-
models should not be confused with permafrost distribution        ment to be mobilized (Lugon and Stoffel, 2010). Acceler-
models (Boeckli et al., 2012; Gisnaas et al., 2016; Deluigi       ations of rock-glacier bodies might play an additional role
et al., 2017), which are statistical and often based on rock-     (Stoffel and Huggel, 2012). Providing projections for future
glacier inventories and/or topo-climatic variables such as po-    sediment availability and release for areas that are experienc-
tential incoming solar radiation and mean annual air temper-      ing permafrost degradation and glacier retreat is particularly
ature. Physically based site-level models are used in combi-      important in the European Alps, where the exposure of peo-
nation with regional climate models (RCMs) for studies of         ple and infrastructure to hazards related to mass movements
long-term permafrost evolution (Farbrot et al., 2013; Scher-      is high (Haeberli, 2013).
ler et al., 2013; Westermann et al., 2013; Marmy et al., 2016),      Finally, it should be noted that in contrast to glacier melt-
similar to land-surface schemes used for hemispheric per-         ing, permafrost thawing is an extremely slow process (due to
mafrost modeling (Ekici et al., 2015; Chadburn et al., 2015;      the slow downward propagation of a thermal signal to larger
Peng et al., 2016). Physically based models are also used to      depths and additional latent heat effects). As permafrost in
explain the existence of low-altitude permafrost occurrences      European mountains is often as thick as 100 m, a complete
(Wicky and Hauck, 2017) and to analyze the dominant pro-          degradation is therefore unlikely within this century.
cesses for the future evolution of specific permafrost occur-
rences in the European mountains (Scherler et al., 2014; Fid-     2.4   Changes in meltwater hydrology
des et al., 2015; Zhou et al., 2015; Haberkorn et al., 2017;
Lüthi et al., 2017). Simulations for different mountain ranges    In spring, summer, and autumn, seasonal snow and glacier
in Europe suggest an overall permafrost warming and a deep-       ice are released as meltwater into the headwaters of the alpine
ening of the active layer until the end of the century (see       water systems. Because of the temporally shifted release of
Fig. 5 for four examples from the Swiss Alps; similar sim-        water previously stored as snow and ice and the significant
ulations from Scandinavia are found in Hipp et al., 2012;         surplus of precipitation compared to the forelands, moun-
Westermann et al., 2013, 2015; Farbrot et al., 2013).             tains have often been referred to as “water towers” (Moun-

The Cryosphere, 12, 759–794, 2018                                                       www.the-cryosphere.net/12/759/2018/
M. Beniston et al.: The European mountain cryosphere 769 Figure 4. 15-year change in specific electrical resistivity (given as % specific resistivity change) along a two-dimensional electrical resistivity tomography (ERT) profile at Schilthorn, Swiss Alps (2900 m a.s.l.). Red colors denote a resistivity decrease corresponding to loss of ground ice with respect to the initial measurement in 1999 (see Hilbich et al., 2008a, 2011, for more details on ERT monitoring in permafrost). The black vertical lines denote borehole locations (modified after Permos, 2016). tain Agenda, 1998; Viviroli et al., 2007). The meltwater con- ones caused by changing spatiotemporal precipitation pat- tribution to streamflow is important for millions of people terns (Blaschke et al., 2011). Nevertheless, understanding downstream (Kaser et al., 2010). The Alps, in particular, are long-term trends in runoff requires an accurate estimate of the water source for important rivers that flow into the North the amount and distribution of snow accumulation during Sea (Rhine), the Black Sea (Danube), and the Mediterranean winter (Magnusson et al., 2011; Huss et al., 2014). The re- Sea (Rhône and Po); a comprehensive overview of the major sponse of snowmelt to changes in air temperature and pre- alpine water systems is given in EEA (2009). cipitation is influenced by the complex interactions between The most important seasonal runoff signal in the Alps climatic conditions, topography, and wind redistribution of is the melt of snow (Beniston, 2012). This is because the snow (López-Moreno et al., 2012; Lafaysse et al., 2014). precipitation distribution is fairly even throughout the year Several national assessments have addressed the hydro- and because the amount of water retained in and released logic changes in alpine river water systems, highlighting im- from reservoirs and lakes is only a small fraction of the to- portant regional differences (FOEN, 2012; APCC, 2014); tal water volume (Schaefli et al., 2007; López-Moreno et al., these reports contain a wealth of specific literature. Regional 2014). Temperature-induced changes in streamflow (such as peculiarities are the result of spatial differences in tempera- rain-to-snow fraction, seasonal shift of snowmelt, and glacier ture and precipitation changes, although other factors such as runoff contribution) are generally better understood than the www.the-cryosphere.net/12/759/2018/ The Cryosphere, 12, 759–794, 2018
770                                                                     M. Beniston et al.: The European mountain cryosphere

Figure 5. Modeled long-term evolution of ground temperatures at 10 and 20 m at four different permafrost sites in the Swiss Alps
(COR: Murtèl-Corvatsch, LAP: Lapires, SCH: Schilthorn, STO: Stockhorn), as simulated with the COUP model (Marmy et al., 2016). The
black lines represent the median scenario and the gray zone the range of the 13 GCM/RCM chains which were used to drive the simulations.
Modified after Marmy et al. (2016).

local land-use changes or river corrections may play a role as        ization is small (Huss, 2011). This is particularly true during
well (EEA, 2004).                                                     summer when specific runoff yield from glacierized areas is
   Compared to snowmelt, the total ice melt volume from               much higher than from non-glacierized ones (Farinotti et al.,
glaciers in the Alps is minor. At subannual scales, however,          2016). In a warming climate with retreating glaciers this also
contributions from glacierized surfaces can be significant            holds for annual scales, as additional meltwater is released
not only for the headwater catchments close to the glaciers           from ice storage that has accumulated over long time peri-
(Hanzer et al., 2016) but also for larger basins where glacier-       ods.

The Cryosphere, 12, 759–794, 2018                                                            www.the-cryosphere.net/12/759/2018/
M. Beniston et al.: The European mountain cryosphere                                                                                    771

Figure 6. Shifts of streamflow regimes for the Rofenache catchment (Austrian Alps, 1891–3762 m a.s.l., 98 km2 , ∼ 35 % glacierization as
of 2006) as simulated with the AMUNDSEN model using downscaled EURO-CORDEX projections for the RCP2.6, RCP4.5 and RCP8.5
scenarios. Solid and dashed lines indicate the multimodel mean total and ice melt runoff, respectively, and shaded bands indicate the climate
model uncertainty shown as ±1 SD. Adapted from Hanzer et al. (2017).

   In general, it can be stated that in large catchments the             many streams utilized for hydropower generation, this phe-
ice melt component in streamflow results from the contri-                nomenon can be superimposed by the effects of discharge
bution of many individual glaciers of varying size and set-              regulation. The regimes in Fig. 6 indicate that (a) the effect
ting. At the decadal or longer scale, the ice melt from these            of warming increases after the middle of the century for all
individual glaciers might be rising or declining, depending              scenarios, (b) the effect is of the same order of magnitude
on glacier size and climatic trend, but as a result of the su-           as the one of the choice of climate model, and (c) the tim-
perposition of the many different contributions the resulting            ing of the maximum contribution of ice melt to streamflow –
streamflow of a regional, glacierized catchment might not                referred to as “peak water” – has already passed, i.e., that
show a long-term trend, as has been simulated for the Rhine              the effect of declining glacier area already overrides the in-
(KHR/CHR, 2016), for example. In this latter study, glaciers             creasing melt caused by rising temperatures. The time of oc-
were considered according to a further developed δh method               currence for “peak water” mainly depends on the size of the
(Huss, 2010), allowing for both glacier retreat and transient            glacier and can hence differ for adjacent catchments (Hanzer
glacier advances as required in long-term simulations: daily             et al., 2017). Until the middle of the century and for large
fractions of the rain, snowmelt, and glacier ice melt com-               scales, the decrease of annual streamflow due to glacier re-
ponents of streamflow were determined for the Rhine basin                treat is expected to be small.
from 1901 to 2006, with highest ice melt contributions dur-                 By 2100, the glaciers in the Alps are projected to lose up
ing the periods with negative mass balances in the 1940s and             to 90 % of their current volume (Beniston, 2012; Pellicciotti
1980s.                                                                   et al., 2014; Hanzer et al., 2017). By then, peak discharge is
   Scenarios of changing streamflow affected by retreating               likely to occur 1–2 months earlier in the year (Horton et al.,
glaciers in a warming climate have recently been devel-                  2006) depending on carbon-emission scenarios. In Switzer-
oped in various physically based, distributed modeling ex-               land, a new type of flow regime called “pluvial de transi-
periments (Weber and Prasch, 2009; Prasch et al., 2011;                  tion” (transition to pluvial) was introduced to classify such
Hanzer et al., 2017). Figure 6 illustrates future streamflow             newly emerging runoff patterns (SGHL/CHy, 2011; FOEN,
of a currently highly glacierized catchment (roughly 35 %                2012). Regime shifts have long been recognized and can be
glacierization) in the Austrian Alps. Even for the moderate              interpreted as the prolongation of observed time series – the
RCP2.6 scenario (IPCC, 2013), which corresponds roughly                  longest one in the Alps being the recorded water level and
to the COP-21 “2 ◦ C policy”, the glacier melt contribution              streamflow discharge of the Rhine River in Basel since 1808.
to runoff becomes very small by the end of the century. In               Some investigations, however, show that annual runoff totals
the second half of the century, summer runoff amounts de-                may change only little, as the overall change resulting from
crease strongly with simultaneously increasing spring runoff.            reductions in snow and ice melt, changing precipitation, and
While in the RCP2.6 scenario the month of peak runoff re-                increased evapotranspiration is unclear (SGHL/CHy, 2011;
mains unchanged, RCP4.5 and RCP8.5 project the peak to                   Prasch et al., 2011). Other studies, instead, highlight the sig-
gradually shift from July towards June. Alpine streamflow                nificance of future regime shifts in headwater catchments
will hence undergo a regime shift from glacial/glacio-nival              (Pellicciotti et al., 2014). Obviously, the complex interplay
to nivo-glacial, i.e., the timing of maximum discharge will              of snow and ice melt contribution to discharge in a chang-
generally move from the summer months to spring (Benis-                  ing climate, combined with the other processes determining
ton, 2003; Jansson et al., 2003; Collins, 2008; Farinotti                the streamflow regime, and their scale dependencies are not
et al., 2012; Prasch et al., 2011; Hanzer et al., 2017). For             yet fully understood. There is general consensus that only

www.the-cryosphere.net/12/759/2018/                                                                The Cryosphere, 12, 759–794, 2018
You can also read