Metals for a Climate Neutral Europe - A 2050 Blueprint - The Institute for ...
←
→
Page content transcription
If your browser does not render page correctly, please read the page content below
Metals for a Climate Neutral Europe
A 2050 Blueprint
in

     Authors
          Tomas Wyns
          Senior Researcher, IES-VUB
          Tomas.wyns@vub.be
          Gauri Khandekar
          Doctoral and Project Researcher, IES-VUB
          Gauri.khandekar@vub.be

     About the IES
        The Institute for European Studies (IES) at the Vrije Universiteit Brussel (VUB) is an
        academic Jean Monnet Centre of Excellence and a policy think tank that focuses on the
        European Union in an international setting. The Institute advances academic education
        and research in various disciplines, and provides services to policy-makers, scholars,
        stakeholders and the general public.
METALS IN A CLIMATE NEUTRAL EUROPE - A 2050 BLUEPRINT

Table of Contents

1.    Executive Summary                                                              7   5.     Non-Ferrous metals: production processes, energy use and greenhouse gas emissions 40
1.1   Key Findings                                                                   8   5.1    Non-ferrous metals production: electro-intensive production processes                          40
1.2   Introducing the Metals Ecosystem                                              10   5.2 Aluminium                                                                                          41
1.2.1 An integrated network of operations                                           10   5.3 Copper                                                                                            43
1.2.2 Metals - The foundation of low-carbon value chains                            12   5.4 Zinc                                                                                              45
1.3   A ‘price-taker’ industry operating in a truly global marketplace              13   5.5 Nickel                                                                                             47
1.4   A frontrunner industry towards a 2050 Climate-Neutral Europe                  14   5.6 Silicon, Ferro-Silicon and Ferro-Manganese                                                        48
1.5   Regulatory challenges for a bellwether industry 17
                                                                                          6.     GHG Mitigation Technologies towards climate neutrality in non-ferrous metals production 51
2.    Introduction                                                                  18   6.1      Introduction                                                                               51
2.1   Introduction to project, context and goal                                     18   6.2      Decarbonisation of the EU power sector                                                     51
                                                                                          6.3      Energy efficiency                                                                         52
2.2 Scope                                                                           18
                                                                                          6.4      New processes in primary aluminium production (incl. copper electrolysis)                 53
2.3 Methodology18                                                                        6.5      Further electrification of processes                                                      55
                                                                                          6.6      Hydrogen as smelting reducing agent                                                       55
3.    The Metals Ecosystem                                                          20
                                                                                          6.7      Bio-based fuels and other fuel switching                                                  56
3.1. Introduction to non-ferrous metals                                             20   6.8      Carbon Capture and Utilisation or Storage CC(U)S                                          56
3.1.1 The non-ferrous metals eco-system                                             20   6.9      Enhanced metals recovery from secondary raw materials
                                                                                                   (mining residues, slag, sludges and scrap recovery)                                        57
3.1.2 Production of non-ferrous base metals in the EU                               21   6.10     Sector coupling: demand response and waste heat usage outside of non-ferrous metals produc-
3.1.3 Mining metal ores and raw materials in the EU                                 22   tion                                                                                               60
3.2 EU Metals Production in a Global Context                                        23   6.11     Other technology breakthroughs enabled by NFM                                             62
                                                                                          6.12     Conclusions                                                                               63
3.2.1 EU production versus other large metals producers                             23
3.2.2 The EU’s import reliance and metals trade balance                             24   7.     Non-ferrous metals, a bellwether industry: challenges for non-ferrous metals
3.3 Non-ferrous metals of strategic importance for essential EU value chains        27          production on the pathway to EU climate neutrality67
3.3.1 Main downstream applications (sectors) of non-ferrous metals                  27   7.1    Introduction: the pitfalls of a frontrunner industry                                           67
3.3.2 Non-ferrous metals are essential in all value chains for climate neutrality   29   7.2    Electro-intensive processes: local power pricing versus global metal markets                   67
3.4 Non-ferrous metals in the EU: a frontrunner in the circular economy             32   7.3    Trade related issues                                                                            71
3.4.1 The EU has high metals recovery and recycling rates for metals                32   7.4    Other regulatory challenges72
3.4.2 Potential for higher levels of metals circularity in the EU                   33
                                                                                          8.     Industrial policy for non-ferrous metals towards a climate neutral economy:
3.4.3 The impact of a growing metals in-use stock on secondary production           34
                                                                                                 the canary that survives the coalmine                                                          74
3.4.4 Conclusions35
                                                                                          8.1    Introduction (summary of contributions and challenges)                                          74
4.    Price takers in a global market                                               37

3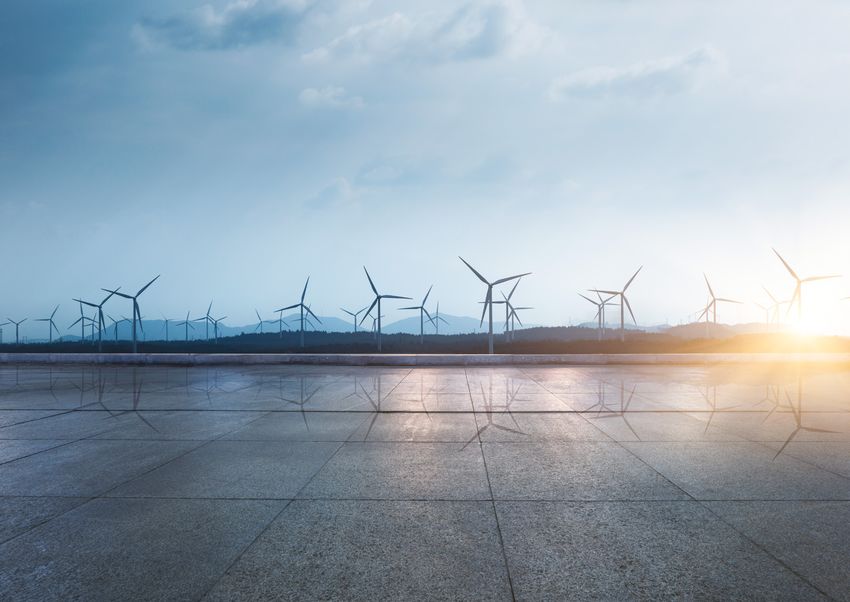
METALS IN A CLIMATE NEUTRAL EUROPE - A 2050 BLUEPRINT

    8.2 Non-ferrous metals powering and powered by a carbon free
          electricity system                                                  74
    8.3 Supporting climate friendly innovation and investments                76
    8.4 Nurturing future value chains, circularity and industrial symbiosis   77
    8.5 Assertive EU trade and competition policies                           78
    8.6 Strategic regulatory alignment79
    9.    Bibliography                                                        81

    10. List of Abbreviations                                                 86

    11.   Annex                                                               87
          List of contributors                                                87

4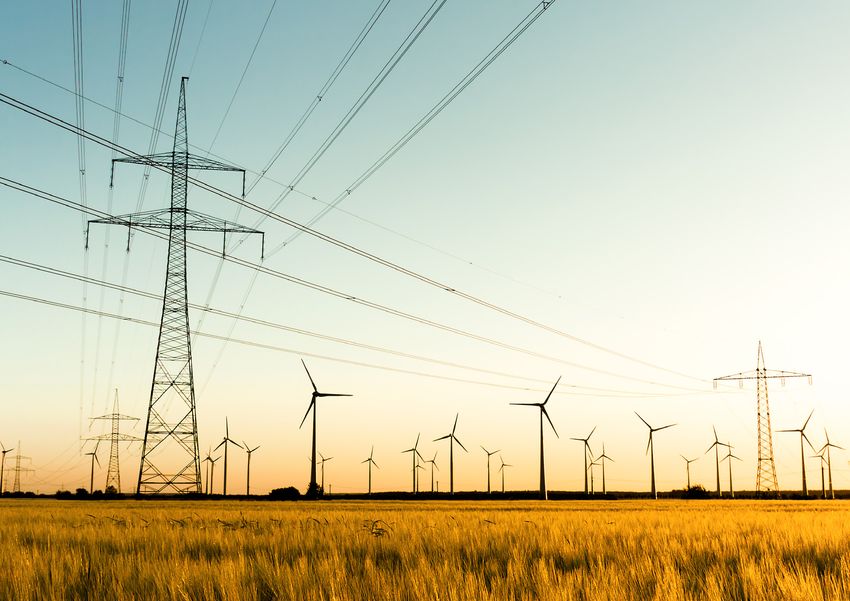
METALS IN A CLIMATE NEUTRAL EUROPE - A 2050 BLUEPRINT

Table of Figures, Tables and Boxes

    Boxes                                                                                            Figure 9: End Sectors of Base Metals                                                  27
    Box 1: Flanders Metals Valley – example of non-ferrous metals ecosystem                    21   Figure 10: End Sectors of Precious Metals                                             28
    BOX 2: China’s market domination                                                           26   Figure 11: End Sectors of Speciality Metals                                           28
    Box 3: EU Battery Alliance                                                                 30   Figure 12: End Sectors of Rare Earth Metals                                           29
    Box 4: Non-ferrous metal stock in Germany                                                  34   Figure 13: EU Battery Alliance Action Plan                                             31
    BOX 5: The smelting business model and LME pricing                                         38   Figure 14: Metals Green Value Chain                                                    31
    BOX 6: Glencore Nikkelwerk – energy savings                                                52
                                                                                                     Figure 15: % of primary (first columns) and secondary (second columns) base
    BOX 7: Energy efficiency innovation in copper production                                   52   metals production in total base metals production EU (left) and the Rest of the
    BOX 8: Norsk Hydro’s Karmoy Technology plant                                               53   World (right).. Source: Sector data. For zinc and nickel the figure only uses the
    BOX 9: Elysis – Alcoa/Rio Tinto                                                            54   ratio primary and secondary feedstock entering primary refineries while with
                                                                                                     total zinc production from secondary sources is much higher (this includes
    Box 10: An Organic Rankine Cycle project in the ferro-alloy Industry – Finnfjord           57
                                                                                                     metal scrap remelting processes in the recycling industry) . For copper: based
    BOX 11: TRIMET virtual battery pilot                                                       60   on Fraunhofer ISI, 2013 and OECD 2018: copper flowcharts (Global 2016, EU 2015) 33
    BOX 12: Zinc smelter virtual battery                                                       61
                                                                                                     Figure 16: EU Scrap Trade, Source: Comtrade                                           33
    BOX 13: Aurubis Hamburg district heating                                                   61
                                                                                                     Table 6: Distribution of Stocks, Source: JRC, 2018a, Nickel Institute, 2012           34

    Figures                                                                                          Figure 17: Evolution of LME prices for Aluminium (top left), Copper (top right),
                                                                                                     Zinc (bottom left) and Nickel (bottom right) Source: LME                              38
    Figure 3: Flanders Metals Valley                                                           21
                                                                                                     Figure 18: Evolution of final energy use in the non-ferrous metals industry (PJ)
    Figure 4: European Base Metal ore mining,Tonnes. Source: World-Mining-Data, C.                   (Source: Eurostat EU energy balances 2018 edition)                                    40
    Reichl, M. Schatz, G. Zsak, Volume: 31, Minerals Production, Vienna 2016                   22
                                                                                                     Figure 19: Fuel shift between 1990 and 2017 in the non-ferrous metals industry
    Figure 5: EU Primary Production as a % of World Production (tonnes), Base metals                 final energy use (Source: Eurostat EU energy balances 2018 edition)                   40
    data 2016, Source: USGS, 2017, World Bureau of metals, ILZSG, Nickel Institute,
                                                                                                     Figure 20: Relative shares of energy carriers in the final energy use of select
    Comtrade. I Other metals        average for 2010-2014 Source: European Commis-
                                                                                                     energy intensive industries (2017) (Source: Eurostat, 2018)                           40
    sion 2017a, 2017b.                                                                         23
                                                                                                     Figure 21: (left) GHG emissions (Mt-CO2 - eq) of the non-ferrous metals industry
    Figure 6: EU Non-Ferrous Metal Ores Import Reliance Source: European Commis-
                                                                                                     (Sources: EEA (direct process emissions), Eurostat (direct emissions related
    sion, 2018                                                                                 25
                                                                                                     to energy use) and EEA (indirect emissions using EU average CO2 intensity of
    Figure 7: EU Non-ferrous metals trade (Ktonnes) timeseries, Source: Resource Trade Earth   25   power production) (right) Evolution of CO2 intensity of the EU power produc-
    Figure 8: China and EU production of base metals time series (metric tonnes)                     tion (t CO2/MWh) (Source: EEA)                                                         41
    Source: BGS                                                                                26   Figure 22: Primary production of aluminium – electrolysis cell (source: CIES, N.D.,) 42

5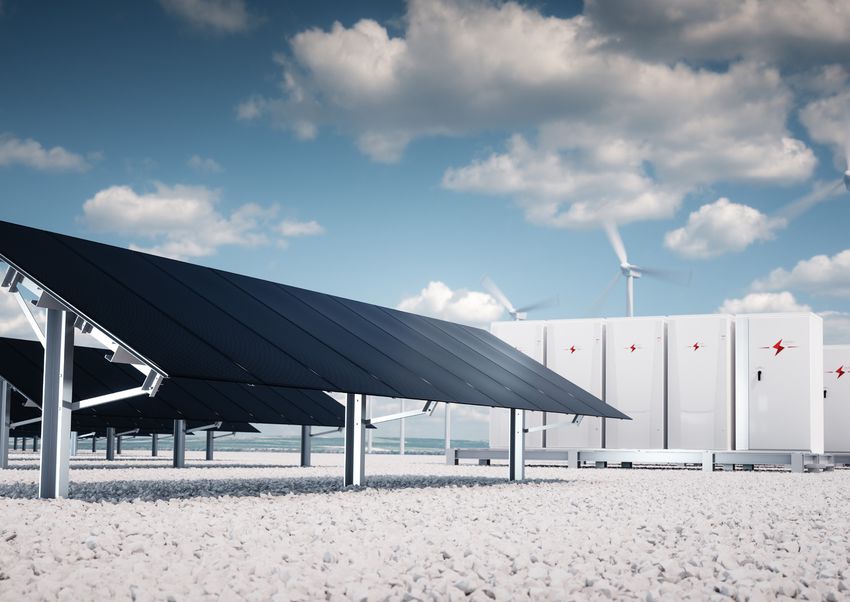
METALS IN A CLIMATE NEUTRAL EUROPE - A 2050 BLUEPRINT

    Figure 23: (left) Evolution of GHG emissions from EU28+EFTA aluminium production               EUR/t copper cathode (2013) (Source:JRC, 2016)                                             69
    (Mt CO2-eq) (Sources: European Aluminium) (right) Average electricity use in primary           Figure 40: (left) electricity use per tonne liquid aluminium (MWh/t) (2013) (right)
    and secondary                                                                                  electricity use per tonne zinc (MWh/t) (2013) (Source:JRC, 2016)                           69
    aluminium production (MWh/t Al) (Source: Ecofys et al., 2009)                            42
                                                                                                   Figure 41: (left) Electricity use per tonne copper anode (MWh/t) (2013) (right) electric-
    Figure 24: Evolution of aluminium process emissions (PFC and CO2 emissions from                ity use per tonne copper cathode (MWh/t)(2013) (Source:JRC, 2016)                          69
    anode consumption. CO2-eq) (Source: EEA, 2019)                                           43
                                                                                                   Figure 42: CO2 intensity of metals production - EU vs. China (t CO2/t metal)               70
    Figure 25: Since 2002, 10 out of 26 aluminium smelting facilities closed in the EU
    (source: European Aluminium)                                                             43   Figure 43: 2050 scenario’s for aluminium production. (left) direct CO2 emissions t
                                                                                                   CO2/t cast aluminium, (right) energy use GJ/t primary aluminium (Source: JRC, 2015)        70
    Figure 26: Evolution of direct and indirect emissions from copper production in the
    EU 28 (Mt CO2-eq) (Source: European Copper Institute)                                    45   Table 8: Industrial policy framework for the sustainable transition of the non-ferrous
                                                                                                   industry to a climate neutral Europe                                                       79
    Figure 27: (left) Direct emissions of Zinc production (source: Ecofys, 2009b), (right)
    energy use per tonne of zinc (Source: Brook Hunt a Wood Mackenzie Company)               46   Table 7: Summary of technology options for GHG reductions in the non-ferrous
                                                                                                   metals industry                                                                            65
    Figure 28: CO2-eq emissions from Zinc production (Mt CO2-eq) in the EU and Norway
    (Source: International Zinc Assocation)                                                  46
    Figure 29: CO2-eq emissions in Nickel production (EU28 + Norway) (Source: Nickel               Tables
    Institute)                                                                               48
    Figure 30: Submerged electric arc furnace (source: Elkem)                                48   Table 1: Key non-ferrous base metals by-products                                           21

    Figure 31: Specific direct and indirect CO2 emissions for Silicon (left), Ferro-Silicon        Table 2: Top 3 metals producing countries and top 3 EU import partners. Source:
    (middle) and Ferro-Manganese (right) (source: Euroalliages) (EU+EFTA)                    49   JRC 2017, BGS 2016 (Zinc – import of refined zinc. Source: Comtrade)                       23
                                                                                                   Table 3: Top 3 metals-ores producing countries and top 3 EU import partners. Fig-
    Figure 32: Emission reductions (hypothetical) of the EU non-ferrous metals industry            ures for 2016, Source: European Commission, 2017 a&b, BGS, Tin Source: Resource
    if decarbonisation of the EU power sector occurs (using 2015 emissions)                  51   Trade Earth, Nickel Mining (2019) Source: Da Silva, 2019                                   24
    Figure 33: Direct vs indirect emissions (%) - based on emissions data                    51   Table 4: End-of-life recovery rates by end-sectors and metals recycled. Source:
    Figure 34: Main energy savings options (representing a total of 70% of the technical           Eurometaux                                                                                 32
    potential) in the non-ferrous metals industry, Source: ICF 2015                          52   Table 5: World and EU Secondary Production 2016 (Kt) I Source: World Bureau of Metals 33
    Figure 35: Norsk Hydro primary aluminium production (source: Norsk Hydro)                53
    Figure 36: Average electricity use per tonne metal (MWh/t)                               68
    Figure 37: Electricity costs as % of total production costs                              68
    Figure 38: (left) Production costs EUR/t cast aluminium (2013) (right) Production
    costs EUR/t zinc slab (2013) (Source:JRC, 2016)                                          68
    Figure 39: (left) Production costs EUR/t copper anode (2013) (right) Production costs

6
METALS IN A CLIMATE NEUTRAL EUROPE - A 2050 BLUEPRINT

1. Executive Summary

                       Europe’s energy transition will require higher quantities of metals. Indeed, non-ferrous
                       metals represent the building blocks of every conceivable climate technology including
                       batteries, clean mobility, energy-efficient buildings, solar panels, and wind turbines.
                       The climate transition will challenge Europe’s industries to decarbonise in only one busi-
                       ness cycle. The European non-ferrous metals industry has already made significant step
                       changes since 1990, resulting in high levels of electrification and circularity. The sector’s
                       further progress must now be supported by an EU industrial policy, which enables it to
                       meet EU 2050 climate-neutrality objectives while thriving against global competition.
                       This study was commissioned by the non-ferrous metals industry and represents its consoli-
                       dated contribution to the EU’s 2050 climate-neutral strategy. The study provides a compre-
                       hensive assessment of the EU’s industrial metals ecosystem, including the sector’s potential
                       in the transition to climate-neutrality, and the challenges and constraints that will be faced
                       along the way.

7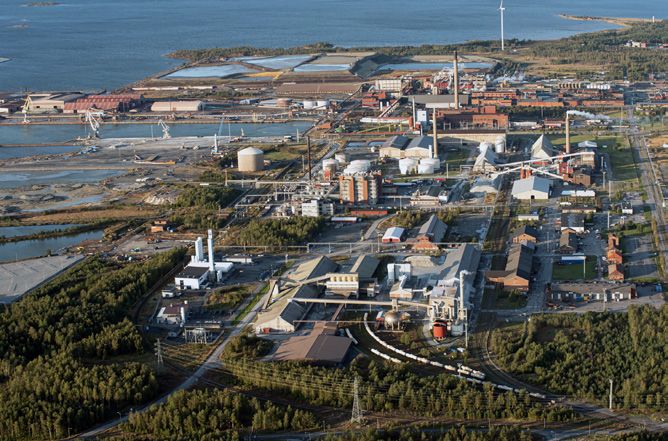
METALS IN A CLIMATE NEUTRAL EUROPE - A 2050 BLUEPRINT

1.1     Key Findings

         The study reaches the following conclusions about Europe’s non-ferrous metals ecosystem,
         and its prospects for contributing to the climate-neutral transition.

    1      Europe’s metals ecosystem - a frontrunner industry in the transition to                                                                                                                                                  Historical progress
           climate-neutrality
                                                                                                                                                                                                           58% % electricity in energy mix 1
             • High levels of electrification (shifting away from carbon-intensive processes), with a 58% share of electricity
               in the sector’s overall energy use
             • High levels of historical emissions reduction, with a 61% improvement on 1990 levels                                                                                                        61% overall GHG reduction
             • High levels of circularity, with around 50% of Europe’s production of base metals now coming from                                                                                           since 19902
               recycled sources
                                                                                                                                                                                                           50% of EU base metals
                                                                                                                                                                                                           production from recycling3

    2      Europe’s metals ecosystem - major potential to further reduce its carbon footprint,                                                                                                                                             2050 potential
           with the right framework conditions
                                                                                                                                                                                                           81% total GHG reduction (vs 1990)
             • Potential for an 81% overall reduction in greenhouse gas emissions (vs. 1990 levels), once indirect emissions have                                                                          in a decarbonised power system4
               been eradicated in a decarbonised EU power sector 5
             • Theoretical potential for further reducing direct GHG emissions, through the deployment of private and public                                                                              8 priority technologies for
               support for incremental and breakthrough technologies. A detailed analysis of various technologies is provided                                                                             reducing remaining emissions
               in the report
             • Higher volumes of recycled metals being made available, with a lower lifecycle CO2 footprint compared to primary                                                                           50% projected increase in
               extraction and production                                                                                                                                                                  secondary aluminium & copper6

                                               1
                                                   Eurostat, 2018, 2 EEA & Eurostat, 3 UNEP 2013, 4 5 EEA & Eurostat. Assuming that indirect emissions will hence be reduced to zero and direct emissions stay at same level as in 2015 European Aluminium, 2018 & OECD, 2018,

8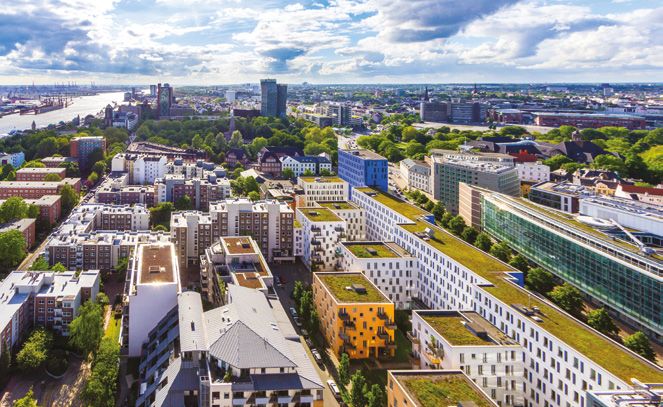
METALS IN A CLIMATE NEUTRAL EUROPE - A 2050 BLUEPRINT

    3   Europe’s metals ecosystem - exposed to significant levels of international competition,                                                                                                                                  Global competition
        because metals are a globally traded commodity
                                                                                                                                                                                                       >60% import dependence
        The sector’s strategic status and globally-set pricing mechanisms means it faces high international competition:                                                                               for almost all metals 7
         • Europe is already highly dependent on imports of primary raw materials, with other value chain stages
           under pressure                                                                                                                                                                             30-54% - China's global market
         • China’s share of non-ferrous metals production has grown dramatically in the last 15 years, largely based                                                                                  share for all base metals 8
           on coal-powered electricity
         • This makes the threat of EU production being replaced by more carbon-intensive non-EU production very real.
                                                                                                                                                                                                      2.5 - 8 times more carbon-intensive
                                                                                                                                                                                                      Chinese production due to
                                                                                                                                                                                                      coal-powered electricity 9

    4   Europe’s metals ecosystem - facing specific regulatory challenges from the transition                                                                                                                          Importance of electricity
        of Europe’s power sector
                                                                                                                                                                                                      4-15.4 MWh electricity used per tonne
        The sector’s high electro-intensity means that while it has major potential for emissions reductions, it is also                                                                              of product in primary production 10
        particularly susceptible to the impacts of a decarbonising EU power system.
         • The industry’s use of electricity is higher than any other energy-intensive sector (per tonne of product & as a                                                                            20-40% - Electricity as a percentage
           percentage of production costs)                                                                                                                                                            of metals production costs 11
         • Indirect carbon costs from the Emissions Trading System already disadvantage the sector vs. international
           competitors, and require adequate compensation
                                                                                                                                                                                                      5X more impacted by electricity
         • Looking ahead, the sector’s key enabling factor for the transition will be the abundant availability of carbon-
           neutral electricity at globally competitive prices.
                                                                                                                                                                                                      costs vs overall manufacturing sector 12

    5   Europe’s metals ecosystem - a sector whose 2050 future can be secured with
        a dedicated industrial strategy
        Europe can enable the non-ferrous metals sector’s competitive transition to a climate-neutral economy -
        alongside its dependent value chains - through a horizontal industrial strategy ensuring:
         • Competitively-priced and abundant carbon-free electricity,
         • Innovation and investments support,
         • Enhanced value chains & industrial symbiosis,
         • Assertive trade and competition policies
         • Ambitious Circular Economy policy.

                                                     7
                                                         European Commission 2018, 8 Quanxun, 2017, Xiuxia, 2017, Taube, 2017, 9 European Aluminium, The Nickel Institute et al., 2017 , 10 Eurostat, EU + EFTA, 11 CEPS, Ecofys, Ecorys, JRC, 12 CEPS, Ecofys, Ecorys, JRC

9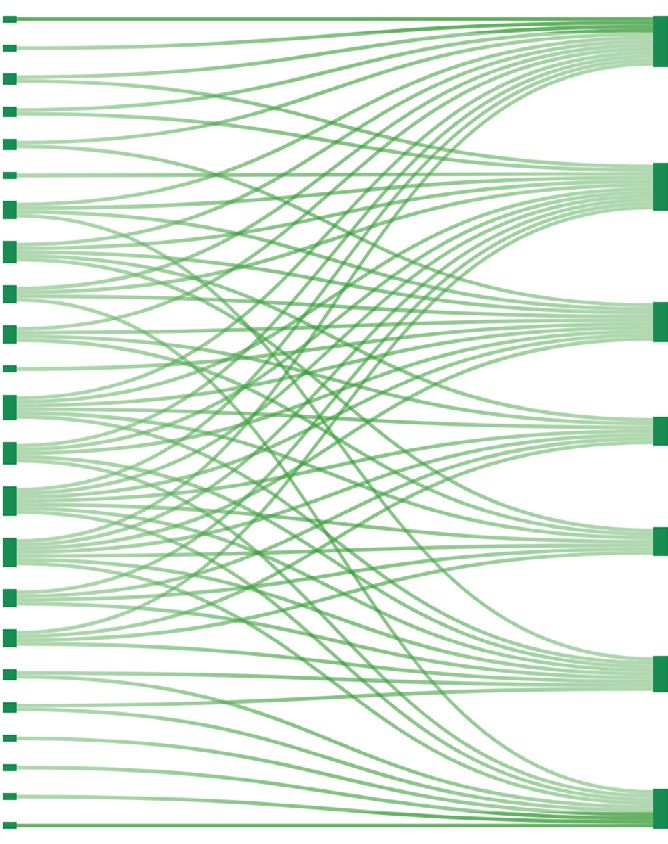
METALS IN A CLIMATE NEUTRAL EUROPE - A 2050 BLUEPRINT
1.2 Introducing the Metals Ecosystem
1.2.1 An integrated network of operations
Europe’s non-ferrous metals industry is an intricate ecosystem of mining, smelting, trans- Europe’s metals recycling industry however is a real world-leader with a 24% market
formation, refining, and recycling operations across the continent. With around 500,000 share, although other regions are making significant investments into new capacity 14.
employees across over 900 facilities, it produces and recycles the base, precious & The non-ferrous metals sector is an eco-system in itself, given the strong interlinkages
specialty metals demanded by Europe’s low-carbon value chains of the future13. between diverse metals during smelting, refining and recycling processes. Metal ores
Europe is mostly dependent on imports of its primary raw materials, accounting for only consist of various elements that commonly co-exist, which means that during refining of
1% of global mining production for base metals, while primary smelting and refining base metals, a number of co-elements may be separated so long as their value out-
operations account for 6% of the global total but are increasingly pressurised by global weighs the cost. Recovery also happens in recycling processes which provide secondary
competition & trade imbalances. raw materials.
Non-ferrous base metals produced and/or recycled in the EU
Al - 0.6%
EXTRACTION
Mining metal ores from the surface of the earth and 1 % Cu -
Ni -
4.1%
3.0%
separating them into concentrates Pb - 9.7%
of world total* Zn - 5.4%
S M E LT I N G / R E F I N I N G
6 %
Al -
Cu -
4.0% **
13.1% €120 billion
Treating primary ores and concentrates to separate the Ni - 9.6% annual turnover
Pb - 9.4%
500 000 persons
metals and refine into a purer form
of world total* Zn - 13.4%
directly employed
T R A N S F O R M AT I O N % Share of
900+ facilities
figures global
Processing pure metal into semi-finished and finished not currently
production
available
products (e.g. sheets, rods, extrusion) per metal
across Europe
Al - 30%
RECYCLING 24% Cu -
Ni -
23%
29%
Treating & refining secondary raw material
Pb - 18% Source: Eurometaux
(e.g. scrap, products)
of world total* Zn - 19% *aggregated global share for Europe’s base metals capacity
(aluminium, copper, lead, nickel, zinc)
13
Eurometaux, 14 European Aluminium, European Copper Institute, International Zinc Study Group, International Lead Association, Nickel Institute, **Around 7% including EFTA
10METALS IN A CLIMATE NEUTRAL EUROPE - A 2050 BLUEPRINT
Non-ferrous metals produced and/or recycled in Europe
Tennessine
Base Metals: Precious metals: Specialty metals:
The backbone for Europe’s economic infrastructure and prod- Available for centuries, the rarity of precious metals has Used in small volumes, these often rare metals are essential
ucts, these metals are used in large and increasing quantities. traditionally given them a high economic value. Today they are for the production of high-technology devises and low-carbon
Base metals act as “carriers” for a range of other metals. used in various high-technology applications including solar technologies. Almost all specialty metals are by-products of
panels, electronics & fuel cells. base metals production.
Rare Earth Metals are used across European industries, but do not yet themselves have a major domestic manufacturing base
11METALS IN A CLIMATE NEUTRAL EUROPE - A 2050 BLUEPRINT
1.2.2 Metals - The foundation of low-carbon value chains
The transition to a climate-neutral Europe can only be achieved with sufficient amounts batteries, clean mobility (hybrid, electric & fuel cells), and renewable energy (wind, solar).
of non-ferrous metals. For example, the World Bank in 2017 projected that 300% more Doing so will require that Europe holds and expands its market share across all stages of
metals will be demanded by the world’s wind turbines by 2050, 200% more metals for the raw materials value chain: extraction, processing, and recycling.
solar panels, and 1000% more metals for batteries15.
Europe’s domestic supply of precious and critical metals is in a large part dependent on an
The European Commission has therefore set itself an objective to further develop its raw industrial base for producing and recycling the basic metals: aluminium, copper, lead, nickel
materials value chains, to meet growing demand for low-carbon technologies - including and zinc. These metals are “carriers” for other essential metals ranging from cobalt to gold.
Supplying Europe’s low-carbon technologies through an integrated metals ecosystem
Al
Aluminium
Ga
Gallium
Batteries
ZnZinc
Ge In Se Cd Ag Co
Germanium Indium Selenium Cadmium Silver Cobalt
Solar
Power
Ni
Nickel
Au Pt Pd Cu Co Os Ru Ir
Gold Platinum Palladium Copper Cobalt Osmium Ruthenium Iridium
Wind
Cu
Copper
Pt Pd Mo Te Se Co Au Ag Os Ru Ir
Power
Platinum Palladium Molybdenum Tellurium Selenium Cobalt Gold Silver Osmium Ruthenium Iridium
PbLead
Ge In Se
Clean
Mobility
Germanium Indium Selenium
Sn Tin
Ta In Electronics
Tantalum Indium
& Grid
Si Li Mn W Nd Dy + other Rare Earth metals Plus other applications including energy-efficient
Lithium Manganese Tungsten Neodymium Dysprosium buildings, aerospace, CCS & more
Silicon
15
World Bank - The Growing Role of Minerals and Metals for a Low Carbon Future, 2017
12METALS IN A CLIMATE NEUTRAL EUROPE - A 2050 BLUEPRINT
1.3 A ‘price-taker’ industry operating in a truly global marketplace
Europe’s metals ecosystem operates in a truly global market. The non-ferrous metals
industry is the only basic materials sector that sees consolidated global price setting
for most of its products, with the London Metal Exchange (LME) being a crucial pricing
instrument. These global price setting dynamics mean that EU producers cannot pass
on unilateral regional costs (such as EU regulatory costs) to its customers without losing
market share.
Alongside internationally set prices, Europe has a significant import dependency for all
metals ores and concentrates, including 100% import reliance for several specialty metals
and rare earths16. Europe also imports far more primary metal than it exports.
There is strong evidence for major state-aid interventions and support in metals production
outside of the EU, in particular in China. As an example, a recent OECD report concluded
that 85% of subsidies in the aluminium sector went to 5 Chinese companies. Such actions
have resulted in excess capacities in China for aluminium, silicon and several other metals
- at the same time as European production has stalled (e.g. over 30% of Europe’s primary
aluminium production capacity has been idled since 2008).
China’s market dominance for non-ferrous metals (% share 2016) Production of Non-Ferrous Metals, EU vs China (Millions of tonnes)
Aluminium Copper Lead Nickel Zinc Cobalt 50
40
China Total EU Total
54% 35% 42% 30% 46% 48% 30
20
10
+44% +15% +5% +15% +13% +13%
1990 2017
% share change 2008-2016
Source: Taube, 2017 Source: British Geological Survey
16
European Commission Critical Raw Materials factsheet, 17 OECD - Measuring distortions in international markets: the aluminium value chain, 2019
13METALS IN A CLIMATE NEUTRAL EUROPE - A 2050 BLUEPRINT
1.4 A frontrunner industry towards a 2050 Climate-Neutral Europe
Europe’s non-ferrous metals industry is a genuine frontrunner industry in the transition to Historical evolution of EU non-ferrous metals industry greenhouse gas emissions,
a climate-neutral society. It has made several important step changes in recent decades, 1990-2015 21 (Mt CO₂e)
which will form a major part of decarbonisation pathways for other energy-intensive sectors
and industry overall. 95.3 Indirect Emissions Direct Emissions
42.9
61%
62.9 reduction in overall greenhouse
31,8 gas emissions since 1990
H I G H L E V E L S O F E L E C T R I F I C AT I O N
The non-ferrous metals industry is the most electrified of all 52.4 37,0
58 %
energy-intensive industries, with a 58% share of electricity use in 18,9
its overall energy consumption.18 31.2
18,1
HIGH REDUCTION IN OVERALL EMISSIONS 1990 2005 2015 Sources: EEA & Eurostat
-61% The non-ferrous metals industry has reduced its absolute emissions 2016 2050
European primary production of non-ferrous metals also has lower GHG emissions than
by 61% since 1990, matched only by the chemicals sector.19
other areas of the world, especially compared to China where base metals production
can be up to 8 times more CO2 intensive (largely due to the high use of coal in the power
mix)
HIGH LEVELS OF CIRCULARITY Carbon footprint of primary metals production, EU vs China (tCO2)
50 The non-ferrous metals industry has already achieved high levels
%
of circularity for base metals, with over 50% of Europe’s domestic
x8
supply now coming from recycled sources.20
x 2.8
x 3.4 x 2.5
7.0 20.0 9.0 70.0 3.4 11.6 2.4 6.1
Aluminium Nickel Silicon Zinc
Sources: European Aluminium, The Nickel Institute, AlloyConsult, Congcong Qi, et al., 2017
18
Eurostat, 2018, 19 EEA, Eurostat (complemented by commodity association data) 20 Eurometaux, UN COMTRADE, 21 Emissions profile for EU production of aluminium, copper, lead, nickel, zinc, and Silicon/Ferro-alloys
14METALS IN A CLIMATE NEUTRAL EUROPE - A 2050 BLUEPRINT
EU primary metals production – high potential for further GHG mitigation Europe’s metals recycling - high potential for further circularity
There is a theoretical potential for the non-ferrous metals industry to reduce its GHG European recycling volumes for metals are projected to increase significantly due to
emissions by more than 90% compared to 1990 levels. The most important mitigation will higher quantities of metals becoming available from Europe’s in-use stock. An ambitious
come from the decarbonisation of the EU power sector which according to EU data could EU Circular Economy agenda will help to maximise recycling volumes, improve yields, &
reduce the remaining emissions from EU non-ferrous metals production by 51%, based on boost competitiveness.
2015 emissions and production figures. This alone would lead to a theoretical 81% total Higher recycling volumes will lower the metals industry’s overall carbon footprint on a
reduction of the sector’s emissions compared with 1990 levels. lifecycle basis, as recycling processes require less energy than extraction and primary
For the industry’s remaining emissions, there are a wide-range of technological options production operations (although recycling of some metals from complex waste fractions
with major potential for achieving GHG reductions in line with climate-neutrality by 2050 could incur higher energy requirement due to low metal concentrations and/or small
(see full table overleaf). The successful research, development, upscaling and deploy- volumes).
ment of these technologies needs a fully integrated industrial strategy, underpinned Europe’s additional recycled metals are not projected to replace its existing demand for
by a strong governance framework. This will require addressing the R&D and financing primary metal in the timeframe considered by this report (until 2050), due to Europe’s
challenges, fostering the creation of markets for climate neutral, circular products, and increasing demand for metals and the large amounts of metals found in stock with
securing access to abundant, low-carbon energy and non-energy sources at affordable long-lifetime applications (e.g. buildings).
Potential evolution of EU non-ferrous metals industry greenhouse gas emissions from a Projected increase in EU aluminium and copper scrap volumes, 2015-2050 (Mt)
- 81%
decarbonised power system (Mt CO₂e)
2015 2050
1990
95.3 81% overall reduction potential
from 1990 levels (historical progress
42.9
& decarbonised power)
Al 4.5 Mt
9 Mt
Aluminium
2015
52.4 37,0 51% specific reduction from
18,9 decarbonised power (vs. 2015)
18,1
18,1 18,1 19% remaining to be addressed
by technology options (see overleaf) Cu 1.6 Mt
2.7Mt
1990 2015 2050 Copper
Indirect Emissions Direct Emissions
Sources: EEA & Eurostat Sources: European Aluminium & OECD
15METALS IN A CLIMATE NEUTRAL EUROPE - A 2050 BLUEPRINT
List of potential innovation options for lowering non-ferrous metals sector emissions (non-exhaustive)
Technology options Description - impact Enabling conditions Relevance
Decarbonisation EU Large impact for non-ferrous metals industry. Can bring total (direct + indirect) emissions This evolution will happen outside of non-ferrous metals industry. All metals +++
power down by 81% ref. 1990. Transition to low-carbon electricity will have to go with affordable
and secure electricity. Non-ferrous metals can help by higher
levels of demand response/ancillary grid services.
Energy efficiency Important energy savings are possible mostly related to digitisation and automated pro- Not all energy savings technologies are compatible with new All metals +++
cess management and efficiency in furnaces. breakthrough technologies. Favourable investment climate
required for continuous investments.
Anode technology Innovation in electrolysis process can bring further efficiency gains of up to 20%. Inert Major R&D effort needed, including support for pilot and demon- Al +++
aluminium anode technology can eliminate direct emissions while reducing energy use. stration. Investments can be capital intensive but likely with lower
operational costs.
Further Further electrification of pyrometallurgical processes and/or shift to hydrometallurgical High temperature electrification might not yet be mature or too Cu, Zn, Pb, Ni Al
Electrification processes in some smelting processes. Electrification (heat) in downstream processes. expensive compared to natural gas-based heating. Shift to hy- (& downstream all
drometallurgical processes can be limited and will most likely be
metals) +++
applied in secondary and waste streams
Fuel shift - Fuel shift from fuels/coal to gas has occurred in non-ferrous metals industry where possi- Fuel shift must be economically viable and bio-based fuels must Cu, Ni, Pb, Zn,
bio-based inputs ble. Further shifts to natural gas and bio-feed (including reducing agents) are possible. Can meet required quality. Ferro-alloys, Si +++
be relevant for recovery of metals from smelting slag or leaching residues
Hydrogen as Can be relevant for some pyro smelting processes (e.g. copper). Limited application of Will depend on economic development of H2 production by other Cu, Zn, Pb, Si ++
reducing agent H2 in ferro-alloys. Can be relevant for recovery of metals from smelting slag or leaching sectors and available infrastructure. Smelters already requiring
residues a lot of O2 might have better business case for use of H2 via
electrolysis, which has O2 as a by-product.
CC(U)S Due to relative low level of GHG emissions compared to e.g. steel, chemicals and cement Will depend on capture, transport and storage technology and Ferro-alloys, Si, Zn,
not priority for non-ferrous metals but can be linked to other sectors when technology is infrastructure developed by other larger industries. Cu ++
ready. Can become important for silicon and alloys production.
Higher metals New technologies (mostly hydrometallurgical but also new pyro) can enable recovery Further R&D support needed including scaling up to pilot and Cu, Zn, Ferro-alloys,
recovery (residues, of high amount of metals (incl. precious and rare) from waste and secondary streams. demonstration stage. Can be regulatory conflict with regulations Ni, Pb Alunina +++
slag and scrap) Important potential for improvements. Greenhouse gas impact can be limited (over-all) but on waste and hazardous materials.
important environmental and economic co-benefits possible.
Sector coupling: Important potential by non-ferrous metals for increased demand response services. Waste Market conditions need to be favourable. More variable load Al, Cu, Zn, Ni, Pb, Si,
demand response heat recovery by e.g. buildings sector can help reduce emissions there profiles cannot be punished with higher grid tariffs. Ferro-alloys +++
and waste heat
+++ Important technology options often with significant mitigation potential
++ Options with possible significant mitigation potential but can be difficult for the non-ferrous metals industry to apply on its own, e.g. requiring cooperation with other larger industries
16METALS IN A CLIMATE NEUTRAL EUROPE - A 2050 BLUEPRINT
1.5 Regulatory challenges for a bellwether industry
Europe’s metals ecosystem - the “canary in the coal mine” for energy-intensive industries?
The non-ferrous metals industry’s frontrunner status means it will be the first in line to
face several major regulatory challenges from Europe’s climate transition. How it copes Electricity costs as % of total production cost
will be an early indicator of the adequacy of EU industrial policies to support energy-in-
tensive industries through the transition.
In particular, the non-ferrous metals industry’s electro-intensity makes it particularly sus- 38.5 38.3
ceptible to the potential impacts of a decarbonising power system, i.e. higher electricity
prices and lower grid stability. The industry’s use of electricity (per tonne of product & as
a percentage of total production costs) is currently higher than any other energy-inten-
27.0
sive sector.
The industry is therefore already significantly impacted by indirect carbon costs from the
Emissions Trading System (ETS), passed on by power producers to metals producers. 19.0
With a rising ETS price expected in coming years, the impact of indirect carbon costs is
expected to rise significantly, impacting the competitiveness of metals producers. An ad-
equate system to limit the impact of indirect carbon costs on the most electro-intensiveMETALS IN A CLIMATE NEUTRAL EUROPE - A 2050 BLUEPRINT
2. Introduction
2.1 Introduction to project, context and goal
This report was commissioned by Eurometaux, the European non-ferrous metals association. Chapter 5 discusses the energy use and greenhouse as gas emissions from non-ferrous
It represents the industry’s vision on how it can contribute to achieving climate neutrality metals production as well as the options for further mitigation of GHG emissions as a con-
in Europe. The report profiles the non-ferrous metals ecosystem that the sector represents tribution to the EU’s goal to achieve climate neutrality by mid-century. The focus will be on
and its progress on climate mitigation and circularity. It also identifies the opportunities, base metals with highest over-all energy use (e.g. aluminium, copper, zinc, nickel, silicon,
challenges and constraints the sector faces in the transition to net-zero while determining ferro-alloys). First a general overview is given of energy use in non-ferrous metals produc-
a combination of key solutions that will help the non-ferrous metals, silicon and ferro-alloys tion and how it compares to other energy intensive industries, followed by a brief overview
sector to further reduce emissions, as well as address the necessary conditions for ensuring of over-all GHG emissions from non-ferrous metals production in the EU.
that the sector remains at the forefront of the energy and industrial transformation. Next the primary and secondary production processes for aluminium, copper, zinc, nickel,
silicon, ferro-manganese and ferro-silicon are presented together with energy use and
2.2 Scope (evolution) of GHG emissions. This is followed by a literature study on possible (new) GHG
This report considers the base metals, silicon, ferro-alloys, precious metals, specialty metals mitigation options for non-ferrous metal production. This includes techniques to reduce
and rare earth elements. With regard to energy use and greenhouse gas (GHG) emissions direct and indirect emissions in primary production but also addresses options that can
the report focusses on the base metals, silicon and ferro-alloys. improve use of secondary raw materials in non-ferrous metals production and technologies
which the non-ferrous metals industry can apply to assist with reduction of GHG emissions
• Base Metals: Aluminium, copper, lead, nickel, tin, zinc (+ silicon & ferro-alloys)
in other sectors.
• Precious metals: Gold, Silver, Platinum, Paladium, Ruthenium, Osmium, Iridium, Rhodium
Chapter 6 discusses the most important challenges for non-ferrous metals industry from the
• Specialty metals: Cobalt, Germanium, Gallium, Indium, Selenium, Antimony, Magnesium, perspective of a bellwether or frontrunner industry, in particular the high electro-intensity
Molybdenum, Cadmium, Beryllium, Bismuth, Chromium, Niobium, Vanadium, Hafnium,
and vulnerability to rising electricity prices. Other challenges include trade related issues,
Lithium, Manganese, Rhenium, Tantalum, Tellurium, Titanium, Tungsten
and misalignment in the broader regulatory environment related to numerous environmen-
• Rare earth elements: Neodymium, Dysprosium, Scandium, Cerium, Erbium, Europium, tal regulations to which non-ferrous metals industry is subjected to.
Gadolinium, Holmium, Lutetium, Ytterbium, Thulium, Lanthanum, Praseodymium, Samarium,
Chapter 7 brings the findings of previous chapters together to formulate a strategy that can
Terbium and Yttrium
enable a competitive transition to a climate neutral economy both for the non-ferrous met-
als sector as the value chains that will depend on metals. It looks at a set of five strategic
2.3 Methodology actions: competitive carbon free electricity, climate friendly innovations and investments,
The report starts by presenting a coordinated profile of the non-ferrous metals, silicon and fer- nurturing future value chains, circularity and industrial symbiosis, assertive EU trade policies
ro-alloys industry (chapter 3). This profiling aims to illuminate the delicate ecosystem that is the and strategic regulatory realignment.
sector via a thorough assessment of metals interlinkages, production in Europe, trade patterns The report is based on diverse sources and includes data from the non-ferrous metals, sil-
and the sector’s high import reliance as well as the sector’s close association to the broader icon and ferro-alloys sector as well as publicly available documents and data (e.g. industry
economy. It also sheds light on China’s growing profile and its impact on the EU non-ferrous reports, EU databases, European Commission studies, US and British Geological surveys,
industry. It then highlights the essential role of the non-ferrous metals, silicon and ferro-alloys project websites and media articles). The research team also conducted interviews with
industry in the low-carbon economy in their quality as enablers of the green economy. experts from the various metal commodity associations and specific companies (see annex
Chapter 4 explains how the sector is a price taker on a global market where prices are set - list of contributors).
at the London Metals Exchange. The chapter first describes the workings of the LME and
provides evidence of supply and demand impact on pricing of metals explaining how factors
that influence the metal price at LME are outside the direct control of either producers or users.
18The metals ecosystem
METALS IN A CLIMATE NEUTRAL EUROPE - A 2050 BLUEPRINT
3 The Metals Ecosystem
3.1. Introduction to non-ferrous metals trations. These latter are, when it is economically viable, extracted during the metallurgical
process of the primary or ‘carrier metal’, including via recovery in slags or hydrometallurgi-
Non-ferrous metals are essentially building blocks of our society. Their value chains connect
cal residues. All base metals (ores) are carrier metals for a wide range of other base-met-
to vital infrastructure like buildings, transport, electronics; strategic sectors like defence;
als, precious and specialty metals (as shown in figure 2). Cobalt for instance, is as a key
as well as almost every other economic sector such as food, jewellery and so on. They are
by-product of copper metallurgy (60% of cobalt production) and nickel metallurgy (40% of
particularly indispensable and irreplaceable in the production of low-carbon technologies.
cobalt production).
This means that the on-going transition to a climate neutral economy can be expected to be
metals intensive.
Al Mn
The non-ferrous metals industry in Europe is worth EUR 120 billion employing around Cr
Ti
Cu
V
As Ti Fe Zn Cu
Mn Li
500,000 persons directly and more than 2 million people indirectly. The sector consists of Sn
Mg Cr Fe
931 facilities, including mining (54 facilities), primary and secondary production of metals Ca/Si
Mg Pb
V Ni Br
(464) and further transformation (413). Metals production is present in most EU member Oxide Ni Ga
B
Co As Mn
ores Fe Al
states with a large presence in Italy (179 facilities), Germany (147 facilities), Spain (116 facili- Al Zn
Pb Cl Fe
Cu Sn
ties), France (82 facilities), UK (53 facilities), and Poland (51 facilities) (Figure 1).1 V
Al
Mg Fe Al
Fe Fe
200 Mn Mg Cr Nb
179 Al
V Zr Mg
PGM
Ca/Si Cr Interconnected Ti Ta Mn
147 Carrier Metal W Zn
150 Mg
Ga
Zn Cycles Sn Ag
As Cu
In
Ge Au Zn Sb
Mn Ni Bi
116 In Ag Pb
Pb Nb
Fe Pt Cu Ir Ta
Cd
Cu Au
Se
Ag Te Ru Mg
100 Cu
Au Pt Zn Sb
82 Co Pb Co Rh Fe
Ag Pd
Hg Mo Os
Te Cr
As As Hg
Bi Co
Sb Ni Ir Rh As
51 53 Se
44 Sulfide Ti
Os Ru
Bi Ca/Si Sulfide and
50 Sb
29 ores Ca/Si oxide ores
25 24 26 Hg
20 20 20 17 20 Fe Ca/Si
12 9 10 9
2 2 2 3 1 1 2 4
0
AT BE BG HR CY CZ DK EE FI FR DE EL HU IE IT LV LT LU MT NL PL PT RO SK SI ES SE UK NO IS
Carrier metals, bulk metals, generally of lower value.
Co-elements that have considerable own production infrastructure. High economic value. Some used in high tech
Figure 1: Distribution of the non-ferrous metals industry across Europe. Source: Eurometaux applications.
3.1.1 The non-ferrous metals eco-system Co-elements that have no, or limited, dedicated production infrastructure. Mainly highly valuable, high tech metals
e.g. essential in electronics.
The non-ferrous metals sector forms a fascinating eco-system over its value chain that con- Co-elements that end up as residues or emissions. Costly because of waste managment and end-of-pipe measures.
nects one way or the other the base, precious, specialty and alloys production to each other.
Most metal ores carry, next to the primary metals, various other metals in smaller concen- Figure 2: Non-ferrous metals sector interlinkages I Source: UNEP 2013 2
1 Eurometaux 2 UNEP, 2013
20METALS IN A CLIMATE NEUTRAL EUROPE - A 2050 BLUEPRINT
But also, in secondary production the metals eco-system is clearly visible via the extraction
of different metals in mixed waste streams or complex products consisting of different types
of metals (e.g. batteries). Campine
Metallo
Finally, most non-ferrous metals can be and are alloyed with other non-ferrous metals, iron Cu,Sn,Pb scrap +
Cu scrap,
Lead batteries,
Sb metal,
concentrates
and silicon. Alloys bring about specific properties to metals that are essentials in down- Cu anodes concentrates
stream applications (e.g. stainless steel). Complex
Cu Pb mixes Sb Pb
Table 1 below shows the by-products attained in the production of non-ferrous base metals. Sb Pb, Ag, As, Cu,
Cu, Ni, Zn Pb, Sn
Sb, Sn
Primary Production Aluminium Copper Nickel Zinc Lead
By-Products Bauxite residue Sulphuric Acid, Au, PGM, Co, Cu, Pb, Se, Te, In, Antimonial lead,
(red mud), Ga, Ag, Co, As, Bi, Mo, Se, Au, sulphuric Ge, Cu, Ni, Ag, Bi, Te, Se,
Umicore Nyrstar
waste gases Te, Platinum group acid Co, PGM, Au, In, waste gases Zn concentrates,
WEEE, catalysts,
metals (PGM) Pb, Sn , Ag, Cd, Hg, fuel cells,industrial secondary
Cu scrap,
Cu anodes
materials
Ni , Sb , iron silicate sulphuric acid residues
Zn dust
Metals, alloys, powders,
Ni
Table 1: Key non-ferrous base metals by-products Cu, Ag, Au, Ir,
Cu
Pb construction materials, etc. Zn
Pb , Pd, Ru, Se
Ni, As, Co, Cu,
Li, Re, Ta, W
See Annex 1 for a detailed overview of the non-ferrous metals ecosystem. Pb, Ad, Bi, In, Pt,
Li, Re, Ta, W
Zn, Ag, Cd, Co, Cu, Fe,
Mn, Ni, Pb , S, Sb, Sn
Aurubis
CuCuscrap,
scrap,
Box 1: Flanders Metals Valley – example of non-ferrous metals ecosystem Cu
Cuanodes
anodes
Belgium’s Flanders region, dubbed as Europe’s epicenter of metals recycling and innovative
Cu Cu, Ag, Au, Pt, Pd
production, is home to numerous key metals companies such as Aurubis, Metallo, Umicore
Precious Metals Refining, Rezinal, Nyrstar and others, that not only produce significant vol- Figure 3: Flanders Metals Valley
umes of nonferrous metal but also consistently explore new technology. These companies
work closely together to maximise the value from their various input materials rendering
the cooperation into a globally unparalled recycling model which results in the efficient re- 3.1.2 Production of non-ferrous base metals in the EU
covery of over 20 metals. Agoria and its member companies can recycle around 17 metallic Within the EU, the total primary production of non-ferrous metals stood at 7.4 million tonnes
elements. Rezinal focuses on recycling zinc and alloys shipped in from some 35 countries. (Mt) in 2016.
Nyrstar is also a zinc recycling specialist and its Balen plant is one of the world’s largest zinc
Aluminium is the most used non-ferrous metal by volume and the second most widely used
smelters in terms of production volumes. Galloo has pioneered ways to maximize the purity
metal after iron both in the EU and globally. The sector consists of more than 600 plants
and value of mixed shredded before they go to a smelting facility. Metallo, Umicore and
(most of these being small to medium sized enterprises) in 30 European countries, and pro-
Rezinal already harvest metal from residue streams no matter how mixed or impure they
vides indirect employment to more than 1 million persons with an annual turnover of around
may be. The Umicore Precious Metals Refining smelter in Hoboken, Belgium, recycles up to
EUR 40 billion.3 Primary production of aluminium stands at 2.2 Mt (2016) or just 4% of global
17 different metals. Metallo is the leading producer of pure tin in Europe (less than 100 parts
total primary production. Secondary aluminium production in the EU however is higher at
of lead per million).
3Mt as compared to 10.1 Mt global secondary production or 29.73%.
Copper is the second largest base metal sector in the EU after aluminium with around 500
companies in three sectors (mining, production and semi-fabrication) and an estimated
3 European Aluminium
21METALS IN A CLIMATE NEUTRAL EUROPE - A 2050 BLUEPRINT
turnover of about EUR 45 billion while employing around 50,000 people.4 In 2016, primary There is no extraction of antimony, beryllium, borates, magnesium, molybdenum, niobium,
copper production stood at 2.3 Mt or 13.1% of global total primary production. Secondary phosphorus, tantalum, titanium, vanadium and rare earths, for a variety of reasons (lack
production in the EU, like aluminium, is significantly high as compared to global figures. of discovery, lack of deposits, economic and societal factors or closures). The only raw
In 2015, secondary copper production in the EU was a quarter of global figures: 1.7 Mt as materials for which an EU Member State is the main global producer is hafnium (France).
compared to 7.38 Mt (or 23%).5 There exists sufficient primary production of raw materials in the EU such feldspar, gypsum,
Lead is a significantly large base metal sector and is usually found in and extracted in ore hafnium, indium, kaolin clay, magnesite, silica sand, sulphur and tellurium.
with zinc, copper and silver. The lead industry in Europe consists of 60 plants6, employs Europe therefore relies heavily on metal ores and concentrates imports from other
5400 persons7 and has a turnover of EUR 3 billion.8 Primary lead production in Europe stood continents – almost 80% of its needs. The value chain of raw materials therefore shows a
at 436kt in 2016 or 9.37% of worldwide production. Secondary lead production in the EU is pronounced imbalance between the upstream steps (extraction / harvesting) and the down-
high: 1,351kt or 18.2% of world secondary production given high recycling rates in the EU9 stream steps (manufacturing and use). China is the dominant entity with 46 raw materials (of
(65% EU27 in 2016).10 77 assessed) being mainly extracted in China, followed by the USA with 9% production of
Zinc is the fourth-most used metal after iron, aluminum, and copper. The zinc industry in raw materials assessed17.
Europe is well established with 12 plants located regionally providing direct employment to
Bauxite Copper ores Lead ores Zinc ores Nickel ores
around 5,000 people and indirect employment to more than 50,000 people with a turnover
of EUR 5 billion approximately.11 Primary zinc production12 in the EU stood at 1,699 kt or 3500000
13.4% of global total primary production in 2016.13 In the same year, secondary production of
3000000
zinc14 stood at 296 kt as compared to 1,563 kt global secondary production (18.94%).
2500000
Nickel represents a smaller metals industry in Europe with world class installations in
Norway, Finland, the UK and France. It nonetheless employs 4700 persons with an annual 2000000
output of EUR 9,2 billion. Primary nickel production in Europe (including Norway) amounted 1500000
to 211 kt or 9.6% of global total primary production for 2018.15 At 29.20%, secondary Nickel 1000000
production in Europe is second only to the Aluminium sector: 200 kt secondary nickel is
500000
used in Europe as compared to 685 kt global secondary production.
0
3.1.3 Mining metal ores and raw materials in the EU
1999
2000
2001
2002
2003
2004
2005
2006
2007
2008
2009
2010
2011
2012
2013
2014
2015
2016
The extractive industry (mining) of non-ferrous metals sector in Europe is not a large sector
given the paucity of ore reserves found in Europe.
Figure 4: European Base Metal ore mining,Tonnes. Source: World-Mining-Data, C. Reichl, M.
For the main metal ores, EU mining has a small share in global ores production: 0.6% for Schatz, G. Zsak, Volume: 31, Minerals Production, Vienna 2016
bauxite (aluminium), 4.1% for copper ores, 3% for nickel ores, 5.44% for zinc ores and 1% for
cobalt. Lead ores form the exception with the EU representing 9.7% of worldwide mining.16 Rare Earths are currently not mined in the EU although several rare earth element deposits
have been located (in Sweden, Denmark, Finland and Greece) and some are even being
4 European Copper Institute
5 Fraunhofer ISI, 2013, OECD, 2018 developed by mining companies.18 The EU is 100% reliant on rare earth imports where China
6
7
ILZSG, 2017
ILA
is the top producer – China’s rare earth production went up 14.3% in just one year (from
8
9
CRU, 2019
ILZSG
105,000 tonnes in 2017 to 120,000 in 2018).19
10 https://ec.europa.eu/commission/sites/beta-political/files/swd-report-batteries-accumulators-april2019_en.pdf
11 EU Zinc Industry, 2011
12 Zinc from primary zinc smelters produced from mineral concentrates (all primary zincsmelters process a mix of primary and secondary feedstock)
13 IZLSG
14 Secondary fee material in primary zinc refining processes, and excludes remelting of zinc scrap metal 17 Study on the review of the list of Critical Raw Materials: Criticality Assessments
15 INSG 18 EURARE 2017
16 Silver 7%, gold 0.6%, Tungsten 2.9, Lithium 0.175%, European Commission 2017a&b, Lead source: IZLSG 19 McLead, 2019
22METALS IN A CLIMATE NEUTRAL EUROPE - A 2050 BLUEPRINT
3.2 EU Metals Production in a Global Context The global metals market is dominated heavily by China, followed by Russia, USA, Australia,
Chile and South Africa (in order of frequency of appearance in Tables 2 & 3). The predomi-
3.2.1 EU production versus other large metals producers nance of China as the top metals producing country for the largest number of metals/ores is
clear. Not only does China top the list in almost every metals production but does so with a
The EU’s primary production of non-ferrous base metals20 in 2016 represented 10% of of
global metals production in 2016 (13 Mt out of 128 Mt). For primary base metals production large margin. China is not only the largest nonferrous metals producer in the world but also the
EU’s in global share was 6% (6.5 Mt out of 101 Mt) and for secondary production this was largest consumer of the base non-ferrous metals: copper, aluminum, zinc, lead, nickel and tin.
24% (6.5 Mt out of 27 Mt).. The EU still has an important share of primary production as a Name Top Metal Producer Country Rank 1-3
percentage of global production: 4% for aluminium, 13.1% for copper, 9.37% for lead, 9.6%
Top Metal Producers China 55% Russia 6% Canada 5%
for nickel, and 13.4% for zinc. For cobalt and silicon, the figure stands at 10.23% and 9% re- Primary Aluminium
EU Import Partners Norway 21% Russia 20% Iceland 14%
spectively.21 EU’s production share is particularly high as regards hafnium (41.67%), selenium
(41.85%) and rhenium (16.47%). However, for a number of metals, EU production is less than Top Metal Producers - Smelting China 37% EU 10% Chile 9%
1% of global production22. Copper Top Metal Producers - Refining China 37% EU/Chile 11% Japan 7%
EU Import Partners Chile 26% Peru 23% Brazil 11%
42,00%
Top Metal Producers China 28% Japan 10% Russia 9%
41,85%
Nickel
EU Import Partners Russia 32% Norway 13% Australia 10%
Top Metal Producers - Smelting China 45% South Korea 7% Canada 5%
Zinc
EU Import Partners24 Peru 31% Namibia 28% Russia 27%
Top Metal Producers China 42% USA 9% South Korea 8%
Lead
EU Import Partners Australia 11% Macedonia 11% Peru 9%
16,47%
Tin Top Metal Producers China 51% Indonesia 19% Malaysia 8%
13,38%
13,08%
Refined Tin EU Import Partners Indonesia 35% Peru 24% Malaysia 9%
10,23%
9,78%
8,82%
8,45%
Top Global Mining Countries Japan 29% Germany 25% Belgium 8%
6,94%
6,88%
Selenium (refined)
4,26%
4,05%
EU Import Partners Brazil 26% Russia 14% Japan 12%
3,21%
2,65%
2,76%
3,7%
2,32%
1,39%
0,33%
0,29%
0,27%
0,8%
0,19%
0,01%
Top Metal Producers - Refined China 61% USA 11% Russia 9%
Tellurium (refined)
0%
0%
0%
0%
EU Import Partners Ukraine 30% China 15% Russia 6%
Tin
Co ium
Ni r
Zin l
Co c
Le t
ad
Si ld
Pla lver
l m
he um
Bi MG
ro th
G ium
rm um
Indium
Rh ium
na m
Ha ium
Fe M Lit um
-m ng m
bd ese
Se enum
Te nium
Ti rium
r M un m
ar or ten
Me ls
ls
e
l
e
Top Global Mining Countries Canada 21% Australia 15% South Africa 12%
ba
rth ta
ta
ck
Go
Pa tinu
Va niu
rro a hiu
he T taniu
Ch smu
pp
Ot ladi
Ge alli
i
Re in gs
rP
Ea Me
oly an
in
m
an
d
fn
llu
Titanium (mined)
e
le
um
EU Import Partners Norway 25% Canada 21% South Africa 17%
Al
Top Global Mining Countries China 79% EU 7% Canada/Vietnam/
Ot
Tungsten (mined) Russia 3%
Figure 5: EU Primary Production as a % of World Production (tonnes), Base metals data 2016, EU Import Partners Russia 84% Bolivia/Vietnam 5% USA 1%
Source: USGS, 2017, World Bureau of metals, ILZSG, Nickel Institute, Comtrade. I Other metals23
average for 2010-2014 Source: European Commission 2017a, 2017b. Table 2: Top 3 metals producing countries and top 3 EU import partners. Source: JRC 2017, BGS
2016 (Zinc – import of refined zinc. Source: Comtrade)
20 Aluminium, Copper, Lead, Zinc and Nickel
21 Figures for 2016. Lead figure source:ILZSG, Silicon figure source : European Commission, (2017b), Nickel figure for 2018 and includes Norway.
Source: INSG. Other Sources: European Commission, (2017b)
22 Gold at 0.8%, Platinum at 0.27%, Palladium at 0,19%, Bismuth at 0,01%, Germanium at 0,33%, Manganese at 0,29%, Bauxite at 0,85%, and 0%
for Iridium, Ruthenium, Rhodium, Beryllium, Niobium, Magnesium, Antimony, Tantalum, Scandium, Cerium, Dysprosium, Erbium, Europium,
Gadolinium, Holmium, lutetium, ytterbium, thulium, Lanthanum, Neodymium, Praseodymium, Samarium, Terbium and Yttrium
23 Other PGM include Iridium, Ruthenium, Rhodium. Other minor metals include Niobium, Magnesium, Antimony, Tantalum, Beryllium 24 Comtrade
23You can also read