INFRASTRUCTURE FOR GROWTH: HOW TO FINANCE, DEVELOP, AND PROTECT IT - edited by Carlo Secchi, Stefano Riela - Ispi
←
→
Page content transcription
If your browser does not render page correctly, please read the page content below

INFRASTRUCTURE FOR GROWTH:
HOW TO FINANCE, DEVELOP,
AND PROTECT IT
edited by Carlo Secchi, Stefano Riela
ITALIAN INSTITUTE
FOR INTERNATIONAL
POLITICAL STUDIES

        INFRASTRUCTURE FOR GROWTH:
          HOW TO FINANCE, DEVELOP,
               AND PROTECT IT

                    edited by CARLO SECCHI, STEFANO RIELA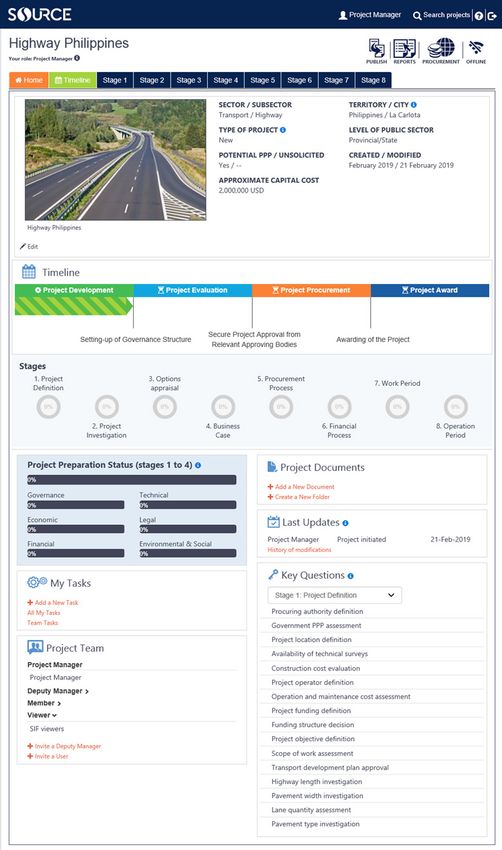
ITALIAN INSTITUTE
 FOR INTERNATIONAL
 POLITICAL STUDIES

   TABLE OF CONTENTS

Foreword
   4

1. The Economic Impact of Infrastructure: The TEN-T Case
    W. Schade, S. Maffii, S. Schäfer
    7
2. The Future of TEN in Europe and Beyond
    Carlo Secchi
    16
    Box: Hyperloop technology a potential breakthrough, Carlo De Grandis
    23
3. Strategic Infrastructure and Investment Restrictions
    Stefano Riela, Alessandro Gili
    25
4. International Competition: Is There a Level Playing Field?
     Ulrich Paetzold
     36
5. Conditions that facilitate infrastructure investment
    Maria Elena Perretti, Silvia Tranfa
    43
6. The Role Played by Multilateral Development Banks in Financing Infrastructure
    Pierre Sarrat
    53
7. How To Build Infrastructure Efficiently
    Paolo Romiti, Andrea Goldstein
    63
8. How Analytics Can Drive Smarter Engineering and Construction Decisions
    Garo Hovnanian, Kevin Kroll, and Erik Sjödin
    67
The Authors
    72

                                                                                   |2
ITALIAN INSTITUTE
FOR INTERNATIONAL
POLITICAL STUDIES
© ISPI
The opinions expressed herein are strictly personal and do not necessarily reflect the position of ISPI.
|3ITALIAN INSTITUTE
FOR INTERNATIONAL
POLITICAL STUDIES
FOREWORD
This study is an initiative of the ISPI’s Centre on Infrastructure, promoted with the knowledge partnership
of McKinsey & Company. It analyses the importance of economic infrastructure and how to finance and
develop it. Economic infrastructure is the backbone that, in many cases, crosses the borders of political geo-
graphy and defines the space supporting the movement of goods, services, people and their ideas.
The eight articles of this study are structured into four main sections: 1) The economic impact of infra-
structure, with a focus on the transportation network of the EU; 2) The geopolitical role of infrastructure;
3) The infrastructure gap at the global level and how to ease its financing; 4) The efficient development of
infrastructure.
In particular, Section 1 underlines that infrastructure has the ability to determine a positive discontinuity
in the economic growth of countries through direct and indirect effects. The realisation of an infrastructure
boosts GDP and creates jobs, while its availability can increase productivity and promote both competition
and cooperation. The completion of the core Trans-European Transport Network (TEN-T), for example, may
increase the GDP of the EU by 1.6% and create new ca. 800,000 jobs by 2030. However, the realisation of the
core TEN-T by 2030 and the comprehensive network by 2050 require that EU resources are used to attract
private funds as proposed in the EU budget 2021-2027 (the draft of the Multiannual Financial Framework
produced by the EU Commission), as well as in the updated versions of the Connecting Europe Facility (CEF)
and of the so-called “Juncker Plan” (now InvestEU). The EU financial commitment for infrastructure invest-
ments extends also in countries that participate in the Neighbourhood Policy: the aim is to promote the
economic and political stability of those countries and hamper the consolidation of geopolitical interests of
other big players in the Eurasian continent (namely Russia and China).
|4In Section 2 the spotlight is placed on strategic infrastructure. When infrastructure is labelled as “strategic”, states can introduce screening procedures and restrictions for FDIs depending on the nationality of the investor. This is to prevent foreign entities from threatening the security and the economy of the target country through the acquisition of key assets. The US, the EU and some EU states have recently introduced new and/or tougher criteria especially for potential FDIs from state owned enterprises (SOEs) rooted in non-market economies such as China, with explicit plans of global “shopping” for geopolitical purposes. Along with the FDIs, the asymmetry between market and non-market economies has raised concerns even in the field of tenders for infrastructure projects in the EU. Firms supported by state aids may distort compe- tition in procurement procedures: those companies often offer prices and conditions that cannot be met by European firms. This is why the European Council has recently (22 March 2019) acknowledged that the EU must “safeguard its interests in the light of unfair practices of third countries, making full use of trade defense instruments and our public procurement rules, as well as ensuring effective reciprocity for public procurement with third countries”, a few weeks before the EU-China Summit on 9 April 2019. Section 3 focuses on the increasing needs for infrastructure funding. Despite the positive impact of infra- structure, there is a gap between the investment needed to maintain the current level of global GDP growth and the resources actually invested. One of the main obstacles to infrastructure financing relates to the lack of “investment grade”. This is due to the shortage of expertise for projects with an increasing complexity as well as the lack of information and standardisation in data and procedures. A significant role in filling that gap is played by multilateral development banks. These institutions provide governments with tools to improve the attractiveness of investments and have a direct role in financing specific infrastructure projects. They provide loans, guarantees and technical assistance to prepare the investment and reduce the related risk. They also co-finance projects with governments, commercial banks, credit export agencies and other private investors. A web platform called "Source" has been created by multilateral development banks to develop infrastructure investment-ready projects, especially in low and middle-income countries. Section 4 tackles the most pressing issues in infrastructure design and realisation. The recent wave of infra- structure investment is marked by higher complexity also due to an increasing demand for environmental, social and financial sustainability. To this aim, procurement strategies and procedures need to be updated and customised to ensure greater efficiency and to attract qualified contractors; indeed, the latter are beco- ming picky and shy away from those projects that present substantial social, political or sovereign-type risks that could harm profitability and reputation. To boost efficiency in the sector, firms are turning to data-dri- ven solutions and Artificial Intelligence to improve capital project outcomes and to reduce risk. Firms can leverage the vast amounts of data they already collect and analytics can uncover critical insights that speed Foreword |5
up and improve the quality of management decisions. In particular, they can help project teams assess mar-
 ket conditions, portfolio composition, and individual project performance.
 To conclude, infrastructure reduces isolation and allows economic agents to interact and benefit recipro-
 cally from comparative advantages. In the long-run, it may also enable the exploitation of economies of
 scale and produce positive spill-over effects thanks to the spread of technology and knowledge. This is the
 rationale behind the growing need for connectivity, and infrastructure is the main tool to achieve this aim.
 History repeats itself: the Romans, almost two millennia ago, considered connectivity as an essential engi-
 ne for the growth and the stability of the Empire, with an extensive network that has shaped the pattern
 of contemporary urbanisation and industrialisation. Today, at the peak of this wave of globalisation, in-
 frastructure is increasingly perceived and used as a geopolitical tool to project the influence of the major
 powers on the global stage. This nevertheless might determine asymmetric relationships that could harm
 the economic prospects and threaten the political independence of the weakest countries. The real goal
 to be delivered is the creation of a level playing field at the global level: reciprocity, reduction of barriers to
 market entry, protection of intellectual property and universal standards are what really matter to ensure
 the role of infrastructure as a core driver in improving the long-term economic outlook of countries.

Foreword                                                                                                               |6
ITALIAN INSTITUTE
    FOR INTERNATIONAL
    POLITICAL STUDIES

1. THE IMPACT OF TEN-T COMPLETION ON
   EUROPEAN ECONOMY
        W. SCHADE, S. MAFFII, S. SCHÄFER, S. MADER

Infrastructure and especially new transport infrastructure have a marked effect on a country’s economy.
From a physical perspective, improved infrastructure creates better connectivity between regions and coun-
tries and hence reduces travel times. On the European level, the development of the Trans-European Tran-
sport Networks (TEN-T) has always been a major component of the common transport policy.
On behalf of the European Commission, a study has been carried out by M-Five, TRT, and Ricardo with the
objective to assess the growth, jobs and greenhouse gas emissions impacts arising from the completion of
the TEN-T core network1. In this article, the applied methodology and the evaluated economic impacts of
the TEN-T completion on the European economy are presented.

METHODOLOGY OF THE ASSESSMENT

The analysis is based on an integrated approach applying two models: the European multi-modal transport
network model TRUST and the integrated transport-economy-environment assessment model ASTRA. Lin-
king them together aims to achieve two goals:
•    The addition of economic and social dimensions to the analysis of impacts of transport policy measures,
     simulated in detail on a network basis.
•    The evaluation of the transport impacts of infrastructure projects on the network.

Overview of the ASTRA model

The Assessment of Transport Strategies (ASTRA) model is a System Dynamics model designed for the asses-
sment of impacts of various transport policies and strategies with the economic system2. It is one of the few

                                                                                                           |7
tools integrating the full transport system. It comprises a transport demand model, a vehicle fleet model, an
environmental model, and a fully-fledged macro-economic model. ASTRA is, therefore, able to model diffe-
rent levels of effects: (1) the direct effects of a transport policy taking place within the transport sector itself
(e.g. transport flows and modal-shift), (2) the direct effects of infrastructure policies in the economy (e.g. on
the construction sector), and (3) the indirect effects occurring anywhere in the economy usually with some
delay after the initial impulse.
The macro-economic modelling from ASTRA relevant for this project can be roughly differentiated into four
core elements:
• The demand side with private consumption of households, investments and the trade balance differen-
tiated by 25 economic sectors (NACE-CLIO system) and government consumption.
• The supply side with capital stock, labour supply and total factor productivity (TFP).
• The input-output tables depicting the sectoral interactions and enabling to estimate sectoral gross-va-
lue-added (GVA) and sectoral employment.
• The micro-macro-bridges linking the bottom-up calculations of the transport system with the various
elements of the macro-economic module.
At the core of the macro-economic modelling in ASTRA is the determination of GDP for each future year,
which results from the interaction between the supply and demand side of the national economy of each
Member State. The level of GDP and the taxation systems of the countries determine disposable income
and subsequently the sectoral spending behaviour of households, which is also affected by spending for
the transport sector that is determined by the results of the transport models. Sectoral final demand, as well
as energy and transport-related impacts, affect the sectoral value-added through the input-output tables,
which in turn constitutes a driver of sectoral employment. On the supply side, the most relevant variable
is Total Factor Productivity (TFP), which is driven by sectoral labour productivity, type of investment goods
demanded, and national average freight transport time.
The Transport Module in ASTRA follows the classical four-stage modelling approach with generation, di-
stribution, modal split and assignment. Using transport cost and transport time matrices, it calculates the
modal-split for five passenger modes and four freight modes. Influencing factors are such as travel speeds,
structure of vehicle fleets, transport charges, fuel price, or fuel tax changes. Results are vehicle-km per mode
and country based on passenger and freight transport performance3.
Major outputs of the Transport Module, are provided to the Environment Module (ENV) of ASTRA. These
inputs and information from the Vehicle Fleet Model are used to calculate the major greenhouse gas emis-
sions and air pollutants from transport at the national level.
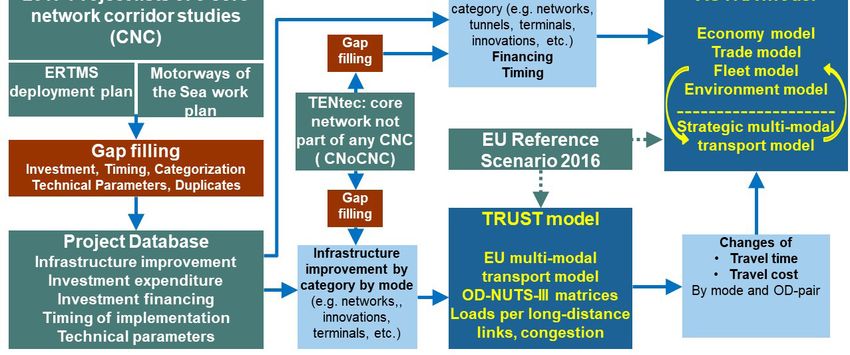
The Impact of TEN-T Completion on European Economy |8Overview of the TRUST model The TRansport eUropean Simulation Tool (TRUST) is a transport network model allowing for the assignment of Origin-Destination matrices at the NUTS-III level for passenger and freight demand for the EU and the neighbouring countries. The model has been used for many years to support studies at EU level, and it is calibrated to reproduce tonne-km and passenger-km by country consistent with the Eurostat Transport in Figures statistics, apart from the intra-NUTS-III demand, which is not assigned to the network. Base year matrices are based on those estimated in the ETISplus project while future matrices are derived by applying ASTRA model demand growth rates. The road assignment algorithm distributes demand for each origin/destination pair among available alternative routes according to their utility using a logit model where the utility of each route is measured in terms of generalised cost. The rail network, which does not consider capacity limitations, includes different link types (conventional, high speed, border rail link – by demand segments where allowed) as well as intermodal terminals where loads are transferred between road and rail. Inland and maritime waterways are modelled as feeder modes. Demand is segmented according to types of traffic that correspond to different train types in terms of occu- pancy of rail capacity. Interaction between TRUST and ASTRA Figure 1.1 presents the interactions between TRUST and ASTRA as well as the main inputs used in this stu- dy. Both models are calibrated to an update of the EU Reference Scenario 20164 in terms of demographics, economic growth, energy, and transport sector developments. This scenario, which assumes that all the projects are completed by 2030, is compared with a Baseline Scenario that assumes that no further core TEN-T network investments are implemented beyond 2016 and is built by subtracting from the EU Reference Scenarios all interventions to be implemented beyond 2016. Assumptions on the implementation of the TEN-T core network over time constitute the major specific input to both ASTRA and TRUST. Assumptions are derived from a Projects Database developed by building upon various sources (see Figure 1.1). The Impact of TEN-T Completion on European Economy 9
Fig. 1.1 - Major elements of the project methodology

                                                     Source: M-Five

Investment, financing, and timing of investment directly alter the corresponding variables in ASTRA, which
then generate new estimates for GDP, income, consumption, transport activity, etc. Assumptions on the
evolution of the CNCs over time are fed into the TRUST model and changes of travel times and cost in the
Reference Scenario are compared with the Baseline Scenario and are converted from the spatial concept of
TRUST (link level) into the NUTS I level and fed into ASTRA. Finally, investment into TEN-T and other transport
infrastructure is considered as part of the government budget. The investments for cross-border projects are
split according to the involvement of the respective countries.
Combining TRUST and ASTRA allows transport to be analysed at two levels: the network level by TRUST, and
the strategic level by ASTRA. With such a combined modelling approach it is possible to capture both the
direct effects of the new or improved infrastructure in the transport sector, as well as the indirect effects
on supplying industries and wider economic impacts induced by mechanisms such as higher productivity
diffusing to other economic agents and into future years. The latter also captures growth and job impacts.

The Impact of TEN-T Completion on European Economy                                                         | 10
ECONOMIC IMPACTS OF TEN-T IMPLEMENTATION
The analysis of the TEN-T implementation builds on the projects along the core network corridors which
remain to be implemented between 2017 and 2030 in order to achieve full completion of the core network.
These projects represent a total investment of €556 billion in 2005 prices. The economic impacts are analy-
sed from three different angles:
• Impacts for the whole EU until 2030
• Impacts for the different Member States
• Impacts of individual CNC
The impacts of investments go beyond the transport system. The modelling exercise shows a wealth of eco-
nomic impacts:
• Infrastructure investments have a positive impact on value-added and employment in the construction
sector and its supply industries.
• Investments in technology such as alternative fuels or components of the ERTMS foster growth and
employment in those industries.
• Transport time savings increase the productivity of supply chains and create new opportunities for bu-
siness trips, which improves productivity.
• Sectoral productivity gains due to higher sectoral investment in technology. Inputs increase total factor
productivity, with positive impacts on GDP.
• Increased GDP leads to second-round impacts, with additional income spent.
Economic impacts for the whole EU
ASTRA simulates these macroeconomic impacts through key indicators including GDP and employment.
Table 1.1 shows that GDP at EU28 level goes up by 1.6% in 2030. It also shows that the economic impacts are
not evenly distributed across the European Union: GDP in EU135 Member States increases by 4.2% in 2030
relative to the Baseline, whereas for the EU156, the GDP increases by 1.4%.
Employment in the EU13 is 0.4% higher in 2030 with respect to the Baseline and 0.1% higher in the EU15. For
the EU28, 797,000 additional jobs7 are created in 2030 thanks to the completion of the core TEN-T network.
The Impact of TEN-T Completion on European Economy | 11Tab. 1.1 - Changes in GDP and employment in the Reference scenario relative
to the Baseline due to the TEN-T core network implementation between 2017 and 2030
Changes in the Reference scenario relative to the Baseline GDP Employment (FTE)
2020 2030 2020 2030
EU15 0.3% 1.4% 185 200 509 600
EU13 1.9% 4.2% 155 300 287 500
EU28 0.4% 1.6% 340 500 797 000
Source: ASTRA
Economic impacts on Member States
At Member State level, the impacts depend on factors such as: the size of TEN-T investment in relation to
GDP or to their total investment; the sectoral structure of their economy; the specific improvements of tran-
sport performance; the dependency on trade and the trade structure. The time profile of TEN-T investments
and thus of improvements in travel time is different between countries. As a consequence, the impacts on
GDP and employment vary. Moderate increases in GDP of around 1% in 2030 relative to the Baseline are
projected for several EU15 countries, while substantial increases of more than 3% in GDP are shown for many
EU13 countries. Countries like Luxembourg, Slovenia, and Hungary reveal positive impacts on GDP that are
similar in 2020 and 2030 (Figure 1.2), showing that most of their benefits are from direct effects. Conversely,
countries like Bulgaria, Denmark, Sweden, and Latvia have GDP impacts that triple between 2020 and 2030,
benefitting from second-round effects.
The impacts on employment presented in Figure 1.2 show that in Italy, France, Spain, and Poland more than
100,000 additional jobs are created in 2030 relative to the Baseline, mainly because of second-round effects.
The relative magnitude of direct or second-round effects depends on (1) the share of imports and exports
in the sector benefitting from the investment, (2) the share of domestic input to construction, (3) growth of
income and thus consumption, and (4) stimulus of total factor productivity in that country. In particular, the
two final effects are mutually reinforcing and can foster medium-term growth dynamics. As a result, demand
and productivity effects can significantly exceed direct effects.
The Impact of TEN-T Completion on European Economy | 12Fig. 1.2 - Changes in GDP and additional jobs created in 2020 and 2030
in the Reference scenario relative to the Baseline
Source: ASTRA
The Impact of TEN-T Completion on European Economy | 13Economic impacts from individual core network corridors
Economic multipliers are used as an indicator to understand the economic impact of TEN-T implementation.
Figure 1.3 shows multipliers for individual corridors that provide an indicator of the additional GDP and jobs
created by each euro respectively per billion euro invested over the period 2017 to 2030. These range from
2.6 for the Orient-East-Med CNC to 4.7 for the Baltic-Adriatic CNC. The GDP multiplier for the whole TEN-T
core network over the period 2017 to 2030 is 3.3.
Fig. 1.3 - GDP and employment multipliers for the TEN-T core network implementation
between 2017 and 2030
Source: ASTRA
The high employment multiplier of the Baltic-Adriatic corridor results from large investments placed in Po-
land that shows a large impact due to its sectoral structure, as well as their relatively lower labour pro-
ductivity (see Figure 1.2). Low employment multipliers are projected for the Rhine-Alpine and the Scan-
dinavian-Mediterranean corridors. The reason is that they pass through countries with comparably high
labour productivity, so the same increase in investments translates into a lower impact on employment8.
The average multiplier for the whole TEN-T core network is above 13,000 additional job-years per billion
euro invested (in 2005 prices).
The Impact of TEN-T Completion on European Economy | 14CONCLUSION The study has analysed the full TEN-T core network implementation by 2030. In terms of economic impacts, EU GDP would increase by 1.6% in 2030 relative to the Baseline and an additional 797,000 full-time equiva- lent jobs would be generated. GDP growth impact differs substantially between the EU13 (+4.2%) and the EU15 (+1.4%). These large differences between countries are linked to (1) the share of TEN-T investments in the total investments undertaken in a country and (2) country-specific economic structures. The GDP multiplier of the TEN-T investments amounts to 3.3, which indicates that for every euro invested, €3.3 of additional GDP are created. In terms of employment, for every billion euro invested into the TEN-T core network between 2017 and 2030 an average of 13,000 additional job-years are generated. REFERENCES P. Capros, A. De Vita, N. Tasios, P. Siskos, M. Kannavou, A. Petropoulos, ... and L. Paroussos, EU Reference Sce- nario 2016 - Energy, transport and GHG emissions Trends to 2050, 2016. 1. W.Schade, S. Maffii, J. Hartwig, C. de Stasio, F. Fermi, A. Marti- 3. Transport results and the greenhouse gas impacts are not in- no, S. Schäfer, S. Welter, L. Zani, The impact of TEN-T completion cluded in this paper but are available from the main study. on growth, jobs and the environment – Methodology and Results. 4. The Reference Scenario has been developed with the PRI- Final Report, Report on behalf of the European Commission. MES-TREMOVE model by ICCS-E3MLab (Capros et al. 2016). Karlsruhe, Milan, 2018. 5. Bulgaria, Croatia, Czech Republic, Cyprus, Estonia, Hungary, Lat- 2. D. Fiorello, D. Bielanska, S. Maffii, and A. Martino, “Investment, via, Lithuania, Malta, Poland, Romania, Slovak Republic, Slovenia public resources and the transport system: some simulations 6. Austria, Belgium, Denmark, Finland, France, Germany, Greece, with the astra-it model”, Economics And Policy Of Energy And Ireland, Italy, Luxemburg, Netherlands, Portugal, Spain, Sweden, The Environment, 1/2012, pp. 153-168, DOI:10.3280/EFE2012- United Kingdom 001009, 2012; W. Schade, M. Krail, J. Hartwig, C. Walther, D. Sut- 7. Employment numbers are provided as full-time equivalent ter, M. Killer, M. Maibach, J. Gomez-Sanchez, K. Hitscherich, Cost (FTE). of non-completion of the TEN-T, ISI, PTV, Infras, M-Five, Study on 8. To derive employment from value-added the latter needs to behalf of the European Commission DG MOVE, Karlsruhe, Ger- be divided by the productivity in euro/FTE. High values for pro- many, 2015. ductivity then lead to small numbers for employment. The Impact of TEN-T Completion on European Economy | 15
ITALIAN INSTITUTE
  FOR INTERNATIONAL
  POLITICAL STUDIES

2. THE FUTURE OF TEN-T IN EUROPE
   AND BEYOND
      CARLO SECCHI

Transport infrastructures are of vital importance for Europe because they support the possibility of imple-
menting a truly unified single market while reducing the impact of distances and geographical obstacles.
As a matter of fact, the Treaty on the European Union, by identifying the four fundamental freedoms of mo-
vement (of citizens, goods, capitals, and services), implicitly puts transport infrastructure as a top priority,
especially since the Treaty of Rome of 1957 provided for a “common transport policy”.
However, while a pan-European detailed plan is now available, the fundamental problem is how to finance
the increasing infrastructure needs. That is the reason why this paper will mainly focus on how to mobilise
resources – both public and private – to this end.
We are at present approaching the final year of the current multi-annual financial framework (MFF) of the Eu-
ropean Union (EU), to be concluded at the end of 2020. This also refers to the financial support available for
the transport infrastructure of the Trans European Network – Transport (TEN-T)1. The legal basis is given by
two Regulations, one on “Union guidelines for the development of the trans-European transport network”2
and the other on establishing the “Connecting Europe Facility (CEF)”3. The TEN-T system is organised in nine
“core network corridors”4 plus two horizontal priorities (Motorways of the sea and Deployment of the Euro-
pean Rail Traffic Management System – ERTMS), each one under the responsibility of a European Coordina-
tor.
The EU has jointly set with its Member States and the European Parliament very ambitious goals to reali-
se a “core” trans-European transport network by 2030 and a “comprehensive” network by 20505, which are
currently being implemented. This translates into estimated investment needs between 2021 and 2030
of around 500 billion euro. It is evident that these investments cannot be financed only by grant funding

                                                                                                            | 16
from the Community, even with an increased budget for the CEF. On the contrary, while trying to maximise the impact of the amounts available also through innovative financial instruments and their joint-use (the so-called “blending”), it is of vital importance to mobilise, alongside to the lending activity of the European Investment Bank (EIB)6, also private resources through the financial market and in other ways. This requires the development of a favourable context through a variety of measures. For this reason, at the request of the Informal Transport Council held in Milan in September 2014, two Euro- pean coordinators (Kurt Bodewig and the author of this article) together with the late Henning Christopher- sen (a former Commission Vice-President also in charge of transport)7, presented in June 2015 an ”Action Plan on how to make the best use of new innovative financial schemes”. It includes twelve sets of con- crete recommendations on how to improve the investment framework for infrastructure projects in Europe. In January 2018, a Progress Report on this Action Plan was published, taking stock of the developments that took place by then and making additional recommendations. Finally, a Discussion Paper on “Enabling the up-take of the TEN-T project pipeline by the financial market” was presented to the Informal Transport Council of Bucharest (27 March 2019) with the ambition to prepare new recommendations as a basis of the work programme of the new European Commission which will take office towards the end of this year. Meanwhile, the renewal of the CEF Regulation is in the legislative pipeline, in view of approving the new “CEF II” Regulation with the new MFF for the period 2021-2027, while the TEN-T Regulation (whose final year for the core network is 2030) will be reviewed and updated between 2022 and 2023 to build on the expe- rience learned and to make it possible to reach the target set for the end of the next decade. THE TRANSPORT INVESTMENT FRAMEWORK AND THE IMPLEMENTATION OF THE TEN-T Even though much progress has been made to improve the transport investment framework in Europe, there are still a number of obstacles. Firstly, the financial sector and project investors have different views. The former although considering money for investments sufficient, do not see the transportation projects enough mature to invest in. The latter instead replies that there is still room to improve the EU granting sy- stem in view of the discrepancy between the number of investments needed and the budget proposed for transport for the period 2021-2027 under the CEF and under InvestEU (initially known as the “Juncker Plan”). As a matter of fact, the topic of financing is evolving fast, and a number of communications, reports, and studies have also been published by different entities8. The Future of TEN-T in Europe and Beyond | 17
It is important to keep the ongoing discussions open with all stakeholders, as well as within the European
Commission and the European Parliament – in particular with representatives from financial institutions, the
EIB and national promotional banks, investors’ groups, etc. – in order to identify measures to improve the
transport investment framework.
For the period 2021-2027, the Commission indicated a wish to focus on three main policy areas:
1. Jobs & Growth,
2. Sustainable Development and Climate Change, and
3. Defence Protection.
Transport would be formally placed under the second pillar, but actually responds to the needs of all three areas.
Indeed, smart and sustainable transport investments create jobs and growth, contribute to the decarbonisation
agenda and, last but not least, with its “military mobility” component of CEF II it also adds value to the defence
protection of European Member States. This new chapter proposed for CEF II is very important, so because it is
a first interesting case of “dual-use”, which distinguishes transport infrastructure.
Five European funding instruments will support transport investments in the next MFF framework: the
CEF II, including its blending facilities, Horizon Europe, the European Structural and Investment Funds, the
EIB regular loan activities, and InvestEU. However, even if the proposed budgets for transport under these
instruments would be doubled or tripled, there remains considerable gap to reach the 500 billion euro ne-
eded to complete only the core TEN-T network. It is therefore essential to increase the level of magnitude at
which the market is currently picking up transport infrastructure projects. To this aim, the Commission, the
Member States, and the project promoters need to address a number of challenges, some of which we will
try to elaborate on in this paper.

THE EVOLUTION FROM CEF I TO CEF II

The implementation of CEF I has shown a high level of innovation with regard to the use of financial schemes.
Indeed, for the first time, 1.4 billion euro of EU grants have been allocated in the form of blending calls. These
calls were published in 2017 and 2018, successfully attracting project proposals and leading to 74 projects
selected for a grant component, which are expected to mobilise up to 7.9 billion euro in investments.
Building on this positive experience, the European Commission is currently working on the establishment
of a CEF blending facility for alternative fuels and ERTMS (European Rail Traffic Management System), to be-
come operational around fall 2019 as a pilot before the start of Invest EU. It is expected to include different
implementing partners, not only the EIB. The challenge will be to give an “optimal” grant level, to be set up

The Future of TEN-T in Europe and Beyond                                                                      | 18
front so as to speed up the bank's due diligence, and minimise the administrative burden for applicants in
closing the financial package. By “optimal”, it is meant the level which is just sufficient to make the project
attractive enough for banks and institutional investors (i.e. to properly mitigate the risk and increase the
financial viability), but not more, in order to maximise the number of projects that can be supported.
Along with it, the Commission presented in June 2018 its proposal for a CEF II Regulation, which is currently
under negotiation with both the Council and the European Parliament. The CEF II Regulation foresees three
possibilities: to blend grants with InvestEU financing, to scale up the blending facilities, and to continue
blending calls.
Moreover, there is a positive evolution of the regulatory context of EU financing. For example, in May 2018,
the European Commission came forward with a proposal for a new Cohesion Policy under the next MFF
2021-2027. With regard to ex-ante conditions, it proposes to replace them with so-called “enabling condi-
tions”. The key differences are fewer conditions (from 35 to 20), clearer conditions, and a tighter link to policy.
Such conditions are strongly appreciated as long as they will not be a step backwards to less stable plan-
ning. Indeed, stable planning is extremely important to lower the political and regulatory risks for private
investors. Certainly positive in this regard is the fact that the conditions are proposed to be followed up
throughout the implementation of the project and not only at the beginning.

FROM EFSI TO INVESTEU

In December 2017, the Council and the European Parliament adopted Regulation (EU) 2017/2396 extending
the life of the EFSI (European Fund for Strategic Investments, initially the “Juncker Plan”) programme until end-
2020, while introducing provisions to improve its additionality and transparency. At the same time, the Europe-
an Commission published a call for the provision of technical assistance to strengthen the EFSI Advisory Hub.
In June 2018, the European Commission also presented its draft InvestEU Regulation with InvestEU to repla-
ce EFSI over the next financial programming period 2021-2027. InvestEU represents a positive development
of EFSI: it will be policy-, rather than demand-driven, it will integrate under one roof all EU financial instru-
ments and advisory services, and dedicate specific emphasis to sustainable infrastructure. More importantly,
it will aim to open up the guarantee mechanism to national promotional and commercial banks on top of
the EIB, which was one of the concerns expressed by many stakeholders.
While EFSI has been demonstrating positive results overall, it has shown rather low support of transport
infrastructure projects. This is partly explained by the fact that many transport activities show low levels
of rentability because it is difficult to apply the “user pays” (and the “polluter pays”) principle. The transport

The Future of TEN-T in Europe and Beyond                                                                       | 19
sector has historically been positioned as a public service that the citizens are expected to use more or less
freely, having contributed to it with their taxes. However, public budgets have been reduced, and transport
infrastructure have become much more costly and sophisticated, and still, citizens are reluctant to contribu-
te directly through user fees or higher ticket prices. Therefore, many project promoters, notably in rail and in
urban infrastructure, still rely on public resources and implicit guarantees, and thus their risk profile is unfit
for the use of EFSI and similar high-leveraged financial instruments.
A change of mentality and habits is necessary, although it cannot be expected that this situation will chan-
ge overnight. Hence, it is important that investment support programmes such as EFSI (and InvestEU in the
future) dedicate special care to sustainable transport (and other sectors which pose similar challenges).
Moreover, it is necessary to avoid that the EU support instruments address projects which would have been
picked up by the market anyway. They should rather intervene where the market sees too high risks and too
low returns. The EU granting system needs to be improved towards this goal.

THE ACTION PLAN ON FINANCING SUSTAINABLE GROWTH

Following the final report of the High-Level Group on Sustainable Finance in January 2018, the European Com-
mission came forward in March 2018 with an “Action Plan on financing sustainable growth”. It contains ten
specific actions, the most important one for transport being the establishment of an EU classification of sustai-
nable activities, which is referred to as the "green taxonomy", and the establishment of green standards for the
bond market. This taxonomy is being developed and is currently under public consultation in its first round.
Importantly, it also covers all the transport activities that can help fight climate change and broadly ad-
dresses environmental challenges, among other things, by giving rise to a new asset class in the financial
markets. Another important action is to foster investments in sustainable projects. This is addressed by the
Sustainable Infrastructure Window of InvestEU.

BEYOND THE EU

The financial efforts put in place by the EU and the EIB also refer to other Countries outside the Union, like
the members of the EFTA (European Free Trade Association), the candidates for membership, and those in-
cluded in the “neighbourhood policy”. The main purpose is to contribute to their development, but also to
keep them involved in the internal single market.
The underlying strategy is not only economic but also political, with the purpose of intensifying relations
with these Countries by keeping them involved in the developments of the single market and other EU acti-

The Future of TEN-T in Europe and Beyond                                                                      | 20
vities, and of contrasting the economic and geopolitical interests of other important international players.
The most obvious case refers to China and its “Belt and Road Initiative”, a project also known as “One Belt
One Road” (OBOR). China shows a keen interest in strengthening relations with European and neighbouring
Countries through investments, in particular in infrastructure, as well as elsewhere in the world (like in Afri-
ca), also thanks to the financial means of its Asian Infrastructure Investment Bank (AIIB).
For the EU it is necessary to find an adequate balance between the goal to have reciprocally satisfactory
economic and political relations with China and, at the same time, to avoid some dangerous activities in
the field of investments in infrastructure, as well as in that of productive investments, in order to have a true
reciprocity in economic behaviours (like in procurement) and to safeguard its strong points in technology
(like that concerning ERTMS).
As far as transport infrastructure are concerned, recently it was agreed by both parties that the European
Commission and China would support a study (to be delivered by the World Bank by the end of this year)
on how to better connect the European corridors (starting from the EU’s external borders) to the Chinese
network (that is, to China’s external borders). This indeed is a promising sign, and it shows good will on both
sides. In addition, the Chinese Authorities have also agreed to present in the coming months their transport
infrastructures planning in an open event in Brussels.
The European transport and infrastructure policy so far has supported European companies in enjoying the
benefits of the single market and in strengthening their competitive position at the global level. Citizens
have also greatly benefited from it, in terms of more liberty and higher welfare levels. This should continue
to be the case also with a more important role by other players, through the development of a balanced
cooperative environment to the interest of all parties involved, while contrasting the risks stemming from
unfair competition and potential dominant or even quasi-monopolistic situations.

The Future of TEN-T in Europe and Beyond                                                                     | 21
1. Although, the commitment of the European Institutions in
this field dates back to the European Council of Essen (9-10
December 1994), when the first “Priority Projects” were agreed
upon. The present policy framework is the result of the evolu-
tion taken place since then, in particular after the approval of
the “White Paper on Transport” in 2011.
2. Regulation (EU) No 1315/2013 of the European Parliament
and of the Council of 11 December 2013.
3. Regulation (EU) No 1316/2013 of the European Parliament
and of the Council of 11 December 2013.
4. Of these, four cross Italy from North to South and from West
to East: Baltic-Adriatic, Mediterranean, Rhine-Alpine, and Scan-
dinavian-Mediterranean.
5. The “core” network connects cities, ports (both maritime and
inland), airports, rail road terminals which qualify above a given
threshold (in any case at least one for each Member State), while
the “comprehensive” network is more of national and regional
interest, ensuring accessibility for all regions to the core one.
6. On the EIB web site many documents and studies on infra-
structures investments are available, including the reports of
the EPEC (European PPP – Public Private Partnerships - Centre).
7. The last names of the three original authors explain the
acronym (CBS) used for the Report and for its subsequent re-
visions.
8. All relevant studies and documents both of a general nature
(including the Work Plans of the Core Network Corridors) and
specific to financial issues can be found in the website of the
D.G. “Mobility and Transport” of the European Commission.

The Future of TEN-T in Europe and Beyond                             | 22
ITALIAN INSTITUTE
  FOR INTERNATIONAL
  POLITICAL STUDIES

                                  HYPERLOOP TECHNOLOGY
                               A POTENTIAL BREAKTHROUGH*
                                                            CARLO DE GRANDIS

       Hyperloop is currently a potential new transport mode based on individual pods carrying passengers
       (~24-100 people) or containers at very high speed (passengers services up to 1080-1200 km/h), using
       (passive?) magnetic levitation, in a confined near-vacuum tube (~100 Pa1); its technology stems from
       previous high-speed guided transport models for low-pressure environment, starting back to the XIX
       century2, with an underground network for medium distances studied more recently in Switzerland3.

       These elements make the proposed system almost frictionless – allowing in principle very high speed
       and high energy efficiency, the latter depending largely on the following factors:

          •    the efficiency of kinetic energy conversion into electric power through a regenerative braking system
          •    the energy needed to keep the infrastructure in a quasi-vacuum state (and pressurising stations).

               F = force (resulting); m x g = force of gravity, m v² / r = centrifugal force (the two forces do not add up in intensity,
               being orthogonal, and the result is an overall force that is only slightly higher than the larger of the two - hence the
               possibility of containing the radii of curvature).

       In terms of transport performances, every pod would have a single origin-destination per journey, thus
       minimising the journey time – different pod size would provide a more distributed connectivity to poles
       along the route.

* The views expressed are purely those of the writer and may not in any circumstances be regarded as stating an official position of the
European Commission.
                                                                                                                                           | 23
Such a technology would connect a series of nodes along a route and not just the main poles – hence its
potential for complementing high-speed rail and air services contributing to a balanced territorial deve-
lopment of the polycentric fabric of the EU.
An often ideological debate has taken place on the suitable routes and morphology fit for Hyperloop,
which could serve a wide series of poles connecting destinations of up to 100 km in few minutes and a
range of 1000 km in ~ an hour.
Tilting pods could fit into routes comparable to high-speed (radius of ~20-30 km), considering the com-
bined action of gravity and centrifugal force (see picture) – the resulting force on the apparent vertical
axis would yield less than 5% increase to gravity. With an adequate radius, Hyperloop is potentially fit to
connect nodes at different height without additional energy supply: a pod running at 300 m/s could use
5% of its kinetic energy to “climb up” by 500 m.
In terms of Capacity, it depends on pods capacity, frequency (safety braking margins – virtual couplings):
estimates differ widely – according to the promoters the range is between 3,600 to some 20,000 passen-
gers/h per direction.
In terms of potential services offered, priority would be considered for complementing/integrating hi-
gh-speed lines and nodes (airports and urban areas), which might be confronted with very high opportu-
nity costs of new runways / new high-speed connections e.g.:
• connections between airports and nodes (Paris - CDG - Orly, London - Heathrow -
Gatwick, Milan - MPX - LIN - BGY);
• complementary routes to high-speed and commuters (e.g. Nancy - LGV Lorraine - Metz - Luxembourg);
• linking Capital cities with no high-speed connectivity – (Oslo - Stockholm - Helsinki -
Tallinn; Budapest - Bratislava - Wien - Prague - Berlin).
Research and technological development activities for this greenfield technology can yield useful outco-
me to other automated transport technologies, e.g.:
• fully-automated high-performance control system, with real-time positioning and speed-mete-
ring integrating vehicle-to-vehicle and vehicle-to-infrastructure low-latency communication, and
a responsive traffic management system;
• advanced (passive) magnetic levitation (leading to quasi-frictionless land transport);
• high-efficiency regenerative braking.
Europe has a potential linked to a sound IP regime, a strong industrial and engineering basis, and the pos-
sibility to set-up world-wide standards for risk assessment and authorisation purposes – these reasons
underpin the current development of three test sites and at least three development centres in the EU4 .
It is therefore of the uttermost importance to foster the development of European intellectual property on
Hyperloop, in spite of the currently marginal role on it – EU RTD funding shall be considered as a priority.
1. Pa is the Pascal, a small unit of pressure equivalent to 1 kg / 2. https://en.wikipedia.org/wiki/Beach_Pneumatic_Transit
m s² (International System) = ~ 1 / 100,000 atmospheres (100 Pa 3. https://swissmetro.ch/fr/project/
is one thousandth of Atmosphere - going down requires great 4. Sites under construction. Test sites: 2 in France, 1 in Spain;
effort in terms of pumping and holding, for minimal results. components (testing / assembly): Spain, Italy, Slovakia.
Hyperloop Technology - A Potential Breakthrough | 24ITALIAN INSTITUTE
FOR INTERNATIONAL
POLITICAL STUDIES
3. STRATEGIC INFRASTRUCTURE AND
INVESTMENT RESTRICTIONS
STEFANO RIELA, ALESSANDRO GILI
Free capital movement is one of the axioms of modern global capitalism, and attracting Foreign Direct In-
vestments (FDIs) is a prime objective for policymakers. FDI refers to the flow of capital between countries
and it associated with a resident in one economy having control or a significant degree of influence on the
management of an enterprise that is resident in another economy1. Therefore, FDI distinguished from por-
tfolio investment in that, as well as "lasting", it means that the investor has control over the assets invested in.
Countries generally welcome FDIs, and almost all of them have established national promotion agencies to
attract foreign investments. FDIs increase the capital stock in host countries, setting the conditions to create
more and better job opportunities thanks to technological spillovers capable of increasing the economy's
productivity, thus boosting he host country's GDP. However, FDIs are increasingly perceived and used as a
geopolitical tool, and they have recently triggered the introduction or the strengthening of existing scree-
ning procedures and restrictions for foreign investments in the so-called strategic sectors.
FDI INVESTMENTS HAS MORE THAN DOUBLE IN THE LAST DECADE
From 2006 to 2017, the worldwide stock of FDI has more than doubled, reaching the overall value of US$31.5
trillion. After the historical peak in 2007 and the collapse of 2008, FDI inflows recovered and registered in
2017 a value of US$1.4 trillion (Figure 1.1).
Despite the potential economic effects of FDIs, some countries identify the sectors and assets dubbed as
“strategic” and foresee different screening procedures and restrictions mainly on brownfield2 FDIs depen-
ding on the target sector and on the nationality of the investor.
| 25The ownership of strategic assets involves vulnerability concerns, i.e., the risk to be exposed to an “unfrien-
dly” strategy by foreign States or actors. For this very reason, restrictions to FDIs are explained by two di-
mensions – national security and economy – that, despite this formal division, are substantively intertwined.
Firstly, the military industry is generally highly protected since the unavailability of weapons and munitions
reduces the effective defence capability (not to mention the offensive one): the helping intervention by an
allied country cannot be as immediate and effective as a domestic force. Secondly, infrastructure such as
those that provide services of general economic interest3 is relevant for both the security and the economy
of a country. Telecommunication, transport, energy, and water infrastructure are the backbones of a coun-
try’s economy and security, and the services they provide can be barely imported from abroad. Finally, some
assets can be relevant for an economy due to their weight on national export (e.g., commodities), their low
degree of substitutability (e.g., land), and their relevance for competitiveness (e.g., patent filings and data-
bases).
Fig. 1.1 - Worldwide Foreign Direct Investment:
inward and outward flows and stock, annual (bnl, usd)
Source: Unctad
Strategic Infrastructure and Investment Restrictions | 26In general, an FDI, like any other type of financial investment, is undertaken by an economic agent with a focus on profitability from a medium-term perspective. In those few cases when a firm can benefit from ter- minating the sale of services of a newly acquired firm abroad, competition and antitrust authorities should block that acquisition thanks to ex-ante concentration control systems. Therefore, there should be a negli- gible risk that a foreign owner finds an incentive to stop electricity or telephone services, especially in those highly-regulated services where penalties are imposed if quality conditions are not met. The incentives for investors might be different when they are not rooted in a market economy, especially when it comes to State-Owned Enterprises (SOEs). In this case, the medium-term profitability can be sacrifi- ced on the altar of a long-term geopolitical strategy by the government of the country of origin. Therefore, for example, a foreign investor that gets the control of the national electricity grid and shrinks the electricity availability in the target country (hich experiences a loss) can put the target economy in jeopardy and favour firms in the country of origin. In the host country, such an FDI could lower the GDP, increase the unemploy- ment, and diminish tax receipts. Private firms in a market economy cannot define that investment as “ratio- nal” if not subsidised by the only agent that can use non-market resources such as taxpayer money in States where freedom is restricted. SCREENING OF AND RESTRICTIONS ON FDIs The OECD annually publishes an index to evaluate countries’ openness to FDIs in 22 different economic sec- tors4. The most protected sectors are aviation, maritime and, to a lesser extent, production and distribution of energy. From a geographical standpoint, the index registers higher restrictions in the Middle East and Asia (Saudi Arabia, China, India, and Indonesia), whereas the EU reports a marked degree of openness. A wave of increasing restrictions against FDIs followed the wide privatisation process in the 1990s and 2000s since States lost direct control through the ownership of firms in sectors deemed as strategic such as tran- sport, energy, and telecommunications. From 1997 to 2017, the reforms undertaken to liberalise entire eco- nomic sectors in several countries (Figure 1.2), especially in Asia, have been linked to a decrease in the index: e.g., from 0.63 to 0.32 in China. However, the difference in restrictiveness between big trading countries is clear, thus raising the issue of (the lack of ) reciprocity. In order to evaluate a potential FDI, countries have adopted different procedures. The most stringent appro- ach is the partial or full prohibition of FDIs in defined sectors; this type of restriction applies mostly to the defence sector and to the production of chemical and radioactive materials. The second approach, adopted by a rising number of countries, involves an ex-ante review by governments concerning the investment Strategic Infrastructure and Investment Restrictions | 27
Fig. 1.2 - FDI Regulatory Restrictiveness Index 1997-2017

                                                       Source: Unctad

proposals and requires a preventive authorisation to takeovers. Finally, the third approach is a scrutiny sy-
stem on individual transactions that are later subjected to reviews.

FDI PROTECTION IN THE UNITED STATES

The Committee on Foreign Investment in the United States (CFIUS) was established in 1975 to defend the
US against threats to security arising from the takeover of American companies by foreign investors. Three
are the main threats analysed by CFIUS: a) the leak of sensitive technologies to a foreign company or gover-
nment which may use it or sell it with harmful effects for national security; b) the possibility that a foreign
investor – independently or on the instructions of its government – delays, denies, or attaches conditions to
the supply of goods and services; c) when the takeover could represent an entryway to the American indu-
strial system, in order to steal information or conduct surveillance. Those concerns have even more grounds
in case of SOEs5. In 2018, the US Congress approved the Foreign Investment Risk Review Modernization Act
(FIRRMA) to enhance the powers of the CFIUS6 and to restrain the exportation of “foundational and emer-
ging” technologies, whose sharing with a foreign buyer may undermine the American leadership in key

Strategic Infrastructure and Investment Restrictions                                                       | 28
industrial sectors. In particular, FIRRMA requires the release of a biennial report on Chinese investments in the US and whether the principle of reciprocity is fulfilled7. FDI PROTECTION IN THE EUROPEAN UNION AND IN ITALY The European Union (EU) is the world’s leading source and destination of FDIs and one of the most open re- gions for FDIs. FDI screening is an exclusive responsibility of the individual EU Member States, and not all of them are adopting a screening procedure. However, in 2016, a surge in takeovers of strategic infrastructure assets and EU firms producing cutting-edge technologies has been registered and, in 2017, France, Germany, and Italy published a "Proposals for ensuring an improved level playing field in trade and investment”. That political momentum led to the proposal of a new regulation for an EU investment screening framework8 to establish cooperation for information exchange between the Member States and the Commission9. Howe- ver, for Germany and France10, this cooperation is not enough to protect strategic assets unless every single EU Member State adopt a screening mechanism is as effective as theirs. In Italy, the “golden power” system (Law Decree no. 148/2017) allows the exercise of powers and a review to any merger or acquisition affecting a company operating in a strategic activity in the fields of defence, national security, energy, transport, and communication – regardless of shares held by the State in the com- pany. The Presidency of the Council of Ministers is the authority responsible for conducting the reviews. For investments relating to the national security and defence sectors, the review process requires the partici- pation of the Ministry of Foreign Affairs, the Ministry of Infrastructure and Transport as well as the Ministry of the Interior and of Economic Development. The authority should assess whether the investor is effecti- vely controlled by a foreign Government also through significant funding11 and has the power to deny the transaction or apply conditions to it. In 2017, the Law 172/2017 widened the sectors deemed as strategic, high-technology sectors in particular12. THE SURGE OF CHINESE TAKEOVERS China became a member of WTO in 2001 with a non-market economy status13; a status that, after its expira- tion in 2016, has been unilaterally confirmed by the US14 and the EU15. Both argue that the role played by Chi- nese public authorities in the national economy gives an unfair advantage to national firms that compete in international markets through trade and investments. This concern found ground when, after the economic crisis, Chinese SOEs turned extremely active in going shopping especially in the US and Europe (see Chinese outward FDIs in Figure 1.3). This upsurge in FDIs is perfectly in line with the Government strategy “Made in Strategic Infrastructure and Investment Restrictions | 29
You can also read