The DAPSI(W)R(M) problem-structuring framework applied to the Venice Lagoon
←
→
Page content transcription
If your browser does not render page correctly, please read the page content below

Master’s Degree
                              in Environmental Sciences

                                       Final Thesis

     The DAPSI(W)R(M) problem-structuring
     framework applied to the Venice Lagoon

Supervisor
Prof. Piero Franzoi

Co-supervisor
Prof. Mike Elliott (Hull University)

Graduand
Marco Fiandra
Matriculation number
868020

Academic Year
2018 / 2019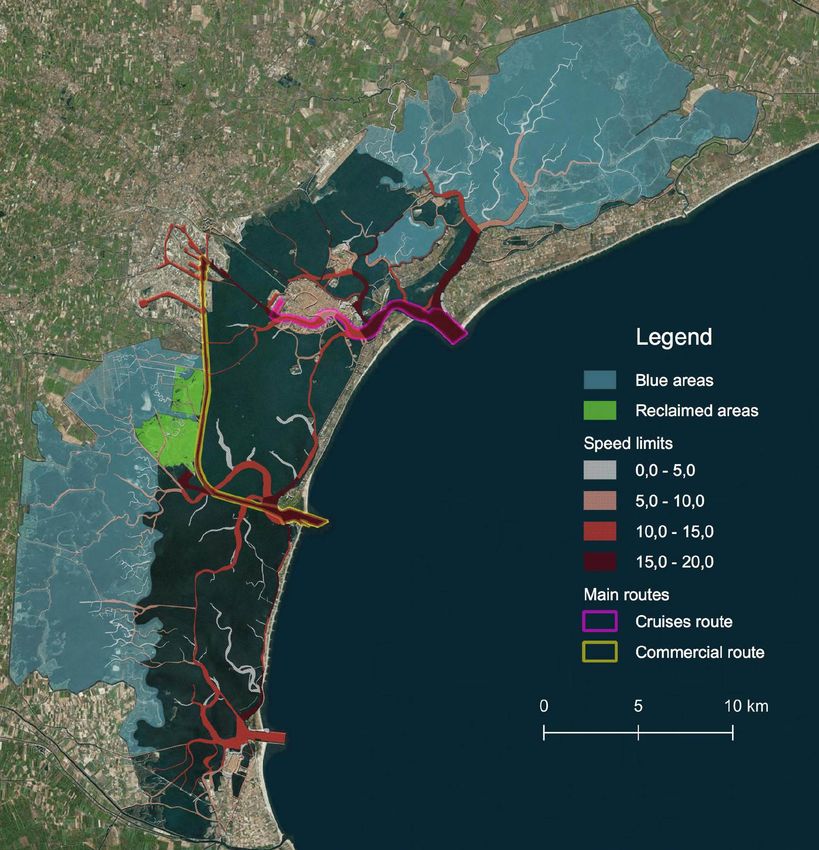
ABSTRACT

   Using the DAPSI(W)R(M) environmental framework, the multiple links between anthropogenic
activities and environmental degradation within the Venice Lagoon have been qualitatively defined.
This model aims to organise the available information according to a rigorous cause-and-effect
scheme, so as to more easily reach a multitude of stakeholders, environmental management bodies,
the scientific community and the public. DAPSI(W)R(M) is therefore characterized by a strong
multidisciplinary, analysing the different aspects of environmental management (research,
monitoring, policies ...) to evaluate and direct its work. It consists of 5 elements. Starting from the
Drivers (D), in form of human needs, are inserted, discussed and compared various human Activities
(A) that take place within the Lagoon borders, with a specific focus on sectors with a high
"environmental impact". They consequently produce a multitude of Pressures (P) on the natural
environment, which, synergically or not, produce State changes (S), negatively modifying ecosystem
services, and therefore creating Impacts (on human Welfare) (I(W)). To conclude the process, a series
of Responses (as Measures) (R(M)) are produced, which aim to improve the territory by acting on
one or more other components, underlining the many feedback loops existing in the framework. Due
to the high diversity and therefore complexity of the territory, the work primarily aims to introduce
the DAPSI(W)R(M) framework as an approach methodology for managing the coastal lagoon
environment, rather than exhaustively defining each single element. Although it is not a detailed
approach, the most exhaustive description and analysis has been carried out, collecting as much
informative material as possible. This working methodology could become fundamental in the future,
to define the guidelines for the management of complex environmental systems, taking into account
all the social, economic and environmental aspects in a single reference framework.

                                                                                                     2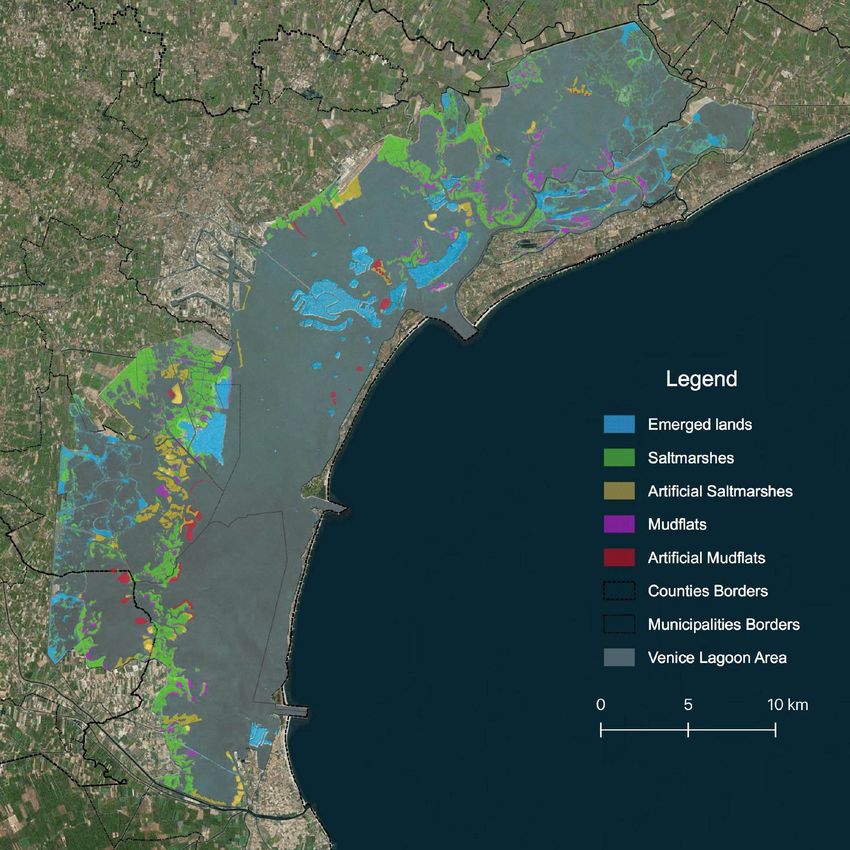
ACKNOWLEDGEMENTS

I wish to express my deepest gratitude to my supervisors, prof. Piero Franzoi and
prof. Mike Elliott, for their guidance and assistance during the development of this
work, without whom it would not have been possible. I would also thank all the
other people who have contribute by advising me and providing me data. A special
thank goes to my family and friends, for having supported me during my studies.

                                                                                       3
SUMMARY

1. INTRODUCTION ......................................................................................... 6

  1.1 THE NEED OF A NEW FRAMEWORK .................................................................... 7

  1.2 STUDY AIMS AND OBJECTIVES ............................................................................ 9

2. STUDY AREA.............................................................................................. 10

3. METHODS: THE DAPSI(W)R(M) FRAMEWORK .............................. 14

4. RESULTS AND DISCUSSION .................................................................. 18

  4.1 DRIVERS............................................................................................................. 18

  4.2 ACTIVITIES ........................................................................................................ 19

     4.2.1 Tourism ............................................................................................................................. 20

     4.2.2 Public and Commercial Transport System ....................................................................... 21

     4.2.3 Food Industry .................................................................................................................... 24

     4.2.4 Land-Based Industry and Municipal Services .................................................................. 28

  4.3 PRESSURES ......................................................................................................... 30

     4.3.1 Endogenic Managed Pressures (EnMP) ........................................................................... 30

        4.3.1.1 Fishing Disturbances............................................................................................................................... 31

        4.3.1.2 Dredging and Excavation Impacts on Morphology ................................................................................ 32

        4.3.1.3 Water and Air Pollution .......................................................................................................................... 33

     4.3.2 Exogenic Unmanaged Pressures (ExUP) .......................................................................... 36

        4.3.2.1 Climate Change ....................................................................................................................................... 36

        4.3.2.2 Alien Species ............................................................................................................................................ 37

                                                                                                                                                                          4
4.4 STATE CHANGE ................................................................................................. 38

     4.4.1 Abiotic changes................................................................................................................. 39

     4.4.2 Biotic changes ................................................................................................................... 41

  4.5 IMPACTS (ON HUMAN WELFARE) ...................................................................... 44

     4.5.1 Provisioning services ........................................................................................................ 47

     4.5.2 Regulating services ........................................................................................................... 47

     4.5.3 Cultural services ............................................................................................................... 47

  4.6 RESPONSES (AS MEASURES) .............................................................................. 51

     4.6.1 General Plan of Interventions ........................................................................................... 54

        4.6.1.1 High waters defences ............................................................................................................................... 54

        4.6.1.2 Compensation plan .................................................................................................................................. 54

     4.6.2 Life+ projects .................................................................................................................... 57

        4.6.2.1 Life Vimine............................................................................................................................................... 57

        4.6.2.2 Life Seresto .............................................................................................................................................. 57

        4.6.2.3 Life Lagoon Refresh ................................................................................................................................ 58

5. CONCLUSION ............................................................................................ 59

  5.1 AN OVERVIEW ................................................................................................... 59

  5.2 FINAL REMARKS................................................................................................ 62

6. REFERENCES............................................................................................. 63

7. ANNEX 1 ...................................................................................................... 81

                                                                                                                                                                           5
1. INTRODUCTION
   The world is changing, and with it, its natural environment. Coastal waters, supporting most of
human population, are currently facing high degradation, due to the extremely complex relations
between inland and open seas: acting as ecotones, they receive waters from every human settlement,
mediating them offshore.
   To correctly manage those delicate territories, many attempts have been done. From academia,
private holdings and governments, have been carried out innumerate monitoring and consequent
measures to enhance the so-called ecosystem services, and restore the natural environment to its
maximum ecological state. Unfortunately, those actions have had a limited effect, because often too
specific without consider the entire environmental and socio-economic patterns, therefore not
reaching the governance. To cope with an uncertain future (e.g. climate change consequences), it is
critical to understand holistically how anthroposphere can affect ecosystem processes and functions,
and how ecosystems provides services and benefits to human societies. To do so, have been created
many frameworks to solve the puzzle. PSR (Pressures - States – Responses) was the pioneer of them
(Rapport & Friend, 1979), while later in the 1990s has been universally adopted DPSIR (Drivers –
Pressures – State – Impacts – Responses), popular among the scientific community since the
recommendations of OECD (1993), EPA (1994), EEA (1999), and EC (1999) for its application.
   Because of many critics to this framework (e.g. Patricio et al., 2016), especially regarding some
common misunderstanding, has been introduced a new concept for coastal environments:
DAPSI(W)R(M) (pronounced dapsi-worm) (Elliott et al., 2017). In this new framework, it has been
unified all the previous knowledge to solve the misunderstandings and finally use a linear cause-
effect chain to describe the natural environment, including its socio-economic sphere. It is composed
by 6 elements named Drivers, Activities, Pressures, State Change, Impacts (on human Welfare),
Responses (as Measures), and each of those creates a cascade event on the others as displayed in fig.
1. The framework has been here applied on Venice Lagoon (fig. 3).
   Venice Lagoon is a microtidal transitional water ecosystem, with tides up to 1 m of excursion,
characterised by wide extensions of shallow brackish water interrupted by a network of channels and
saltmarshes habitats (Ravera, 2000: MAV, 2010). It is a semi-enclosed basin which is inserted as
UNESCO world heritage site, but currently threatened by many anthropogenic disturbances
(Guerzoni & Tagliapietra, 2006). Through the centuries, but especially in the contemporary era, the
city urbanization and industrialization has induced many complex environmental changes (e.g.
Bevilacqua, 1998), which have heavily modified the geomorphological and ecological structure. To
cope with this metamorphosis, have been adopted some measures to enhance the Lagoon ecosystem,

                                                                                                   6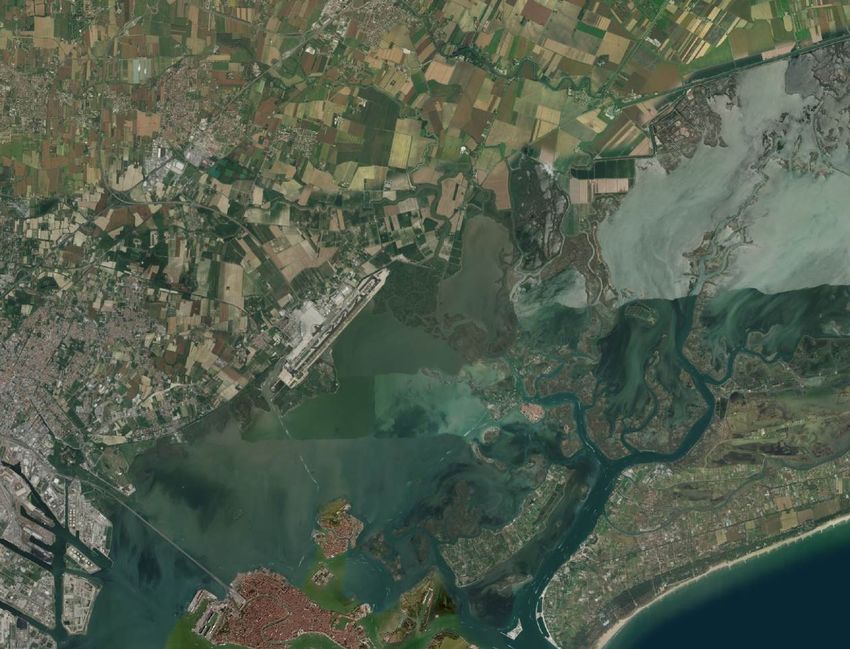
such as the here described LIFE+ projects and the compensation plan (Consorzio Venezia Nuova,
2016). This study will also describe some of the main processes impacting the Lagoon.

                 Fig. 1. Illustration of the multiple interactions between the framework elements, including
                 the feedback loops coming from R(M). Modified from Elliott et al. (2017).

   Similar attempts available in the literature to apply frameworks in such a wide area has been done
by MAV (1990), MAV (2010), Solidoro et al. (2010), Pastres & Solidoro (2012). Those studies,
together with the work by Provveditorato interregionale OO. PP. (2016), have been extremely useful
to set up the entire analysis. According to Pastres & Solidoro (2012), even though “the Lagoon of
Venice has been deeply investigated and extensively monitored, a framework like DPSIR could fill
the result gaps and improving the monitoring and management strategy, often fragmented by the
governance structure”. As per this study, DAPSI(W)R(M) could add to the previous attempts many
other updated information and distribute them in a more linear cause-effect chain.

   1.1 THE NEED OF A NEW FRAMEWORK
   After the 1970s-environmental movement and the late century environmental-related issues,
worldwide governments have started to deal with Integrated Water Resources Management (IWRM),
in order to effectively and efficiently manage water resources (Rahaman et.al., 2004; Elliott, 2014;
Glaeser, 2019). This has led to the creation in the 1990s of many important “holistic” legislation
applied in the coastal environments, after 30 years of water legislation dealing with individual issues
(Boyes & Elliott, 2014; Giakoumis & Voulvoulis, 2018b) such as the Water Framework Directive
(WFD) (Directive 2000/60/EC; Decreto 260/2010), the Marine Strategy Framework Directive
(MSFD) (Directive 2008/56/EC, Decreto 190/2010), or more recently in the Mediterranean Sea, the

                                                                                                               7
Protocol for Integrated Coastal Zone Management under the 2009 “Barcelona Convention” (Borja et
al., 2010). Notable, both WFD and MSFD target the desired state of the environment whereas other
European directives (e.g. EU Common Agricultural Policy (CAP), EU Common Fishery Policy
(CFP), EU Urban Waste-water Treatment (UWWTD) and Nitrates Directive) target the sources
behind the problems (Boyes & Elliott, 2014).
   One of the main purposes of coastal systems management is to gather information to link human
Activities with the effects on structure, functioning of ecosystems to better assess cause-effect-control
events. With this goal, many frameworks have been created, the latter here adopted in this analysis.
   As displayed in fig. 2, the first framework introduced to deal with integrated marine management
has been the Pressure-State-Response (PSR) proposed by Rapport & Friend (1979). This was a
conceptualization of marine ecosystem risk analysis, mixed with risk management issues, to better
reach stakeholders, environmental managers and academia. Here every unwanted system change
(State changes) were caused by Pressures and then reduced or removed by society Responses. In
1990s, with the born of the Drivers-Pressures-State Change-Impact-Response (DPSIR) framework,

                Timeline

                  2016

                                                                        PSR/E

                  1980                                                   PSR

               Fig. 2. DPSIR and derivatives development in a form of a tree. From down to top PSR, DPSIR,
               DAPSI(W)R(M) and other frameworks mentioned in the text. Adapted from Patricio et al. (2016).

                                                                                                               8
the old PSR has been substituted. The policy-oriented DPSIR framework, largely promoted by the
OECD (Organization for Economic Cooperation and Development) (OECD, 1993) and soon adopted
by several international organizations as US EPA (Environmental Protection Agency) (EPA, 1994),
UNEP (1994), has been also adopted by European Union, at the time considered the most appropriate
way to structure environmental information (EC, 1999).
   To implement many other policy-based decisions, several DPSIR-based frameworks are born,
leading to stronger social applications such as EBM-DPSER (Kelble et al., 2013), or human health
frameworks (DPSEEA) (von Schirnding, 2002). Still many publications pointed out some limitations
of the canonical DPSIR applied on coastal management (Eastwood et al., 2007; Atkins et al., 2011;
Martins et al., 2012; Gari et al., 2015; Lewison et al., 2016; Patricio et al., 2016). Common critics
were in relation to differences in the use, terminology and misinterpretation by many authors of
various components, particularly P, S, and I. The term “Pressure” is often interchangeable with
“Activity” or “Driving force”, while State change and Impact has been commonly used as Impacts
on the environment or Impacts on society due to environmental State changes. But P-S-I elements
are not mutually exclusive, despite being commonly treated as such.
   According to Patricio et al. (2016), S and I definition misunderstandings had led to the “modified
DPSIR” (mDPSIR) of the ELME EU FP6 project, where Impact categories were restricted to Impacts
on human systems. This has led to the DPSWR framework (Cooper, 2013) in the KNOWSEAS FP7
project, where Impacts has been changed in Welfare, even tough should be called “Impact on human
Welfare” rather than “Welfare” per se, thus leading to the most recent DAPSI(W)R(M) derivative
(Scharin et al., 2016; Patricio et al., 2016).
   An important target of this new DAPSI(W)R(M) framework has been unification of natural and
social sciences to solve the many issues created by human Activities and spreading in the seas
(Gregory et al., 2013). Then for the first time has been illustrated a clear cause-effect relationship,
linking Activities to both the D and P components (Patricio et al., 2016). In the methods paragraph
(3) the framework will be better discussed.

   1.2 STUDY AIMS AND OBJECTIVES
   The DAPSI(W)R(M) approach focus on the relationships between the anthroposphere and the
natural environment, considering all the aspects of human development together (societal, economic
and environmental). It is designed to cross disciplines, addressing different aspects of environmental
management (research, monitoring, mitigation, policy, and society) and better reach scientific
community, environmental managers, policy-makers and the public. All the society could therefore

                                                                                                     9
benefit from this approach, which could be used in this complex environment as a guideline for future
management projects or as a tool for enhancing environmental awareness.
   The full product of this analysis (Annex 1) mirror the image represented in fig. 1, where each
element creates a cascade impacting other elements, creating many feedback loops starting from R.
   In order to apply the DAPSI(W)R(M) framework to the Venice Lagoon social-ecological system,
it has been gathered here as much published and unpublished information currently available to
outline an extensive (not exhaustive) picture of the territory. The strong complexity and diversity of
the area has been then organised and described, following the cause-effects scheme of the framework
(Elliott et al., 2017), to show how this methodological model could be applied here and the
relationships between the elements (Drivers, Activities, Pressures, State changes, Impacts on human
Welfare, Responses as Measures). Therefore, this work primary aim to implement the Venice Lagoon
system management and not extensively describe each element, even though it has been performed
the more comprehensive description and analysis as possible.

   2. STUDY AREA
   The Lagoon of Venice is a complex economic, social, and environmental system (Rinaldo, 2001),
with peculiarities both on the surface and subsurface environments. Covering an area of 550 Km2 it
is considered one of the widest in Europe and the Mediterranean Sea (Aspden et al., 2004; Libralato
et al., 2004). Geomorphologically it can be described as a restricted lagoon type, due to its high impact
of tidal circulation and water movement (mainly caused by the wind). Here spring and fall are the
wettest seasons, while winter and partially the summer, the driest; water and air temperatures
(monthly average from 3°C to 24°C) have a seasonal cycle, with minimal values in January, and
maximal in July (Solidoro et al., 2010)
   The territory (Fig 3), which contains numerous inhabited islands (45 Km2 per Solidoro et al.,
2010) such as Murano, Mazzorbo, Burano, Sant'Erasmo, is delimited and separated from the Adriatic
Sea by three long and narrow pieces of lands: Cavallino peninsula (North), Lido (centre) and
Pellestrina (south) island. Far south lies Chioggia, with its own archipelago including big islands such
as Sottomarina. The city is not part of Venice Municipality, but forms a municipality of its own under
the Venice County, and is included in the UNESCO world heritage site, which covers the entire
lagoon.
   According to Comune di Venezia (2019), Venice Municipality has reached a population of
259,297 residents. The biggest conglomerate of Islands in the centre host the famous city of Venice,
(52,143 people), while around 27,578 residents live on other islands and the bulk of residents inland
(179,576) (Comune di Venezia, 2019). The city centre population reached its peak in 1951 with
                                                                                                      10
174,808 residents but as the tourism has increased, its resident population has fallen (Grydehøj &
Casagrande, 2019).
Marco Polo airport
Mazzorbo
Ponte della Libertà
Mestre
Tronchetto
Porto Marghera
Industrial Zone Pellestrina
(PMIZ)
Burano
Piazzale Roma
Sant’erasmo
Murano
Venice city Center
Lido
PADUA COUNTY
Sottomarina
Chioggia city Center
Fig. 3. Study area representing the Venice Lagoon, divided by the red lines between the northorn, southern and central part. The
localization of artificial and natural saltmarshes/mudflats, emerged lands (inside the lagoon areas) has been retrieved from Atlante
della Laguna, based on the MAV campaign in 2013. Produced using QGIS on Microsoft Bing Maps.
The lagoon system is composed of shallow water of 1 m in average, with tidal flows reaching
more than 1 m. It exchanges 1.5 108 m3 in each tidal cycle with open seas and receives freshwater
from 27 tributaries (maximum discharge of 100 m3/s) (Malavasi et al., 2004, Libralato et al., 2004).
The dominant winds, blowing up to 10 m/s, are Sirocco from southeast and Bora from northeast.
Those winds, together with tidal cycles and river discharges, contribute to the large clockwise eddy
made by currents around the Venice islands, with a net southward flux of water driven from the many
11discharges in the northern section (Solidoro et al., 2010). Per Cucco et al. (2009), the average water
residence values for the inner part could be higher than a month, while it is a few days for seaward
areas.
Hydrologically the lagoon can be divided in three main sub-basins: northern, central and southern
(Solidoro et al., 2004; Zucchetta et al., 2016) (fig. 3). The main discharge points (fig. 11) are:
§ Dese river, Silone channel, Marzenego-Osellino channel in the north lagoon;
§ Naviglio Brenta channel and Lova channel within the central part;
§ Taglio Nuovissimo channel, Montalbano channel, channel of Trezze in the south lagoon.
The nutrient loads coming from those sources should sustain a primary production and food web
processes when delivered moderately. The annual average freshwater discharge is 40 m3/s, even
though could reach 340 m3/s (Collavini et al., 2005). Those watercourses originate far away from the
study area, which is confined to the lagoon borders (as expressed from WFD guidelines), but they
will be considered during the discussion of agricultural/pastoral Activities, threating the whole
drainage basin as a black box, from which the negative outcomes derive. The drainage basin includes
the counties of Venice, Padua, Treviso, and Vicenza with a total of 108 municipalities covering an
area of approximately 2038 km2 with more than 2500 km of discharges (Soccio et al., 2018)
While in past (D’Alpaos, 2010) the lagoon was subjected to higher sediment burial compared to
its erosion (due to higher contribution of river flows), since the Serenissima Republic (far back many
centuries ago), many rivers have been diverted into the sea, jetties have been built at the lagoon inlets
during the period 1808–1927 and many channels has been dredged for navigation in 1926 and 1970
(Guerzoni & Tagliapietra, 2006). In the same time spam, urbanization and land reclamation for
agriculture, aquaculture, and industry, have reduced the total surface of the lagoon by 3280 ha (Ravera
2000). Those modifications altogether have shifted the original sediment dynamics controlled by
wave energy, river flow and coastal currents (Aspden et al., 2004), into a new equilibrium
accompanied by salinization and higher erosion rate (D'Alpaos & Carniello, 2010). The average
salinity values range indeed today from 23.7 PSU in the north (Valli Laguna Nord) to 31.3 PSU of
the south (Val di Brenta) while average pH from 8.0 to 8.3 unit and dissolved oxygen close to the
saturation limit (ARPAV, 2016).
As a transitional water, the system’s ecology can be considered with riverine and marine
influences, but because of its heterogeneous morphological and physicochemical parameters, the
Lagoon experience strong spatio-temporal differences depending on the area, with its habitats suitable
for different organisms (Aspden et al., 2004; Malavasi et al., 2004; Zucchetta et al., 2016). As per
Franco et al. 2006, the Lagoon (particularly the northern basin), can present 5 main types of aquatic
habitats within 2 types: “structuring” habitats, like seagrasses and saltmarsh creeks, with specialized
12fauna; “transition” habitats (sandy bottoms, mudflats and sparsely vegetated habitats), with variable
organism assemblages, strongly influenced by adjacent habitats.
Saltmarshes are the areas situated above mean sea-level which not fall into the island category,
therefore partially influenced from the seawater influence. Tidal flats (here mostly mudflats) remain
below mean sea-level close to the saltmarshes, and can be classified as intertidal or subtidal flats
(depth between 0.75 and 2 m), depending on whether they are above or below the mean low water
spring tide value of 0.50 m. In addition to that, as displayed in fig. 4, besides the artificial channel
themselves, it is possible to find some other peculiar deeper elements such as tidal channels and tidal
Fig. 4. Zonation in saltmarshes relative to the tidal frame. Rretrieved from Gotie et al. (2007).
creeks (D’Alpaos et al., 2005). Among them the most peculiar and endangered habitat are
undoubtedly saltmarshes, with their creeks hosting the highest fish density because are located farther
from the sea inlets in the internal areas of the lagoon, present more resources and act as a refuge from
predators (Desmond et al., 2000; Rountree & Able, 2007). Unfortunately, these systems are
disappearing because of the many anthropogenic interventions. For example, the construction of the
breakwaters to defend the inlets has led to the reduction of both riverine and coarse marine sediment
(Day et al., 1998), creating erosion and subsidence (extensively explained in Carbognin et al., 2005),
which have in turn caused a reduction around saltmarshes in the Venice Lagoon to about 35 km2 in
the last century.
Following the European biodiversity directives “Habitat” (Council directive 92/43/EEC) and
Birds” (Directive 2009/147/EC, 2010), within the territory are located many SPA (Special Protected
areas) and SCI (Sites of communal importance). Particularly, there are:
§ SPA IT3250046 Venice lagoon;
§ SCI IT3250030 Mid-lower Venice Lagoon;
§ SCI IT3250031 Upper Venice Lagoon.
13Those areas (Buffa & Lasen, 2010), part of “Natura 2000 net”, should help to maintain their long-
term conservation efforts due to their high ecological importance. Indeed, per Franzoi et al. (2010),
as a whole the lagoon areas sustain at least 80 fish species, grouped into lagoon residents, marine
migrants, marine stragglers, anadromous migrants and freshwater species (other assessments in
Malavasi et al., 2004; Franco et la., 2009). Seagrasses could be seen as the major primary producers,
while a total of 300 species of macroalgae have been recorded in the Venice Lagoon (Sfriso & Curiel,
2007). Benthos (e.g. Tagliapietra et al., 2016), phytoplankton (Socal et al., 2006) and zooplancton
communities (e.g. Acri et al., 2004; Camatti et al., 2006) are strongly represented as well, together
with wintering aquatic birds (Scarton & Bon, 2009).
3. METHODS: THE DAPSI(W)R(M) FRAMEWORK
As a conceptual model, this tool will be used to “collate, visualize, understand and explain the
issues and problems relating to actual or predicted situations and how they might be solved” (Patricio
et al., 2016). All the information here gathered, has been extensively summarized in a standardized,
logical and hierarchical way, with the final aim to reach and assess current policy maker decisions.
As for the first element, it has been proposed in Elliott et al. (2017) the utilisation of a five-tier
hierarchical structure created by Maslow (1943), in the role of Drivers to assess human needs (fig.
5). Each of the societal needs, structured in a pyramidal and hierarchical structure, represents the
urgency of human development. In every personal decision made, everyone escalates this pyramid
trying to fulfil first their basic needs, then psychological needs and subsequently self-fulfilment
needs. The same groups have been created here to evaluate the Drivers essential to pursue each socio-
economic Activity. Five Driver classes have been in this way created: self-actualization, esteem
needs, love and belonging needs, safety needs, biological and physiological needs.
Fig. 5. Maslow's hierarchy of needs and human welfare. Retrieved from Elliott et al. (2017).
14For every D correspond in turn many Activities carried out to achieve a specific need. Therefore,
it has been listed all the Activities (with their respective macro-fields) carried out in all the basin and
coupled with the correct Driver. It has been included some agricultural Activities within the river
basin (and outside the proper study area) only because of its marked effects (Pressures) in the Lagoon.
Together with the later described Responses element, the section put attention to human interactions
on the environment.
Pressures indicate all the “environmental impacts” of short/long term Activities, which have the
potential to alter to different extent the lagoon system. A division between “Endogenic Managed
Pressures” (EnMP) (all the Pressures acting from inside the system and managed to different extent)
and “Exogenic Unmanaged Pressures” (ExUP) (meaning unmanageable or not directly manageable
Pressures which come from outside the system) has been made. (Elliott, 2011; Patricio et al., 2016).
This decision has permitted the introduction of some issues regarding climate change and species
invasion. EnMP and ExUP are then combined together to form common Pressures elements. In fig.
6 has been represented this division together with the whole problem structuring framework.
Fig. 6. The DAPSI(W)R(M) problem-structuring framework displaying the boundaries between the
system and environment, and the natural variability. Key: ExUP: Exogenic Unmanaged Pressures;
EnMP: Endogenic Managed Pressures. Retrieved from Elliott et al. (2017).
State change shows the environmental modifications in the system, underlining which Pressures
are convoyed together to produce similar effects. Clearly some of them are interchangeable because
often acting synergically and enhancing each other; nevertheless, each-one has the potential to
15produce many different Impacts on human Welfare. To better represent these linkages, Haines-Young
& Potschin (2010), have introduced the ‘‘service cascade’’ conceptual model: a link between
ecological structure (here State change) and elements of human well-being, using intermediate stages
between them. This cascade will be here represented using the conceptual framework set out by Fisher
et al. (2009), which distinguishes between ecosystem structure and basic processes (relative to the
marine ecosystem), intermediate services, final services and goods/benefits (fig. 7). Even though the
present study take place in a transitional ecosystem, it has been decided to use the original name
“marine ecosystem” for the first step of the State changes.
Fig. 7. State changes to the natural system reflected by changes in the “marine ecosystem”, intermediate and final
ecosystem services (left hand side), and Impacts (on human Welfare) reflected by changes to the provision of societal
goods and benefits (right hand side). Retrieved from Elliott et al. (2017).
Similarly to the DPSIR analysis of Müller & Burkhard (2012) (where the biophysical structures,
processes, and functions have be placed in the state change step, whereas the changes of ES provision
in the Impacts section), here the “marine ecosystem” (fig. 7) will be discussed in the State change
section, while the “ecosystem services cascade” will be placed in the Impacts section. This approach
aim to follow a better linear discussion and to better represent ecosystem services as a major tool for
policy development (i.e. WFD) (Vlachopoulou et al., 2014; Grizzetti et al., 2016; Voulvoulis et al.,
2017; Giakoumis & Voulvoulis, 2018a).
As expressed in Elliott et al. (2017), the operational set of indicators applied in the I(W) paragraph
are based upon the discussion of Turner & Schaafsma (2015). Those indicators describe and explain
16how the previous elements (D – A – P – S) are contributing to change human lives, producing
therefore many ecosystem services/disservices (Shackleton et al., 2016) but especially
goods/benefits. Ecosystem services (ES) can be defined as an expression of ecosystem functions
which, to different extent, has the potential to affect humans, generating in this way goods and
benefits for the society. Those elements are therefore deeply linked with the WFD ecological status
in aquatic ecosystems (European Commission, 2000; Boon et al., 2015; Grizzetti et al., 2016),
meanwhile this status is a measure defining the distance between the current and desired state, thus
defined by Voulvoulis et al. (2017) as an indicator for policy development.
All those described elements require responses (often delineated in EU Directives as Measures)
which should modify D and A, preventing P and therefore enhancing positive S and I(W). Therefore,
in the last section, it will be discussed some important recent and current Measures, with a focus on
ecological restoration practices. Because of its circularity, all the Measures will be assessed
considering its P, S and I produced. The R(M) element should indeed prevention and mitigation
strategies which need to cover the so-called 10-tenets (Elliott, 2013): sustainable, economically
viable, technologically feasible, socially desirable/tolerable, legally permissible, administratively
achievable, politically expedient, ethically defensible (morally correct), culturally inclusive and
effectively communicable. The tenets should be equally applied to A and P as discussed by Barnard
& Elliott (2015).
In this way, the framework here presented consider all the governance of the marine
environments, distinguishing, as per Jentoft (2007), the ‘system to be governed’ (D, A and P affecting
the state of the ecosystem) and the ‘governing system’, guided by the Impacts (on human Welfare)
to improve its Responses. In a wise way, the ecosystem and its resources match with institutions
preserving or improving the state of the ecosystem.
Another interesting division can be made covering all the aspects of the sustainable development
as per as officially expressed from the Brundtland Commission in 1987 (WCED, 1987), even though
there is often an obvious occurrence and repercussion of the three pillars in each DAPSI(W)R(M)
element and in the framework as a whole. Nonetheless, D and A are contained in the socio-economic
sphere, P and S cover purely the natural environment while the latter (I(W) and R(M)) could be seen
as a solid and accurate union of the 3 pillars.
In addition to that, has been created GIS maps using QGIS software (QGIS Development Team,
2009) to display the location of the different elements. For each couple (D and A – A and P – P and
S – S and I(W) – I(W) and R(M)) are produced diagrams showing their connections, which have been
unified together to produce the map in Annex 1. Colours on diagrams reflects the cause/effect of each
element, with the black borders addressing the colour’s provenience.
174. RESULTS AND DISCUSSION
4.1 DRIVERS
Every Driver raised from the human needs as described in Maslow (1943) hierarchical structure.
Therefore, is it clear that, in a wide and well-structured society included in the Venice-Chioggia
municipalities, every need is fulfilled by many Activities. Fig. 8 represent the connection between
those needs and the macro category of Activities (sectors).
Drivers Activities (Sectors)
Recreation
Tourism
SELF
ACTUALIZATION
Land based industry
ESTEEM NEEDS Land claim (Urbanization)
Transport and Shipping
LOVE AND BELONGING NEEDS
Public services
Rivers diversion and Inlets
SAFETY NEEDS extension
Agriculture and Pasture
BIOLOGICAL AND PHYSIOLOGICAL NEEDS
Fisheries
Fig. 8. Connections between Drivers (in the form of Maslow pyramid) and the respective activities (sectors).
Starting from the bottom line of the pyramid, we can distinguish:
§ Biological and physiological needs which contribute to the basic life needs regarding the food
industry (agriculture and pasture, fisheries). To certain extent, shipping can be included as a direct
effect when carried out to import edible materials.
§ Safety needs, bringing together land claim (urbanization), particularly important in Venice due to
the on-water peculiar location, requiring perennial management. In this category, under the public
services field, it has been distributed transport services (shared with transport and shipping, which
is partially counted as safety need), waste management facilities, wastewater treatment plants,
energy plants, pipelines and electric lines. Because most of those essential services are in the same
area of other industries, in order to unify them in a single area to better assess their later on
framework elements, land based industry has been connected not only to the esteem needs, but
also to the safety ones.
18§ Considering the deeply rooted consideration of Venice as a “city for lovers”, tourism will
undoubtedly fall in the category “love and belonging needs”, even though it should be a purely
self-actualization product. In this category rely also partially the urbanization (as well as in the
previous section) due to the need of having a roof for families.
§ Esteem needs, which include all the industrial production, shipyards, transportation system and
every small to large commercial Activities not related to the basic needs supply.
§ Finally, the self-actualization category which add the recreational Activities and contain the bulk
of the touristic industry.
4.2 ACTIVITIES
Each human Activity can generate Pressures, which may in turn lead to several direct or indirect
disturbances to the whole coastal ecosystem. To correctly assess these Activities, fundamental for
this study aim is to locate them, and therefore understand how many people can be potentially
involved. The results of the analysis will define for each Activity, depending on the type and extent,
a different representation on a georeferenced map. The main Activities carried out in the system, with
their field groups, are listed in tab. 1.
Tab. 1. List of sectors and related Activities.
Sector Activity
Recreation Private boats
Cruises
Tourism
Tourist infrastructure
Marghera Industrial pole
Land Based Industry
Murano glass
Land claim (Urbanization)
Docks management
Transport and shipping Marine Commerce
Transport system
Energy facilities
Public Services Wastewater treatment plants
Waste management
River diversion and inlets extension
Small scale agriculture
Agriculture and Pasture Pasture
Intensive agriculture (basin)
Artisanal fisheries
Fisheries Dragging and Mechanical clam harvesting
Aquaculture
19Per Grydehøj & Casagrande (2019), apart from Sant'Erasmo (population 669) and Vignole (56),
which are primarily agricultural communities, all the Venetian islands rely to different extent on
tourism, even though agriculture and traditional industries remain significant to the local economies.
Mazzorbo (population 277), Torcello (20) and Pellestrina (2,587), hosts small-scale but deeply rooted
agriculture communities, with Pellestrina relying also on fishing and craft industry. Another
important centre of fisheries, but especially aquaculture, is Chioggia and Sottomarina (50,000), even
though the area is also an important cultural and seaside tourism hub.
However, to lead the islands tourism ranks there are Murano (population 4,335), Burano
(population 2,459), and Lido (population 14,564) (Grydehøj & Casagrande, 2019). Each of these
islands is accompanied by their own particularities attracting in turn many tourists. Murano is known
for its famous glassworks industry, Burano for its lacemaking industry and the exclusive colourful
village landscapes, while Lido, the second most populous island (after Venice city centre), hosts the
Film Festival in September and is crowded in summer due to regional seaside tourism.
4.2.1 Tourism
With 12.1 million tourists per year, Venice receives 2.8% of the Italian tourists (ISTAT, 2018),
and as soon as tourism has grown, the whole city and surrounding areas has become dependent on it.
The city centre local economy is almost entirely composed by souvenir shops, Venetian and regional
craft (such as Murano glasses) or international luxury brands.
The city and the surrounding areas have always been one of the main Italian hotspots for tourism,
but only since the opening of the International Airport Marco Polo (in 1960) and the creation of docks
in the artificial island of Tronchetto (1957-1961) (fig. 3), it has boosts its tourism attraction (Zannini
et al., 2014). The mass tourism has indeed increase its number as showed in fig. 9, with +5,6% per
year in the last 20 years as per Zannini et al. (2014). While rich tourists stay in the city centre, but
especially on Lido Island where located the luxury hotels, the bulk of the visitors remain inlands (in
Mestre particularly), where there are more affordable hotels and apartments, going back to visit the
city centre and its islands daily.
Nonetheless, the most remunerative and therefore important industry in the sector is represented
by cruises, which have completely changed the city and the surrounding environment. This industry,
which reduce costs to offer a low-cost service for tourists, is creating many big social, environmental
but also economic problems: because the ship is a destination itself, it generates almost no impact on
the local economy, with the tourists wanting to just sightseeing the city or join excursions (Weeden,
2016; Maršenka et al., 2016; Gonzalez, 2018). Nevertheless, at the present, around 500 cruises ships
enter the Lagoon each year (446 in 2017 as per Città di Venezia, assessorato al turismo, 2017),
20bringing 1.5 million tourists each year (Città di Venezia, assessorato al turismo, 2017), and this traffic
will add to the already intense commercial traffic on the Malamocco-Marghera Industrial channel
(MMIC) (fig. 10) (Teatini et al., 2017). According to Valcárcel (2018), the passengers increased by
440% between 1997 and 2010 while the ship’s landings growth by 263% in the same time spam.
Those data clearly indicate the ship size grown. Other touristic boats which brings passengers in the
city are riverine ships, ferries and hydrofoil, but their numbers are far less.
Presences Arrival
City center Inland Lido City center Inland Lido
12000 6000
11000
10000 5000
9000
8000 4000
Thousand tourists
Thousand tourists
7000
6000 3000
5000
4000 2000
3000
2000 1000
1000
0 0
1952 1962 1972 1982 1992 2002 2012 2017 1952 1962 1972 1982 1992 2002 2012 2017
Years Years
Fig. 9. Historic and recent data about tourism (thousand tourists per year). Arrival and presences in different location of the
Lagoon. Data retrieved and combined together from Città di Venezia, assessorato al turismo (2012; 2017) and Zannini (2014).
4.2.2 Public and Commercial Transport System
To reach the city centre of Venice, in 1846 a 4-km rail bridge (Ponte della Libertà) (fig. 3) was
built between Marghera and Venice, with the road added in 1933 and the consequent development of
parking facilities (Grydehøj & Casagrande, 2019). Most of the parking lots, are situated in the almost
completely artificial island of Tronchetto, where it is located the cruise ship terminal as well, close to
the near bus, waterbus and taxi terminal (Piazzale Roma). The rest of the Lagoon is road-free (cycling
is mostly forbidden) except for the elongated shapes of the Lido and Pellestrina which also have land
transport (cars and buses), served by roll-on/roll-off ferries to transport road vehicles. Elsewhere,
transportation and public services takes place by water buses, water taxis, private boats, cargo vessels,
waste-collection vessels etc., all powered by diesel engines, which in turn contribute to noise and
atmospheric pollution, requiring its own set of hard infrastructures (harbours, channels, etc.).
Venice’s Marco Polo airport is located on the mainland, on the coast to the north-east of Marghera–
Mestre.
The fleet for public transportation in Venice is operated by the municipal company ACTV and
consists of 160 water buses, which dock in 150 floating piers along the channels and transport over
100 million passengers a year (Morandin et al., 2015). The most common water buses are "vaporetto"
21(small steamer), a 24-m long, 4.22-m wide hull, which displaces 37 tons and can accommodate 200
passengers each one, in services for 16 hours daily. Their main routes are represented in fig. 12.
Besides the huge disturbance of underwater noise and pollution, the main issue related to the
transport, rely on the channels themselves (fig. 10). A typical intervention in coastal systems is indeed
the dredging of canals and inlets, which are performed to increase the water volume exchanged with
the sea (Gong et al., 2008), as filling material for upland development and land reclamation (López
et al., 2013) or for navigation purposes (Healy et al., 1996; Fortunato & Oliveira, 2007).
The extent of channels net here is about 718 Km throughout the entire lagoon (Brighenti et al.,
2003) (Tab. 2; Fig. 10), and since its born, the reclaimed land has been impounded for constructing
solid ground on the lagoon's mudflat, urban expansion and industrial settlement (Balletti, 2006;
D’Alpaos, 2010; Grydehøj & Casagrande, 2019). Nonetheless many speed limits (in knots) exist,
together with some restricted traffic areas (blue areas) to better preserve sensible areas (fig. 10)
(MAV, 2007).
Tab. 2: Type of channels, length and extension. Data retrieved from Brighenti et al. (2003).
Type of channel Length (km) Extension (Km2)
Principal channels 171,4 35,4
Docks channels 18,69 2,7
Secondary channels 165,61 10,7
Minor channels 109,88 3,7
Saltmarshes creeks 140,07 8,3
Urban principal channels 46,27 1,8
Secondary urban channels 67 1,51
Tot 718 64,21
Every channel serve to many purposes essential for the city life: urban mobility, city services (e.g.
Ambulance, Police, waste collectors), but especially commerce. The last major navigable canal, the
Malamocco-Marghera Industrial Canal (MMIC) (fig. 10), excavated in the 1960s, has been created
to connect the Porto Marghera Industrial Zone (PMIZ) on the mainland with the Adriatic Sea through
the Malamocco inlet. In accordance with Sarretta et al. (2010), this process has removed a total 40
Mm3 of the dredged material than disposed on lands, mainly on structures called “casse di colmata”
(fig. 10).
Many studies have already demonstrated how the MMIC for large vessels is the main causes for
the morphological deterioration observed in the central lagoon: deepening the tidal flats, marshland
22Fig. 10. Representation of channels with their speed limits (knots), limited traffic areas (blue areas), reclaimed areas from dredged
materials (casse di colmata), main routes of touristic cruises and commercial ships (through MMIC – Malamocco-Marghera
industrial channel) (see text). Data retrieved and adapted from Atlante della laguna. Produced using QGIS on Microsoft Bing
Maps.
erosion, sediment loss, texture and grain size changes (e.g. Ravera, 2000; Tambroni & Seminara,
2006; Carniello et al., 2009; Molinaroli et al., 2009; Amos et al., 2010; Marani et al., 2011; Ferrarin
et al., 2013). Unfortunately, without it, commerce outside the lagoon could be impossible, especially
thinking about the average ships hull size, far bigger than the average channel depth. Tab. 3 shows
the channel utilization (in tons transported) of different industrial sectors of the Porto Marghera
Industrial Zone (PMIZ).
23Tab. 3. Maritime traffic at Porto Marghera Industrial Zone (PMIZ). Data retrieved from Autorità Portuale di Venezia (2013).
Commerce sector Goods transported (tons/year)
Energy
10.206.699
Containers 4.296.687
Steel 4.083.399
Food 2.113.355
Roll-on/Roll-off 1.235.657
Chemicals 1.176.364
Other dry bulk 1.149.614
Various goods 149.602
Total Traffic 24.411.377
4.2.3 Food Industry
Within food industry are grouped here agriculture, pasture and fisheries Activities. To correctly
assess the agricultural Activities within the lagoon, it is important to consider the whole river drainage
basin, treating it as a black box (fig. 11).
The basin comprises all the water bodies draining directly into the Lagoon through its 27 river
mouths (fig. 11), reaching 1.850 km2 without considering resurgence waters (Cassin & Zolin, 2007).
Cassin & Zolin (2007) recognised 55 thousand farms in this territory, with high predominance of
intensive agriculture in the form of crops with cultures such as wheat, soy, sugar beet and other cereals
(plus horticulture in specialized areas close to the coasts). Those cultures have a well-known impact
on the surrounding environment (e.g. Tillman et al., 2002), especially when carried out, as happen
here, continuously searching maximum productivity per surface unit, using a lot of chemical inputs.
The utilised agricultural area (UAA) and total agricultural area (TAA) ratio is high (83%) when
compared to the regional average of 71%, meaning an intensive agricultural utilisation of the fields
(Cassin & Zolin, 2007). The waters flowing from the fields, from surface (runoff) into rivers and
depth (leaching) through the groundwater, can be therefore polluted by fertilizers (nitrogen and
phosphorus) or pesticides (herbicides, fungicides, etc.) (Novotny & Olem, 1994). This is a major
“driver of change” leading to the current and past eutrophication and heavy pollution. Besides that,
many small-scale sustainable farmers are continuously opening new enterprises, due to the growing
demand of organic food (e.g. Abitabile et al., 2015; Bartoli, 2015).
Under “fisheries” is then possible to include Activities such as artisanal fishing, benthic trawling,
netting and pelagic trawls fisheries. Some of them will be here discussed, but for an extensive
24Silone
Dese
Marzenego-Osellino
Naviglio Brenta
Taglio
Nuovissimo
Montalbano
Trezze
Cuori
Fig. 11. Drainage basin represented as a black box with the river mouths coming from it. It is possible to see the channels
and rivers mentioned in the text and how the river Sile and Brenta have been diverted (see text). Data retrieved and adapted
from Geoportale Regione Veneto and Atlante della laguna. Produced using QGIS on Microsoft Bing Maps
discussion it is recommended a look to Provincia di Venezia (1999; 2009; 2014a). Angling (amateur
and game fishing) will be not counted, due to its difficulties in assessing it. Anyway, as per Provincia
di Venezia (2014b), recreational fishing was practiced by 21.500 people in 2011. Per Veneto
agricoltura (2005), in fisheries and aquaculture sector there were 79 local units and 2.620 business
location, of which 84% were individual enterprises and only 2% of ltd companies.
Artisanal fishing in the Venice Lagoon is performed using different traditional gears, with fyke
nets considered the most important (Granzotto et al., 2001; Libralato et al., 2004; Provincia di
Venezia, 2014). This type of fishing activity targets more than 20 different species of fish and benthos,
and consists of a barrier which guides the fish towards four cone-shaped, unabated traps (Malavasi et
al., 2004; Provincia di Venezia, 2009). Anyway, per Zucchetta et al. (2016), their pressure was less
25impacting than other categories, and its effect negligible compared to the past, suggesting therefore
that fyke net fishery could be carried out sustainably within the lagoon territory.
Another highly impacting fishing technique is otter trawling (or dragging), now banned (Provincia
di venezia, 2009). This practice involves the use of mobile demersal gears (e.g. trawl nets and
dredges) which are dragged along the sediment surface behind a towing vessel disturbing up to 120-
250 m wide area, spreading the suspended sediment (Schwinghamer et al., 1998). The well-known
effects include: alteration of the sediment and water biogeochemistry, change in sediment texture,
destroy of bed forms, remove or scatter of non-target species (Watling & Norse, 1998; Pilskaln et al.,
1998; Collie et al., 2000; Duplisea et al., 2001; National Research Council, 2002).
In contrast, the mechanical clam harvesting is a single-species fishing Activity, classifiable as a
semi-industrial Activity, carried out in the past decades using high impacting equipment which have
heavily modified and stressed the whole environment (Pranovi & Giovanardi, 1994; Libralato et al.,
2002; 2004; Provincia di Venezia, 1999; 2009). The species exploited in the lagoon has always been
the non-native species Manila clam (Ruditapes philippinarum), which was introduced in the lagoon
in 1983 (Cesari & Pellizzato, 1985). During the mid-1990s, more than 50% (40,000 t) of clam
production in Italy came from the Venice Lagoon, where about 600 fishing boats were in operation
employing approximately 2500 people (Rosetto, 2000).
Clam harvesting is historically executed using equipments such as suction dredger, vibrating,
scrapers, some of them now illegal (Provincia di venezia, 1999; 2009). An example of their impact
is given by Pranovi et al., (2004; 2013), where they explain the effects of the widely used small boats
equipped with “rusca” (an iron cage with net bag for clams collection) and an additional engine
arranged lateral outboard. In shallow areas, the propeller suspended both sediment and clams (as well
as other invertebrates), which are then collected by the net, producing in this way a V-shaped tracks
which cause a sediment grain size change (loosing fine material) and contribute to suspended much
of the previously stabilized heavy metals.
Aquaculture on the other hand, if extensive, is a much more sustainable Activity, but not
completely without environmental impacts. (e.g. Sarà et al., 2011; Bouwman et al., 2013). In the
lagoon territory it has also been developed the so-called practice of “vallicoltura”, which represents
the interface between capture fisheries and common aquaculture: the early life stages are collected
from the wild and grown using aquaculture techniques until they reach a marketable size (Provincia
di Venezia, 1999; 2009; 2014a; Fortibuoni et al., 2014). There are several types of fish ponds (called
here “valli da pesca”), which differ in the level of embankment, but all together refer to the same
shallow structure in different ways separated from the open lagoon (Bullo, 1940; Boatto & Signora,
1985; Ardizzone et al., 1988; Ravera, 2000; Granzotto et al., 2001; Cataudella et al., 2001).
26According to Mason & Gos (2015) there are 27 Valli covering an area of 12.000 ha (150 Km2 as
per Solidoro et al., 2010) (fig. 12), with many of them practicing the canonical and remunerative
extensive breeding of grey mullets, sea breams and sea basses (plus a limited production of eels and
crabs). Those areas are mainly situated between the south-central west part and the far north, while
the bulk of clam harvesting concessions lies in the central part and Chioggia surrounding area (fig.
12). The 2005-2015 average production has been estimated by Mason & Gos (2015), of about 23.000
t/year (Philippine clams) and 2.000-2.500 t/year of mussels.
Fig. 12. Representation of Porto Marghera industrial Zone, Murano glass factories, clam harvesting concessions, aquaculture
areas and main public transportation routes. Data retrieved and adapted from Geoportale regione Veneto. Produced using
QGIS on Microsoft Bing Maps.
27You can also read