Comments Concerning the Proposed Rulemaking to Revise Light-Duty Vehicle Greenhouse Gas Emissions Standards and Corporate Average Fuel Economy ...
←
→
Page content transcription
If your browser does not render page correctly, please read the page content below
Comments Concerning the Proposed
Rulemaking to Revise Light-Duty Vehicle
Greenhouse Gas Emissions Standards and
Corporate Average Fuel Economy Standards:
Technical Appendix

Referencing docket ID numbers:
EPA-HQ-OAR-2018-0283
NHTSA-2018-0067
Table of Contents
I. Agencies have failed to propose maximum feasible standards ..................................................................... 1
 A. Agencies’ modeling of the standards is overly conservative and does not accurately demonstrate
 the technological feasibility of stronger standards. .............................................................................................. 1
 1. The agencies’ characterization of the current state of technology is overly conservative and
 inconsistent with previous agency conclusions ................................................................................................ 1
 2. The agencies’ compliance modeling is inadequate and irrational.................................................... 22
 B. The agencies have underestimated the social and economic benefits of fuel economy and
 greenhouse gas emissions standards ..................................................................................................................... 46
 1. Agencies overestimate costs to consumers and underestimate consumer benefits of stronger
 standards .................................................................................................................................................................. 47
 2. Agencies inconsistently evaluate and arbitrarily utilize consumers’ willingness to pay for fuel
 economy technologies to generate predetermined, conservative outcomes ..........................................49
 3. The proposed standards will decrease employment and reduce economic output..................... 52
 4. The agencies’ cost-benefit model is fundamentally flawed ............................................................... 57
 C. Agencies mischaracterize the relationship between fuel economy and greenhouse gas
 regulations and other federal laws ......................................................................................................................... 62
 1. Agencies have mischaracterized the impact of fuel economy and greenhouse gas emissions
 standards on safety ................................................................................................................................................ 62
 2. Agencies have erroneously ignored the interaction between Zero Emission Vehicle standards
 and federal requirements of the Clean Air Act ............................................................................................... 62
 D. Agencies mischaracterize the need for the nation to conserve energy................................................ 63
II. The agencies’ proposal suffers from critical legal errors ........................................................................64
 A. Withdrawal of the California waiver would be unprecedented, unwarranted attack on state
 authority ....................................................................................................................................................................... 64
 B. Vehicle emission standards are not inherently fuel economy standards and therefore are not
 pre-empted by EPCA ................................................................................................................................................. 65
 C. Zero Emission Vehicles standards are not inherently fuel economy standards and therefore are
 not pre-empted by EPCA.......................................................................................................................................... 65
 D. The technical basis for the Proposal is fundamentally flawed .............................................................. 65
III. Additional requests for comment .................................................................................................................. 66
 A. Incentives for autonomous and connected vehicle technologies ......................................................... 66
 1. Autonomous and connected vehicle technologies do not directly reduce emissions ................. 66
 2. The agencies have previously appropriately excluded crediting indirect emissions .................. 67

 i
B. Incentives for hybrid and alternative fuel vehicles .................................................................................. 68
 1. Hybrid incentives ......................................................................................................................................... 68
 2. Natural gas vehicles ..................................................................................................................................... 69
 3. Incentives for electric vehicles.................................................................................................................. 69
 4. Combined impact of incentives ................................................................................................................. 69
 C. Disclosure of credit trading under the CAFE program ........................................................................... 70
IV. References ........................................................................................................................................................... 71
APPENDIX A: Modifications to Volpe model source code .................................................................................. 84

These technical comments were prepared on behalf of the Union of Concerned Scientists by David W.
Cooke, in consultation with Don Anair, Samantha Houston, David Reichmuth, and Alyssa Tsuchiya.

Dr. Cooke is a senior vehicles analyst in the Clean Vehicles Program at Union of Concerned Scientists,
specializing in both light- and heavy-duty fuel economy. He conducts research on fuel efficiency
technologies and the implications for oil consumption and greenhouse gas emissions across the
transportation sector.

 ii
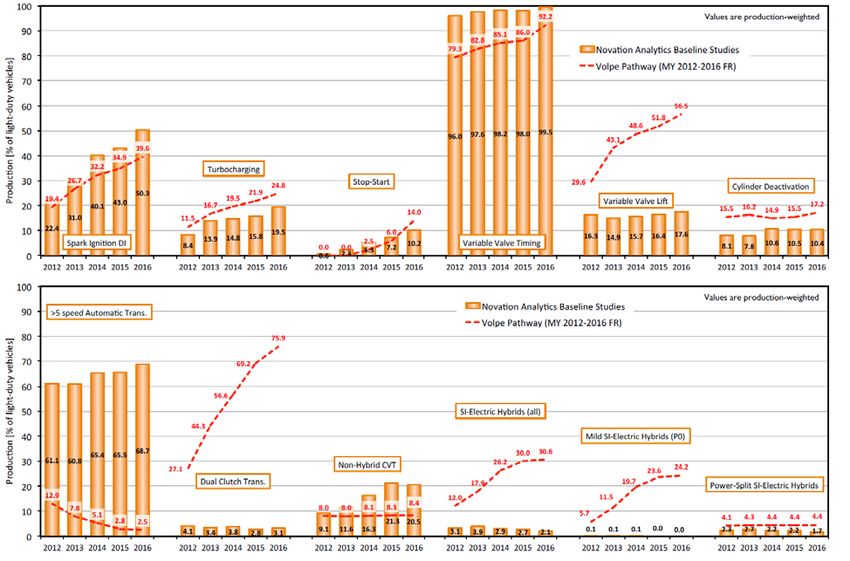
I. Agencies have failed to propose maximum feasible standards
NHTSA is required by the EPCA, as amended by EISA, to issue “maximum feasible” standards for
manufacturers’ fleets by balancing a number of factors the must include technological feasibility,
economic practicability, the effect of motor vehicle standards of the Government on fuel economy, and
the need for the United States to conserve energy (49 USC 32902(a), (f)). NHTSA may consider
additional factors, namely safety and consumer choice, as it has chosen to do in this proposed
rulemaking (83 FR 43206). In Section V.A.(e), NHTSA discusses how it has “balanced” the four
required factors alongside the two optional factors. On its face, the discussion might seem like a
reasonable balance of factors. However, the Agency has seriously mischaracterized several of the
factors under consideration, which has led to an erroneous conclusion about the appropriate stringency
of a standard to satisfy the maximum feasibility requirement. Furthermore, it has ignored its statutory
obligation to support the ultimate purpose of EPCA: energy conservation. 1 In the following sections, we
demonstrate critical flaws in how the Agency’s analysis of technological feasibility, economic
practicability, effect of other standards, and need to conserve energy has been conducted.

While the arguments below are constructed around NHTSA’s statutory requirements, all of the data
supporting our conclusions about the technical feasibility, socioeconomic benefits, and interaction with
other rules are directly relevant to EPA’s statute as well. We have identified in specific instances where
the precise rationale may be more pertinent to a particular agency, but generally these comments
should be read as broadly relevant to both agencies’ authority and obligations to set strong standards
which will benefit the American people.

 A. Agencies’ modeling of the standards is overly conservative and does not
 accurately demonstrate the technological feasibility of stronger standards.
 1. The agencies’ characterization of the current state of technology is overly
 conservative and inconsistent with previous agency conclusions

The agencies have invited comment on “all aspects of the analysis discussed” in Section II.D
Characterization of Current and Anticipated Fuel-Saving Technologies (83 FR 43022). In this section,
we respond to the agencies’ treatment of technology in modeling the proposed rule. In response to
agencies’ specific requests for comment on technology costs, effectiveness, and applicability to vehicles
in the fleet (83 FR 43029), we demonstrate that the agencies have overestimated costs and
underestimated the effectiveness and applicability of many fuel saving technologies considered. We
further point out that agencies have failed to consider some technologies at all, including spark-assisted
compression ignition and variable compression ratio engines. Such conservative treatment of included
fuel-saving technologies and failure to consider other technologies at all leads the agencies to erroneous
conclusions about the technological feasibility of strong vehicle standards.

In the 2017 Final Determination (EPA 2017a, b), EPA documented how manufacturers have responded
to strong fuel economy and emissions standards. The manufacturers innovated—they have invested in
robust research and development efforts that have yielded unforeseen technology developments,

1CBD v. NHTSA, 538 F. 3d 1172, 1197 (9th Cir. 2008). “Whatever method it uses, NHTSA cannot set fuel economy
standards that are contrary to Congress’ purpose in enacting the EPCA—energy conservation.”

 1
including high compression ratio engines, improved continuously variable transmissions, cheaper and
wider deployment of lightweight materials, and more (EPA et al. 2016; EPA 2016a). Since the 2017 Final
Determination, advancements in conventional vehicles have continued apace, with even further
breakthroughs like spark-assisted compression ignition and variable compression ratio engines.
Unfortunately, in the analysis supporting this NPRM, the agencies have chosen to ignore these
advances and instead used conservative assumptions that underestimate the potential for future
reductions in fuel use and emissions, as outlined below.
 A) MILD HYBRIDIZATION
While the agencies have acknowledged in the supporting documentation some of the recent progress in
mild hybridization, particularly with the addition of 48V mild-hybrid technology to the Volpe model,
the costs included in this proposal are far too high. In practice, costs have continued to come down for
48V systems and today already match those projected for 2025 less than two years ago in EPA’s analysis
for the Final Determination (EPA 2017a). Continued volume-based learning will drive the cost down
further (see presentations by Johnson Controls and FCA, Lee 2017), consistent with near-term plans
from a number of manufacturers, including Fiat-Chrysler, Ford, General Motors (NemoTec
presentation, Lee 2017).

Of particular interest, mild hybridization is also showing strong potential in pick-up trucks, proving
that standards could be stronger for these vehicles. Recent deployment of a limited fleet of eAssist
Silverado pick-ups in California shows not just significant emissions reductions in city driving (13
percent), but also yields significant benefit on the highway as well, for an overall improvement of 9 to 11
percent, dependent upon whether it is utilized on a 2WD or 4WD vehicle (GM 2016). This low-cost
technology (GM offered it at just a $500 premium) can work synergistically with other technologies on
the truck to further reduce fuel use—General Motors noted in its press materials, “the electric motor
also enables the Active Fuel Management [cylinder deactivation] system on the 5.3L V-8 engine to
operate in 4-cylinder mode for longer periods, resulting in additional fuel economy benefits” (GM
2016).

Such performance exceeds the agencies’ assessment of the technology. The Autonomie modeling
results estimated just a 6 to 7 percent improvement above the conventional engine across all vehicle
classes (PRIA Figure 6-155), well below not only certification data from Ram and GM, 2 but below the
latest assessments of the National Academies 3 and EPA, 4 and even previous Autonomie results

2 According to the test data submitted by General Motors, the eAssist system deployed on its heavy-duty pick-ups
achieves a 10 percent reduction in fuel consumption on the CAFE cycle in its 2WD pick-ups and a 5.5 percent
improvement on its 4WD pick-ups (comparing models 550/645, 551/646, 558/643, and 559/644) (EPA 2018a). FCA data
shows that there is a 10 percent difference on the CAFE test cycle between similarly configured 2019 Ram 1500 4x2 and
4x4 pick-ups with and without their eTorque mild hybrid system (comparing models 504/505, and 506/507) (EPA
2018b).
3 “The [2015 National Research Council] committee concludes that the effect of hybridization is a 10 percent reduction in

fuel consumption for the mild hybrid.” (p. 4-40, NAS 2015)
4 In its Technical Support Documentation supporting the 2016 Proposed Determination, EPA found a technology

effectiveness for mild hybrids of 7 to 9.5 percent (Table 2.90, EPA 2016a).

 2
incorporated into NHTSA analysis. 5 This drastic departure from previous Autonomie results is
especially notable in the case of crank-integrated starter generator (CISG) mild hybrids, which showed
a 4 to 5 percent improvement over the belt-integrated starter generator (BISG) in previous analysis
(ANL 2016), while the data supporting this proposal instead shows virtually no benefit whatsoever for
CISG over BISG, and in many cases actually shows an increase in fuel consumption (PRIA Figure 6-155;
FC1_Improvements.csv, NHTSA 2018a)—no explanation whatsoever is given in the technical support
for the administration’s proposed rule for this radical decrease in technology potential.

It is not just the effectiveness of this widely deployable and relatively low-cost conventional vehicle
technology that has been inexplicably downgraded—the agencies’ costs have also been raised
substantially. Little documentation is available to support this change—the data presented in the PRIA
for the choice of battery technology and cost of batteries conflicts with that presented in the proposal
and provided as inputs to the Volpe model, as noted in an as-yet unfulfilled request for further
information and clarity about the administration’s proposal (Peter 2018).

The PRIA (Table 6-29) lists the direct manufacturing costs (“BatPaC DMC Cost”) for a BISG battery as
$391.12 and a CISG battery as $588.44, regardless of vehicle size or demand configuration. However,
the input files for the Volpe model show battery costs (field “BatPaCCost”) of $649.95 and $847.24 for
BISG and CISG respectively (ANL 2017a—j). The source of the additional $258 cost is not explained.

Because these mild hybrid technologies are broadly adopted by the fleet (34 percent, PRIA Table 7-64),
overestimation of the battery costs results in a substantial increase in vehicle cost that has broad
ramifications for the efficacy of the regulation. Even the lower of the values presented in the PRIA
overestimates the cost of mild hybrid batteries. A recent report by ANL (Islam et al. 2018a) for the US
Department of Energy estimates the battery component cost for a mild hybrid system to be $159.35
(Component Cost, ANL 2017k). In a recent teardown study of the Chevrolet Malibu eAssist with BISG
hybrid system (FEV 2014), the total battery subsystem direct costs were estimated to be $166, including
thermal management. The battery modules, power distribution, and covers totaled $120 in direct
manufacturing costs. These estimates for BISG battery costs from ANL and a teardown study are less
than half the costs listed in the PRIA and approximately one quarter of the “BatPaCCost” value given in
the ANL input files.

The agencies have not sufficiently explained why their newly presented data differs so substantially,
not only from freely available public reports mentioned above, but costs previously presented in studies
paid for by NHTSA (NAS 2015 6) and published by both agencies (Table 5.131, EPA et al. 2016; Table
2.132, EPA 2016a).
 B) CYLINDER DEACTIVATION
While the agencies have acknowledged the existence of dynamic cylinder deactivation, they have not
appropriately included it as an available technology, dramatically limiting its availability and using

5 On average, Autonomie modeling in support of NHTSA’s analysis for the Draft Technical Assessment Report found that
mild hybridization resulted in a 7 to 13 percent improvement over the conventional powertrain, with all but pick-ups in
the high end of that range (11 to 13 percent) (ANL 2016 [data]; Moawad et al. 2016 [methodology]).
6 The total direct manufacturing cost for the system (Table S.2, NRC 2015) is even lower than the integrated starter

generator system’s cost excluding the battery (i.e. only for the non-battery components; Table 6-30, PRIA).

 3

“speculative” (PRIA, p. 232) modeling of the technology without providing any data or documentation
in justification. These actions severely constrain the modeled adoption of the technology, an
unnecessarily conservative approach which does not reflect the advanced state of technology in the
industry.

Dynamic cylinder deactivation (ADEAC) is restricted to naturally aspirated, low-compression ratio
engines—it cannot be combined with turbocharged engines, high compression ratio engines, or variable
compression ratio engines due to pathway exclusivity in the Volpe model (PRIA, footnote 470).
However, the first production application was for a turbocharged engine, which the agencies
acknowledge—to be clear, the first ever deployment of this technology is excluded as a possibility in the
agencies’ current model.

This restriction is not limited to dynamic cylinder deactivation—conventional cylinder deactivation
(DEAC) has been deployed in combination with a high-compression ratio engine (2018 Mazda CX-5;
Pleskot 2017), yet in the Volpe model DEAC cannot be combined with high-compression ratio engines
(NHTSA 2018b, Table 13).

Modeling of the effectiveness of this technology further ignores real-world deployment. The agencies
have simplistically assumed a constant 3 percent improvement for four-cylinder and 6 percent
improvement for larger engines, above traditional cylinder deactivation. However, this ignores the
complementary effect of dynamic cylinder deactivation, particularly with technologies like 48V systems
which General Motors is already deploying this technology in its 2019 full-size pick-ups (Halvorson
2018). When combined with a 48V system, which can act synergistically with the dynamic cylinder
deactivation, Delphi claims to achieve as much as a 20 percent reduction in fuel use and emissions
(Birch 2017), at a cost roughly half that of other approaches to reducing emissions from conventional
powertrains (Beckwith 2017).
 C) ADVANCED BOOSTED ENGINES
Turbocharged engines were not deployed as quickly as anticipated by the agencies in the rulemaking
for MY 2012-2016 because auto makers were able to utilize cheaper technologies to exceed the rules
and build credits for future compliance. However, nearly every major manufacturer has taken steps to
incorporate boosted engines into their portfolio as a relatively low-cost option to improve the efficiency
of the internal combustion engine going forward. As more manufacturers have moved into this
development, a number of new types of advanced boost have made their way into the market, including
variable geometry turbochargers (e.g., Porsche Boxster S), electrically assisted turbochargers (or “e-
boost”, e.g., Audi SQ7), and supercharged engines (e.g., Volvo 2.0L T6 engine), all of which are available
today.

Between the 2012 Final Rulemaking (FRM) for MY 2017-2025 vehicles (EPA and NHTSA 2012a) and
the 2016 Proposed Determination (EPA 2016a), EPA adjusted its assessment of the advanced
turbocharged engine to reflect the use of variable geometry turbocharging, which reflected an
improvement to 24-bar engines that may be deployed in the nearer term than the 27-bar boosted
engines identified in the FRM. Recent innovations in this space include the dual-volute turbocharger,
which was recently ported over from diesel vehicles to the first four-cylinder engine in a full-size pick-
up truck, indicating some of the further potential for downsizing (Sherman 2018). However, the

 4

agencies have incorporated no advancements beyond twin scroll turbos nor any supercharged engines
whatsoever in its proposed rule, despite models from Volvo, Audi, and now GM all hitting the road with
these features.

E-boost allows for a more rapid spin-up of the turbocharger, essentially eliminating the “turbo lag”
which hinders both performance and efficiency. Suppliers like BorgWarner and Delphi have both
developed multistage turbochargers which incorporate e-boost to help provide boost on demand, which
improves the overall efficiency of the system by allowing for more “right sizing” of the engine relative
to the power demands it will see in the real world. Because e-boost requires a significant amount of
power, it is made possible in part by the development of 48V electrical systems, which allows for a
synergistic effect that could rival the fuel economy improvements of a conventional hybrid (Kendall
2015).

There are also performance gains which could be made, such as in Valeo’s recent demonstration on a
Kia Optima (Lee 2017). Based on supplier data, International Council on Clean Transportation (ICCT)
has estimated that this improvement could net an additional 5 percent reduction in fuel consumption at
a cost of just $338, indicating its strong potential for adoption within the timeframe of the rule
(Isenstadt et al. 2016a).

Supercharged engines are also available on the market, but are excluded from the agencies’ analysis,
again indicating a conservative approach. In some cases, the supercharger is a complement to a
turbocharger. With Volvo’s Polestar supercharged, turbocharged family of engines, the primary use is
for performance; however, it is indicative of the potential for generating significant amounts of power
in a very small engine, replacing a V8 with an I4 (e.g., Murphy 2017). Similarly, Eaton’s Electrically
Assisted Variable Speed (EAVS) supercharger system can be a complementary technology package to
48V mild hybrids. The EAVS supercharger allows for direct control of airflow in the engine without
having to rely upon exhaust gas energy, and the National Academies committee identified it as a
potential technology excluded from the agencies’ 2017-2025 TSD which could be used for downsizing
an engine by 50 percent (NAS 2015, p. 63). While the EAVS system is not on the market currently,
OEMs are currently testing the technology for possible deployment (Truett 2017).
 D) HIGH COMPRESSION RATIO ENGINES
Atkinson- and Miller-cycle engines are available on the market today and represent a cost-effective
alternative to the strategy of deploying downsized, boosted engines, but the agencies’ approach to date
has been conservative in terms of the effectiveness of this technology. The Volpe model ignores
advanced high-compression ratio (HCR) engines and limits the adoption of HCR to just the four
manufacturers who have already deployed the technology, even though it is an incredibly cost-effective
pathway (Section I.B, ICCT 2018).

EPA recently completed hardware testing on the “Advanced Atkinson Tech Package”, which increases
the compression ratio further and adds both cooled exhaust gas recirculation (CEGR) and cylinder
deactivation (DEAC) (Schenk and Dekraker 2017). While the Alliance of Automobile Manufacturers
asserted that “EPA’s modeled effectiveness values for the ATK2+CEGR+DEAC pathway…are seriously
overestimated,” hardware testing rebuts this—EPA’s data shows up to a 9.5 percent improvement over
the baseline configuration of the Atkinson engine for a future vehicle, which taken together with the

 5

level of improvement of the Atkinson engine over the “null vehicle” well exceeds the 15 percent level of
improvement claimed by the Alliance to be an “overestimate.” 7 This is consistent with the range
indicated by both the International Council on Clean Transportation (ICCT) (Isenstadt et al. 2016b)
and NAS (2015).

While HCR2 was incorporated in previous analyses, the agencies are now claiming that this engine
would potentially have durability issues if the engine were operated on Tier 3 fuel (PRIA, p. 302). To
support this, the agencies cite a report that does not exist in the docket. 8 Because such information was
not provided with the agencies’ proposal, we will have to speculate on its assessment. The agencies
appear to have relied upon the differences between anti-knock properties of Tier 2 and Tier 3 fuels,
mistakenly focusing solely on octane while ignoring ethanol content. As will be described further in
Section I.A.1.i), this fails to acknowledge the anti-knock benefit of charge cooling related to ethanol,
which more than compensates for the change in octane. HCR2 therefore should not be omitted out of
concerns around knock.

EPA’s model of an advanced HCR engine is not the only engine which outlines the vast potential
capability of high compression ratio engines beyond the baseline HCR technology—the 2018 Toyota
Camry far exceeds the base level of HCR technology assumed by the agencies (German 2018). While
this engine does not have all of the features of the HCR2 package constructed by EPA, it achieves
similar levels of performance, thus rendering the agencies’ rationale for excluding HCR2 moot—this is a
production vehicle using Tier 3 fuel which achieves performance equivalent to HCR2.
 E) NOVEL ENGINE DESIGNS
Moving beyond the high compression ratio SKYACTIV-G platform, Mazda recently announced its
SKYACTIV-X engine, which utilizes a combination of compression ignition and spark ignition to
improve engine efficiency by 20 to 30 percent over the current generation of SKYACTIV-G engines,
with volumetric fuel efficiency matching that of their diesel engines (Mazda 2017). In another bold step
beyond conventional engine platforms, Achates Power is testing its 2.7L opposed-piston diesel engine
in an F-150, which it claims can both meet Tier 3 emissions standards and would achieve a 2-cycle test
fuel economy of 37 mpg, about 10 percent higher than the level needed for fuel economy standards in
2025 (Brooke 2017). These and other developments speak to the ability for manufacturers to push
conventional vehicles even further than anticipated.

While agencies have conservatively estimated high compression ratio engines, they have not
incorporated variable compression ratios at all—the technology was not modeled, nor was it
incorporated into the Volpe model underpinning the proposal. Currently, Nissan’s VC-Turbo engine,
found in both the 2019 Infiniti QX50 and 2020 Nissan Sentra, can vary the compression ratio of the
engine (from 8:1 to 14:1) and can run under both Atkinson and Otto cycles, essentially allowing tuning of

7 The Alliance cites a 15 percent effectiveness relative to the “null vehicle,” while the EPA study compares HCR1 to
HCR2, indicating a 9.5 percent improvement from HCR1 to HCR2. HCR1 itself showed an improvement of about 9
percent in each vehicle class over the null vehicle (EPA 2016b), indicating that together these technologies well exceed
the 15 percent threshold cited as “overestimated.”
8 PRIA, fn. 244: “IAV advanced engine modeling phase 3 test data comparison of cEGR and different combustion

stability. Report submitted to docket.” As of October 24, 2018, no such document has been uploaded to either agency
docket.

 6

the right mode of operation for the precise set of load conditions (Nissan 2017). Paired with a
turbocharger to provide increased performance under high load, similar to a boosted and downsized
engine, the VC-Turbo is part of a strategy to improve fuel efficiency by 30-35 percent over the previous
model, enough for this luxury vehicle to exceed its regulatory targets without any credits. Given that
this is being put in production in a high-volume vehicle, there is no reason for the agencies to exclude
its adoption.
 F) BATTERIES FOR HYBRID AND PLUG-IN ELECTRIC VEHICLES
The choice of materials for hybrid and electric vehicle battery cathodes and anodes (or “battery
chemistry”) can have a large impact on performance and materials cost and therefore impact the
modeled cost of drivetrain electrification (Vaalma et al. 2018). The choice of battery chemistries in the
proposed rule contains internal inconsistencies, does not reflect current industry practice, and does not
use the most recent model data (despite references to the contrary).

The choice of battery chemistry modeled in the proposed rule is unclear. In the PRIA (p. 368), plug-in
hybrid electric vehicles (PHEV) and battery electric vehicles (BEV) are listed as using the NMC441-Gr
chemistry. In the detailed description of the modeling, PHEV and BEV are listed as using NMC333-Gr
chemistry (p. 210, Islam et al. 2018b). However, the rulemaking also states that the most recent version
of ANL’s BatPaC model was used to estimate battery costs. The default lithium ion chemistry in the
current BatPaC model is NMC622 (ANL 2018). The choice of NMC variant effects battery costs, as
NMC622 replaces more expensive cobalt with nickel. Because the underlying BatPaC calculations are
not available, and due to the inconsistency between the PRIA and ANL supporting information, it is not
possible to determine the magnitude of the cost error in the PHEV and BEV battery pack costs, only
that the costs are likely higher than current battery cost data supports. Previous requests for clarity in
this matter have gone unfulfilled (Peter 2018).

The chemistry chosen for mild and strong hybrids also differs from those used in current and
announced hybrids. All non-plug-in hybrids in the proposed rule analysis use lithium iron phosphate
(LFP) chemistry. In practice, most hybrids on the road do not use this chemistry. The most prevalent
strong hybrid, the Toyota Prius, does not use the LFP chemistry. Mild hybrids, like the new Ram 1500
pickup are also not using LFP chemistry (FCA 2018). The cost of strong hybrid batteries as modeled in
this proposed rulemaking are greater than $1,200, even for the most efficient small car class, while an
estimate from ANL in 2017 estimated current power-split hybrid battery pack costs at $614 (2017k).
Because of the lack of detailed information on the battery cost modeling, it is not possible to determine
if the choice of battery chemistry is responsible for this discrepancy, but what is clear is that there are
serious concerns about the methods and results for battery costs.
 G) MASS REDUCTION
There are a whole host of problems with the way in which the agencies have considered mass
reduction, which we describe below. Many of these issues stem from a change regarding the fraction of
the vehicle assumed to be the “glider” vehicle, which the agencies do not even attempt to justify yet has
a profound effect on safety and technological feasibility.

 7
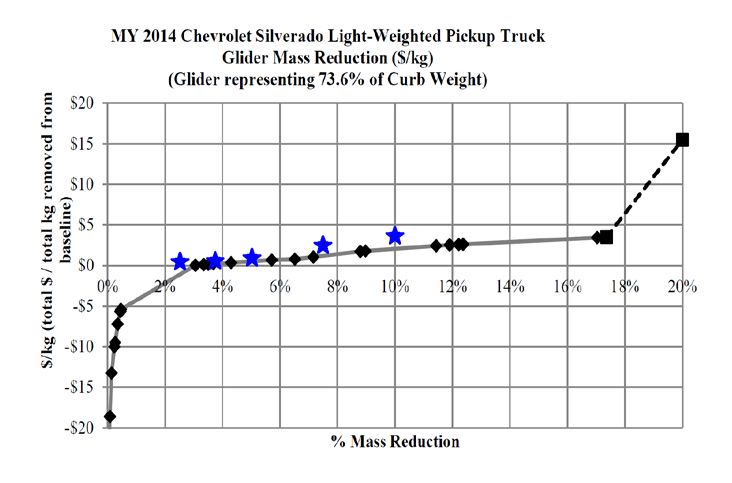
FIGURE 1. Glider weight as a function of curb weight, for over 600 production vehicles

 100%

 80%
 Agencies' Prior Analysis (TAR)
 60%

 Agencies' Current Analysis (NPRM)
 40%

 20%

 0%

 Segment Classification

The share of a vehicle’s curb weight assigned to the “glider” is shown to be greater than the agencies’ current analysis for all
vehicle segments. In fact, it is shown to be even greater than previous analyses for all segments except for S (Sport), for which
lightweight materials are frequently already deployed—and even that class is only a marginally lower fraction (72 percent,
compared to 75 percent in prior analyses).
Note: Glider is defined here as everything but the engine, transmission, clutch, cooling system, and fuel system.
SOURCE: A2MAC1 2018

 (1) The agencies assumption that mass reduction can only be applied to 50 percent of the
 curb weight is unjustified and inaccurate
In the NPRM, the agencies have determined that the “glider” of a vehicle, which is essentially
everything minus the powertrain, 9 accounts for only 50 percent of the vehicle’s curb weight. This is a
substantial change from prior analyses, when the glider was assumed to represent 75 percent of the
vehicle’s curb weight, and this change is not justified by the agencies in any way. 10

Incredibly, the agencies’ own analysis in the NPRM disagrees with this fraction. The agencies base their
analysis of the costs for lightweighting on two studies, one passenger car (2011 Honda Accord) and one
light truck (2014 Chevrolet Silverado)—these studies themselves show the glider making up 79 percent
of the vehicle in the case of the Accord (PRIA p. 393), and 73.6 percent of the curb weight for the
Silverado (PRIA p. 399). Both of those percentages are substantially higher than 50 percent and
essentially in line with the agencies’ prior analyses.

This assumption also disagrees with industry data, which shows that not only does the glider represent
a more significant share of the curb weight than assumed by the agencies in this analysis, but it even
exceeds the share of curb weight assumed in prior analyses (Figure XXX). It should be noted that for its

9 Formally, NHTSA’s definition of the glider is everything but the engine, transmission, thermal systems, and some safety
components.
10 The change is acknowledged on p. 417 of the PRIA, but there is literally no documented explanation given for it.

 8
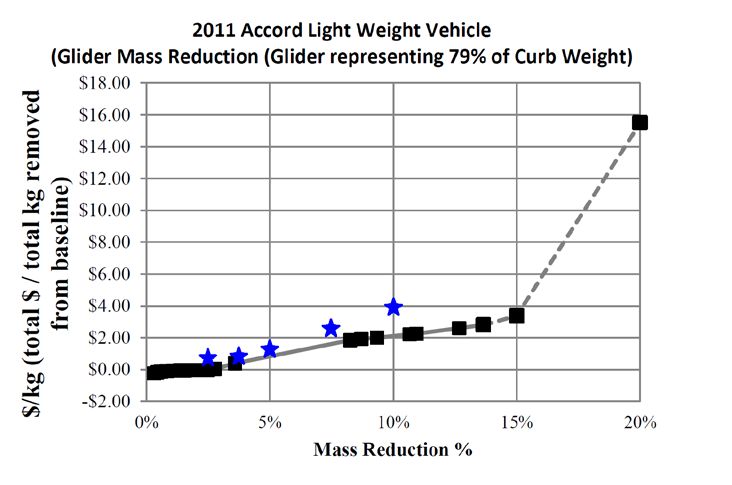
own study of mass reduction, NHTSA had access to this database (PRIA Section 6.3.10.1.16)—it is
therefore impossible to imagine that the agencies were unaware of such data and have instead
arbitrarily and capriciously chosen to ignore it in order to assert a more conservative conclusion.

 (2) Reducing the glider fraction inaccurately limits the potential and applicability of mass
 reduction
Representing the glider as a reduced fraction of the curb weight causes the agencies to significantly
underestimate the potential for mass reduction. Because mass reduction is applied at the glider level,
reducing the share of the glider inherently caps the potential reduction in the curb weight—this single
change has cut the potential improvement from mass reduction by one-third (PRIA Table 6-57).

Previous agency analysis as well as analysis from independent organizations including CARB, the
National Academies, and industry consultants has placed the total potential for mass reduction by 2025
at between 15.8 and 32 percent overall reduction in curb weight (Caffrey et al. 2013, Caffrey et al. 2015,
Lotus 2012, NAS 2015, Singh et al. 2012, Singh et al. 2016, Singh et al. 2018,). In contrast, the NPRM
claims a maximum reduction of 10 percent, well below not just the maximum potential identified, but
even the lowest maximum potential identified by papers cited in agency analysis.

The agencies’ assessment of the maximum achievable mass reduction is so low that the Ford F-150 was
able to exceed that in 2015 through the deployment of aluminum alone, and a number of the vehicles
identified by the agencies’ as meeting its highest level of mass reduction in MY2016 (PRIA Table 6-58)
have deployed little, if any, lightweight material (e.g., Nissan Versa, Kia Soul, Honda Civic). This is in
stark contrast to the agencies’ discussion of the maximum potential for lightweight materials (e.g., PRIA
Sections 6.3.10.1.1.2 and 6.3.10.1.1.3.3)

The impact of this is twofold: 1) as noted in Section I.A.1.j), increasing the fraction of vehicles in the
baseline fleet which have already applied mass reduction significantly diminishes the future potential
for the vehicle fleet; and 2) by capping the total potential for mass reduction at such a low level, much
lower than in any previous analysis, it artificially reduces the potential for this cost-effective technology
and therefore increases the required use of more expensive and advanced technologies.

 (3) The agencies have inflated the costs of mass reduction, per their own analysis
The agencies have based the costs for mass reduction on glider weight reduction; however, the need for
more expensive materials and more advanced engineering and design strategies only results from the
need for greater levels of absolute mass reduction on the vehicle. In effect, these costs have been
derived from the assumption of reductions as great as 16.8 percent reduction in curb weight in the case
of the Silverado (Singh et al. 2018) and as great as 18 percent reduction in curb weight in the case of the
Honda Accord (Singh et al. 2016), but they have been applied to curb weight reductions approximately
two-thirds that magnitude. This is completely invalid and significantly overstates the costs for mass
reduction.

This is clearly demonstrable by examining the actual reports relied upon by the agencies, both of which
refer to direct manufacturing costs as a function of curb vehicle weight, not just glider weight. The
procedure the agencies have used to generate cost data is like arbitrarily scaling the x-axis by a factor of
1.5, yielding the same costs at two-thirds the amount of mass reduction. In fact, in the case of the

 9
FIGURE 2. Agency manufacturing costs for mass reduction of cars, compared to source

The agencies’ costs for mass reduction (blue stars) are in direct conflict with the data cited as a source for those costs (black
squares) because the agencies have improperly normalized them to different glider mass shares. This leads to costs for the
highest levels of mass reduction that are nearly twice as large as those the agencies claim result from the source data.
Note: Table 6-39 data is divided by 1.5 to account for the retail price equivalent (RPE) used by the agencies.
SOURCE: PRIA FIGURE 6-160, TABLE 6-39

Silverado, the agencies’ study shows costs that are less than one-quarter the cost if one were to limit the
total mass reduction to 10 percent as the agencies have done.11 This is even evident in the data as
presented by the agencies in PRIA Figures 6-161 and 6-163, which do not agree at all with the
supposedly identical data in PRIA Tables 6-38 and 6-41, respectively (Figures 2 and 3).

It is also worth noting that while the agencies have listed a large number of studies that have examined
the costs of and potential for the deployment of lightweight materials (PRIA Table 6-43), the entire cost
basis for the agencies’ analysis is in just two studies commissioned by NHTSA. While the agencies claim
that “those studies often did not consider many important factors or…made unrealistic assumptions
about key vehicle systems,” the agencies have not specifically identified these factors or assumptions
that should merit disregarding a much broader suite of evidence in assessing the costs of this
technology. Moreover, these peer-reviewed studies were included previously in agency analysis as part

11Section 10.10 in Singh et al. 2018 notes the potential for up to 10.5 percent mass reductions in vehicle mass at a
premium of $0.83 per kg as compared to $3.48 per kg for up to 16.8 percent; it is the latter value on which the agencies
have relied to calculate the costs for mass reduction. For even further clarity, we can compare the value “derived from
light truck light-weighting study” with the actual values in the study—PRIA Table 6-41 lists an estimated direct
manufacturing cost of $3.09 per kg for a percentage mass reduction of 11.0 percent, leading to a total cost of $829.67,
while the actual report shows a manufacturing cost increase of $0.83 per kg for a percentage curb weight reduction of
10.5 percent for a total cost of $212.

 10
FIGURE 3. Agency manufacturing costs for mass reduction of trucks, compared to source

The agencies’ costs for mass reduction (blue stars) are in direct conflict with the data cited as a source for those costs (black
squares) because the agencies have improperly normalized them to different glider mass shares. This leads to costs for the
highest levels of mass reduction that are approximately 70 percent larger than those the agencies claim result from the source
data.
Note: Table 6-42 data is divided by 1.5 to account for the retail price equivalent (RPE) used by the agencies.
SOURCE: PRIA FIGURE 6-163, TABLE 6-42

of the record when deriving previous estimates for the costs of mass reduction (Section 2.2.7.4, EPA
2016a; Section 5.2.7.4.1, EPA et al. 2016).

 (4) Assessing the impact of the agencies’ inaccurate characterization of mass reduction
Because mass reduction is one of the most cost-effective strategies for reducing fuel use and greenhouse
gas emissions from the fleet, any limits on or inaccuracies in the effectiveness of this technology can
have a significant effect on the modeling results. Here, we attempt to quantify the modeling impact of a
shift from prior agency assumption of a 75 percent glider share downwards to 50 percent.

The Autonomie model results used as inputs to the Volpe model were based on the application of each
level of mass reduction technology (MR1, MR2, etc.) to a glider share of 50 percent. Therefore, it is
necessary to revise these values to reflect an increased level of curb weight reduction for each MR level.
Reductions in fuel use as a function of mass reduction have a generally linear response, making it fairly
straightforward to extrapolate the results from ANL to different levels of curb weight reduction. In
Figure 4, we illustrate the average fuel consumption improvement for packages compared to the “null
vehicle” as a function of mass reduction. While there is a notable “kink” in the data around 5 percent,
this is the direct result of the agencies’ determination not to hold performance constant for low levels of
mass reduction, meaning that a significant share of the benefit of a few percent reduction in mass has
gone towards improved performance rather than improved fuel economy, leaving a substantial

 11
TABLE 1. Curb weight reduction for different shares of curb weight assigned to the glider

 Agency defined Adjusted
 Glider mass
 Tech Curb Weight Curb Weight
 reduction % Glider share Glider Share
 Reduction Reduction
 MR0 0% 50% 0.000% 75% 0.000%
 MR1 5% 50% 2.500% 75% 3.750%
 MR2 7.5% 50% 3.750% 75% 5.625%
 MR3 10% 50% 5.000% 75% 7.500%
 MR4 15% 50% 7.500% 75% 11.250%
 MR5 20% 50% 10.000% 75% 15.000%
Consideration of a glider share of 75 percent enables a 50 percent greater potential in curb weight reduction, up to 15 percent
from just 10 percent for the highest level of technology applied in the Volpe model.
SOURCE: PRIA TABLES 6-39/6-42, AND UCS ANALYSIS

FIGURE 4. Fuel consumption relative to the “null vehicle,” as a function of curb weight reduction

 0.8
 Average Fuel Consumption Relative to No Tech

 0.78

 0.76

 0.74

 0.72

 0.7

 0.68

 0.66

 0.64
 0% 3% 6% 9% 12% 15%
 % Curb Weight Reduction
 SmallCar SmallCarPerf MedCar MedCarPerf
 SmallSUV SmallSUVPerf MedSUV MedSUVPerf
 Pickup PickupHT

Fuel consumption modeled with Autonomie for different vehicle classes is strongly linear (solid lines), allowing for clear
interpolation and extrapolation of the data (dashed lines). Mass reduction less than 5 percent total curb weight reduction
resulted in significantly greater fuel consumption than might be expected from that modeled at higher levels of mass reduction
due to a lack of performance neutrality.
SOURCE: SOLID LINES DERIVED FROM FC1_IMPROVEMENTS, NHTSA 2018A; DASHED LINES ARE UCS ANALYSIS

 12
TABLE 2. Costs for compliance with current greenhouse gas standards, in MY2028, by
manufacturer, after correcting for increased glider share of curb weight

 Manufacturer NPRM Corrected Diff % Diff
 BMW $ 4,265 $ 4,055 $ (210) -5 %
 Fiat-Chrysler $ 4,096 $ 3,532 $ (563) -14 %
 Ford $ 3,437 $ 2,948 $ (490) -14 %
 General Motors $ 3,151 $ 2,752 $ (399) -13 %
 Honda $ 1,851 $ 1,529 $ (322) -17 %
 Hyundai $ 1,201 $ 1,152 $ (48) -4 %
 Jaguar Land Rover $ 4,994 $ 5,569 $ 575 12 %
 Kia $ 1,755 $ 1,644 $ (110) -6 %
 Mazda $ 2,691 $ 2,147 $ (544) -20 %
 Mercedes $ 4,485 $ 4,307 $ (178) -4 %
 Nissan-Mitsubishi $ 1,141 $ 1,113 $ (28) -2 %
 Subaru $ 1,247 $ 1,299 $ 52 4%
 Tesla $4 $4 $0 3%
 Toyota $ 2,235 $ 1,973 $ (262) -12 %
 Volkswagen $ 5,004 $ 4,380 $ (623) -12 %
 Volvo $ 3,538 $ 3,167 $ (371) -10 %
 INDUSTRY TOTAL $ 2,785 $ 2,477 $ (309) -11 %
Adjusting the mass reduction technologies to accurately reflect higher, more appropriate share of curb weight available for mass
reduction results in substantially reduced costs for nearly every single manufacturer. as well as the industry as a whole.
Note: The substantial increase in cost for Jaguar Land Rover is the result of a correction to the baseline levels of mass reduction. The
levels of mass reduction assumed for the Jaguar XJ platform in the NPRM baseline market data did not correspond to PRIA Table 6-
58. We corrected this discrepancy, which thus reduced the availability for future mass reduction from jaguar land rover’s fleet of
vehicles, increasing cost for that specific manufacturer.

benefit of mass reduction underutilized and/or uncounted. For our correction, we have not altered this
assumption.

While only the average data is shown in Figure 4 for simplicity, we have considered and modified every
single package for every single modeled vehicle, interpolating/extrapolating the results according to the
improvement relative to an equivalent package with 0 mass reduction (e.g.,
“;;;;;TURBO2;AT9;BISG;ROLL0;MR3;AERO0” vs. “;;;;;TURBO2;AT9;BISG;ROLL0;MR0;AERO0”). It
should be noted that no interpolation was necessary for the adjusted MR1 and MR3 results, which
correspond exactly to the agencies’ MR2 and MR4 values.

In addition to adjusting the FC1_Improvements.csv file input into the Volpe model, it is also necessary
to edit both the technology file and market data file (NHTSA 2018d). In the case of the technology file,
we have simply corrected the glider share in the Parameters tab to reflect 0.75 (instead of 0.5), so that
the costs for mass reduction are applied to an appropriate level of reduced mass. In the case of the
market data file, we have had to correct the baseline vehicles who’ve “USED” a given level of mass

 13
reduction—these were adjusted based on the levels of mass reduction for each platform in PRIA Table
6-58. No adjustment to technology costs were necessary because, as was explained in Section I.A.1.g)(3),
these costs already correspond to the adjusted technology levels detailed in Table 1.

Using the Volpe model provided in the NPRM with these updated datafiles yields a reduction in the
average costs of compliance in MY2028 of about $300 (Table 2).

 H) HIGH OCTANE FUEL
The agencies request comment on the impact of high-octane blends (83 FR 43041). While we agree
there are exciting potential efficiency improvements associated with higher octane gasoline,
particularly for high compression turbocharged cars (DOE 2017, Leone et al. 2015, Speth et al. 2014), it
is premature to consider high octane fuels in this round of rulemaking.

An orderly transition to high-octane fuel would take several years to complete. It will take time for the
necessary regulations to be finalized, for vehicles optimized for high-octane gasoline to come to market
and to build out the fuel distribution infrastructure to make this fuel broadly available. And even once
high-octane gasoline is in use, it will take more time for automakers to phase-in new models optimized
for high-octane fuel and to fully replace the legacy E10 fleet. Another factor to consider is that the rising
share of high-octane gasoline will be buffered by falling sales of gasoline, given increasing fuel
efficiency, such that the overall demand for ethanol will change more slowly. Our expectation is that
high-octane gasoline will not significantly enter commerce before 2026, and subsequently will only
gradually gain market share through 2040. 12 There is no realistic prospect of completing this process
before 2025 or 2026, the timeframe of this rulemaking. The appropriate context for this discussion
within vehicle rules is the next round of fuel economy and emission standards. Even then, an
expeditious rulemaking process will be required to achieve adequate regulatory clarity to facilitate
rapid adoption post-2026.

We strongly oppose granting fuel economy credits based on the technical potential of vehicles to
operate on high-octane fuel before there is clear evidence that high-octane fuel is in use and the
potential fuel economy benefits are being realized on the road. The history of the CAFE flex-fuel
vehicle (FFV) program provides clear evidence that credits given based on unrealized potential and in
advance of adequate fuel distribution infrastructure are counterproductive. Recent analysis
demonstrates that the FFV program actually increased gasoline consumption and emissions (Jenn,
Azevedo, and Michalek 2016) without substantially increasing the use of alternative fuels. In its 2016
final Renewable Fuel Standard Program: Standards for 2017, EPA found that, despite the fact that 21
million FFVs on the road had the technical capacity to use up to 13 billion gallons of E85, only 275
million gallons of E85, or 2% of the potential, were likely to be used (EPA 2016c).

To determine the public costs and benefits of a high-octane gasoline program requires an examination
of not only vehicle policy, but fuel policy as well. A transition of the light duty vehicle fleet to a higher

12However, these qualitative expectations need to be quantified and subject to public review before such significant
changes are used as the basis for revised fuel economy standards.

 14
ethanol blend has obvious implications for the quantity of ethanol consumed in the United States.
However, the implications are far more complex than simply increasing the use of ethanol by 150%
compared to the ethanol blended into E10 today. A rapid expansion of fuel ethanol use that is supplied
primarily by corn ethanol could have negative impacts on other users of corn as well as land use change
impacts, water pollution and other problems, as occurred during the rapid transition to E10 between
2005 and 2010 (Martin 2016). We recommend a more predictable and gradual phase-in, which would
allow for the parallel growth of lower carbon cellulosic ethanol sources and could supply increasing
quantities of ethanol without the associated negative impacts.
 I) AGENCIES HAVE INCORRECTLY ADJUSTED FOR A SWITCH FROM TIER 2 TO TIER 3
 GASOLINE
The modeling packages have been improperly adjusted to reflect behavior related to differences
between Tier 2 and Tier 3 fuels, primarily resulting from the lack of recognition in fuel properties.

 (1) Adjustment related to energy content instead of carbon content
The agencies cite concerns from the Alliance of Automobile Manufacturers regarding a discrepancy
between the Tier 2 fuel used for testing and the Tier 3 fuel to which manufacturers will be required to
test and which is more reflective of the fuel used in the marketplace. Little information is available on
precisely how the model handles the difference between Tier 2 and Tier 3 fuel. There are just two
sentences in the PRIA describing what was done: “An adjustment factor was applied to the Autonomie
simulation results to adjust them to reflect Tier 2 certification fuel. ANL adjusted the vehicle fuel
economy results to represent certification fuel by using the ratio of the lower heating values of the test
and certification fuels” (p. 257).

This adjustment factor completely ignores a detailed study by EPA on exactly this question, which
found that while fuel consumption increases with the switch from Tier 2 to Tier 3 fuel, emissions are
reduced (EPA 2018c). In fact, not only does the adjustment factor applied by Autonomie exaggerate the
switch (converting solely with energy density would assume a 3.7 percent increase in fuel consumption
compared to the observed 2.7 percent increase), but it actually goes in the wrong direction when applied
to greenhouse gas emissions, which show a reduction of 1.4 percent on the test cycle as a result of the
fuel switch.13 As a result, Autonomie’s model is overstating greenhouse gas emissions on Tier 3 fuel by
4.2 percent.

This issue underscores a key problem with the approach taken when it comes to a switch to Tier 3
fuel—the agencies are trying to account for it in the modeling data while ignoring its impacts in the
certification tests, and therefore measurements of compliance. This effectively double counts any
penalty in fuel economy (the rules are reduced by the factor because the modeling incurs the penalty,
but then the measurements to comply with those are corrected to account for the switch, boosting the
test value by exactly this penalty) and ignores the beneficial impact of CO2 reductions at the tailpipe,
which will result in an improvement on the test cycle.

Just two vehicles in the MY2016 test car database were certified using Tier 3 fuel (EPA 2017c),
amounting to less than 1 percent of the market, so the impacts of this fuel switch moving forward will

13To obtain the test cycle improvement, we have simply weighted the changes in the FTP and HWFET fuel consumption
and emissions observed in EPA 2018cc by the 55/45 ratio used for the regulatory tests.

 15
play a significant role in future emissions profiles. The CAFE test procedure already has an adjustment
in place for fuel properties relative to the 1975 test fuel (40 CFR § 600.113-12(h)(1))—however, carbon-
related exhaust emissions (CREE) do not have a similar corrective factor (40 CFR § 600.113-12(h)(2)),
which means this fuel switch could play a significant role in reducing compliance if it is taken into
account appropriately…or lead to drastically conservative fuel economy and greenhouse gas emissions
curves if it is not.

 (2) Adjustment related to knock threshold
The agencies have incorrectly modified the engine maps developed on Tier 2 fuel (83 FR 43036). In the
discussion in the PRIA, they focus primarily on a single fuel property, octane (PRIA Section
6.3.2.2.17.4). However, of equal importance in the difference between Tier 2 and Tier 3 fuels are the
unique properties of ethanol, including charge cooling. Unfortunately, the effect of charge cooling
cannot be directly determined from the standard test of Research Octane Number (RON) (Foong, et al.
2013), and therefore it is inherently excluded from the agencies’ discussion because of their singular
focus on octane. Data on different fuel blends of ethanol shows that charge cooling can have a
tremendous impact to reduce knock in direct injection engines—precisely the engines which the
agencies have modified—resulting in an “effective octane” difference of +6 for E10, 14 thus potentially
compensating for the difference in octane between Tier 2 (E0 93 AKI) and Tier 3 (E10 87 AKI) fuels
(Kasseris and Heywood 2012). In fact, this is borne out in experiments comparing E0 91 and E10 87
fuels, where E10 87 actually exhibits lower knock intensity at high load, exactly where the agencies are
claiming the fuel switch would have an adverse effect (Joshi 2017).

This error affects the efficiency of virtually all advanced engines—it was used to preclude the use of
HCR2 (PRIA Section 6.3.2.2.20.18) as well as reduce the effectiveness of all turbocharged engines and
engines with cooled EGR (PRIA, Figures 6-84, 6-89, 6-94). Without an A/B analysis, it is impossible to
judge the severity of this error. However, at the very least the agencies should not exclude the HCR2
technology on such basis, and according to their own analysis, this correction alone would result in a
reduction in MY2029 costs in the Baseline Standards of $700-$850 (PRIA Table 13-4), or about one-
third of the difference in cost between the Baseline and Proposed Standards. Correcting the
effectiveness of the affected engines would only further reduce costs—clearly this error has a significant
impact on the ability for manufacturers to comply with future standards and should be corrected in
future modeling efforts.

It should also be noted that there are a number of different strategies manufacturers can use when
considering approaches to different fuels, and not all of them necessitate reductions in efficiency as the
agencies a priori assumption suggests. The agencies even point out one such unique knock-reduction
strategy for the 2014 SkyActiv-G on which their HCR data is based (PRIA Figure 6-43). An additional
example of how engines can be reoptimized without suffering a penalty for using a lower octane fuel is
in the spark-assisted compression ignition engine developed by Mazda—the managing executive in
charge of powertrain and vehicle development and product planning even noted that “as a matter of
fact actually, 91 RON give you better performance than 95 RON” (Mathioudakis 2017). This remark was
consistent with the preliminary torque curves for the SkyActiv-X spark-assisted compression ignition

14 E10 refers to gasoline with 10 percent ethanol. E0 refers to gasoline with 0 percent ethanol.

 16
You can also read