Public Transit and COVID-19 Pandemic: Global Research and Best Practices SEPTEMBER 2020

Page created by Steven Rojas
 
CONTINUE READING
Public Transit and COVID-19 Pandemic: Global Research and Best Practices SEPTEMBER 2020
Public Transit and
COVID-19 Pandemic:
Global Research and Best Practices
S E P T E M B E R 2 02 0
Public Transit and COVID-19 Pandemic: Global Research and Best Practices SEPTEMBER 2020
Disclaimer: The global COVID-19 pandemic is an emerging, rapidly evolving situation; as such, re-
                                                                                         search on the subject is in its initial stages and continuously developing. Many scientific studies
                                                                                         available about the virus are pre-prints and not yet peer reviewed. As new evidence emerges, it may
                                                                                         affect the information contained in this document.

                                                                                         This report was commissioned by the American Public Transportation Association and prepared by:

                                                                                         Sam Schwartz Consulting

                                                                                         Samuel I. Schwartz, PE, CEO and Founder

                                                                                         Holly Chase, AICP, Senior Transit Planner

                                                                                         Lian Farhi, Senior Transportation Planner

                                                                                         Joe Iacobucci, Principal + West Coast General Manager

                                                                                         Kelly McGuinness, Transportation Planner

                                                                                         Elad Mokady, AICP, Senior Transit Planner

                                                                                         Rob Royall, Graphic Designer

                                                                                         Kate Sargent, AICP, Senior Associate + Oakland Office Leader

                                                                                         Daniel Schack, AICP, Senior Associate + Director of Planning

                                                                                         Alex Spence, Transit Engineer

2   PUBLIC TR ANSIT AND COVID-19 PANDEMIC: GLOB A L RESE A RCH A ND BES T PR AC T ICES                                                                                                         3
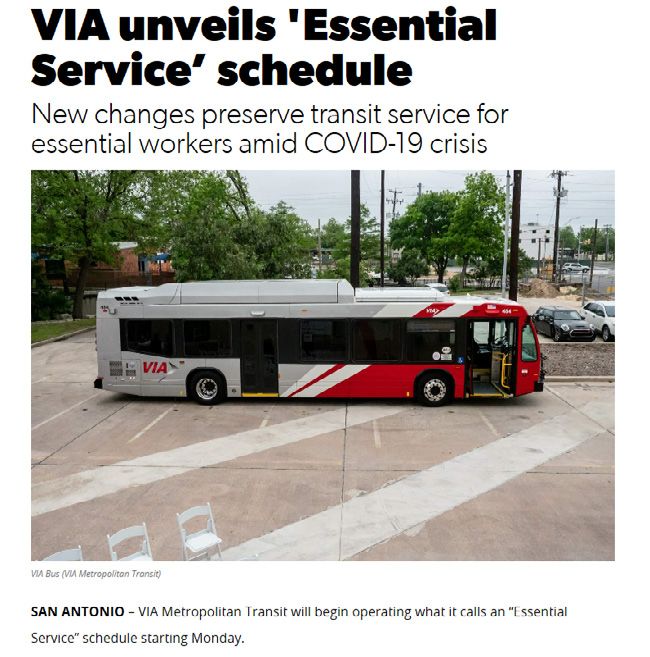
Public Transit and COVID-19 Pandemic: Global Research and Best Practices SEPTEMBER 2020
Table of Contents

                                                                                         Executive Summary. . . . . . . . . . . . . . . . . . . . . . . . . . . . . . . . . . . . . . . . . . . . . . 6

                                                                                         Introduction. . . . . . . . . . . . . . . . . . . . . . . . . . . . . . . . . . . . . . . . . . . . . . . . . . . . . 10

                                                                                         Part I: Transit Usage and COVID-19 Infection Rates. .  .  .  .  .  .  .  .  .  . 12
                                                                                           COVID-19 Transmission. .  .  .  .  .  .  .  .  .  .  .  .  .  .  .  .  .  .  .  .  .  .  .  .  .  .  .  .  .  .  .  .  .  .  .  .  .  .  .  .  .  .  .  .  . 13
                                                                                           No Clear Link between Transmission and Transit .  .  .  .  .  .  .  .  .  .  .  .  .  .  .  .  .  .  . 22
                                                                                           Analysis of Transit Ridership and Infection Rates .  .  .  .  .  .  .  .  .  .  .  .  .  .  .  .  .  .  . 24

                                                                                         Part II: Public Transit Response Measures.  .  .  .  .  .  .  .  .  .  .  .  .  .  .  .  .  .  . 38
                                                                                           Risk Mitigation for Health and Safety .  .  .  .  .  .  .  .  .  .  .  .  .  .  .  .  .  .  .  .  .  .  .  .  .  .  .  .  .  .  . 39
                                                                                           Service and Ridership Recovery Strategies.  .  .  .  .  .  .  .  .  .  .  .  .  .  .  .  .  .  .  .  .  .  .  .  . 43
                                                                                           Best Practices Summary and Recommendations .  .  .  .  .  .  .  .  .  .  .  .  .  .  .  .  .  . 48

                                                                                         Acknowledgments. . . . . . . . . . . . . . . . . . . . . . . . . . . . . . . . . . . . . . . . . . . . . . . 50

                                                                                         Glossary. . . . . . . . . . . . . . . . . . . . . . . . . . . . . . . . . . . . . . . . . . . . . . . . . . . . . . . . 51

                                                                                         Appendix A: COVID-19 Transmission (Expanded). . . . . . . . . . . . . . . . . . 52

                                                                                         Appendix B: Additional Studies on Transit and Transmission. . . . . . . . 59

                                                                                         Resources. . . . . . . . . . . . . . . . . . . . . . . . . . . . . . . . . . . . . . . . . . . . . . . . . . . . . . . 62

4   PUBLIC TR ANSIT AND COVID-19 PANDEMIC: GLOB A L RESE A RCH A ND BES T PR AC T ICES                                                                                                                                                                       5
Public Transit and COVID-19 Pandemic: Global Research and Best Practices SEPTEMBER 2020
2 .	 An analysis of public transit ridership in multiple cities over the
                                                                                                 past three months shows no correlation with the rise or fall of local
                                                                                                 COVID-19 cases. Case studies underscore that case rates are tied
                                                                                                 primarily to local community spread, rather than correlated to pub-
                                                                                                 lic transit ridership rates.

                                                                                               • In Hartford, Connecticut, public transit ridership has remained
                                                                                                 nearly constant in recent months, while COVID-19 cases have fallen.

                                                                                               • More than 150 million rides have been taken on New York City sub-
                                                                                                 ways and buses between June 1 and August 18, yet the positive test
                                                                                                 result rate has dropped by 70%, from 3.3% positive to 1.0%. 1, 2

                                                                                               • In San Francisco, California, Salt Lake City, Utah, Columbus, Ohio,
                                                                                                 and Austin, Texas, public transit ridership has remained mostly
                                                                                                 constant in recent months, but COVID-19 cases have skyrocketed.

      Executive Summary                                                                     In New York City, from June 1 to August 18, more than 76 million rides were taken
                                                                                            on the subway system and close to 79 million taken on city buses. During that time
      The coronavirus pandemic struck major cities across the world quickly
                                                                                            the case count for city residents dropped from an average of over 600 per day to
                                                                                            approximately 250 per day.
      and with devastating impacts. Within three months of the first recorded
      case, many major cities were shut down, with residents forced to stay
      at home. In the United States, New York City became the epicenter for
      cases and deaths. At first, rural areas and less-dense cities saw few in-
                                                                                              COVID-19 Cases                                                          Subway & Bus Trips
                                                                                                    (per day)                                                                       (per day)
      fections. This led some researchers and media pundits to proclaim that
                                                                                                  1,000
      public transit was a major cause for the severity of urban outbreaks.
                                                                                                    900                                                                                      2,500,000
      Since then, however, the disease has spread to nearly every corner of
                                                                                                    800
      the country and world and is widespread in many communities where                             700                                                                                      2,000,000
      public transit ridership is low or non-existent. Recent analyses, and a                       600
      growing number of experts, have now concluded that public transit had                         500                                                                                      1,500,000
      little or no role in the spread of the disease.                                               400
                                                                                                                                                                                             1,000,000
                                                                                                    300
      This report is based on a comprehensive review of United States and                           200                                                                                      500,000
                                                                                                    100
      global research regarding COVID-19 transmission and public transit,
                                                                                                      0                                                                                      0
      interviews with public health experts, and our own analysis of various                              1st   8th   15th   22nd   29th   6th   13th   20th   27th   3rd    10th     17th
      data sources. These are our principal findings:
                                                                                                                      June                         July                     August
      1 .	 No direct correlation has been found between use of urban pub-
           lic transit and transmission of COVID-19. A review of studies from                             Case Count: 7-day Rolling Average (NYC residents only)
                                                                                            Data source:  MTA, Ridership:
                                                                                                       Transit New York 7-day
                                                                                                                          City Department   of Health; Daily numbers represent
                                                                                                                                Rolling Average
           around the world indicate minimal risk from using public transit,
                                                                                            7-day rolling averages.
           especially where specific safeguards are in place, such as face cov-
           erings, well-functioning ventilation systems, and minimal talking by
           riders.

6   PUBLIC TR ANSIT AND COVID-19 PANDEMIC: GLOB A L RESE A RCH A ND BES T PR AC T ICES   EXECUTIVE SUMMARY                                                                                               7
Public Transit and COVID-19 Pandemic: Global Research and Best Practices SEPTEMBER 2020
3 .	 Mask wearing has been shown to be effective at reducing per-                                                            5 .	 It appears that what you do at the end of a trip affects the probabil-
           son-to-person transmission by blocking droplets from spreading                                                               ity of contracting the virus far more than the mode of travel. Many
           from an infected person, controlling the source; consequently, pub-                                                          people who have continued to travel, by car or public transit, over
           lic transit systems are requiring riders to wear masks. Public transit                                                       the past few months are essential workers, who have had higher case
           agencies also have aggressively been cleaning their train systems                                                            rates regardless of their commute mode.7, 8
           and have or are developing airflow improvements to meet or exceed
           air quality recommended levels of 12 fresh air exchanges/hour.3 Trains                                                  6 .	 There will be long-term health consequences if people in large num-
           and many bus fleets achieve or exceed that level. In addition, many                                                          bers switch from public transit to private cars. On a per mile basis,
           buses increase ventilation rates by opening windows and may also                                                             passengers are about 20 times more likely to experience a fatal crash
           benefit by frequently opening doors to allow passengers to board                                                             in a car than when using public transit.9 In addition, more time spent
           and alight.4                                                                                                                 in a car can lead to inactivity diseases, including obesity, diabetes,
                                                                                                                                        and high blood pressure.10 On an environmental basis, cars pollute far
                                                                                                                                        more than public transit and increase a traveler’s carbon footprint.11
           PERSON WITH COVID-19                   HEALTHY PERSON   LIKELIHOOD OF TRANSMISSION

                                  Both wearing                                                                                        DEATHS PER 1 BILLION PASSENGER MILES
                                    face mask,
                                     less than
                                   6 feet apart
                                                                            Low
                                                                                                                                        Car                                                             6.53
         Source: Based on infographic prepared by Washington State Department of Health
                                                                                                                                       Train                 0.36
                                                                                                                                                                             Cars are, by far, the
                                                                                                                                     Subway                  0.33            most dangerous form of
                                                                                                                                                                             transportation, with a per
      4 .	 There are several possible explanations for the lack of correlation
                                                                                                                                                                             passenger mile death rate
           between the increase in public transit ridership and increasing
           COVID-19 cases.                                                                                                              Bus                 0.20             about 20 times that of public
                                                                                                                                                                             transit. Source: “Passenger
         • Public transit riders generally talk little while using public transit.                                                                                           Deaths by Mode 2000-2014,”
           Scientists have linked many clusters to bars, indoor restaurants,                                                           Plane              0.02               APTA.
           and houses of worship where loud talking and singing may occur.

         • On many urban public transit systems, air flow is enhanced, com-
           pared to other indoor locations, as ventilation systems run effi-
           ciently and doors frequently open and close.5
                                                                                                                                   While the evidence indicates that the probability of transmission on pub-
         • Time spent exposed to an infected person impacts the likelihood
                                                                                                                                   lic transit is low, public transit agencies can take steps towards further
           of infection.6 Many intraurban trips are of relatively short dura-
                                                                                                                                   reducing the risk of transmission. This report includes practices that have
           tion.                                                                                                                   been implemented by public transit agencies across the globe and found
                                                                                                                                   to be to be the most actionable, impactful, and financially feasible for
                                                                                                                                   public transit agencies.
                                                                                                The New York City subway
                                                                                                systems exchanges its air 18
                                                                                                times/hour, well above the
                                                                                                recommended flow rate for
                                                                                                many other indoor settings.
                                                                                                (Image source:
                                                                                                The New York Times)

8   PUBLIC TR ANSIT AND COVID-19 PANDEMIC: GLOB A L RESE A RCH A ND BES T PR AC T ICES                                         EXECUTIVE SUMMARY                                                                 9
Public Transit and COVID-19 Pandemic: Global Research and Best Practices SEPTEMBER 2020
Introduction
       With the onset of the global COVID-19 pandemic in early 2020, mobility
       plummeted as governments issued stay-at-home orders and most peo-
                                                                                   “They [transit            As outbreaks in various parts of the world have been brought under
                                                                                                             control and restrictions relaxed, populations have begun local travel
       ple, with the exception of essential workers, avoided any non-essential      operators] are           again. However, the recovery of transit is lagging as vehicle traffic is
       travel. This abrupt pause in activity was experienced around the world,
       with transit service disproportionately affected. Ridership in many plac-
                                                                                    heroes, moving           returning to pre-pandemic levels in some places. A large portion of
                                                                                                             travelers’ fear of riding transit is based on unsubstantiated perceptions
       es dropped by 90% or more, as many commuters began working from              heroes. We're            regarding the safety of transit vehicles and risk of infection. Whether
       home, unemployment grew, and both leisure and business travel almost
       entirely stopped.
                                                                                    moving the               or not these fears are warranted was the impetus for this report, which
                                                                                                             critically and objectively examines the risks associated with transit and
                                                                                    essential workers        how agencies have responded.
       In response to the crisis, transit providers were forced to quickly adapt
       to new and rapidly evolving conditions. Many cut services due to the
                                                                                    who are fighting         This document compiles the latest scientific understanding of COVID-19
       drop in ridership but continued operations for the critical purpose of       this crisis.”            transmission and, specifically, the correlation between transmission and
       transporting essential workers and those making essential trips. Very                                 transit, as well as the salutary and often innovative response of transit
       rapidly, transit providers have adapted by increasing cleaning proce-        Sarah Feinberg,          agencies around the world. To inform our work, extensive research was
       dures, issuing new regulations for riders (such as mask mandates), and       Interim MTA New York     conducted on the most recent and comprehensive information coming
       implementing various worker protections, all while revenue plummeted         City Transit President   from scientific publications, articles, and governmental institutions. To
       due to the loss of farebox revenue. In addition, agencies adjusted ser-                               further examine the link between transit and COVID-19 rates, we ana-
       vice to meet new demand patterns and as a means to reduce crowding.                                   lyzed data from several domestic cities and compared the change in
                                                                                                             case rates to the change in transit ridership over several months.
       Please refer to APTA’s Heroes Moving Heroes web page for stories
       and examples honoring public transit workers’ work during COVID-19.                                   An extensive review of both successful virus mitigation strategies and
                                                                                                             transit agency actions allowed us to identify a set of global best prac-
                                                                                                             tices, highlighting those methods that seem to be most effective at pro-
                                                                                                             tecting the health of both riders and operators. Finally, extensive inter-
                                                                                                             views with leading public health experts added further insight into how
                                                                                                             transit agencies can best utilize their resources to mitigate virus risks.

                                                                                                             Several global cities have maintained or increased ridership while keep-
                                                                                                             ing transmission rates low. To date, no known outbreaks have been
                                                                                                             traced to public transit. This document serves as a reference guide for
                                                                                                             transit operators on measures that could be implemented to achieve
                                                                                                             similar success.

10   PUBLIC TR ANSIT AND COVID-19 PANDEMIC: GLOB A L RESE A RCH A ND BES T PR AC T ICES                                                                                                   11
Public Transit and COVID-19 Pandemic: Global Research and Best Practices SEPTEMBER 2020
COVID-19 Transmission

                                                                                                KEY TAKEAWAYS:
                                                                                                 Î Knowledge surrounding COVID-19 is an evolving science. At the time of this publication, transmis-
                                                                                                   sion is thought to occur primarily through person-to-person spread via respiratory droplets (>5
                                                                                                   µm in diameter). Surface-to-person transmission, once thought to be a main source of infection, is
                                                                                                   now considered less likely although proper disinfection and handwashing procedures should still
                                                                                                   be followed.
                                                                                                 Î Increasing evidence indicates the virus may also be spread via aerosol transmission, in which
                                                                                                   smaller microdroplets (
Public Transit and COVID-19 Pandemic: Global Research and Best Practices SEPTEMBER 2020
MITIGATING TRANSMISSION                                                                                                                               COMMUNITY SPREAD
       How can transmission be reduced in a public transit setting?                                                                                          Reduce community infection rate to lessen all forms of
                                                                                                                                                             transmission
       While all public activities carry some associated risk, risks can be lowered by following public health
       guidelines.15 Measures taken by transit agencies are likely contributing to low infection rates on pub-                                               The United States Centers for Disease Control and Preven-
       lic transit, at least in part.16 These include mandating face coverings, modifying service, monitoring                                                tion (CDC) recommends several elements for transit agencies
       capacity, improving sanitation and ventilation protocols, and increasing communication of regula-                                                     looking to accommodate current and returning riders.18 The
       tions to passengers. It has been understood since the onset of the pandemic that physical distanc-                                                    foremost consideration is the level of community spread; this
       ing and sanitation efforts could help mitigate transmission risks. There is increasing consensus that                                                 can be quantified in numerous ways, with many state agencies
       fomites, or particles on surfaces, are not a main source of transmission, although cleaning and disin-                                                and institutions opting to measure the pandemic’s impact by
       fecting protocol do reduce risk. In an interview with Scientific American, Dr. Melissa Perry, a leading                                               the growth rate of positive cases, hospitalizations, and deaths.
       epidemiologist and chair of the Department of Environmental and Occupational Health at George                                                         Transit agencies should coordinate with local public health au-
       Washington University’s Milken Institute School of Public Health, emphasized that mask wearing and                                                    thorities to assess the community risk.
       physical distancing take precedent over disinfecting surfaces.17 In the section below, we briefly cover
       all mitigation tactics but explore two critical interventions, face masks and ventilation, in most detail.
                                                                                                                                                             PHYSICAL DISTANCING
       For an expanded section on transmission and mitigating risk, please see Appendix A.
                                                                                                                                                             To reduce person-to-person transmission

          Transmission Type              Mitigation Strategies                                                                                               To lower the risk via droplet transmission, the CDC recommends
                                                                                                                                                             that individuals maintain a physical distance of at least six feet—
             COMMUNITY SPREAD            Lowering overall infection rate in an area via elimination methods such as::
                                                                                                                                                             although it should be noted that this metric was determined
                                          ‡    Robust testing and contact tracing                                                                            prior to the encouragement or mandate for mask wearing.19 The
                                          ‡    Isolation protocols                                                                                           World Health Organization (WHO) recommends a one meter,
                                          ‡    Mobility restrictions                                                                                         or about three feet, distance; similarly, a study on the effects
                                          ‡    Restricted entry (thermal scanning, COVID-19 screening, etc.)                                                 of physical distancing on COVID-19 transmission found the
                                                                                                                                                             transmission was lower with distances of three feet or more. 20, 21
                                                                                                                                                             Physical distancing may be less important in situations where
           RESPIRATORY DROPLETS          Reducing risk of contact with and spread of respiratory droplets
                                                                                                                                                             individuals are masked, not talking, together for a brief period
                                         via methods such as:
                                                                                                                                                             of time, and there is efficient ventilation, such as public transit.
                                          ‡ Covering of nose and mouth with a face mask or shield                                                            In these cases, less than six feet of physical distancing can be
                                          ‡ Physical distancing                                                                                              considered low risk. 22
                                          ‡ Ventilation, filtration, and air flow controls

                                                                                                                                                             FACE COVERINGS
           AEROSOL (DROPLET NUCLEI)      Reducing risk of contact with and spread of aerosols via methods such as:
                                                                                                                                                             To reduce person-to-person transmission via aerosols and
                                          ‡ Covering of nose and mouth with a face mask or, if available, respirators                                        droplets
                                            such as N95/KN95 masks
                                          ‡ Physical distancing                                                                                              The CDC recommends public transit riders wash hands or dis-
                                          ‡ Ventilation, filtration, and air flow controls                                                                   infect them with hand sanitizer before entering and when ex-
                                          ‡ Humidity controls                                                                                                iting transit, avoid touching surfaces and their nose, eyes, and
                                                                                                                                                             mouth, practice physical distancing, and wear face coverings. 23
              SURFACE (FOMITES)          Reducing the risk of contact with and spread of fomites via:                                                        If made and worn properly, face coverings can serve as a barrier
                                                                                                                                                             to droplets and aerosols expelled from the wearer into the air
                                          ‡ Covering of nose and mouth with a face mask or shield                                                            and environment. 24
                                          ‡ Cleaning and disinfection of surfaces
                                          ‡ Hand washing/sterilization

14   PUBLIC TR ANSIT AND COVID-19 PANDEMIC: GLOB A L RESE A RCH A ND BES T PR AC T ICES                                 PART I: TR ANSIT US AGE AND COVID-19 INFEC TION R ATES                                                      15
Public Transit and COVID-19 Pandemic: Global Research and Best Practices SEPTEMBER 2020
PERSON WITH COVID-19                          HEALTHY PERSON      LIKELIHOOD OF TRANSMISSION

                                                                                                                            Neither person
                                                                                                                          wearing face mask,
                                                                                                                         less than 6 feet apart
                                                                                                                                                                          Very High

                                                                                                                          Only healthy person
                                                                                                                          wearing face mask,                                   High
                                                                                                                         less than 6 feet apart

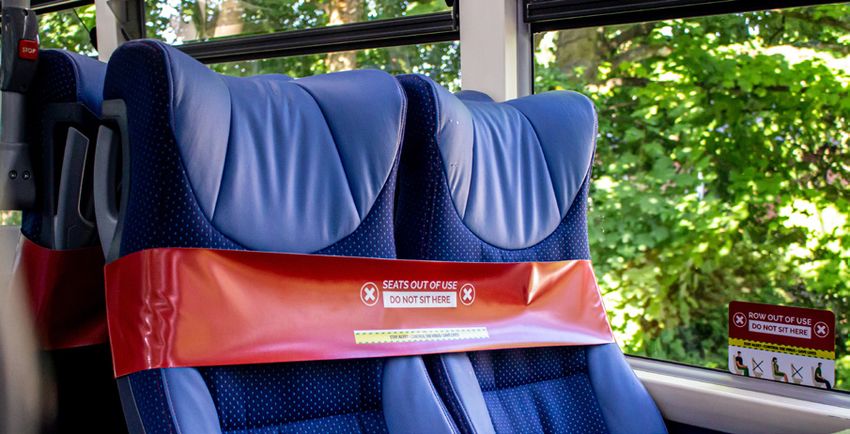
         WHY ARE MASKS IMPORTANT?
                                                                                                                              Only person
                                                                                                                             with COVID-19
                                                                                                                                                                            Medium
         Masks have been shown, both in past studies of infectious diseases and in the
         current COVID-19 pandemic, to be effective in preventing disease spread. All                                     wearing face mask,
         face coverings are effective at source control, helping keep others safe by                                     less than 6 feet apart
         blocking infectious particles from being exhaled, coughed, or sneezed into
         an environment. Mask wearing compliance is increasingly important with the
         growing evidence of asymptomatic carriers. In addition, some masks are also
         protective to the wearer, blocking infectious particles from being inhaled. In-
         creasing evidence is pointing to the importance of face coverings in preventing
                                                                                                                       Both wearing face mask,
         both droplet and aerosol transmission, even in indoor settings like public transit.

          Î Masks reduce the number of respiratory droplets emitted by blocking them. 25
                                                                                                                        less than 6 feet apart                                  Low
            This is considered source control: stopping the transmission of disease by
            blocking its source. Researchers have long known that masks can prevent
            people from spreading airborne germs, via both respiratory droplets and
            aerosols, to others. 26 In addition, “masks also decrease the risk that you’ll
            auto-inoculate [infect yourself by touching your mouth or nose],” states.
            Dr. Larry J. Anderson, Professor and Marcus Chair of Infectious Diseases at                                Both wearing face mask,
            Emory University. 27                                                                                       and at least 6 feet apart
          Î Some masks protect the wearer. Varieties of respirator masks known as
            N95/KN95 and N99 masks, named after their 95% and 99% efficiency, filter
                                                                                                                                                                           Very Low
            aerosols so they are not inhaled.
          Î Increasing evidence suggests that even non-respirator masks (such as cotton
            face coverings) may also provide protection from the virus, either by lessen-
            ing the severity of symptoms or completely preventing transmission. 28, 29
          Î Increasing evidence suggests that individuals can spread the virus while

                                                                                                                                                                           Virtually
            either asymptomatic or pre-symptomatic, indicating the importance of mask
            mandates in public settings. 30                                                                                     Staying
          Î Leading scientists emphasize that mask wearing may be the most important
            way to reduce the transmission of COVID-19. Dr. Larry J. Anderson empha-
            sizes that wearing a mask may be the “one thing that can actually make a
                                                                                                                                 Home
                                                                                                                                                                             None
            difference” in reducing virus spread. 31

                                                                                                   Source: Based on infographic prepared by Washington State Department of Health

16   PUBLIC TR ANSIT AND COVID-19 PANDEMIC: GLOB A L RESE A RCH A ND BES T PR AC T ICES        PART I: TR ANSIT US AGE AND COVID-19 INFEC TION R ATES                                               17
Public Transit and COVID-19 Pandemic: Global Research and Best Practices SEPTEMBER 2020
Examples where masks may have limited COVID-19 transmission:                                  Comparison of COVID-19 case counts over time in South Korea (with large-scale mask
                                                                                                     distribution) and Italy (without large-scale mask distribution). Source: Reshama Shaikh via
       Although research on the COVID-19 is an emergent science, several case studies                https://www.fast.ai/2020/04/13/masks-summary/
       are highlighted here that illustrate how masks are preventing the virus spread.

        • A study by doctors at the University of Oxford found that in every country that
          encouraged or mandated mask compliance, case and death rates have fallen.32
          For example, both Austria and Czechia (geographical neighbors) had similar case
          rates at the onset of the pandemic. Czechia was first to initiate a mask mandate,
          and first to see cases flatten. Austria experienced a large spike, which only began
          to decline after their own mask requirements. Similarly, South Korea and Italy
          had comparable case growth early in the pandemic; South Korea’s rate stabilized
          shortly after mask distribution by the government, while Italy’s rate shot upwards.

          Comparison of COVID-19 case counts over time in Czechia (with early mask mandates)
          and Austria (with later mask mandates). Source: Reshama Shaikh via https://www.fast.
          ai/2020/04/13/masks-summary/

                                                                                                      • In one case study involving transportation (intercity bus), a symptomatic pas-
                                                                                                        senger rode a bus with 39 others for two hours without a mask, and infected
                                                                                                        five people; the passenger put on a face mask before boarding his second bus,
                                                                                                        a 50-minute ride on a minibus with 14 other passengers, and infected no one.33

                                                                                                      • In another case study, two infected hair stylists saw 139 clients over the course
                                                                                                        of a week. However, both the stylists and the customers were required to wear
                                                                                                        masks, and no subsequent spreading was reported.34

                                                                                                      • A study of secondary transmission in an indoor household space found face
                                                                                                        masks were 79% effective in preventing transmission, if used by all household
                                                                                                        members prior to onset of symptoms.35

                                                                                                      • An analysis of 196 countries found that by May 9, 2020, places where masks
                                                                                                        weren’t recommended saw a 62.1% weekly increase in coronavirus deaths per
                                                                                                        capita, compared with a 15.8% growth in countries with cultures or guidelines
                                                                                                        supporting mask-wearing.36 Another study found that mask mandates in 15
                                                                                                        American states and Washington, DC led to a slowdown in the daily COVID-19
                                                                                                        growth rate.37 Mask use is higher in the Northeast and parts of the West, and
                                                                                                        lower in the Plains and the South—areas that are, at the time of publication,
                                                                                                        experiencing higher case rates.38

18   PUBLIC TR ANSIT AND COVID-19 PANDEMIC: GLOB A L RESE A RCH A ND BES T PR AC T ICES          PART I: TR ANSIT US AGE AND COVID-19 INFEC TION R ATES                                            19
VENTIL ATION, FILTR ATION, AND AIR FLOW                                                                                    CLEANING
            To reduce person-to-person transmission via aerosols                                                                       To reduce surface-to-person transmission

            Ventilation and clean air are key interventions in creating a safer en-                                                    Cleaning and disinfecting of surfaces and hands were rapidly adopted
            vironment. Both the CDC and American Society of Heating, Refriger-                                                         both by transit agencies and individuals. Although there is increasing
            ating and Air-Conditioning Engineers (ASHRAE), the world’s leading                                                         consensus that person-to-person spread, rather than surface-to-person
            authority on indoor environment control and ventilation, recommend                                                         transmission, is the main source of transmission, cleaning and disin-
            increasing outdoor air ventilation, increasing humidity, assessing the                                                     fecting are important actions for public transit agencies for both safety
            air circulation, and increasing filtration to prevent the risk of COVID-19                                                 and restoring public confidence.41 Clinical Professor of Epidemiology at
            airborne transmission. 39 Air circulating through subway cars and bus-                                                     New York University School of Global Public Health, Dr. Robyn Gershon
            es is typically replaced with fresh air close to 18-times an hour, more                                                    states, “frequent cleaning helps increase confidence in the system.”42
            frequently than the 6-8 times recommended for restaurants, the 5-6                                                         While studies revealed the virus’s ability to survive on surfaces for up to
            times recommended for classrooms, and the 12 times recommended for                                                         nine days, these experiments may have been misleading due to unnatu-
            airborne isolation rooms in medical facilities.40                                                                          rally high viral load utilized in the lab setting, and lack of clarity on how
                                                                                                                                       much infection virus remained (for example, 0.1% of the virus was found
            Please refer to ASHRAE’s document Ventilation for Acceptable                                                               to exist on surfaces at the end of these time periods).43, 44
            Indoor Air Quality for more information.

                                                                                                                                       Please refer to APTA’s Guide for Safeguarding Riders and Employees
                                                                                                                                       for up-to-date recommendations on protecting riders and employees
                                                                                                                                       on transit, including recommendations for physical distancing, face
                                                                                                                                       covering, ventilation, and filtration.

                                                                                                                                       Please refer to APTA’s white paper titled Cleaning and Disinfecting
                                                                                                                                       Guidance During a Contagious Virus Pandemic for recommendations
                                                                                                                                       on cleaning and disinfecting transit vehicles.

                                                                                                                                       Please refer to Appendix A: COVID-19 Transmission (Expanded) for
                                                                                                                                       additional details on transmission and mitigation.

20 P U B L I C T R A N S I T A N D C O V I D - 1 9 P A N D E M I C : G L O B A L R E S E A R C H A N D B E S T P R A C T I C E S   PART I: TR ANSIT US AGE AND COVID-19 INFEC TION R ATES                              21
No Clear Link between Transmission and Transit
                                                                                                                      While trains and buses are enclosed, ventilation occurs either by air fil-
                                                                                                                      tration, open windows, or opening and closing of doors at stations. For
                                                                                                                                                                                                      “We were always
         KEY TAKEAWAYS:                                                                                               example, transit officials in New York City state that filtered air circulat-    worried about our
          Î While research on the COVID-19 transmission on public transit is limited due to both the recent-          ing through subway cars is replaced with fresh air close to 18-times an
                                                                                                                      hour, more frequently than the rate recommended for restaurants and
                                                                                                                                                                                                       TB patients on the
            ness of the outbreak and lack of rigorous contact tracing in many parts of the world, our research
            as of mid-August 2020 found no outbreaks of COVID-19 cases clearly linked to intracity public             many other public indoor settings. 52 Additionally, the brevity of expo-         subway, but we
            transit such as city buses and subways.
          Î Of the cases traced to transportation, the main sources have been tour buses, planes, and cruise
                                                                                                                      sure may help reduce risk as riders tend to not stay on transit for as long
                                                                                                                      as passengers of planes and cruises. 53
                                                                                                                                                                                                       didn’t document
            ships—modes where passengers sit for extended periods of time with the same cohort of fellow
            passengers. These modes do not closely resemble either the operational or behavioral patterns of
                                                                                                                                                                                                       any cases.”
            public transit options.                                                                                   Stay-at-home orders, work-from-home mandates, and limitation of trav-
                                                                                                                      el have drastically affected public transit usage in many American cities.       Dr. William N. Rom,
          Î Even in large cities where transit usage has begun to recover closer to pre-pandemic levels, no                                                                                            NYU Grossman
            outbreaks have been traced to the increased ridership. In those areas, mask use is customary,             Some places, such as New York City, which typically has an average of
                                                                                                                      5.5 million daily subway riders, experienced ridership rates as low as 92%       School of Medicine
            mandatory, or widespread.
                                                                                                                      below normal in March (by August, ridership remained about 75% be-
          Î Indoor dining, bar settings, poorly ventilated office spaces, and gyms are proving to be more risky
            environments for disease transmission than public transit.                                                low pre-pandemic levels). 54 The early response of some global cities has
                                                                                                                      been well-documented, and success attributed to quick and aggressive
                                                                                                                      intervention measures such as physical distancing and isolation. 55 More
                                                                                                                      recently, with the increased understanding of how the virus is transmit-
       Researchers and media, without much evidence, were quick to point                                              ted, success may be in part related to mask compliance. 56 In places such
       to transit as a major cause of the virus’ spread. Later research shows                                         as Seoul, Tokyo, and Hong Kong, cases have not been traced to public
       otherwise. Within a month of the outbreak in the United States some                                            transit, ridership has fallen less drastically, and service levels remained
       researchers and the media were proclaiming that transit, specifically                                          high. Dr. Gurumurthy Ramachandran, Director of the Johns Hopkins
       the New York City subway, was the cause. At that time the American                                             Education and Research Center for Occupational Safety and Health at
       COVID-19 outbreak was largely concentrated in transit-rich New York               “The public                  Johns Hopkins Bloomberg School of Public Health, agrees that "from
       City. Since then, the disease has spread to nearly every corner of the
       country and is widespread in many communities where transit ridership
                                                                                          perceptions and             what has been seen in East Asia, mask wearing on transit, even without
                                                                                                                      what we consider adequate physical distancing, has been effective in
       is low or service non-existent.                                                    press coverage              reducing the spread of COVID-19."57 In other places that experienced

       Public transit has some characteristics associated with higher COVID-19
                                                                                          of COVID-19                 large initial outbreaks, such as Milan, Vienna, and New York City, city-
                                                                                                                      wide measures curtailed the spread of the virus and an increase of riders
       transmission risk, including the potential for crowding in enclosed en-            transmission risk in        to transit systems has not led to subsequent case spikes.
       vironments on trains, buses and indoor stations. While public health
       and transit officials need to work together to manage that risk, avail-
                                                                                          transit has created         Large outbreaks have been traced to settings other than public transit.
       able evidence indicates that transit is not as inherently risky as some            more fear than is           Settings that seem to have high transmission rates tend to be indoors,
       people believe. According to Dr. Thomas Matte, Senior Science Advi-
       sor for Environmental Health at Vital Strategies, a global public health
                                                                                          warranted by the            with poor ventilation, and high rates of talking or singing. These envi-
                                                                                                                      ronments can be very unlike successful transportation systems, which
       organization, “the public perceptions and press coverage of COVID-19               evidence.”                  have good ventilation, little to no talking, anti-crowding measures, and
       transmission risk in transit has created more fear than is warranted by                                        mask mandates. Dr. Thomas Matte added that "prior to COVID-19, mod-
       the evidence."45 Growing consensus is that this may be due to several               Dr. Thomas Matte,          eling studies to look at community influenza transmission suggested
       factors: less crowding than pre-pandemic times, face mask compliance,               Vital Strategies           that transit accounted for a non-trivial but relatively small share of
       the high refresh rate of airflow on buses and train cars, and hygiene                                          transmission.”58 Instead, “spreading is from interactions where people
       efforts of both riders and transit agencies.46, 47, 48, 49 A systematic review                                 are close together, talking or singing, and are unmasked." Dr. William N.         Please refer to
       of available literature and news articles on transmission by epidemiol-                                        Rom, a research professor at New York University Grossman School of               Appendix B: Studies
       ogists at the London School of Hygiene found only one case linking                                             Medicine, echoed this sentiment: “this question of transmission on the            looking for Links
       transmission to transport, which occurred on a longer, intercity bus                                           subways came up during the TB and multi-drug resistant TB epidemic                Between Transit
       ride. 50 The results of this study have been compiled in a frequently up-                                      in the 1990s. We found that transmission was person-to-person with                and Transmission
       dated and publicly accessible database. At the time of this publication,                                       someone living with the infected case patient. We were always worried             for further
       no cases of virus transmission events have been traced to public transit                                       about our TB patients on the subway, but we didn’t document any cas-              information on
       services such as commuter buses, trains, and subways. According to a                                           es.”59 Additionally, it seems what individuals do at their trip ends has          studies examining
       survey of transportation agencies conducted by The New York Times in                                           more impact. Many people who have traveled by car or transit over the             transmission and
       early August, there have been no notable super spreader events linked                                          past few months are essential workers, and both groups had higher case            transit.
       to public transit. 51                                                                                          rates than those who did not travel.60 61

22   PUBLIC TR ANSIT AND COVID-19 PANDEMIC: GLOB A L RESE A RCH A ND BES T PR AC T ICES                           PART I: TR ANSIT US AGE AND COVID-19 INFEC TION R ATES                                                      23
Analysis of Transit Ridership and                                                                                 New York, New York:
       Infection Rates                                                                                                   Approximately 55% of the New York City population relies on public
                                                                                                                         transit for commuting to work.64 Early claims linking the New York City
       As of August 2020, no outbreaks have been traced to public transit in                                             subway system, operated by the Metropolitan Transportation Authority
       the United States. Based on our data review of case rates and transit                                             (MTA), to coronavirus infections were largely discredited.65, 66, 67 In ear-
       usage in domestic cities, the correlation between infection rates and                                             ly June 2020, the average case rate per capita for the top ten transit
       transit usage is weak or non-existent. Rather, COVID-19 rates appear                                              usage zones (omitting Manhattan, where many residents departed the
       to be independent of ridership: in Northeast cities such as Hartford,                                             city according to a New York Times analysis of cell phone data and mail
       Connecticut and New York, New York where the pandemic has been                                                    forwarding addresses) was found to be 32% lower than the rate among
       largely controlled, ridership has grown since peak pandemic low points,                                           the ten lowest.68, 69 A survey in early May of 1,300 patients admitted into
       but case rates have been significantly reduced. Meanwhile, in Southern,                                           New York City hospitals for the virus showed just 4% had recently used
       Southwestern, and Midwestern cities, ridership has remained consistent                                            transit. In addition, the suburbs around New York City, with lower transit
       while cases have skyrocketed. These areas are experiencing serious                                                usage, have experienced higher case rates than New York City.70
       community outbreaks primarily attributed by public health experts to
       the reopening of bars and restaurants, large gatherings, nursing homes,                                           Ridership on both the subways and buses took major hits in March and
       prisons, and community fatigue of physical distancing practices.62 In                                             April as case counts skyrocketed and public transit use was discour-
       fact, of the fifteen metro areas with the highest cumulative case rates                                           aged. However, in the time since, cases have fallen dramatically but rid-
       as of August 2020, not one had a typical commuter transit share more                                              ership has begun a slow recovery. In April, ridership on subways was 8%
       than 5%, and most have minimal transit services with very light usage.63                                          of normal levels; in the first half of August, ridership hovered near 23%.
                                                                                                                         Buses fared slightly better, growing from April’s nadir of 16% to over
                                                                                                                         55% in mid-August. As of this writing in August 2020, approximately 2.5
       United States metro areas with highest COVID-19 case rates through August
                                                                                                                         million rides are taken daily on the city’s buses and subways. Between
       2020—nearly all have typical commuter transit shares below 1%.
                                                                                                                         the beginning of the phased reopening in early June and mid-August,
                                                                                                                         the MTA subways served over 76 million riders and buses served close
                                                   METRO AREA          TOTAL       CASES PER 1,000    METRO AREA
          RANK      METRO OR MICRO AREA                                                                                  to 79 million riders. During that same period (June 1 to August 18) the
                                                   POPULATION          CASES       (AS OF 8/24/20)   TRANSIT SHARE
                                                                                                                         number of daily cases in New York City dropped from an average of over
            1       Gallup, NM                        71,367           4,157            58.2             0.8%            600 to approximately 250; meanwhile, the test positivity rate dropped
            2       El Centro, CA                    181,215           10,393           57.4             0.8%            from 3.3% to 1.0%. Hospitalizations per day also declined, down to 35
                                                                                                                         on August 18 from the peak of over 1,700 in spring.71 In New York City,
            3       Yuma, AZ                         213,787           12,072           56.5             1.9%            case counts and public transit usage are seen to be inversely related.
            4       Eagle Pass, TX                    58,722            3,117           53.1             0.0%
            5       Show Low, AZ                     110,924           5,496            49.5             0.9%
                                                                                                                         New York City, NY: Comparison of COVID-19 case counts with MTA subway ridership
            6       Rio Grande City, TX              64,633            2,973            46.0             0.4%
            7       Marion, OH                       65,093            2,978            45.7             0.8%                               6,000                                                               5,000,000
                                                                                                                                                                                                                                               Transit Ridership:
            8       Yakima, WA                       250,873           11,476           45.7             0.5%                                                                                                   4,500,000                      7-day Rolling Average
                                                                                                                                            5,000                                                               4,000,000

                                                                                                                                                                                                                            MTA Subway Trips
            9       Brownsville-Harlingen, TX        423,163           19,225           45.4             0.6%                                                                                                                                  Case Count:

                                                                                                                           COVID-19 Cases
                                                                                                                                            4,000                                                               3,500,000                      7-Day Rolling Average
            10      Lake City, FL                     71,686           3,226            45.0             0.0%                                                                                                   3,000,000                      (New York City, NY
                                                                                                                                                                                                                                               residents only)
            11      Corpus Christi, TX               452,534           19,468           43.0             0.8%                               3,000                                                               2,500,000
                                                                                                                                                                                                                2,000,000
            12      Miami, FL                       6,198,782         262,738           42.6             3.5%                               2,000                                                               1,500,000
            13      Palestine, TX                     57,735           2,425            42.0             0.2%                                                                                                   1,000,000
                                                                                                                                            1,000
            14      Sioux City, IA                   169,878           6,823            40.2             0.4%                                                                                                   500,000
                                                                                                                                               0                                                                0
            15      Huntsville, TX                    87,622           3,489            39.8             0.6%
                                                                                                                                            3/01/2020   4/01/2020 5/01/2020   6/01/2020 7/01/2020   8/01/2020
       Source: The New York Times,https://www.nytimes.com/interactive/2020/04/23/
       upshot/five-ways-to-monitor-coronavirus-outbreak-us.html                                                          Data source: MTA, NYC Department of Health
       US Census Bureau, ACS 5-Year Estimate 2012-2018: Table B0141

24   PUBLIC TR ANSIT AND COVID-19 PANDEMIC: GLOB A L RESE A RCH A ND BES T PR AC T ICES                              PART I: TR ANSIT US AGE AND COVID-19 INFEC TION R ATES                                                                                            25
Greater Hartford Area, Connecticut:
       New York City, NY: Comparison of COVID-19 case counts with MTA bus ridership
                                                                                                                                                      The CTfastrak bus rapid transit (BRT) system partially utilizes a bus-on-
                          6,000                                                               2,000,000                                               ly roadway and serves riders in the Greater Hartford Area: Waterbury,
                                                                                                                          Transit Ridership:
                                                                                              1,800,000                   7-day Rolling Average
                                                                                                                                                      Cheshire, Southington, Bristol, Plainville, New Britain, Newington, West
                          5,000                                                               1,600,000                                               Hartford, Hartford and Manchester. Approximately 4% of Hartford Coun-
                                                                                                                          Case Count:
         COVID-19 Cases

                                                                                                          MTA Bus Trips
                                                                                              1,400,000                   7-Day Rolling Average       ty residents rely on public transit for commuting to work.72 Since March,
                          4,000
                                                                                              1,200,000                   (New York City, NY          transit ridership has remained consistent although has begun to recover
                                                                                                                          residents only)
                          3,000                                                               1,000,000                                               with the reopening. Connecticut began its phased reopening on May
                                                                                              800,000                                                 20, 2020 and has continued to slowly reopen in the subsequent weeks,
                          2,000                                                               600,000                                                 although is temporarily postponing its third phase of reopening.73, 74
                          1,000                                                               400,000                                                 Meanwhile, COVID-19 cases have dropped. On August 6, Connecticut
                                                                                              200,000                                                 reported its third consecutive date without a coronavirus-related death,
                             0                                                                0
                                                                                                                                                      and a record low daily positive rate of 0.2%.75
                          3/01/2020   4/01/2020 5/01/2020   6/01/2020 7/01/2020   8/01/2020
                                                                                                                                                      Greater Hartford Area, CT: Comparison of COVID-19 case counts with CTfastrak
       Data source: MTA, NYC Department of Health                                                                                                     ridership

                                                                                                                                                                          180                                                       12,000
                                                                                                                                                                                                                                                                       Transit Ridership:

                                                                                                                                                                                                                                             CTfastrak Bus Ridership
       Strategies employed by local transit agencies:                                                                                                                     160                                                                                          7-day Rolling Average
                                                                                                                                                                                                                                    10,000
                                                                                                                                                                          140                                                                                          Case Count:

                                                                                                                                                        COVID-19 Cases
        • Maintained regular weekday schedule of subways and buses, with                                                                                                                                                                                               7-Day Rolling Average
                                                                                                                                                                          120                                                       8,000
          some increase in service (Staten Island Railway), to avoid crowding                                                                                                                                                                                          (Bristol, Cheshire,
        • Nightly closures of subways from 1 AM to 5 AM for sanitization; en-                                                                                             100                                                                                          Hartford, Manchester,
                                                                                                                                                                                                                                    6,000                              New Britain, Newington,
          hanced bus service during these hours                                                                                                                           80                                                                                           Plainville, Southington,
        • Frequent disinfecting of high touch surfaces                                                                                                                    60                                                        4,000                              Waterbury, and West
                                                                                                                                                                                                                                                                       Hartford, CT residents
        • Daily sanitization of all railcars and buses                                                                                                                    40                                                                                           only)
        • Piloting of UV light disinfectant technology                                                                                                                                                                              2,000
                                                                                                                                                                          20
        • Face covering mandate; free masks and hand sanitizer supplied in
                                                                                                                                                                           0                                                        0
          select stations
        • Personal Protective Equipment (PPE) supplied to transit workers                                                                                                3/30/2020   4/30/2020   5/30/2020   6/30/2020
        • Physical distancing and wayfinding markers on platforms
        • Safety Ambassadors employed in stations
        • Expedited rollout of contactless payment options                                                                                            Data Sources: CTfastrak, CT Department of Public Health COVID-19 data for Water-
                                                                                                                                                      bury, Cheshire, Southington, Bristol, Plainville, New Britain, Newington, West Hart-
                                                                                                                                                      ford, Hartford and Manchester

                                                                                                                                                       Strategies employed by local transit agencies:

                                                                                                                                                       •    Rear door entry only on buses
                                                                                                                                                       •    Barrier partitions between drivers and passengers
                                                                                                                                                       •    Daily sanitization of buses and frequent sanitization of high touch surfaces
                                                                                                                                                       •    Face covering mandate, distribution of free masks to riders

26   PUBLIC TR ANSIT AND COVID-19 PANDEMIC: GLOB A L RESE A RCH A ND BES T PR AC T ICES                                                           PART I: TR ANSIT US AGE AND COVID-19 INFEC TION R ATES                                                                                          27
Bay Area, California:                                                                                                                 Greater Salt Lake City, Utah

       The Bay Area’s Bay Area Rapid Transit (BART) connects San Francisco with Berke-                                                       Utah Transit Authority's (UTA) fleet of more than 400 buses provides riders with
       ley, Oakland, Fremont, Walnut Creek, Dublin/Pleasanton and other cities in the                                                        access to Box Elder, Weber, Davis, Tooele, Salt Lake, Summit, and Utah counties. 80
       East Bay. Approximately 34% of San Francisco county residents rely on public                                                          Additionally, UTA operates the Transit Express (TRAX) light rail system. 81 Approxi-
       transit for commuting to work.76 BART began reducing service on March 19, 2020                                                        mately 3% of residents in the counties served by UTA rely on public transit for com-
       and operating with limited hours beginning March 23.77 Service in some areas was                                                      muting to work. 82 UTA temporarily reduced service on April 5, 2020 in response to
       increased from peak pandemic lows beginning June 8.                                                                                   low ridership numbers, temporally suspending, increasing headways, and cutting
                                                                                                                                             operational hours on certain lines. 83
       Despite initial success in stemming the spread of COVID-19 in the early phases of
       the pandemic, attributed in part to the early and aggressive stay-at-home response                                                    While the Salt Lake area initially had low case counts along with most of the West,
       by the city’s mayor, San Francisco and the Bay Area experienced a surge of cas-                                                       transit ridership declined in the early phases of the pandemic and has remained
       es beginning in June. Transit ridership remained consistent after an initial drop in                                                  at a relatively steady, lower rate; however, cases surged since May, and through
       March, showing no correlation to the outbreak.                                                                                        June and July. Some outbreaks are being traced to overcrowded meatpacking
                                                                                                                                             plants. 84 The state has not limited indoor dining and gatherings can be as many
       Large portions of the outbreak are occurring in nursing homes and prisons; Gover-                                                     as 20 people, as of this publication. 85 Additionally, the state only recently granted
       nor Gavin Newsom has attributed many of the clusters to large family gatherings                                                       local governments the power to issue mask mandates, after delaying a state-wide
       and holiday parties.78, 79                                                                                                            measure and despite the urging of science authorities. 86

       Bay Area, CA: Comparison of COVID-19 case counts with BART ridership                                                                  Greater Salt Lake City, UT: Comparison of COVID-19 case counts with UTA ridership

                           70                                                     250,000                                                                        350                                                        70,000                   Transit Ridership:
                                                                                                                 Transit Ridership:
                                                                                                                 7-day Rolling Average                                                                                                               7-day Rolling Average
                           60                                                                                                                                    300                                                        60,000                   (Utah Transit Authority

                                                                                            BART Station Exits
                                                                                  200,000                        Case Count:                                                                                                                         [UTA] bus, light rail, and

                                                                                                                                               COVID-19 Cases
         COVID-19 Cases

                                                                                                                                                                 250                                                        50,000

                                                                                                                                                                                                                                     UTA Ridership
                           50                                                                                    7-Day Rolling Average                                                                                                               commuter rail)
                                                                                                                 (San Francisco, CA
                           40                                                     150,000                                                                        200                                                        40,000                   Case Count:
                                                                                                                 re sidents only)
                                                                                                                                                                                                                                                     7-Day Rolling Average
                           30                                                                                                                                    150                                                        30,000                   (Salt Lake County, UT
                                                                                  100,000                                                                                                                                                            residents only)
                           20                                                                                                                                    100                                                        20,000
                                                                                  50,000
                           10                                                                                                                                    50                                                         10,000

                            0                                                     0                                                                               0                                                         0

                          3/13/2020   4/13/2020   5/13/2020       6/13/2020                                                                                     3/19/2020   4/19/2020   5/19/2020   6/19/2020   7/19/2020

       Data sources: Bay Area Rapid Transit, San Francisco Department of Public Health COVID-19 data                                         Data Sources: Utah Transit Authority, Salt Lake County Health Department COVID-19 data for
       for City of San Francisco                                                                                                             Salt Lake County

       Strategies employed by local transit agencies:                                                                                        Strategies employed by local transit agencies:
        •    Daily disinfection of railcars, wiping down of high-touch points, and fumigation                                                 •    Face covering mandate
        •    Running of longer trains to allow more distancing                                                                                •    Daily sanitization of all vehicles and high-touch surfaces
        •    Increased train frequency                                                                                                        •    Complimentary face masks to those who request them
        •    Piloting new seat configuration to allow more distancing                                                                         •    Rear entry boarding; visual inspection of entry passes only
        •    Face covering mandate                                                                                                            •    Plexiglass barriers between operators and passengers employed on some buses
        •    Visual indicators for physical distancing and media campaign to inform riders                                                    •    Adjusted service to meet changes in demand and reduce crowding
             of regulations
        •    Hand sanitizer at every station
        •    Personal hand straps supplied to all riders, to avoid touching potentially con-
             taminated surfaces
        •    Piloting of UV light disinfection technology
        •    Testing of advanced filters
        •    Encouraging of staggered shifts to avoid crowding

28   PUBLIC TR ANSIT AND COVID-19 PANDEMIC: GLOB A L RESE A RCH A ND BES T PR AC T ICES                                                  PART I: TR ANSIT US AGE AND COVID-19 INFEC TION R ATES                                                                                   29
Columbus, Ohio                                                                                                                                           Austin, Texas

            The Central Ohio Transit Authority (COTA) services the Columbus metro-area. It                                                                           The Capital Metropolitan Transportation Authority (Capital Metro) operates bus, paratransit services,
            operates fixed-route buses, BRT, micro transit, and paratransit services, and typi-                                                                      and a commuter rail system in Austin and several suburbs, within Travis County, Texas. Approximate-
            cally serves 19 million passengers annually. 87 Approximately 2% of Franklin County                                                                      ly 4% of and Travis County residents rely on public transit for commuting to work.95 In response
            residents rely on public transit for commuting to work. 88 COTA reduced its service                                                                      to reduced ridership, and to accommodate physical distancing recommendations, Capital Metro
            in mid-April 2020, reducing the number of bus routes and consolidating service in                                                                        implemented temporary changes to its services.96 Service was reduced on weekdays to a Sunday
            some areas. 89                                                                                                                                           schedule for many lines, with the suspension of most express lines and fare collection. Service has
                                                                                                                                                                     since begun to increase on some lines to modified weekday schedules, and partial fare collection
            Columbus has recently seen a surge in cases beginning in early June. Meanwhile,                                                                          was reinstated beginning in June.
            ridership remained relatively constant from late April through June. In late July, Ohio
            saw its largest number of hospitalizations since the pandemic began. 90 Many of the                                                                      Despite initially having a low case rate, Austin experienced an outbreak in COVID-19 infections be-
            cases outbreaks have occurred among prisons, meatpacking plants, and residents                                                                           ginning in June, along with many other Southwestern cities. 97 In response, the City has recently
            between the ages of 20 and 40.91, 92, 93 Residents have been able to eat inside restau-                                                                  prohibited gatherings larger than 10 people, restricted businesses to 50% capacity, and mandated
            rants since May 21.94                                                                                                                                    face masks for most circumstances.98 Restaurants are still able to offer dine-in service at 75% capac-
                                                                                                                                                                     ity, although they are being prompted to keep a ledger of all diners for contact tracing purposes. 99
                                                                                                                                                                     Austin is having trouble tracing cases due to administrative limitations and rapidly growing cases
                                                                                                                                                                     and, on August 10, reported its highest positive test rate to date of 21%.100 101
            Columbus, OH: Comparison of COVID-19 case counts with COTA ridership
                                                                                                                                                                     However, while cases began to skyrocket, transit ridership remained steady from early April through
                                200                                                                        40,000                                                    June— indicating that transit ridership has likely not been a contributing source of infection.
                                                                                                                                         Transit Ridership:
                                180                                                                        35,000                        7-day Rolling Average

                                                                                                                    COTA Bus Ridership
                                160                                                                                                      Case Count:
                                                                                                           30,000
              COVID-19 Cases

                                140                                                                                                      7-Day Rolling Average       Austin, TX: Comparison of COVID-19 case counts with Capital Metro ridership
                                120                                                                        25,000                        (Franklin County,OH
                                                                                                                                         residents only)
                                100                                                                        20,000                                                                                                                                                                     Transit Ridership:
                                                                                                                                                                                         500                                                       60,000                             7-day Rolling Average
                                 80

                                                                                                                                                                                                                                                            Capital Metro Ridership
                                                                                                           15,000                                                                        450                                                                                          (Includes rail, and the
                                 60                                                                                                                                                      400                                                       50,000                             following bus routes:
                                                                                                           10,000

                                                                                                                                                                       COVID-19 Cases
                                 40                                                                                                                                                                                                                                                   local, CARTS Fixed
                                                                                                                                                                                         350                                                       40,000                             Route,CARTS Georgetown,
                                 20                                                                        5,000
                                                                                                                                                                                         300                                                                                          CARTS Hornsby Bend,
                                  0                                                                        0                                                                                                                                                                          UT Shuttle, Express,
                                                                                                                                                                                         250                                                       30,000                             CARTS Express, Metro
                               3/18/2020     4/18/2020             5/18/2020              6/18/2020                                                                                      200
                                                                                                                                                                                                                                                   20,000
                                                                                                                                                                                                                                                                                      Access, Innovative
                                                                                                                                                                                                                                                                                      Mobility, Rideshare,
                                                                                                                                                                                         150
                                                                                                                                                                                                                                                                                      and Rapid)
                                                                                                                                                                                         100                                                       10,000                             Case Count:
            Data sources: Central Ohio Transit Authority, City of Columbus Public Health data for Columbus                                                                                50                                                                                          7-Day Rolling Average
            City and Franklin County                                                                                                                                                       0                                                       0                                  (Travis County, TX
                                                                                                                                                                                                                                                                                      residents only)
                                                                                                                                                                                        3/21/2020   4/21/2020     5/21/2020          6/21/2020
            Strategies employed by local transit agencies:
                                                                                                                                                                     Data sources: Capital Metropolitan Transportation Authority, Texas Department of State Health Services,
             •    Adjusted services to meet changes in demand and to protect essential workers                                                                       for Travis County
             •    Rear entry boarding and suspension of fare collection
             •    Distribution of masks to all COTA operators
             •    Face covering mandate
             •    Daily sanitization and cleaning of vehicles and high-touch surfaces                                                                                Strategies employed by local transit agencies:

                                                                                                                                                                      • Encouragement of physical distancing and mandating masks for riders (mandated by State order
                                                                                                                                                                        on July 2, 2020)
                                                                                                                                                                      • Providing operators with face masks and gloves
                                                                                                                                                                      • Signage encouraging adherence to hygiene protocol (hand washing, covering nose and mouth
                                                                                                                                                                        when sneezing or coughing) and regulations (physical distancing, face masks)
                                                                                                                                                                      • Temporary suspension of fares and rear boarding only on buses; more recently installing plexiglass
                                                                                                                                                                        barriers and resuming fare collection

30 P U B L I C T R A N S I T A N D C O V I D - 1 9 P A N D E M I C : G L O B A L R E S E A R C H A N D B E S T P R A C T I C E S                                 PART I: TR ANSIT US AGE AND COVID-19 INFEC TION R ATES                                                                                         31
Quad Cities, Illinois                                                                                                                          Northern Kentucky

       Rock Island County Metropolitan Mass Transit District (MetroLINK) serves the                                                                   The Transit Authority of Northern Kentucky (TANK) is the public transit system serving Northern
       communities of Moline, Rock Island, East Moline, Silvis, Hampton, Carbon Cliff,                                                                Kentucky.108 Today, TANK operates more than 130 buses for the residents of the suburbs of Cincin-
       Colona, and Milan in the Illinois Quad Cities (across the Mississippi River from                                                               nati, Ohio located in Kenton County, Boone County, and Campbell County. Approximately 2% of res-
       Davenport, Iowa) with twelve fixed routes and sixty buses. Approximate 1% of                                                                   idents rely on public transit for commuting to work.109 TANK reduced service to a Sunday sched-
       residents in Rock Island and Henry counties in Illinois and the bordering Scott                                                                ule due to low ridership resulting from the pandemic in late March, with the additional suspension of
       county in Iowa rely on public transit for commuting to work.102 MetroLINK sus-                                                                 their shuttle service in early April.110 Beginning August 10, TANK resumed fare collection and front
       pended fare collection and front door boarding and suspended some routes                                                                       door boarding for all trips.111
       in mid-March.103 Some routes were restored in late June and fare collection
       resumed on July 6 as Illinois entered Phase 4 of its reopening. Effective August                                                               Despite low case rates earlier in the year, Kentucky experienced an outbreak of infections beginning
       10, 2020, Metro mandated face coverings on all buses.                                                                                          in July. In this same period, TANK ridership recovered only slightly, indicating that the trend in cases
                                                                                                                                                      may be reflective of the broader increase in cases statewide. As of August 24, the state had reached
       Cases surged in the counties served by MetroLINK in June even though rid-                                                                      43,899 total cases and a 4.77% positivity rate.112 In this same period, TANK ridership recovered
       ership remained mostly consistent, increasing only slightly. Additionally, the                                                                 only slightly, indicating that the trend in cases may be reflective of the broader increase in cases
       increasing number of cases reflect the broader trends of the state, which is                                                                   statewide. Although case rates are surging throughout the state at the time of this publication, the
       experiencing even higher case rates in other areas – as of August 14, 2020,                                                                    counties served by TANK have relatively low case rates. As of August 25, Kenton ranked 33rd, Boone
       Rock Island and Henry counties did not fall within the top 14 counties with the                                                                37th, and Campbell 58th out of Kentucky’s 120 counties for cases per capita. All three have seen
       highest case rates in Illinois; Scott County did not fall within the top 45 counties                                                           declining case counts compared to the previous two weeks.
       in Iowa.104, 105 As of early August the regions surrounding the Quad Cities are
       considered in stable condition, even though many other parts of the states are                                                                 The recent outbreak has been attributed in part to large gatherings, such as graduation parties,
       not.106 The spike in infection has been attributed to a hasty reopening, large                                                                 church services, and barbecues, and as of late August the state had 50 active cases within their K-12
       gatherings, and lack of mask and physical distancing compliance.107                                                                            school systems and 223 active cases at colleges and universities.113 114 Hasty reopening of high-risk
                                                                                                                                                      settings may also be contributing to the recent spike in cases: while Kentucky took early action,
                                                                                                                                                      shutting down non-essential businesses by mid-March, the state began its phased reopening in late
       Quad Cities, IL: Comparison of COVID-19 case counts with MetroLINK ridership
                                                                                                                                                      April despite rising case numbers.115 Bars and restaurants were permitted to open, including indoor
                                                                                                                                                      dining at a reduced capacity, on July 1, as were gatherings of up to 50 people. By the end of July,
                           50                                                         6,000                                                           state Governor Andy Bershear had reduced the number of people allowed in restaurants and closed
                                                                                                                        Transit Ridership:
                                                                                              MetroLINK Bus Ridership
                           45                                                                                           7-day Rolling Average         all bars for two weeks to stifle growing case numbers. State officials also recommended the delayed
                           40                                                         5,000
                                                                                                                        Case Count:                   opening of schools until the end of September.
         COVID-19 Cases

                           35                                                                                           7-Day Rolling Average
                                                                                      4,000
                                                                                                                        (Scott County, IA,
                           30
                                                                                                                        Rock Island County, IL,
                                                                                                                                                      Northern Kentucky: Comparison of COVID-19 case counts with TANK ridership
                           25                                                         3,000                             and Henry County, IL
                           20                                                                                           [Quad Cities]
                                                                                      2,000                             residents only)                                   60                                                             5,000
                           15                                                                                                                                                                                                                                         Transit Ridership:
                                                                                                                                                                                                                                         4,500                        7-day Rolling Average
                           10                                                                                                                                             50

                                                                                                                                                                                                                                                 TANK Bus Ridership
                                                                                      1,000                                                                                                                                              4,000                        Case Count:

                                                                                                                                                        COVID-19 Cases
                            5                                                                                                                                                                                                                                         7-Day Rolling Average
                                                                                                                                                                          40                                                             3,500
                            0                                                         0                                                                                                                                                                               (Boone County, Kenton
                                                                                                                                                                                                                                         3,000
                                                                                                                                                                                                                                                                      County, and Campbell
                          3/28/2020   4/28/2020        5/28/2020             6/28/2020                                                                                    30                                                             2,500                        County, KY residents
                                                                                                                                                                                                                                         2,000                        only)
                                                                                                                                                                          20                                                             1,500
       Data sources: Quad Cities Metro; Illinois Department of Public Health data for Rock Island,                                                                        10                                                             1,000
       and Henry counties, Iowa Department of Public Health data for Scott County; accessed via                                                                                                                                          500
       USAFacts.                                                                                                                                                           0                                                             0

       Strategies employed:                                                                                                                                              3/24/2020   4/24/2020   5/24/2020     6/24/2020     7/24/2020
        • Rear door entry during the onset of the pandemic; temporary suspension                                                                      Sources: Transit Authority of Northern Kentucky, Kentucky Department of Public Health case data for Boone,
          of fare collection                                                                                                                          Kenton, and Campbell County; accessed via USAFacts.
        • Reinstated fare collection in early July, with the installation of protective
          plexiglass panels for bus operators
                                                                                                                                                      Strategies employed:
        • Frequent disinfection of terminals and high-touch points on buses; daily
          disinfection of buses using hospital grade disinfectant and electrostatic dis-                                                               •     Rear door entry only and temporary fare suspension at the beginning of the pandemic116
          infectant sprayers                                                                                                                           •     Installation of plexiglass dividers for bus operators upon restoration of front door entry and fare collection117
                                                                                                                                                       •     Signage encouraging regulation adherence, including physical distancing and mask compliance
                                                                                                                                                       •     Face mask requirement as of July 10, in concurrence with state mandate

32   PUBLIC TR ANSIT AND COVID-19 PANDEMIC: GLOB A L RESE A RCH A ND BES T PR AC T ICES                                                           PART I: TR ANSIT US AGE AND COVID-19 INFEC TION R ATES                                                                                      33
C A S E              S T U D I E S                                                                                        C A S E       S T U D I E S

                                                                             Tokyo, Japan:
                                                                                                                                                                                                       Seoul, South Korea:
                                                                             In late May 2020, none of the infection clusters in Japan
                                                                             were traced to the country’s famously crowded rail systems.                                                               Despite never entering a full lockdown like many
                                                                             This success is attributed in part to mass testing, rigorous                                                              other global cities, Seoul was able to curtail
                                                                             contact tracing, early shutdown of underlying sources of                                                                  case rates and control disease spread without
                                                                             infection clusters such as gyms and nightclubs (schools and                                                               mandating severe mobility restrictions, despite
                                                                             large events were closed in early March, earlier than most                                                                having the second-most cases in the world until
                                                                             other countries), as well as traveler behavior: individuals                                                               the beginning of March 2020. The city asked
                                                                             commonly travel alone, wear masks, and do not commonly                                                                    residents to take only essential trips in late Feb-
                                                                             speak to other riders on transit.118, 119 Early on, Japan’s govern-                                                       ruary, when case rates were still low.130 Large
                                                                             ment promoted avoiding “three C’s”: Closed off spaces with                                                                reductions in mobility did occur two weeks
                                                                             poor ventilation, Crowds, and Close-Contact Conversations.                                                                before the city’s case peak, impacting subway
                                                                             Hitoshi Oshitani, a virologist and public health expert at To-                                                            ridership (decreasing 40%) more than private
                                                                             hoku University, attributes lack of transmission on trains to                                                             vehicle use (decreasing 15%).131 By May, rider-
                                                                             this behavior, stating “an infected individual can infect oth-                                                            ship had recovered to 66% of normal.132 The city
                                                                             ers in such an environment, but it must be rare.”120 While the                                                            also imposed a mask mandate for bus and sub-
                                                                             country is, as of August 2020, experiencing an uptick in case                                                             way entry when train capacity exceeds 150%
                                                                             rates, scientists and government officials are attributing the                                                            and during peak hours and thermal scanning
                                                                             recent spread to the full reopening of bars, karaoke lounges,                                                             at select stations.133, 134 The post-peak outbreak
                                                                             sporting events, and businesses.121 Ridership on the Tokyo                                                                that the city is experiencing at the time of this
                                                                             Metro dropped by 60% in early April as the government initi-                                                              publication, August 2020, has been attributed
                                                                             ated a lockdown prohibiting non-essential trips, but began a                                                              in large part to cluster infections from individu-
                                                                             relatively quick rebound two weeks after the lockdown was                                                                 als visiting nightclubs, not transit.135
                                                                             lifted in mid-May as crowds returned to commuter lines.122, 123
                                                                             Passenger numbers continued to rise through the summer
                                                                             months. By August, ridership was up to 63% of normal lev-
                                                                             els.124

                                                                                                                                                                                                       Singapore:

                                                                             Hong Kong, China:                                                                                                         As of August 2020, Singapore had traced no
                                                                                                                                                                                                       case clusters to public transit systems, in part
                                                                             Despite being one of the world’s densest cities, Hong                                                                     with the assistance of a case tracking app
                                                                             Kong was able to keep infection rates low. By July 2020,                                                                  “TraceTogether” made mandatory for certain
                                                                             the city of 7.5 million reported just 1,655 cases and 10                                                                  populations.136, 137 Face masks are also manda-
                                                                             deaths.125 Ridership dropped to 55% of normal in Feb-                                                                     tory for all riders. Ridership dropped to 20% of
                                                                             ruary 2020, and had recovered to 76% of normal by                                                                         pre-pandemic levels by mid-April, but had re-
                                                                             June.126 Meanwhile, the city has not seen a large out-                                                                    covered to 40% of pre-pandemic levels by early
                                                                             break associated with public transit.127 Hong Kong’s suc-                                                                 June.138 While the city-state has, as of August
                                                                             cess is attributed to almost universal adoption of masks                                                                  2020, experienced a recent uptick in case rates,
                                                                             early on, a quick shut down of bars and restaurants in                                                                    the new clusters are mainly stemming from
                                                                             March, rigorous contact tracing and strict quarantines,                                                                   migrant worker dormitories and construction
                                                                             as well as sanitation efforts – including robotic cleaning                                                                sites.139 In April, Singapore’s MRT saw a 75%
                                                                             of subway cars.128 The sources of the recent uptick in                                                                    reduction in demand for rail trips and a 71% re-
                                                                             virus cases are unknown at the time of this publication,                                                                  duction in bus ridership.140
                                                                             but it is speculated to have come from foreign visitors to
                                                                             the county.129

34 P U B L I C T R A N S I T A N D C O V I D - 1 9 P A N D E M I C : G L O B A L R E S E A R C H A N D B E S T P R A C T I C E S                   PART I: TR ANSIT US AGE AND COVID-19 INFEC TION R ATES                                                    35
You can also read