Competition, barriers to entry and inclusive growth: Squarespace
←
→
Page content transcription
If your browser does not render page correctly, please read the page content below
Working Paper 2/2016

     Competition, barriers to entry and inclusive growth:
                       Telecommunications Sector Study
       Ryan Hawthorne, Pamela Mondliwa, Tamara Paremoer, and Genna Robb1

    Centre for Competition, Regulation and Economic Development, University of
                                  Johannesburg.

         ryan@competition.org.za, pamelam@uj.ac.za, tamarap@uj.ac.za,
                       genna.robb@dnaeconomics.com

                                          Abstract

Historically South Africa has favoured incumbents/national champions over rivalry
(competition) in the telecommunications sector. However, the importance of competition has
become more apparent with each new development in the sector. Given the changes in this
dynamic sector it is important to evaluate progress on regulating for competition and the
obstacles to meaningful participating in the sector by firms. The paper assesses barriers to
entry in the market for broadband and voice services in South Africa through focusing on the
experiences of Dark Fibre Africa as an entrant in fibre-based broadband, members of WAPA
in wireless and Cell C as a challenger in mobile. The paper draws on interviews and publically
available documents and data to assess the nature and extent of barriers to entry and
expansion in the telecommunications sector. The assessment considers three categories of
barriers to entry namely, access to facilities, the slow pace of regulation and strategic
responses by incumbent firms. The research finds that though there has been some headway
in improving competition, there is still a long way to go. The research finds that entry has a
positive impact on competition outcomes and that there are benefits to regulating for
competition. Following ICASA’s mobile termination rates decision, competition in prepaid
voice services broke out between the mobile operators, however, own-price and cross price
elasticities analysis shows that there is considerable scope the incumbent operators’ market
power, including through stronger regulation of network open access conditions. The paper
concludes by making recommendations on what can be done to facilitate the roll out of
broadband to achieve SA Connect targets in terms of access, speed and affordability.

                                     JEL Classification

                                 L1, L4, L51, L86, L96, L98

1
 Pamela Mondliwa and Tamara Paremoer are researchers at CCRED and Ryan Hawthorne and
Genna Robb are research fellows at CCRED.
                                                                                            1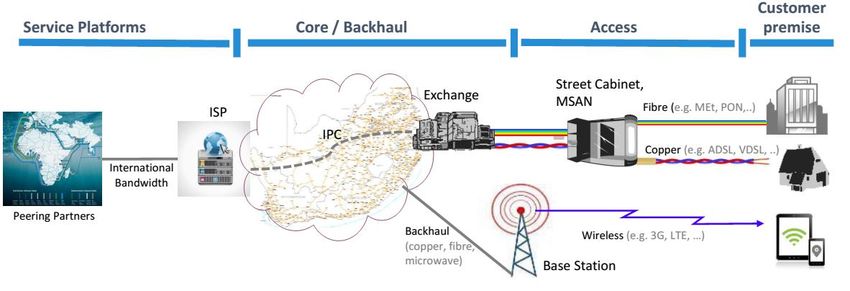
Contents

1     Executive summary........................................................................................................ 5
2     Introduction .................................................................................................................. 10
3     Background to the industry .......................................................................................... 12
    3.1      Introduction ........................................................................................................... 12
    3.2      Industry development and structure ...................................................................... 19
      3.2.1        Fixed .............................................................................................................. 19
      3.2.2        Wireless ......................................................................................................... 21
      3.2.3        Mobile ............................................................................................................ 23
    3.3      Policy context: issues impacting competition......................................................... 24
      3.3.1        Spectrum allocation ....................................................................................... 24
      3.3.2        Local Loop Unbundling .................................................................................. 25
      3.3.3        Facilities leasing ............................................................................................ 27
    3.4      Proposed mergers and JVs ................................................................................... 27
4     Fixed - Dark Fibre Africa .............................................................................................. 31
    4.1      DFA’s entry experience: barriers to entry and expansion ...................................... 31
    4.2      Background to Dark Fibre Africa ........................................................................... 41
5     Fixed wireless .............................................................................................................. 43
    5.1      Barriers to entry .................................................................................................... 43
6     Mobile - Cell C ............................................................................................................. 52
    6.1      Background to Cell C ............................................................................................ 52
    6.2      Barriers to entry/expansion ................................................................................... 55
    6.3      Gains from regulating for competition.................................................................... 60
    6.4      Competition between mobile operators – voice services (prepaid) ........................ 68
      6.4.1        Description of datasets .................................................................................. 70
      6.4.2        Results........................................................................................................... 72
      6.4.3        Summary of competition between mobile operators ....................................... 75
7     Summary of the barriers to entry in telecommunications in South Africa ...................... 77
8     Policy recommendations .............................................................................................. 79
List of references ................................................................................................................ 81
Appendix A: Neotel’s entry experience: in brief .................................................................. 82
Appendix B: Profile of interviewees for DFA case study ...................................................... 84
Appendix C: Profile of wireless interviewees ....................................................................... 85
Appendix D: Methodology (conditional logit) ....................................................................... 87
Appendix E: Data tables...................................................................................................... 90

                                                                                                                                        2
List of figures

Figure 1: Broadband speeds (Kbps) and prices (USD) in South Africa and peer group
countries ............................................................................................................................. 12
Figure 2: Forecasted growth in consumer broadband traffic ................................................ 14
Figure 3: Forecasted growth in business broadband traffic ................................................. 14
Figure 4: South Africa’s broadband speeds compared to those in Brazil, China, India, Russia
and Turkey .......................................................................................................................... 15
Figure 5: Broadband network layers.................................................................................... 17
Figure 6: Map of WAPA members in South Africa ............................................................... 22
Figure 7: Digital Dividend .................................................................................................... 25
Figure 8: Number of commercial lease agreements (growth in long-term customers) ......... 32
Figure 9: Other measures of network growth: route kilometres of fibre and number of mobile
base stations connected to DFA network ............................................................................ 33
Figure 10: Revenue Growth ................................................................................................ 33
Figure 11: DFA Shareholding .............................................................................................. 43
Figure 12: Possible means of allocating unused high-demand spectrum ............................ 49
Figure 13: Growth of subscriber numbers ........................................................................... 53
Figure 14: Average mobile data speeds (2015) ................................................................... 54
Figure 15: Mobile termination .............................................................................................. 60
Figure 16: Retail prices and call termination rates ............................................................... 62
Figure 17: Growth of outgoing minutes ............................................................................... 63
Figure 18: South Africa vs SADC retail prices ..................................................................... 64
Figure 19: Calculation of welfare benefits from price reductions .......................................... 65
Figure 20: MTN & Vodacom’s revenues .............................................................................. 67
Figure 21: Lowest available off-net prepaid price (Peak), South Africa, 2010 - 2015 ........... 68
Figure 22: Lowest off-net prepaid price (peak), SA & other African countries, 2010 ............ 69
Figure 23: Lowest off-net prepaid price (peak), SA & other African countries, 2015 ............ 69

                                                                                                                                        3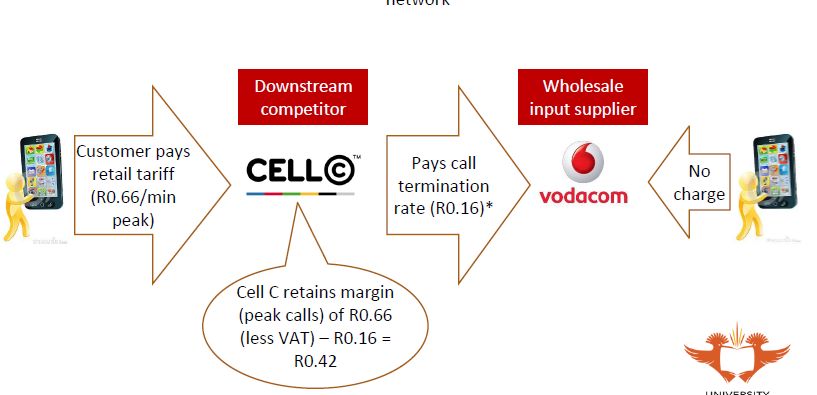
List of tables

Table 1: SA Connect targets ............................................................................................... 13
Table 2: SA vs Brazil internet/broadband speeds ................................................................ 16
Table 3: Costs associated with the broadband network layers ............................................ 18
Table 4: Fixed operator market shares, revenue ................................................................. 20
Table 5: Fixed operator markets shares, kms of fibre .......................................................... 20
Table 6: Mobile operator market shares .............................................................................. 23
Table 7: Spectrum Allocations ............................................................................................. 24
Table 8: Impact of FibreCo on cost of transmission between Bloemfontein and
Johannesburg ..................................................................................................................... 46
Table 9: Voice network quality ............................................................................................ 54
Table 10: Cost of contract cancellation ............................................................................... 58
Table 11: Mobile call termination rates history – 1993-2010 (regulated) .............................. 61
Table 12: Mobile call termination rates history – 2011-2016 (regulated) .............................. 61
Table 13: Welfare improvement due to call termination rate intervention............................. 66
Table 14: Prepaid, post-paid and hybrid customers (AMPS, 2010 - 2013) .......................... 70
Table 15: Operator market shares, prepaid customers (AMPS, 2010 - 2013) ..................... 71
Table 16: Average age and income by operator chosen (AMPS, 2010 - 2013) ................... 71
Table 17: Voice prices for Telkom Mobile, Cell C, MTN, Virgin Mobile and Vodacom ......... 72
Table 18: Estimation results – conditional logit .................................................................... 74
Table 19: Voice prices for Telkom Mobile, Cell C, MTN, Virgin Mobile and Vodacom
(conditional logit model 1) ................................................................................................... 75
Table 20: Share of AMPS respondents, by race (2010 - 2013) ........................................... 90
Table 21: Share of AMPS respondents, by income category (2010 - 2013) ........................ 90
Table 22: Operator shares of survey respondents (including no service) ............................ 91

                                                                                                                                   4
1        Executive summary

Telecommunications is one of the facilitators of economic growth and participation. As such,
countries care about the competitive outcomes in the market. When competition works in
telecommunications it can result in expanded services, lower prices, and stimulate innovation.

The South African record of telecommunications policy and regulation has, however, been
poor. Telkom was entrusted to invest in the sector and ensure access. The two first movers in
mobile telecommunications established a strong duopoly. Entrants were expected to compete
with incumbents while the playing field was far from level. This has resulted in very poor
outcomes which have taken lengthy competition and court cases to address just in voice
communication and even then the successes have been partial.

Despite this poor track record Telkom has recently been identified as the “broadband
champion” to facilitate universal broadband roll out. SA Connect requires 90% of South
Africans to have access to 5 Mbps by 2020, while 50% of citizens must connect at 100 Mbps.
The policy requires access to quality and affordable broadband. This is happening at a time
when the demand for broadband is growing at rapid rates. Forecasts of broadband growth is
estimated at a CAGR of 47% and 36% for consumer and business demand, respectively for
the period between 2014 and 2019.2

Sufficient infrastructure deployment is required to support the SA Connect access and speed
and competitive rivalry is important for making the broadband affordable.

A CCRED study of the telecoms sector reviews the barriers to entry and expansion in the
sector, much of which directly impacts the ability of South Africa to deliver on SA Connect.3
The study draws on three case studies of entry: by wireless providers; Dark Fibre Africa; and
Cell C. These case studies are analysed to understand the challenges faced by entrants in
the sector and the impact of entry on outcomes. This brief draws together the main findings
and considers policy implications.

Key barriers to entry and expansion

The study identified the following key barriers to entry.

Access to facilities

Obtaining rights of way/wayleave approval to trench and deploy infrastructure is often difficult.
The processes can vary significantly across different municipalities and public entities, which
introduces unnecessary complexity and uncertainty and the approval process can be quite
lengthy. Turnaround period for wayleave approval can take between 4 weeks and 6 months
from municipalities, and between 9 – 12 months from entities such as SANRAL and Transnet.
However, firms have waited more than 8 years for approval.

2 Forecasts by Cisco VNI Available: http://www.cisco.com/c/en/us/solutions/service-provider/visual-networking-
index-vni/index.html
3 CCRED Working Paper 2016/1, www.competition.org.za

                                                                                                                 5
There are also instances where firms have had to litigate to be able to roll out. 4 This delays
rollout and ability of firms to compete and will have a negative impact on achieving the SA
Connect goals.
There has also been difficulties in gaining access to Telkom’s poles and ducts and to link to
their exchange, and exorbitant pricing in the rare instances that access is granted.
Slow pace of regulation
The delays in allocating spectrum have limited the ability of firms to deploy 4G technology,
which delivers faster speeds. The delay is in part a result of the delayed digital migration to
avail spectrum for allocation to mobile operators. ICASA published the guidelines for allocation
in 2013 but there have been no allocations to date. Mobile operators can increase capacity by
using more spectrum, using better technology or building more base stations but spectrum is
the more cost effective option. Players resorted to procuring spectrum through mergers and
acquisitions which have not been concluded due to competition concerns.
Entrants have also struggled to acquire spectrum. Smile Communications has been waiting
for the regulator to process its application since 2009. Smile, a Johannesburg based firm, has
invested heavily in LTE networks in other African countries focusing on rural areas and
providing a competitive discipline to incumbent firms.
Local Loop Unbundling (LLU), which would enable access by multiple providers to the last
mile infrastructure (the most expensive network layer), has been part of government policy
since 2007 but the process is yet to start. The delay is impeding innovation and competition
around broadband services. Neotel tried to gain access by lodging a facilities leasing request
with Telkom, this was rejected and the finding of the Complaints and Compliance Committee
(the dispute resolution body) was that ICASA should have issued LLU regulations.
In pursuit of services-based competition, the Electronic Communications Act (ECA) has
regulations for leasing wires, cables, antenna, masts and radio equipment on condition that it
is technically and economically feasible without adverse material consequences. Cell C has
alleged that requests for sharing facilities from competitors has been met with resistance or
outright refusal. The poor enforcement of the facilities regulations, including leasing and
national roaming delays the progress of services competition and infrastructure competition
only benefits the incumbent firms.
Strategic responses by incumbents
The differential between retail prices for off-net (between different networks) and on-net
(between same network) calls referred to as ‘closed network pricing’ raises switching costs
making it difficult for challenger networks to build a customer base. Incumbent firms build
“communities of interest”. For example, the incumbent operators have MTN Zone and
Vodacom4 less with dynamic discounting for on-net calls which, based on location and the
time of day, are up to 100%. In 2013, 95% of MTN’s pre-paid subscribers were on MTN Zone,
highlighting the success of these plans. Cell C has lodged a case with the Competition
4High Court of South Africa (KwaZulu-Natal Division), Case Number 2763/2014, The Msunduzi Municipality v Dark
Fibre Africa (Pty) Ltd and Supreme Court of Appeal of South Africa, Case Number 20119/2014, The Msunduzi
Municipality v Dark Fibre Africa (Pty) Ltd.
6Commission in 2013 alleging that the conduct amounts to price discrimination in contravention
of the provisions of the Competition Act.
Critical insights
National champions and first-movers tend to capture the agenda and rarely deliver on the
expectations, whilst a plurality of rivals delivers better outcomes. For example, the competitive
interaction between the challenger operators and the incumbents led to a fall in mobile voice
prices between 2011 and 2015. It could have happened faster and earlier.
Other episodes of entry have delivered substantially improved economic outcomes. When
Seacom entered the market for undersea cables in 2009 the cost of bandwidth for typical
Internet Service Providers (ISPs) fell by 35%.5 Prior to Seacom’s entry the only cable available
was Telkom’s SAT-3 cable. Another example is the 87% reduction in the price of transmission
over long distance fibre between Bloemfontein and Johannesburg, between 2013 and 2014
due to the construction of two new fibre links by Fibre Co (open access) and the NLD
Consortium.
To make effective rivalry possible there is a need to regulate for competition. After the mobile
termination rates (MTRs) decision by ICASA in 2011 the challenger operators were better able
to compete with incumbent operators which resulted in lower prices. ICASA reduced the
termination rates and created asymmetry, whereby the challenger operators paid lower rates
to terminate calls on the incumbents’ networks. The MTRs decision led to a R1.09 reduction
of the termination rate with 81% and 91% pass through to Vodacom and MTN consumers,
respectively. Prices to customers declined by 88c on the Vodacom Network and 99c on the
MTN network, from the period 2010 to 2015. The total consumer benefit generated by the
MTRs for MTN and Vodacom customers amounts to R47.2 billion over the period 2010 to
2015. The incumbent firms also did not incur the losses that they had warned about as call
volumes increased.
The call termination rates are still higher than the effective voice rates charged by the
Incumbent networks. In 2014 the Vodacom CEO reported that their voice bundles were priced
at an effective rate of 7c per minute, which is far below the 20c per minute termination rate
that Cell C and Telkom Mobile have to pay to terminate a call on the incumbents’ networks.6
Entrants have challenges obtaining finance as there are major changes in technology which
make returns uncertain. Regulatory uncertainty compounds this. Financiers are thus wary of
providing funding to new rivals in this sector. The recent entrants in the fibre space appear to
be linked to a formal or informal network of capital and trust that seem to circulate amongst a
group of (serial) ICT entrepreneurs.
5 Stucke, W. (2015).Building a case for rural broadband. Presented at the Future Wireless Technologies Forum,
July 2015.
6 My Broadband (2014) ‘What Vodacom customers really pay for calls‘, 31 July, 2014. [Online]
Available:http://mybroadband.co.za/news/cellular/107022-what-vodacom-customers-really-pay-for-calls.html
7Policy Recommendations
Competition issues
The on-net/off-net price discrimination case requires swift and thorough investigation by
the authorities.
Strong powers of competition enforcement by the regulator and competition authorities
need to be ensured.
Facilitating broadband rollout
Government is in a position to be an anchor customer by aggregating its demand from the
local municipal offices, clinics, police stations, and department offices. Treasury could set
aside a fund that can be accessed on condition that government entities coordinate in rural
towns to extend fibre optic networks.
Telkom’s position as a lead agency is useful in so far as it relates to opening up
infrastructure. Open access conditions should be imposed to give access to the fixed line
infrastructure.
Roll out projects must make use of existing infrastructure.
All new roll out projects should be awarded on a competitive tender process at a
district/municipal level.
Broadband Infraco (BBI) has not been a significant positive competitive force in the
industry, despite having the second largest fixed network. BBI’s assets should be
managed more effectively and perhaps there is a need to assess whether or not BBI
should be privatised (on condition that open access is provided to its infrastructure.
National Spectrum Management Agency:
There have been a number of delays in the allocation of spectrum but these have been a
result of lack of independence rather than lack of capacity at ICASA. ICASA should be left
with the responsibility of managing spectrum allocation and provided with more
independence.
ICASA should be directly funded by the industry levies, as per the international best
practice.
The councilors should be appointed by the head of state and not the line minister.
The number of councilors should be reduced as per international best practice.
As far as possible spectrum should be assigned to operators that will use it efficiently. A
national body should not be set up to hoard spectrum for the use of a publically owned
network.
8Lowering barriers to entry and expansion
Fixed wireless can use TV white spaces (TVWS) to provide more reliable services and
become better competitors. ICASA should be given the funding to develop regulations for
the use of TVWS on an ongoing basis.
Consideration should be given to assigning TDD spectrum to new entrants and possibly
some FDD spectrum. If FDD spectrum is allocated to new entrants then this could be could
be used as leverage to get better MVNO roaming arrangements with the MNOs.
Access to facilities- Rapid deployment guidelines must be finalized to facilitate rights of
way applications for rollout. Access to municipal, provincial and national government
infrastructure should be governed by one policy (ducts, poles, rights of way).
LLU-access to ducts and poles for fixed line networks. The budget that has been allocated
Telkom as the “broadband champion” (R1billion) should be earmarked to fund unbundling
the local loop and this can be overseen by a team created within ICASA.
Mobile site access and RAN sharing-Infrastructure sharing should be closely regulated.
The current regulations are insufficient. There should be a better dispute resolution
process and better monitoring of infrastructure sharing.
There should be a regulatory framework for services based sharing (bitstream access,
national roaming, MVNO access and wholesale data). At the moment, the ECA only makes
reference to physical infrastructure and not services based sharing.
Government policy should support spectrum sharing trading and pooling (including for
TVWS) as it leads to the efficient use of spectrum and lowers barriers to entry.
92 Introduction
Telecommunications is a key facilitator of economic growth. As such, countries care about
competitive outcomes in this market. When competition works in telecommunications it can
result in expanded services, lower prices, and it can stimulate innovation.7 However, the South
African record in terms of telecommunications policy and regulation has been poor. Telkom
was entrusted to invest in the sector and expand access, but ended up using its control of
upstream infrastructure to frustrate downstream rivals and limit competition, in order to protect
its own position. The two first movers in mobile telecommunications established a strong and
durable duopoly. Entrants were expected to compete with incumbents while the playing field
was far from level. This has resulted in poor outcomes which have taken lengthy competition
and court cases to address, just in voice communication. Despite this poor track record,
Telkom has recently been identified as the “broadband champion” to facilitate universal
broadband roll out as outlined in SA Connect.
There have been some improvements in recent years, even if these are only partial. In terms
of voice, there has been a gradual reduction in prices that was prompted by government and
regulatory intervention. Each of these interventions represented an attempt at regulating for
greater competition. There are important lessons that can be drawn from these experiences
that can be used to facilitate the same important changes in terms for data prices. To identify
these lessons, there is a need to understand the impact of entrants on competitive outcomes
and the support systems that are required to enable the entrants to be effective rivals to
established incumbents. This can be achieved by analyzing the barriers to entry and
expansion in telecommunications as well as assessing the outcomes in the instances where
those barriers have been overcome.
The telecommunications industry has some inherent characteristics that lends itself to high
barriers to entry. For example, consumers value a network based on how many other
members the network has. This creates a ‘chicken and egg’ problem when it comes to entry
as consumers want viable networks but need to join up for them to exist. As a result first
movers tend to have advantages over later entrants, who find it more difficult to attract
customers. This can confer on the incumbent an ability to exclude rivals by promoting
infrastructure-based competition and stifling competition on services. In such circumstances,
regulation has an important role in ensuring competitive markets.
The main aim of this research is to conduct assessments of barriers to entry in the mobile,
fixed fibre and wireless telecommunications market segments. This is done by accessing the
experiences of Dark Fibre Africa as an entrant in fixed fibre, Cell C as a challenger operator
in mobile telecommunications and a range of wireless providers. The research seeks to
answer a number of questions. First, it seeks to understand the impact of recent entrants in
the industry on levels of competition, price and service, and what challenges they have had to
overcome. Second, the research will assess the impact of government intervention and
participation in the sector on competition. Other questions that will be addressed include
whether competition on services versus competition on infrastructure delivers better
outcomes, the potential impacts of recent proposed mergers on competition in the sector,
whether local loop unbundling is still relevant and the potential for it to resolve South Africa’s
broadband price and speed problems as well as the likely competitive implications of Telkom
7Jamison, M., Sanford, B., and J, Liangliang. 2009. “Analyzing Telecommunications Market
Competition: A Comparison of Cases.” Public Utility Research Center, University of Florida.
10being designated as the national broadband champion. The research methodology
encompassed both primary and secondary research. The primary research was conducted by
means of interviews with firms, stakeholders, industry associations and Government. Thirty-
three (33) interviews were conducted.8 Secondary research included analysis of performance
data and forecasts to establish general trends, review of competition cases and review of
current debates in the sector. The data collected from the desktop research is used to assess
the extent of competition in the telecommunications sector by evaluating prices and estimating
elasticities of demand.
The rest of the paper is organized as follows, section 2 provides a background to the
telecommunications sector. Sections 3, 4 and 5 are the Dark Fibre Africa, fixed wireless, and
Cell C case studies, respectively. Within the Cell C case study the paper also considers the
extent of competition between the mobile operators in terms of voice. Section 6 provides a
summary of barriers to entry emerging from the case studies and the implications for the
research questions. Section 7 outlines policy recommendations.
8 Telkom and Broadband Infraco declined to participate in the study and the DTPS could not be
reached.
113 Background to the industry
3.1 Introduction
The ‘costs to communicate’ in South Africa are high9, particularly in respect of broadband
services, and there is growing political pressure to reduce these costs.10 The prices of voice
services have declined considerably over the last 5 years as a result of interventions by the
Independent Communications Authority of South Africa (ICASA), and are now among the
lowest in Africa.11 However, South Africa has very high broadband prices relative to its
developing/middle income country peers, for services that have relatively slow speeds (see
Figure 1).12
Figure 1: Broadband speeds (Kbps) and prices (USD) in South Africa and peer group
countries
Source: Analysis of International Telecommunications Union. (2014). ‘Measuring the information society’.
Available from: http://www.itu.int/en/ITU-D/Statistics/Pages/publications/mis2014.aspx
9 South Africa’s high costs to communicate has been documented in a series of research paper in this area. See,
for example, Bonakele, T., Cull, D., Hawthorne, R., & Lewis, C. (2014). ‘Review of economic regulation of the
telecommunications sector’. Available from: http://goo.gl/YeizRT ; Gillwald, A., Moyo, M., & Stork, C. (2012).
‘Understanding what is happening in ICT in South Africa.’ Research ICT Africa. Available from:
http://www.researchictafrica.net/publications/Evidence_for_ICT_Policy_Action/Policy_Paper_7_-
_Understanding_what_is_happening_in_ICT_in_South_Africa.pdf ; Aproskie, J., Hodge, J., Lipschitz, R., Sheik, F.
(2008). ‘South African 15-year Telecommunications Policy Review’. Available from:
http://www.thepresidency.gov.za/docs/reports/15year_review/economic/telecommuncations.pdf
10 See, for one example among many, the Parliamentary Portfolio Committee on Communications’ hearings on the
‘cost to communicate’ in South Africa, held in July 2013.
11
See, for example, Bonakele et al, cited above
12 See, for example, Bonakele et al, cited above.
12South Africa is also falling behind in terms of broadband access when compared with other
developing economies. The State of Broadband 2015 report has shown that South Africa’s
performance is poor. The report shows that in 2015, there were 3.2 fixed broadband
subscriptions per 100 persons compared to Brazil’s 11, 5; China (Hong Kong)’s 31.2; Turkey’s
11.6 and the Russian Federation’s 17.5 per 100 capita. However, South Africa was performing
better than some economies like India at 1.2 fixed broadband subscriptions per 100 persons.
There is a significantly higher record of mobile broadband subscriptions than fixed broad band
subscriptions. South Africa recorded 46.7 mobile broadband subscriptions relative to Brazil’s
78.1; China’s 104.5; India’s 5.5; Turkey’s 42.7 and the Russian Federation’s 65.9.
The poor broadband access has led to a focus on broadband policies by governments all over
the world. In 2013, the South African Government released SA Connect, the national
broadband policy, outlining the country’s objectives and strategies for universal access to high
quality and affordable broadband. The SA Connect document has defined broadband as “…an
ecosystem of high capacity, high speed and high quality electronic networks services,
applications and content that enhances the variety, uses and value information and
communication for different types of users.” Though other country definitions include specific
speeds the South African definition has been broad with specific speed targets. SA Connect
has set targets for broadband speeds and availability, which will require 50% of South African
users to get access to optical fibre based broadband by 2016 (Table 1).
Table 1: SA Connect targets
Target Measure Baseline By 2016 By 2020 By 2030
(2013)
Broadband % measure of 37% internet 50% at 90% at 5Mbps 100% at
access in population access 5Mbps 50% at 100 10Mbps
Mbps user Mbps 80% at 100
experience Mbps
Schools % of schools 25% 50% at 10 100% at 10 100% at 1G
connected Mbps Mbps
80% at 100
Mbps
Health % of health 13% 50% at 10 100% at 10 100% at 100
facilities facilities connected Mbps Mbps Mbps
80% at 100
Mbps
Government % of 50% at 5 100% at 100% at 100
government Mbps 10Mbps Mbps
offices
Source: http://www.gov.za/documents/electronic-communications-act-south-africa-connect-creating-
opportunity-ensuring-inclusion
These targets are rather ambitious given the rate of fixed broadband deployment and the
challenges faced by both fixed and mobile broadband providers. The growth in data demand
over the years has also been astronomical. The compound annual growth rate (CAGR) of
13consumer broadband traffic for South Africa is estimated at 47% from 2014 to 2019.13 Though
mobile broadband is expected to grow at a faster rate than fixed broadband at a CAGR of
63.7% and 42.07%, respectively, the demand for fixed broadband is significantly higher than
mobile at 848.6 petabytes by 2019 versus 318.2 petabytes (Figure 2).
Figure 2: Forecasted growth in consumer broadband traffic
900
800
700
600
Petabytes
500
400
300
200
100
0
2014 2015 2016 2017 2018 2019
Mobile Fixed
Source: CiscoVNI
Similarly, the business broadband traffic is expected to grow. The CAGR of business
broadband traffic for South Africa is estimated at 36% over the period 2014 to 2019.14 Mobile
broadband is expected to grow at approximately 59% CAGR relative to fixed broadband at
approximately 37% CAGR (Figure3).
Figure 3: Forecasted growth in business broadband traffic
300
250
200
Petabytes
150
100
50
0
2014 2015 2016 2017 2018 2019
Fixed Mobile Managed IP
Source: CiscoVNI
13 Broadband traffic forecasts obtained from CiscoVNI,
14 Broadband traffic forecasts obtained from CiscoVNI,
14As with the consumer broadband segment, fixed broadband demand is significantly more
important estimated at 284 petabytes by 2019, while mobile broadband is for the same year
is estimated at 41 petabytes. The remaining business broadband traffic is carried through
managed internet protocol (IP). Figures 3 and 4, highlight the importance of fixed broadband
in South Africa. This is concerning as the slow deployment of fixed broadband coupled with
the relatively high cost has meant that mobile broadband has been used as a primary form of
broadband access rather than a complementary services, as is the case in mature
economies.15 The mobile broadband demand is also increasing rapidly. Thus the challenge
for South Africa is to increase fixed broadband deployment and the capacity of the mobile
networks.
In addition to broadband access and price, the bandwidth speed is also important to
customers. South Africa is falling behind its developing and middle income country peers in
respect of broadband speeds. While India was the slowest of the above group of countries
historically, India has now caught up to South Africa. South Africa has significantly slower
speeds than the Russian Federation, Brazil, China and Turkey (Figure 4).
Figure 4: South Africa’s broadband speeds compared to those in Brazil, China, India,
Russia and Turkey
Source: Analysis of: Ookla. (2015). ‘Netindex’. Available from: http://www.netindex.com
15
SA Connect
15South Africa’s broadband speed are particularly poor when fixed broadband services are
compared (Table 2).
Table 2: SA vs Brazil internet/broadband speeds
Mbps South Africa Brazil
2014 2019 2014 2019
Average mobile speed 1.7 3.9 0.8 2.2
Smart phone 3.1 6 3.9 7.5
Wi-Fi from mobile devices 2.8 5 5.9 10
Fixed wired & Wi-Fi 3.5 9.5 8.3 18.6
Source: Cisco VNI
Based on forecasts, it is unlikely that the 2020 SA Connect targets will be met. In 2014 the
average mobile speed was 1.7 Mbps while the average speed for fixed internet was 3.5 Mbps
below the target of 5mbps by 2016 (table 2).
These outcomes are despite the de-facto liberalisation of the telecommunications sector as a
result of the Altech judgement.16 There are hundreds of licensees able to compete in markets
for broadband services. There are two main competing theories that explain South Africa’s
slow speeds (which are not mutually exclusive): the first is that mobile operators need more
spectrum for broadband in order to be able to deliver higher speeds and that competition over
fixed line networks is largely irrelevant.17 The second theory is that greater competition among
providers of fixed line service providers is required: while mobile networks need more
spectrum, their networks are not suitable for ‘broadband’, described (narrowly) as networks
that allow for high levels of usage and high speeds. This is because of the shared nature of
wireless spectrum: the more users on wireless networks, the slower the speeds experienced
by users. Mobile operators manage user experience by charging high prices for usage, thus
reducing usage and offering users a better experience. Fixed line networks, because they
provide dedicated capacity to end users, do not need to charge high usage prices in order to
manage user experience; usage therefore tends to be orders of magnitude cheaper on fixed
line networks, with many services offering unlimited usage (‘uncapped’ services).
If fixed line network competition is indeed relevant, a further debate is whether allowing new
entrants to use existing fixed line networks would result in lower prices and higher speeds.
Local loop unbundling (LLU), which allows for competing providers to use incumbent fixed line
infrastructure, is used to deliver competition over fixed lines in European Union countries, for
example.18 LLU relies on the ‘ladder of investment’ theory, which allows new entrants to use
16 See: Altech Autopage Cellular (Pty) Ltd v the Chairperson of the Independent Communications Authority of
South Africa et al, case No. 20002/08.
17 The mobile operators, collectively and individually, have made numerous submissions regarding the assignment
of spectrum. See, for example: Analysys Mason. (2010). Assessment of economic impact of wireless broadband
in South Africa. Available from: http://www.analysysmason.com/PageFiles/16954/AML-GSMA-spectrum-benefits-
in-South-Africa-10-11-03.pdf
18 European Parliament and Council. (2009). Amending the Directives 2002/21/EC on a common regulatory
framework for electronic communications networks and services, 2002/19/EC on access to, and interconnection
of, electronic communications network and associated facilities, and 2002/20/EC on the authorisation of electronic
communications networks and services. Available from:
16incumbent infrastructure for a period of time as they learn about patterns of demand and
ultimately build their own local loop infrastructure.19 Opponents of LLU explain that it reduces
the incentives for new entrants to invest in their own networks, and is in any event unnecessary
due to competition from other broadband connectivity options, including mobile broadband
(such as 3G and 4G).20
To the extent that mobile networks are replacing fixed line networks, LLU would be a costly
and unnecessary intervention, in that fixed line networks would be competing with several
mobile networks in South Africa. However, the broadband traffic forecasts indicate that fixed
broadband is important and as such the LLU may still be important.
Understanding the cost drivers of broadband deployment
Broadband is made up of many layers such as the service platforms that provide the
international bandwidth and peering partners, often provided by the internet service providers
(ISP); the core and backhaul of the network which is made up of the exchange and backhaul
(long distance fibre, copper and microwave), access, and the connection to the customer
premises (figure 5).
Figure 5: Broadband network layers
Source: Brian Armstrong, Telkom
The service platforms include applications to allow for product and service configuration and
are the central operational costs of the service provider.21 The backhaul is based on fibre optic,
copper or microwave technology and is the backbone that connects to the exchange.22
However, there is a preference for fibre optic technology in backhaul by all due to superior
http://eur-lex.europa.eu/LexUriServ/LexUriServ.do?uri=OJ:L:2009:337:0037:0069:EN:PDF
19 See Cave, M. (2006). ‘Encouraging infrastructure competition through the ladder of investment’,
Telecommunications Policy, vol. 30.
20 See, for example, Hausman, J. & Sidak, G. (2005). Did mandatory unbundling achieve its purpose: Evidence
from five countries. Journal of Competition Law and Economics 1(1), available from:
http://criterioneconomics.com/wp/wp-
content/uploads/2012/06/Did_Mandatory_Unbundling_Achieve_its_Purpose1.pdf
21 Armstrong, B. (2013). Broadband in South Africa: The Roadmap to Growth. Presented at the
annual MyBroandband conference. Johannesburg.
22 Ibid
17quality versus the alternative technologies. The access layer of the network is the most capital
intensive layer. It covers the last mile connection between the exchange and the customer
premises. This could include fibre, copper, wireless and others.23 The customer premises layer
includes end user devices such as modems, routers, and Wi-Fi.
The highest proportion of capital and operational expenditure is spent on the access layer of
broadband, with between 50-60% of expenditure (table 3).
Table 3: Costs associated with the broadband network layers
Platforms IP and DSL Access costs
backhaul
Global experience-typical 15% 25% 60%
share of opex
Global experience- typical 20% 30% 50%
share of capex
South Africa 25% 25% 50%
Source: Brian Armstrong
Fibre has greater bandwidth than other means of transmission and has at times been
described as the holy grail of broadband. It can provide the SA connect speeds that are
targeted by 2030, i.e. 100Mbps and 1Gbps to the schools. However, again there are things
that need to be in place to facilitate the fibre deployment. The firms that are deploying fibre
have been struggling with access to facilities i.e. rights of way to be able to trench and lay the
fibre, and access to ducts and poles to be able to connect the fibre. Local loop unbundling
also needs to be implemented as it would allow for fibre to be deployed to the cabinet and
then linked to the Telkom lines going into the home. Fibre to the cabinet (FTTC) is far cheaper
to deploy than fibre to the home (FTTH) and thus LLU would allow more people to be
connected with the same capital outlay.24
Wireless could also play a role in terms of ensuring access to broadband and this would
particularly be the case in rural areas where there may not be a business case to deploy fibre.
The wireless providers could also be allocated more spectrum in order to be more reliable. In
all these cases it would be important to ensure that there is rivalry such that the broadband is
affordable. It would be of little use to have access across the country with only a small
proportion of the population being able to afford these services.
The rest of this section will provide a brief description of the market structure in each segment:
fixed, wireless and mobile.
23Ibid
24FTTC would not be able to deliver the same speeds as FTTH due to the last mile connection being
on copper lines.
183.2 Industry development and structure
3.2.1 Fixed
Telkom was the fixed line monopolist in South Africa until government’s decision, reflected in
the 1995/96 White Paper, to follow a process of managed liberalisation in the
telecommunications sector. As part of this process Telkom was partially privatised and given
notice that it would face competition from 2002 onwards, when a second network operator
(SNO) would be licensed. This effectively gave Telkom a further five years of monopoly in
fixed lines in return for undertaking universal service obligations. In practice, the process of
licensing the SNO took much longer than expected, and Neotel was only licensed as the SNO
in 2005 (see appendix A for Neotel’s entry experience).
In the meantime, downstream competition to Telkom was enabled by the licensing of Value
Added Network Services (VANS) providers. However, these providers were reliant on
Telkom’s fixed line infrastructure to provide services to customers and Telkom was also
competing downstream. Anticipating the end of its upstream monopoly once the SNO was
licensed, Telkom proceeded to use its control of the essential upstream input to exclude
competing VANS providers through engaging in a “margin squeeze” where it charged high
prices for the essential inputs required by its downstream competitors. This was the basis for
two findings of anti-competitive conduct against Telkom by the competition authorities,
resulting in two large fines and behavioural remedies.25
Neotel entered as the SNO in 2006 and was subsequently awarded spectrum in the 3500MHz,
1800MHz and 850MHz bands (BMI-T, 2013). Initially it was intended that Neotel would acquire
the fixed line infrastructure belonging to electricity and transport parastatals Eskom and
Transnet, which would have given Neotel critical backbone infrastructure on top of which it
could have rolled out fixed line broadband to homes and businesses. However, government
belatedly decided to instead create a state-owned entity, Broadband Infraco, to own and
operate the assets, which meant that Neotel was obliged to invest in setting up a network from
scratch. In 2013, Neotel had 6500km of fibre to Telkom’s 105 000km (Hawthorne, 2014). Since
its inception, BBI has performed poorly, winning few customers and exhibiting dire financial
performance (Robb, 2014). The decision to give Eskom and Transnet’s network to BBI instead
of Neotel as the SNO may have knock-on negative impact on competition in the retail market,
as BBI has no intention of entering the retail market, whereas Neotel is present in the retail
market (Robb, 2014).
More recently there has been entry by a variety of wholesale service providers who have built
national and metro fibre transmission facilities (BMI-T, 2013), the most prominent of which is
Dark Fibre Africa (DFA). In addition, there has been entry at the level of “last mile”
infrastructure in the form of providers of fibre to the home and business (FTTH/B) such as
Vumatel and FibreHoods.
Despite all this, Tables 4 and 5 below illustrate the scale that Telkom still enjoys in terms of
both revenue and infrastructure, compared to its competitors.
25
Competition Tribunal case 11CRFeb04 and 016865
19Table 4: Fixed operator market shares, revenue
Operator Revenue (Rm, 2013) Market share
Telkom 29 118 88%
Neotel 2959 9%
DFA 683 2%
Broadband Infraco 237 1%
Source: annual reports
Table 5: Fixed operator markets shares, kms of fibre
Operator Kms of fibre (2013) Market share
Telkom 105 000 80%
Neotel 6500 5%
DFA 7315 6%
Broadband Infraco 12 800 10%
Source: annual reports
A final development in the fixed segment worth mentioning is that some municipalities,
particularly metros, have started to deploy fibre networks. These are generally intended to
service government sites but also to enable the local government to expand broadband access
within the metro. This seems to overlap to a large extent with the mandate of BBI, and has
also been criticised for duplicating on-going private sector infrastructure investment.
For example, Cape Town is currently building a fibre network to government sites which will
be complemented by a wireless mesh network to reach end consumers.26 The network is
intended to be open access, such that it can provide wholesale access to ISPs as an
alternative to Telkom. The first stage of the project has been completed and the City is already
leasing lines to private sector operators.27
The City of Johannesburg has undertaken a similar initiative. The Johannesburg Broadband
Network Project (JBNP) involves laying 900km of fibre.28 This was initially implemented as a
PPP between the City and a private sector service provider; however, following a contractual
dispute with the service provider, the City has announced that it is to buy out the infrastructure.
The network will now be owned and operated by a Municipal Owned Entity (MOE).29 The
initiative has faced criticism from some who argue that it has unnecessarily duplicated private
sector infrastructure, and that the City lacks the expertise required to operate the network
26 TechCentral 24 May 2012. “Inside Western Cape’s big broadband push”. Available online:
http://www.techcentral.co.za/inside-western-capes-big-broadband-push/32115/
27 Tech Central 16 April 2014. “Cape Town signs up broadband partners”. Available online:
http://www.techcentral.co.za/cape-town-signs-up-broadband-partners/47643/
28 ITWeb 6 February 2015. “ ITWeb investigates: Joburg's R1.2bn broadband 'white elephant'”.
Available online: http://www.itweb.co.za/index.php?option=com_content&view=article&id=140971
29 Ibid
20effectively.30 There have also been suggestions that the City overpaid for the infrastructure.
The network is not currently being utilised except by the MNOs.31
3.2.2 Wireless
The first wireless broadband solution in South Africa was launched when Sentech introduced
the MyWireless and BizNet services in 2004 (BMI-T, 2013). Coverage was limited and the
service struggled to reach mass adoption. As a result, Sentech removed the products from
the market in 2007 (BMI-T, 2013).
The iBurst system was also launched in 2004 by Wireless Business Solutions (WBS) and grew
to 60 000 subscribers at its peak before declining. In 2008, Vodacom partnered with iBurst to
roll out a WiMAX network in Gauteng, Durban and Cape Town. Vodacom bought a 24.9%
stake in WBS/iBurst but subsequently sold the shares (BMI-T, 2013). Currently, the big
national players in this market are Neotel, Internet Solutions and Comtel but there are also a
number of small players, mainly operating in smaller towns.
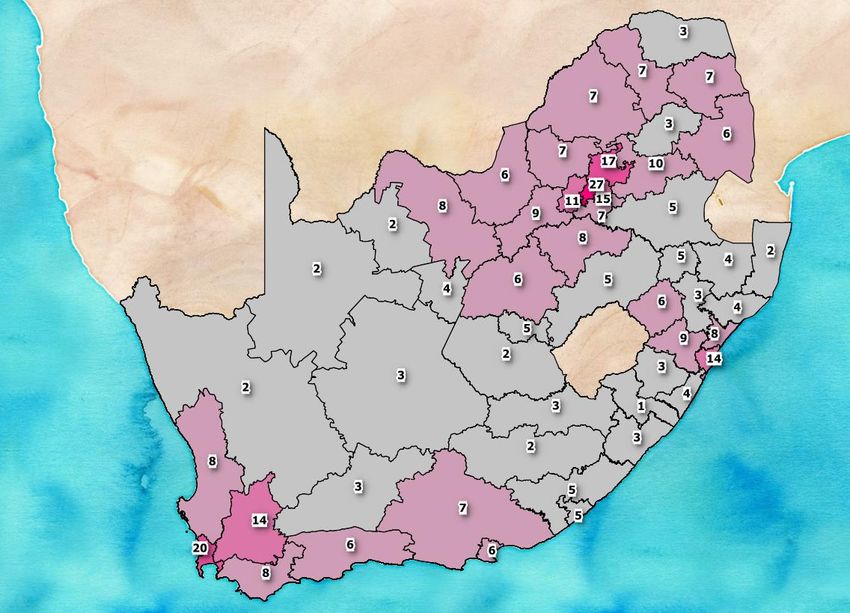
The map below illustrates the location by district municipality of members of the Wireless
Access Providers Association (WAPA) in South Africa. The map shows that in rural parts of
the country there are typically a small number of providers, often fewer than 5. Within a given
district municipality the providers which are present may be servicing different local areas, so
in the most remote parts of the country there is likely to be little competition between providers.
In urban areas there are typically many more providers, with Johannesburg having the
greatest number with 27 fixed wireless providers. Cape Town has 20 providers and Durban
14. This suggests that consumers in the major metros will have a choice of several wireless
providers, whereas in rural areas there may be only one or two options.
30 Ibid
31 IOL News 26 August 2014. “R1bn Joburg broadband project under fire”. Available online:
http://www.iol.co.za/news/south-africa/gauteng/r1bn-joburg-broadband-project-under-fire-1.1741234#.
VS9-JPmUe3I
21Figure 6: Map of WAPA members in South Africa
Source: WAPA (2014) prepared by BMI-Tech Knowledge
Wireless solutions could be used in cities more than they have been up to now, however,
spectrum is a constraint. As BMI-T (2013) notes:
“the failure of ICASA to assign radio frequency spectrum suitable for the provision of
local access services is seen to have held back the introduction of competition into the
local access market. For example, this can be seen to have hindered the introduction
of WiMAX based services between 2005 and 2010” (BMI-T, 2013: 48)
An example of dynamic spectrum usage is the use of so-called television white spaces to
deliver wireless solutions. These could be utilised by providers in South Africa if access was
effectively regulated (Stucke, 2015a). This is an approach which is being explored
internationally and which has had some success in the UK and the US. In South Africa, trials
have been undertaken as will be discussed further in the wireless case study.
In Tshwane, Project Isizwe (a non-profit organisation) is currently rolling out free Wi-Fi access
points across the city, funded by the metro. Already more than 600 sites have been enabled,
with at least one site in every ward across the city. Users can use up to 250 MB of data per
device for free each day and also access educational content via the City’s Tobetsa portal.
The network uses Neotel fibre as well as a range of City infrastructure including hi-sites,
electricity and fibre for free. The project aims to provide internet access to communities who
would not otherwise be able to afford it.
223.2.3 Mobile
The first mobile operators in South Africa – Vodacom and MTN – were licensed in 1993 (BMI-
T, 2013), followed much later by Cell C in 2001 and Telkom Mobile in 2010. The latter two
entrants have struggled to grow their market share, and neither has been profitable to-date
(Hawthorne, 2014). All four MNOs have extensive 3G networks and LTE was introduced in
late 2012 by Vodacom and MTN and in early 2013 by Telkom Mobile. The rollout of LTE has
been slowed to some extent by the delayed digital migration in South Africa which has meant
insufficient spectrum has been available to-date for the rollout of next generation networks
(BMI-T, 2013).
Despite the constraint posed by the lack of spectrum availability, there have been some key
regulatory interventions aiming to stimulate competition in the segment. Number portability
was required from 2005 onwards and call termination rate interventions by ICASA from 2010
onwards seem to have been successful in lowering prices to customers. Hawthorne (2014)
reports that churn has increased to more than 50% for mobile prepaid customers, indicating
an increase in competition. However, they find that churn for post-paid customers is much
lower at 10%, and that this did not change significantly after the introduction of mobile number
portability. This suggests that competition for prepaid mobile customers is more intense than
it is for post-paid customers (Hawthorne, 2014).
The table below illustrates that Vodacom and MTN still dominate the sector in terms of market
share, whether measured by revenue or subscribers. Cell C’s market share is 50% higher
when measured in terms of subscribers than when measured in terms of revenue, suggesting
that it is gaining subscribers by charging low prices to attract consumers.
Table 6: Mobile operator market shares
Operator Market share based on Market share based on
revenue, 2012 subscribers, 2015
Vodacom 52% 38.4%
MTN 37% 33.2%
Cell C 10% 25.1%
Telkom 1% 2.6%
Other 0.7%
Source: Vodacom, MTN and Telkom annual reports
23You can also read