The Economic Impact of Cerebral Palsy in Australia in 2007 - Cerebral Palsy Australia - April 2008
←
→
Page content transcription
If your browser does not render page correctly, please read the page content below
April 2008

The Economic Impact of Cerebral
Palsy in Australia in 2007

Report by Access Economics Pty Limited for

Cerebral Palsy Australia

The Economic Impact of Cerebral Palsy in Australia in 2007

CONTENTS

Glossary of acronyms.........................................................................................................iv
Acknowledgements..............................................................................................................v
Executive summary.............................................................................................................vi
1.     Prevalence and epidemiology ....................................................................................1
       1.1   Definition ..............................................................................................................................1
       1.2   Types of CP .........................................................................................................................2
       1.3   Severity of CP ......................................................................................................................4
       1.4   Aetiology ..............................................................................................................................6
       1.5   Associated risks ...................................................................................................................9
          1.5.1     Musculoskeletal deformities ......................................................................................9
          1.5.2     Intellectual impairment...............................................................................................9
          1.5.3     Speech impairment..................................................................................................10
          1.5.4     Visual impairment ....................................................................................................10
          1.5.5     Hearing impairments................................................................................................10
          1.5.6     Feeding and nutrition ...............................................................................................11
          1.5.7     Urogenital impairments............................................................................................11
          1.5.8     Epilepsy ...................................................................................................................11
       1.6 Mortality and survival rates ................................................................................................12
       1.7 Incidence and prevalence ..................................................................................................15
          1.7.1     Baseline prevalence estimates ................................................................................17
          1.7.2     Projections of future prevalence ..............................................................................18
       1.8 Managing cerebral palsy....................................................................................................19
          1.8.1     Coordinated management .......................................................................................19
          1.8.2     Treatments...............................................................................................................22
2.     Health costs...............................................................................................................25
       2.1   BEACH data for CP ...........................................................................................................26
          2.1.1   GP costs ..................................................................................................................26
          2.1.2   Pharmaceutical costs...............................................................................................28
          2.1.3   Pathology costs .......................................................................................................28
          2.1.4   Specialist costs ........................................................................................................29
          2.1.5   Imaging costs...........................................................................................................29
          2.1.6   Hospital inpatient costs............................................................................................29
       2.2 Summary of CP health costs, 2007 ...................................................................................30
       2.3 Total health system expenditure by bearer........................................................................30
3.     Other financial costs.................................................................................................31
       3.1   Productivity losses .............................................................................................................31
          3.1.1   Employment participation ........................................................................................32
          3.1.2   Absenteeism from paid and unpaid work ................................................................33
          3.1.3   Presenteeism ...........................................................................................................33
          3.1.4   Premature death ......................................................................................................33
          3.1.5   Lost taxation revenue ..............................................................................................34
       3.2 Carer costs.........................................................................................................................35

                                                                                                                                                      i
The Economic Impact of Cerebral Palsy in Australia in 2007
3.2.1 Methodology ............................................................................................................36
3.2.2 Informal and community care costs.........................................................................36
3.3 Direct program services costs............................................................................................37
3.4 Aids and home modifications .............................................................................................39
3.5 Funeral costs......................................................................................................................40
3.6 Deadweight losses from transfers......................................................................................41
3.6.1 Welfare and income support payments ...................................................................41
3.6.2 Deadweight losses...................................................................................................41
3.7 Summary of other financial costs.......................................................................................43
4. Burden of disease .....................................................................................................44
4.1 Methodology – valuing life and health ...............................................................................44
4.1.1 Disability Adjusted Life Years (DALYs) and Quality Adjusted Life Years
(QALYs) ...................................................................................................................45
4.1.2 Discount rates ..........................................................................................................47
4.2 Burden of disease due to CP .............................................................................................48
4.2.1 Disability weights .....................................................................................................48
4.2.2 Years of life lost due to disability .............................................................................49
4.2.3 Years of life due to premature death .......................................................................49
4.2.4 Total DALYs due to CP............................................................................................49
4.2.5 Net value of healthy life lost.....................................................................................50
5. Cost summary, comparisons and challenges.........................................................51
5.1 Cost summary ....................................................................................................................51
5.2 Comparisons ......................................................................................................................53
5.2.1 Prevalence comparisons .........................................................................................53
5.2.2 Cost comparisons ....................................................................................................53
5.2.3 Burden of disease comparisons ..............................................................................54
5.3 Future directions ................................................................................................................55
References..........................................................................................................................59
FIGURES
Figure 1-1: Areas of the body affected in spastic cerebral palsy 3
Figure 1-2: Distribution of CP in WA (% of all CP) 3
Figure 1-3: Severity rates of CP in WA over 20 years (% of all CP) 4
Figure 1-4: Rates of intellectual impairment in people with CP (% total) 10
Figure 1-5: Prevalence of CP, Australia, 2007 (people) 18
Figure 3-1: CP, costs of premature mortality by age and gender ($ million) 34
Figure 3-2: DWL of Taxation 42
Figure 4-1: Loss of wellbeing due to CP (DALYs), by age and gender, 2007 50
Figure 5-1: Financial costs of CP, by type of cost (% total) 52
Figure 5-2: Financial costs of CP, by bearer (% total) 52
iiThe Economic Impact of Cerebral Palsy in Australia in 2007
TABLES
Table 1–1: Distribution of CP types, children born in Victoria between 1990 and 1992 4
Table 1–2: CP - comparisons of activity limitations, Australia, 2003 6
Table 1–3: Prevalence of impairments among people with cerebral palsy (SCPE) 12
Table 1–4: Estimated survival percentages, conditional on being alive at age 20 years
(UK study) 13
Table 1–5: Crude and standardised mortality rates per 1,000 person years by age (WA,
1956-1994) 14
Table 1–6: CP deaths in children aged 0-14 years, 1991-2003 15
Table 1–7: People with a disability who had CP, by age and type of special dwelling,
Australia, 2003 16
Table 1–8: CP - comparisons of main disability groups, 2003 17
Table 1–9: CP, projected prevalence to 2050, Australia (people) 19
Table 2–1: CP GP costs 27
Table 2–2: CP pharmaceutical costs 28
Table 2–3: CP specialist referrals by type 29
Table 2–4: Total CP health system expenditure, 2007 30
Table 2–5: Distribution of CP health costs, 2007 30
Table 3–1: Lost earnings and taxation due to CP, 2007 35
Table 3–2: Expenditure on direct services for clients with CP, 2007 38
Table 3–3: CP, aids and equipment prices, estimated product life and total costs, 2007 40
Table 3–4: Summary of other financial costs of CP, 2007 43
Table 4–1: International estimates of VSL, various years 47
Table 4–2:CP, combined disability weight 49
Table 4–3: Estimated years of healthy life lost due to disability (YLD), 2007 (DALYs) 49
Table 4–4: Years of life lost due to premature death (YLL) due to CP, 2007 49
Table 4–5: Net cost of lost wellbeing, $million, 2007 50
Table 5–1: CP, total costs by type of cost and bearer, Australia, 2005 ($ million) 51
Table 5–2: CP, costs by type of cost and bearer, Australia, 2005 ($ per capita) 51
Table 5–3: CP, prevalence comparisons with other conditions 53
Table 5–4: CP, total cost comparisons with other conditions ($ billion) 54
Table 5–5: CP, disability weight comparisons with other conditions 54
iiiThe Economic Impact of Cerebral Palsy in Australia in 2007
GLOSSARY OF ACRONYMS
ABS Australian Bureau of Statistics
ADHD Attention Deficit Disorder with Hyperactivity
AGPSCC Australian General Practice Statistics and Classification Centre
AIHW Australian Institute of Health and Welfare
AMA Australian Medical Association
ART assisted reproduction therapies
AWE Average Weekly Earnings
BEACH Bettering the Evaluation and Care of Health
BT-A botulinum toxin
BTE Bureau of Transport Economics
CP cerebral palsy
CSDA Commonwealth State Disability Agreement
DALY Disability Adjusted Life Year
DSP Disability Support Pension
DWL deadweight loss
GDP Gross Domestic Product
GMFCS Gross Motor Function Classification Scheme
GORD Gastro-oesophageal reflux disease
GP general practitioner
IQ Intelligence Quotient
IUGR intrauterine growth restriction
MBS Medicare Benefits Schedule
NHPA National Health Priority Area
NOHSC National Occupational Health and Safety Commission
OECD Organization for Economic Cooperation and Development
PPP purchasing power parity
QALY Quality Adjusted Life Year
SCPE Surveillance of Cerebral Palsy in Europe
SDAC Survey of Disability, Ageing and Carers (ABS)
SES socioeconomic status
SWS Supported Wage System
UK United Kingdom
VSL(Y) Value of a Statistical Life (Year)
WA Western Australia
YLD Years of healthy life Lost due to Disability
YLL Years of Life Lost due to premature death
ivThe Economic Impact of Cerebral Palsy in Australia in 2007
ACKNOWLEDGEMENTS
Access Economics acknowledges with gratitude the comments and expert input from:
Michael Bink
Head of Research and Community Development, Scope
Eve Blair
Associate Professor, Cerebral Palsy Studies, Telethon Institute for Child Health Research
Robyn Cummins
Manager Information Services, The Spastic Centre, New South Wales
Anita Ghose
General Manager, Corporate Development, The Centre for Cerebral Palsy, Western
Australia
Deborah Hoffman
General Manager, Strategy, Research and Planning, The Spastic Centre, New South Wales
John Knowles
President, CP Australia
Sarah McIntyre
Sargents Research Fellow, CP Institute
Iona Novak
Head of Research, CP Institute
Linda Watson
Manager, WA Cerebral Palsy Register, Telethon Institute for Child Health Research
Rob White
Chief Executive Officer, The Spastic Centre, New South Wales
vThe Economic Impact of Cerebral Palsy in Australia in 2007
EXECUTIVE SUMMARY
Cerebral palsy (CP) refers to a range of motor disorders arising from a non-progressive
defect or damage to the developing brain in a baby or infant. CP is associated with many
perinatal factors (such as maternal iodine deficiency, rubella or cytomegalovirus infection),
preterm birth, intrauterine growth restriction, birth asphyxia, multiple pregnancy and
occasionally with postneonatal factors such as head trauma or cerebral infections.
Motor disability ranges from minimal to profound, and there are increased risks of intellectual,
speech, vision, hearing, endocrine and urogenital impairments and epilepsy, which can
greatly contribute to overall disability. There is no pre-birth test for CP, and there is no cure.
CP in Australia
Access Economics used Western Australian, Victorian and South Australian CP Register
data (the only three jurisdictions with long term CP data available), combined with data on
births and deaths from the Australian Bureau of Statistics (ABS) and triangulated against
incidence and prevalence rates from the international literature, to estimate the prevalence of
CP in Australia. Overall, 33,797 Australians are estimated to have CP in 2007.
CP is a life long condition; disability increases with age, and ageing occurs earlier (and
possibly for longer).
The number of Australians with CP is projected to increase as the population
grows (to around 47,601 by 2050), although the share remains at about 0.2% of the
population.
PREVALENCE OF CP BY AGE, 2007 (NUMBER OF PEOPLE)
3,000
2,500
2,000
1,500
1,000
500
0
0-4
5-9
90+
10-14
15-19
20-24
25-29
30-34
35-39
40-44
45-49
50-54
55-59
60-64
65-69
70-74
75-79
80-84
85-89
Costs of CP
Costs of CP were estimated from a variety of sources including:
Bettering the Evaluation and Care of Health (BEACH) data together with Australian
Institute of Health and Welfare (AIHW) data for health system expenditures;
data from CP registers for productivity costs;
viThe Economic Impact of Cerebral Palsy in Australia in 2007
data from ABS Survey of Disability, Ageing and Carers (SDAC) to estimate the cost of
informal care, aids and equipment;
Centrelink data to estimate welfare expenditures.
In 2007, the financial cost of CP was $1.47 billion (0.14% of GDP). Of this:
1.03 billion (69.9%) was productivity lost due to lower employment, absenteeism and
premature death of Australians with CP;
141 million (9.6%) was the DWL from transfers including welfare payments and
taxation forgone;
131 million (9.0%) was other indirect costs such as direct program services, aids and
home modifications and the bringing-forward of funeral costs;
129 million (8.8%) was the value of the informal care for people with CP; and
40 million (2.8%) was direct health system expenditure.
Additionally, the value of the lost wellbeing (disability and premature death) was a
further $2.4 billion.
In per capita terms, this amounts to a financial cost of $43,431 per person with CP per
annum. Including the value of lost wellbeing, the cost is over $115,000 per person per
annum.
Individuals with CP bear 37% of the financial costs, and their families and friends bear a
further 6%. Federal government bears around one third (33%) of the financial costs (mainly
through taxation revenues forgone and welfare payments). State governments bear under
1% of the costs, while employers bear 5% and the rest of society bears the remaining 19%.
If the burden of disease (lost wellbeing) is included, individuals bear 76% of the costs.
FINANCIAL COSTS OF CP, BY TYPE OF COST (% TOTAL)
Health System Costs
DWL
2.8%
9.6%
Other Indirect Costs
9.0%
Carer Costs
8.8%
Productivity Costs
69.9%
viiThe Economic Impact of Cerebral Palsy in Australia in 2007
FINANCIAL COSTS OF CP, BY BEARER (% TOTAL)
Society/Other
18.6%
Individuals
Employers 36.7%
5.1%
State Government
0.8%
Federal Government
32.8%
Family/Friends
6.1%
Compared to other health conditions, CP is:
more common in any year than the most common types of cancer, stroke, eating
disorders, appendicitis or road traffic accidents;
in the top five most costly conditions on a per capita basis of 15 conditions studied by
Access Economics in recent years; and
a condition with a higher disability burden than being blind, deaf, having severe asthma
or diabetes. CP is also more disabling than having heart failure, localised cancer or the
most severe forms of Attention Deficit Disorder with Hyperactivity (ADHD).
Future directions
The analysis in this report underscores that lifetime costs are higher for conditions with onset
earlier in life. To this end, the following strategies are recommended.
Research: There is a need for more research into the ‘cause, care and cure’ of CP,
given current knowledge limitations and the scope for future gains.
3 An Australian CP Register was launched in 2007, bringing together data from
existing registers, adding all other states and territories into a national dataset.
The Spastic Centre’s Cerebral Palsy Institute acts as the national custodian of
the Australian CP Register.
3 Delphi Study - 120 experts from around the world have agreed on the following
areas as a high priority for research into CP:
(1) the aetiology and prevention of CP: genetics, infection/ inflammation/
immunity, coagulation, asphyxia/ischaemia, timing of injury and brain repair
possibilities; and
(2) living with CP: improving quality of life for people with CP and their families;
increasing function and participation; minimising deformity; effectiveness of
interventions and their long-term outcomes; most effective service models;
families' role in maximising outcomes; effective personal supports.
viiiThe Economic Impact of Cerebral Palsy in Australia in 2007
Diagnosis and early intervention: Education and support programs for mainstream
primary care, peri and post-natal services are important to assist with earlier differential
diagnosis, to reduce misdiagnosis and to reduce the long lags between onset of
symptoms and treatment with provision of intervention services.
Health service delivery issues: There is a need to better address the complications
of CP and develop coordinated management strategies. Other core issues to address
are:
3 ongoing, timely access to appropriate medications, including for pain
management, muscle relaxation and seizure control;
3 timely access to surgical procedures in public hospitals – in particular, minimum
acceptable wait times for anatomical correction surgeries;
3 timely access to allied health professionals, counselling, orthotic and related
services (including associated medical aids and equipment such as wheelchairs)
through public hospital outpatient departments and other community programs;
and
3 workforce training and infrastructure development to ensure service provider
capacity across Australia in government, non government and private sectors in
specialist and generic services.
Employment initiatives: Employment programs are required to enhance employment
opportunities, retention and adaptation of existing jobs for people with CP, including
innovative strategies such as extension of employer incentive schemes, job
restructuring or tailoring, part-time and flexible work-from-home options, and transport
assistance, as appropriate, together with awareness strategies to counter workplace
misperceptions and discrimination.
Policies to assist carers: Design and delivery of extended relevant support, education
and respite services to assist the large proportion of people with CP who are
profoundly disabled and live at home, with informal care provided by parents and other
family members, and an emphasis on employment continuity for carers.
Appropriate accommodation: There is a shortage of age-appropriate day care and
longer term disability housing for young people with CP. Alternative and better
coordinated models of care need to be established across the Commonwealth and
State jurisdictions to result in more seamless, flexible and multidisciplinary care and
age-appropriate accommodation services.
Transport, equipment and home modifications: People with CP and their families
and carers frequently require assistance with mobility, communication and transport.
Wheelchairs, walkers and splints, ramps, showering and bathing aids are still financed
largely out of pocket by people with CP and their families and carers. Better access to
assistance in these areas is necessary to address the unmet need and to provide
reimbursement for large items in a timely manner. Innovative new practices could be
developed to improve access to mainstream leisure and recreational services as well
as activities of daily life (shopping, attending appointments, going to work).
Financing reforms: Consideration needs to be given in the next election cycle (2007-
2010) to methods for long term financing of health and disability care needs; in
particular, to devise ways of channelling private sector resources more effectively to
enhance care and outcomes, including through purpose specific savings programs
(such as Health Savings Accounts), access to preserved superannuation lump sums
for younger people with disabilities, and Disability Trusts to fund accommodation and
support services through public-private partnerships.
Disadvantaged groups: It is recommended that CP services reflect the different
needs of different groups of people, in particular people who live in rural and remote
ixThe Economic Impact of Cerebral Palsy in Australia in 2007
regions of Australia and/or who are indigenous Australians or are from culturally and
linguistically diverse backgrounds.
Access Economics
April 2008
xThe Economic Impact of Cerebral Palsy in Australia in 2007
1. PREVALENCE AND EPIDEMIOLOGY
Cerebral palsy (CP) is the most common physical disability in childhood, with around
600 to 700 infants being born with CP in Australia each year. The rate of 2-2.5 cases of
CP per 1,000 live births has remained relatively stable over the last 60 years. This is despite
a significant increase in medical intervention throughout pregnancy and childbirth having led
to reduced stillbirth and neonatal death rates. While much is known about the risk factors
associated with CP, in many cases its underlying causes remain unknown. The disorder
manifests early in life and is a permanent condition.
1.1 DEFINITION
CP has traditionally been difficult to define, although there are five key elements that any
definition should include. CP is (1) an umbrella term (2) for a group of disorders of
movement and/or posture, which is (3) permanent but not unchanging, (4) due to a non-
progressive defect or lesion (5) in the developing immature brain (Surveillance of Cerebral
Palsy in Europe1, 2000). ‘Cerebral’ refers to the brain and ‘palsy’ means weakness or lack of
muscle control.
A recent definition, used in this report, is:
“CP describes a group of disorders of the development of movement and
posture, causing activity limitation, that are attributed to non-progressive
disturbances that occurred in the developing foetal or infant brain. The motor
disorders of CP are often accompanied by disturbances of sensation, cognition,
communication, perception, and/or behaviour, and/or by a seizure disorder”
(Bax et al, 2005).
The definition encompasses the conceptualisation of disability in the International
Classification of Functioning, Disability and Health, where activity limitation is conceived as a
component of disability. The definition also expands the notion of CP by recognising other
associated impairments (eg, sensory and cognitive) often experienced alongside motor
impairment. The definition has been published for consideration by a wide range of CP
specialists and builds upon the work of earlier definitions. The severity of disability
associated with CP is highly variable, depending on the area of the body that is affected and
the type and severity of impairments.
In most cases the precise cause of this injury is unknown. Physical disability can range from
minimal (eg, weakness in one hand without discernible effects on activities of daily living) to
profound (eg, permanently restricted to a wheelchair and unable to eat or speak
independently, requiring 24 hour care). Associated impairments occur for many people with
CP and increase the complexity of management for the family, carers and the
multidisciplinary teams involved in minimising disability and maximising quality of life. CP can
be a complex and debilitating disability. There is no pre-birth test, and there is no cure (The
Spastic Centre, 2007).
1
The Surveillance of Cerebral Palsy in Europe (SCPE) is a study of CP across six different European Union
countries.
1The Economic Impact of Cerebral Palsy in Australia in 2007
1.2 TYPES OF CP
CP can have substantial effects on both function and health-related aspects of quality of life
for the individual and their family. The effect of CP on each person differs, and depends on
the type of CP and the severity. Although classification of CP is complex and has been
subject to debate among experts, traditional classification of CP is based on the type and
bodily distribution of motor impairment, accompanied by a description of associated
impairments.
Spasticity is the predominant type of CP (comprising around 80% of all CP) (Australian CP
Register, 2006). Areas of the body affected by spasticity can have increased deep tendon
reflexes, tremors, weakness and a characteristic scissors gait with toe walking (Krigger,
2006). The muscles are stiff, there is abnormal control of voluntary limb muscles and
coordination is difficult. Spasticity is comprised of right and left hemiplegia, diplegia and
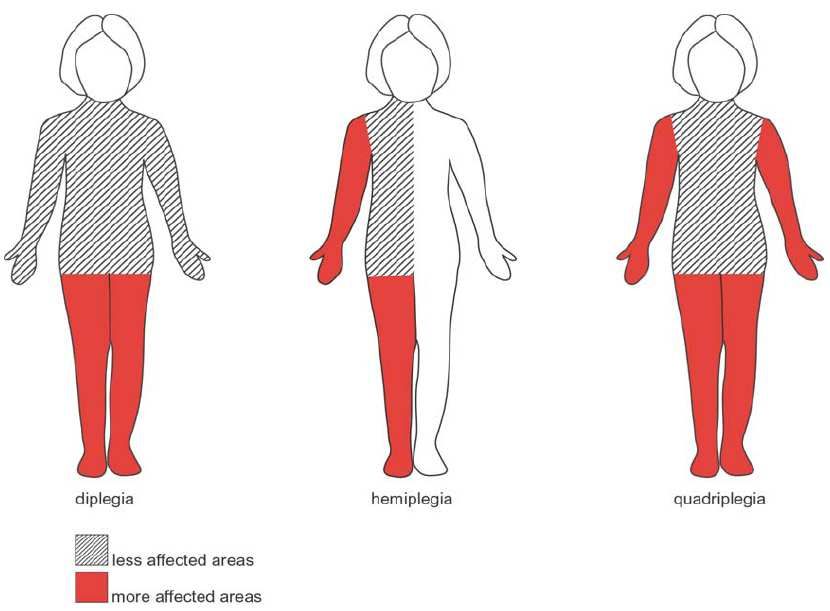
quadriplegia. Figure 1-1 shows the areas of the body affected and Figure 1-2 shows the
distribution of these types over time in WA.
Hemiplegia is the involvement of only one side of the body. The upper limb is usually
more affected than the lower limb and makes fine motor activities and daily living
activities particularly difficult.
Diplegia describes the involvement of the lower limbs to a greater extent than the
upper limbs.
Quadriplegia refers to all four limbs being involved, with arms equally or more affected
than the legs (The Spastic Centre, 2003).
Dyskinesia is reported in around 10-12% of people with CP. It includes dystonic and
athetoid forms of CP and is often found in conjunction with spasticity (Stanley et al, 2000). It
can result in rigid posturing including grimacing (sometimes referred to as dystonia) or in
abnormally slow, writhing movements (sometimes referred to as athetosis) which are
exacerbated during periods of stress and when concentrating, but absent during periods of
sleep (Krigger, 2006). Difficulty in coordinating muscles for speech (dysarthria) is also
common in people with dyskinesia.
Ataxia and hypotonia occur quite often in people with other types of motor impairment but,
when considered as the primary motor impairment, are the least common forms of CP.
Ataxic CP (6-9%) is characterised by problems with balance and depth perception, an
unsteady wide-based gait, and poor coordination particularly when attempting fine motor
activities. Hypotonia, particularly truncal hypotonia, is often found in persons with CP, but
isolated hypotonia (diminished muscle tone without other signs of motor impairment that
cannot be explained by cognitive impairment) may affect around 1-2% of people with CP.
Figure 1-2 outlines the distribution of CP over time using data from the WA CP Register. It
confirms the dominance of spastic CP and the decrease in quadriplegia over time, which
probably represents a changing tendency to classify mixed spastic/dyskinetic CP as
predominantly dyskinetic rather than predominantly spastic. In non-spastic CP, dyskinesia is
most common, closely followed by ataxia.
It should be noted that classification for some individuals is difficult since any
combination of these motor impairments may occur. The predominant type may also
change over time for a particular person (Krigger, 2006; Stanley et al, 2000).
2The Economic Impact of Cerebral Palsy in Australia in 2007
FIGURE 1-1: AREAS OF THE BODY AFFECTED IN SPASTIC CEREBRAL PALSY
Source: The Spastic Centre (2003).
FIGURE 1-2: DISTRIBUTION OF CP IN WA (% OF ALL CP)
45
1970-74
40
1975-79
35 1980-84
30 1985-89
1990-94
25
1995-99
20
15
10
5
0
Ataxia Dyskinesia Hypotonia Hemiplegia Diplegia Quadriplegia
Source: WA CP Register (2006).
A study of the Victorian CP Register shows similar distributions to those reported above.
Around 86% of children with CP experienced a spastic motor type, which was relatively
evenly distributed between spastic hemiplegia, diplegia and quadriplegia. The other groups
3The Economic Impact of Cerebral Palsy in Australia in 2007
were dyskinesia and mixed, which together accounted for 8% of cases, while the remaining
motor types (ataxic, hypotonic) represented 5.6% of the total (Table 1–1) (Howard et al,
2005).
TABLE 1–1: DISTRIBUTION OF CP TYPES, CHILDREN BORN IN VICTORIA BETWEEN 1990 AND 1992
Number %
Spastic
Hemiplegia 98 30.3%
Diplegia 78 24.1%
Quadriplegia 103 31.9%
Total spastic 279 86.4%
Dyskinesia 5 1.5%
Mixed 21 6.5%
Ataxia 9 2.8%
Hypotonia 9 2.8%
Total cohort 323 100.0%
Source: Howard et al (2005).
1.3 SEVERITY OF CP
Severity of CP has traditionally been based on the severity of the motor impairment, with a
particular emphasis on function and mobility.2 Approximately 50% of individuals with CP are
able to walk independently, 25% can walk with an assistive device and 25% are unable to
walk (Koman et al, 2004).
FIGURE 1-3: SEVERITY RATES OF CP IN WA OVER 20 YEARS (% OF ALL CP)
45
40
35
30
25 Minimal
Mild
20
Moderate
15 Severe
10
5
0
1975-79 1980-84 1985-89 1990-94 1995-99
Source: WA CP Register (2006).
As can be seen in Figure 1-3 (from the WA Register), the proportion of CP categorised as
severe has almost doubled over this period and the reason for this is unknown, although one
hypothesis is the increased survival of infants with significant impairments. Data from WA
2
Recent classification schemes to evaluate severity such as the Gross Motor Function Classification Scheme
(GMFCS) (Palisano et al, 1997) focus more on functional abilities, rather than distribution and type of impairment.
4The Economic Impact of Cerebral Palsy in Australia in 2007
and other registers throughout the world have found the increase in severity to be in the
group born at term (37-42 weeks). The greater the severity of CP, the greater the risk of
associated impairments.
Similarly, AIHW (2005) reported that most people surveyed with CP had severe and
profound levels of disability (Table 1–2). Corresponding to a high proportion of comorbidities
and multiple disabilities, more than half of people with CP needed help with at least two core
activities. For people with CP, more than half had a severe or profound limitation either with
self-care or mobility or both, and about 40% had that limitation with communication. Over
40% of people with CP were also using aids or equipment for mobility or communication
activities.
5The Economic Impact of Cerebral Palsy in Australia in 2007
TABLE 1–2: CP - COMPARISONS OF ACTIVITY LIMITATIONS, AUSTRALIA, 2003
No (’000) %
Level of self-care limitation
Profound *8.6 *53.2
Severe **1.9 **11.5
Moderate **1.1 **7.0
Mild **0.3 **2.0
Level of mobility limitation
Profound *7.3 *45.4
Severe **1.2 **7.3
Moderate **0.5 **3.2
Mild *5.2 *32.4
Level of communication limitation
Profound *5.3 *33.2
Severe **1.1 **6.7
Moderate **1.4 **8.5
Mild — —
Need assistance with core activities
Only one of the three *2.4 *15.2
Self-care and mobility *3.7 *23.3
Self-care and communication **0.2 **1.1
Mobility and communication — —
All three core activities *4.4 *27.3
No need for help *5.3 *33.2
The highest frequency of need for assistance (any core activities)
6+/day *6.5 *40.7
3–5/day **1.4 **8.5
2/day **1.5 **9.5
1/day **0.4 **2.3
2–6/week — —
1/week **0.6 **3.8
1–3/month **0.3 **2.1The Economic Impact of Cerebral Palsy in Australia in 2007
unclear, CP may occur as a result of problems associated with preterm birth or may indicate
an injury has occurred during the pregnancy that has caused the baby to be born early.
Causal pathways to CP may involve:
1) preconceptual or early pregnancy factors (eg, if the mother is
exposed to infections such as German measles or genetic anomalies);
2) preterm birth;
3) abnormal intrauterine growth (or the baby not growing at the correct
rate during pregnancy);
4) birth asphyxia where the deprivation of oxygen during labour and
delivery exceeds the baby’s capacity to compensate for it;
5) multiple pregnancies/births;
6) postneonatally acquired brain injuries where an infant can develop
an infection such as meningitis or encephalitis, which may result in brain
damage. Brain injuries can also be acquired through other events
including near drowning or car accident (Stanley et al, 2000).
It is important to note that in many people the cause of CP remains unknown, despite
a careful review and various tests (Stanley et al, 2000).
For 80% of people with CP, the cause of the brain damage responsible for their
disability is unknown. Current statistics suggest that prenatal causes (during
pregnancy) account for 75% of all cases of CP, perinatal causes (around the time of
birth) account for between 5-8%, and postnatal causes (after 28 days of life) account
for 10-18% of cases (Stanley et al, 2000; Blair and Watson, 2006), but factors from
each of these periods may act synergistically. Within each of these categories, there
are some known and many unknown causes and causal pathways.
For many years, research focused on a single cause of CP (birth asphyxia around the time of
birth). However, focusing on this as the cause of CP resulted in no change in incidence.
Researchers are now attempting to separate and understand the many causes or pathways
to CP, with a view to indentifying steps on those pathways at which they may be most
effectively and acceptably interrupted, thus resulting in the prevention of some cases of CP
(Stanley et al, 2000).
There are a number of diagnostic and preventive strategies corresponding to the various
causal pathways of CP.
1) Preventive interventions effective against early pregnancy pathways include rubella
vaccination, iodine supplementation in areas of severe deficiency, preventing methyl-
mercury contamination and anti-D vaccination. These practices are now well
established in Australia, and therefore are unlikely to further reduce incidence (Stanley
et al, 2000; Blair et al, 2006).
2) Preterm birth (gestational specific survival rates are increasing). The risk for CP
increases as the gestational age at delivery and birthweight decreases. The reasons
for CP in preterm birth may either lie with the cause of the preterm birth (particularly
infection), or simply with the fact that very preterm infants are fragile (prone to cerebral
haemorrhage, ischaemia as a result of lack of homeostatis – too much or too little
7The Economic Impact of Cerebral Palsy in Australia in 2007
oxygen, too much or too little carbon dioxide, too much vibration, and so on – or
neonatally acquired infections). Anything that increases survival, increases the
possibility that brain damage acquired for any reason will become apparent as CP.
Postnatal steroids may damage the brain directly (directly increasing the CP rate) but
may also increase survival (with the potential to increase CP rates indirectly). In
contrast, lung surfactant does not damage the brain directly, but does increase
survival.
3) For an infant to have intrauterine growth restriction (IUGR) some pathological factor
must have restricted its growth. This is difficult to identify and growth restriction is
usually inferred from the newborn being smaller than would be expected, given non-
pathological determinants of newborn size.3 IUGR has been associated with an
increase in the risk of CP, particularly for moderately preterm (32–36 weeks gestation)
(Yanney and Marlow, 2004) and term infants (Jacobsson and Hagberg, 2004). Infants
who have IUGR are four to six times more likely to develop CP than infants without
IUGR (Stanley et al, 2000).
4) Birth asphyxia was for a long time the presumed cause of most CP. As a result,
research focussed on the time of birth as the point at which to medically intervene to
reduce incidence of CP. Electronic foetal monitoring was introduced and it was thought
that by monitoring babies’ heart rates obstetricians would be able to intervene when the
baby became distressed prior to the occurrence of irreversible brain damage. This did
not occur; instead caesarean section rates rose and CP rates stayed the same
(Nelson, 2003). Research now suggests that birth asphyxia accounts for 5-8% of those
who have CP. For birth asphyxia to be diagnosed there must be evidence of hypoxia
(lack of oxygen), a decompensatory response by the infant and neonatal
encephalopathy with no other obvious cause (Stanley et al, 2000).
5) Multiple births account for approximately 5-10% of all cases of CP. The risk of CP
increases with the number of babies in any one pregnancy. Twins are six times and
triplets are 18 times more likely to develop CP than singletons. If a co-twin dies at any
point throughout the pregnancy the surviving twin is 100 times more likely to have CP
than a singleton. Multiple births tend to have a shorter gestation period, are more likely
to have IUGR and are at risk of twin-twin transfusion syndrome. Multiple births are
becoming an increasing issue as maternal age and use of assisted reproduction
therapies (ARTs) increase4 (Nelson, 2003; Blair et al, 2006).
6) Postneonatally acquired CP is difficult to define, although it is usually described as
occurring after 28 days of life in an infant who was thought to be neurologically normal.
There must also be a definite event that can be linked to brain damage and considered
to be the cause. In population research in developed countries the percentage of
people with postneonatally acquired CP varies from approximately 5% in Scandinavian
countries to 11-18% in Australia, the United Kingdom and the United States (Stanley et
al, 2000).
There is still much to learn about the complex biological mechanisms and causal pathways to
CP. Known pathways only account for a proportion of CP; there are many unknown causal
pathways and steps on known pathways still to be identified. There might also be links
between pathways.
3
It is important that gestational age is accurate so that ‘prematurity’ and ‘small for gestational age’ can be
differentiated. With the increase of ultrasound dating, gestational age estimates are becoming more reliable
(Stanley et al, 2000).
4
ARTs have a higher likelihood of multiple births and, after age 35, women are more likely to naturally conceive
twins.
8The Economic Impact of Cerebral Palsy in Australia in 2007
1.5 ASSOCIATED RISKS
The likelihood and severity of associated impairments increases with the severity of motor
impairment. It has been reported that for individuals with a severe motor impairment up to
70% will have epilepsy, 50% will have a severe intellectual impairment, 55% will be non-
verbal, 25% will be blind and 3% will be deaf (Stanley et al, 2000; Watson et al, 1999;
Odding et al, 2006). Many will have a number of these impairments, and their presence
complicates therapy, decreases health status and quality of life for the individual and their
family, and increases costs for the family and society.
1.5.1 MUSCULOSKELETAL DEFORMITIES
A primary motor impairment, especially spasticity, may lead to secondary impairments of the
musculoskeletal system. For example, a recent study using Victorian data has shown that
the prevalence of hip migration is dependent on severity of functional impairment, and is
found in about 90% of the most severely affected (GMFCS=V) reducing rapidly in frequency
(to none in GMFCS=I). Other common musculoskeletal impairments found in this population
include contractures, scoliosis and accompanying pain.
1.5.2 INTELLECTUAL IMPAIRMENT
Intellectual impairment is characterised by low general intellectual functioning (measured by
IQ scores) combined with adaptive behaviour difficulties, with these problems manifesting
before the age of 18 (AIHW, 2002). CP Registers usually accept that an IQ below 70
represents intellectual impairment, with IQ between 70-85 being classified as borderline.
Practically, this means that people with an intellectual impairment have difficulty with
activities such as reasoning, remembering, learning new skills, attending and organising
information. This in turn makes communicating, learning self-care, social and personal safety
skills difficult. The more severe the impairment, the less likely an individual will attain social
outcomes such as securing a job, getting married, having children and participating in adult
education (Hall et al, 2005).
SCPE data suggest that between 23% to 44% of people with CP have cognitive
difficulties including mental retardation and behavioural problems such as hyperactivity
(Table 1–3) (Odding et al, 2006). Australian data have similar findings which
consistently put the number at around 40% (noting that Table 1–8 in section 1.7 shows
59%). Figure 1-4 presents the estimated distribution of intellectual impairment in people
with CP in Australia.
9The Economic Impact of Cerebral Palsy in Australia in 2007
FIGURE 1-4: RATES OF INTELLECTUAL IMPAIRMENT IN PEOPLE WITH CP (% TOTAL)
5%
18%
Normal/borderline IQ 70+
Mild/moderate IQ 35-69
Severe/profound IQ 0-34
Unknown
57%
20%
Source: Australian CP Register (2006).
1.5.3 SPEECH IMPAIRMENT
Communication disability can have a major impact on the individual with CP. Impairment in
this domain can impact on both understanding of language and expression. The impact on
day-to-day life crosses all domains, including the ability to both form and maintain
relationships. For individuals who have severe communication impairment, social isolation
and poor self-esteem can result. SCPE data suggest that speech impairment is common
(42%-81%) and is strongly associated with the type and severity of motor impairment (Table
1–3). Further, approximately 25% of people with CP are non-verbal.
Australian data indicate that around 56% of people with CP have some level of speech
impairment (Table 1–8). WA data suggest that the proportion of people with CP who
are nonverbal is increasing, approximately 10% for people with CP born in 1975-79
and 25% for those born during the 1990s (WA CP Report to birth year 1999, released
July 2006).
1.5.4 VISUAL IMPAIRMENT
Vision impairments can range from mild to functional blindness and may involve strabismus5.
Registers report that the rate of those with CP who are functionally blind has been steady at
around 10% for 30 years. Rates of visual impairment without functional blindness are much
higher, with SCPE data indicating that 71% of children with CP are reported to have low
visual acuity (Table 1–3).
1.5.5 HEARING IMPAIRMENTS
Hearing impairments can also range from a mild impairment to bilaterally deafness.
Registers report that bilateral deafness occurs in around 3% of people with CP; other hearing
impairments occur in many more (Table 1–3).
5
Sometimes called “crossed eyes” in young children, this condition is the lack of coordination between the eyes,
such as one or both eyes turning in, out, up or down.
10The Economic Impact of Cerebral Palsy in Australia in 2007
1.5.6 FEEDING AND NUTRITION
A large proportion of people with CP have difficulties in relation to both feeding and nutrition.
For many infants with CP, problems with sucking and swallowing in the first 12 months of life
are common and often precede the diagnosis of CP. Some studies have noted rates as high
as 56% of infants having sucking problems and 28% experiencing swallowing difficulties
(Reilly et al, 1996). For children with CP who have dyphagia, silent aspiration occurs at a
high frequency (estimated in some studies to be as much as 97%) making detection more
difficult and increasing the likelihood of respiratory problems in this population (Rogers et al,
1994). Gastro-intestinal impairments (gastroesophageal reflux and constipation) are
common for children and adults with CP and it is thought to effect an estimated 70% of this
population (Sullivan et al, 2001; Reyes et al, 1993). Almost a quarter of CP children have
stunted growth. Finally, bone mineral density in children and adolescents with spastic CP
varies greatly but averages one standard deviation below the age-matched normal averages.
Table 1–3 shows prevalence rates of feeding growth and weight problems.
1.5.7 UROGENITAL IMPAIRMENTS
Almost 25% of children and adolescents with CP have primary urinary incontinence (Table
1–3). Quadriplegia and low intellectual capacity are the most important determinants.
1.5.8 EPILEPSY
It has been reported that epilepsy occurs in up to 40% of people with CP (Table 1–3). For
some, epilepsy may have resolved by the age of five years. Epilepsy is defined by recurrent
seizures. Seizures are the result of a disruption to the normal electrical activity of the brain
(Epilepsy Association of Australia, 2006). This can occur after a brain injury or brain
malformation, which may also be the cause of CP. Although medications may control
seizures relatively well in the general population, they may be more difficult to control in
individuals with CP, thus complicating treatment. The added presence of epilepsy in people
with CP has the potential to severely limit quality of life as well as being potentially life
threatening.
11The Economic Impact of Cerebral Palsy in Australia in 2007
TABLE 1–3: PREVALENCE OF IMPAIRMENTS AMONG PEOPLE WITH CEREBRAL PALSY (SCPE)
Impairment % Subgroups %
Motor 100 Spasticity 72 – 91
Other 9 – 28
Cognitive 23 – 44 With epilepsy 59 – 77
Without epilepsy 18 – 50
Severe 30 – 41
Speech 42 – 81
Visual 62 – 71 Severe 24
Strabismus 50
Hemianopsy 15 – 25
Moderate 16
Severe 10
Hearing 25 Moderate 1
Severe 2
Epilepsy 22 – 40
Feeding Choking 56
Long feeding time 28
Nonorally 80
Gastrointestinal Constipation 59
Vomiting 22
Growth 23
Weight 52 Undernourished 30
Overweight 14
Obesity 8
Urinary 23.5
incontinence
Source: Odding et al (2006).
1.6 MORTALITY AND SURVIVAL RATES
Survival in people with CP has improved considerably. This is due to changes in various
medical and social factors, such as improved intensive care procedures, use of antibiotics,
greater integration of people with disabilities into the community, and a better
responsiveness to the rights of people with disabilities. These improvements have meant
more and more people with CP are living into their adult years (CP Australia, 2005). In two
studies reported in the same region of the UK, 23% of children with CP born in 1958 had
died by the age of ten, compared to no children with CP born in 1970 (Emond et al, 1989).
There is increasing survival in infants born with extremely low birth weight. Neonatal
Intensive Care Units and antibiotics are two of the reasons why mortality for infants is
decreasing. However, of those surviving only 25% do not have a disability (Mikkola et
al, 2005).
Improved care in the areas of respiratory infections, the use of enteral feeding, the
closure of institutions in favour of care in the home and improved computer technology
for communication are enabling those with severe CP to live until older age. Those now
in their fifties to seventies are the first of this group to be followed. Survival outlook is
good, although it is lower than that of the general population. In one study in the UK,
85% of the cohort of adults with CP (who had survived to age 20) survived to age 50
compared to 96% of the general population (Table 1–4) (Hemming et al, 2006).
12The Economic Impact of Cerebral Palsy in Australia in 2007
However, this group would have had relatively little access to antibiotic treatment in
childhood, which is likely to explain their lower frequency of severe motor disability
compared with the 1966-69 born comparison cohort described in that study. They are
therefore likely to experience a lower mortality rate since, in adults with CP, mortality is
highest for those who have severe physical impairments impeding mobility and feeding
in combination with intellectual disability (Strauss and Shavelle, 1998; Blair et al, 2001).
However, even this group is surviving longer and this trend is likely to continue into the
future.
TABLE 1–4: ESTIMATED SURVIVAL PERCENTAGES, CONDITIONAL ON BEING ALIVE AT AGE 20
YEARS (UK STUDY)
30y 40y 50y 60y
Observed and expected
Bristol 94 (91–97) 91 (88–94) 84 (80–88) 70 (61–79)
Mersey 98 (96–100) 93 (89–97) – –
English life table 99 98 96 90
Decade
1940s 95 (91–98) 91 (86–96) 84 (78–90) 70 (60–80)
1950s 94 (90–98) 91 (87–95) 85 (79–91) –
Sex
Male 93 (89–97) 89 (85–94) 81 (75–87) 70 (60–80)
Female 96 (93–99) 93 (89–97) 89 (84–94) 69 (49–88)
Source: Hemming et al (2006).
Using the WA CP Register, Blair et al (2001) estimated mortality rates for people with CP
born between 1956 and 1994. The study considered 2,014 people born with CP of whom 225
were known to have died by 1 June 1997. The crude mortality rate for the sample was 6.23
deaths per 1,000 person years and 5.96 for people aged 1 year or more. Standardised
mortality ratios were particularly high from ages 1 to 15 (Table 1–5), and still between four to
five times the population rates for those aged 15-40 years.
During 1956-94, 6% of all people with CP died before the age of 5 years and another
11% died between the ages of 5 and 40 years. The risk of mortality before the age of
30 years was significantly higher for people with a severe intellectual or motor
impairment, or who had multiple severe impairments. Nonetheless, it was predicted
that most people with CP now live to their adult years, although those with a profound
intellectual impairment have lower survival rates (Blair et al, 2001).
13The Economic Impact of Cerebral Palsy in Australia in 2007
TABLE 1–5: CRUDE AND STANDARDISED MORTALITY RATES PER 1,000 PERSON YEARS BY AGE
(WA, 1956-1994)
Age (years) Crude mortality Standardised mortality ratio
(nr deaths/person-years)The Economic Impact of Cerebral Palsy in Australia in 2007
TABLE 1–6: CP DEATHS IN CHILDREN AGED 0-14 YEARS, 1991-2003
1991 1992 1993 1994 1995 1996 1997
Number 30 25 30 36 30 29 20
Rate per 100,000 children 0.8 0.7 0.8 0.9 0.8 0.7 0.5
1998 1999 2000 2001 2002 2003 Average
Number 37 28 25 24 25 18 27.5
Rate per 100,000 children 1 0.7 0.6 0.6 0.7 0.5 0.7
N
ote: ICD-9 code 343 and ICD-10 code G80.
Source: AIHW Mortality Database (AIHW 2002 and 2005).
1.7 INCIDENCE AND PREVALENCE
Estimating the incidence and prevalence of CP is complicated by the absence of a
universally applied definition, some inconsistency in how severe the condition needs to be for
consideration in estimates (Mutch et al, 1992) and the absence of a universally accepted
minimum or maximum age within which the label of CP can be applied (Blair et al, 2001).
The minimum age is particularly critical in estimating the prevalence of severe CP since
the risk of infant mortality is greater among this group and use of different minimum
ages between clinicians may result in different estimated rates of severe CP. The use
of all live births as a denominator, rather than infant survivors, can also affect incidence
rates among very preterm babies (but has little effect on overall CP rates) (Blair et al,
2001).
Most of the published estimates derive either from registers of children with CP or
surveys of all live births, generally in a defined geographic region, over a defined time
period, and using various ascertainment methods to identify children with CP. These
estimates focus on incidence with prevalence estimates published less frequently (Blair
et al, 2001).
There is general consensus that the incidence of CP is around 2–2.5 per 1,000 live
births, which makes it the most common physical disability in childhood (Blair et al,
2006).
This rate has remained relatively stable for the last 60 years, despite a large increase
in medical intervention throughout pregnancy and childbirth leading to reduced stillbirth
rates and neonatal deaths (Blair et al, 2006; Reddihough et al, 2003).
Electronic foetal monitoring and the increased use of caesarean section have not reduced
the overall incidence of CP, nor have major advances in neonatal intensive care. Rates in
high risk groups of infants, such as those born very preterm, have increased with their
increasing survival and remain high.
The risk of CP is higher in low birth weight and premature infants. As survival of low birth
weight and premature infants increases the number of those who are at risk of CP increases.
Although CP is found across all socioeconomic classes, there is a clear association between
CP and socioeconomic status, which may partly be mediated by birth weight. Low
birthweight is associated with both CP and with lower socioeconomic class, but in the normal
birth weight ranges, rates of CP are 2.42 per 1,000 live births for those in the lowest
socioeconomic groups compared to 1.29 per 1,000 for the most affluent groups (Australian
CP Register, 2006).
15The Economic Impact of Cerebral Palsy in Australia in 2007
CP Australia estimates that approximately 600 to 700 infants are born with CP in
Australia each year.
In 2003, the Australian Institute for Health and Welfare (AIHW) stated there were an
estimated 16,800 people who reported CP either as their main or other long term
health condition (Table 1–7).
Of these, 16,100 had a disability, including 10,700 with a severe or profound core
activity limitation (AIHW, 2006).
TABLE 1–7: PEOPLE WITH A DISABILITY WHO HAD CP, BY AGE AND TYPE OF SPECIAL DWELLING,
AUSTRALIA, 2003
Age group Number ('000) %
0–4 **1.2 **7.6
5–9 **1.7 **10.9
10–14 *2.7 *16.8
15–19 *2.5 *15.5
20–44 *6.7 *41.9
45–64 **0.8 **5.0
65+ **0.3 **2.2
Type of special dwelling
Not applicable 14.1 87.8
Hospital - general **0.3 **1.7
Hospital - other **0.5 **3.2
Home for the aged **0.6 **3.9
Home - other **0.5 **3.3
Accommodation for the retired or aged **0.0 **0.2
Total with a disability 16.1 100
Total with cerebral palsy conditions 16.8
Notes
1. Estimates marked with * have an associated relative standard error of between
25% and 50% and should be interpreted accordingly.
2. Estimates marked with ** have an associated relative standard error of greater
than 50% and should be interpreted accordingly.
Totals may not match due to rounding.
The impact of CP can also be examined by looking at the length of time children spent in
hospital. In 1999-2000, there were 5,001 hospital bed days for which CP was the principal
reason, with an average length of stay in hospital of 4.4 days. CP was also responsible for an
additional 3,955 bed days where it was not the main reason for hospital stay but where it had
to be managed during hospitalisations for other conditions (AIHW, 2006).
Table 1–8 provides comparisons of the main disability groups of people with CP. All people
with CP reported one or more physical/diverse disabilities and 80% of them reported a
physical/diverse main disabling condition. In this study population over one third (37%) of
people included in the CP group had an acquired brain injury.
Based on consideration of all disabling conditions, just under 60% of people with CP
also reported intellectual disabilities. Sensory/speech disabilities were reported by 56%
of people with CP. The proportion of psychiatric disabilities was 41% (AIHW, 2006).
16You can also read


