Intermittent fasting interventions for treatment of overweight and obesity in adults: a systematic review and meta-analysis
←
→
Page content transcription
If your browser does not render page correctly, please read the page content below
S YS T E M AT I C R E V I E W

Intermittent fasting interventions for treatment of
overweight and obesity in adults: a systematic review
and meta-analysis
Leanne Harris 1  Sharon Hamilton 2,3  Liane B. Azevedo 2,3  Joan Olajide 2,3  Caroline De Brún 2,3
Gillian Waller 2,3  Vicki Whittaker 2,3  Tracey Sharp 4  Mike Lean 1  Catherine Hankey 1,  Louisa Ells 1,3,
1
 College of Medical, Veterinary and Life Sciences, University of Glasgow, Glasgow, United Kingdom, 2Health and Social Care Institute, Teesside
University, Middlesbrough, United Kingdom, 3Teesside Centre for Evidence Informed Practice: a Joanna Briggs Institute Centre of Excellence, United
Kingdom, and 4Independent Public Health Consultant, United Kingdom

       ABSTRACT

       Objective: To examine the effectiveness of intermittent energy restriction in the treatment for overweight and
       obesity in adults, when compared to usual care treatment or no treatment.
       Introduction: Intermittent energy restriction encompasses dietary approaches including intermittent fasting,
       alternate day fasting, and fasting for two days per week. Despite the recent popularity of intermittent energy
       restriction and associated weight loss claims, the supporting evidence base is limited.
       Inclusion criteria: This review included overweight or obese (BMI 25 kg/m2) adults (18 years). Intermittent
       energy restriction was defined as consumption of 800 kcal on at least one day, but no more than six days per week.
       Intermittent energy restriction interventions were compared to no treatment (ad libitum diet) or usual care
       (continuous energy restriction 25% of recommended energy intake). Included interventions had a minimum
       duration of 12 weeks from baseline to post outcome measurements. The types of studies included were randomized
       and pseudo-randomized controlled trials. The primary outcome of this review was change in body weight. Secondary
       outcomes included: i) anthropometric outcomes (change in BMI, waist circumference, fat mass, fat free mass); ii)
       cardio-metabolic outcomes (change in blood glucose and insulin, lipoprotein profiles and blood pressure); and iii)
       lifestyle outcomes: diet, physical activity, quality of life and adverse events.
       Methods: A systematic search was conducted from database inception to November 2015. The following electronic
       databases were searched: MEDLINE, Embase, CINAHL, Cochrane Library, ClinicalTrials.gov, ISRCTN registry, and
       anzctr.org.au for English language published studies, protocols and trials. Two independent reviewers evaluated the
       methodological quality of included studies using the standardized critical appraisal instruments from the Joanna
       Briggs Institute. Data were extracted from papers included in the review by two independent reviewers using the
       standardized data extraction tool from the Joanna Briggs Institute. Effect sizes were expressed as weighted mean
       differences and their 95% confidence intervals were calculated for meta-analyses.
       Results: Six studies were included in this review. The intermittent energy restriction regimens varied across
       studies and included alternate day fasting, fasting for two days, and up to four days per week. The duration of
       studies ranged from three to 12 months. Four studies included continuous energy restriction as a comparator
       intervention and two studies included a no treatment control intervention. Meta-analyses showed that
       intermittent energy restriction was more effective than no treatment for weight loss (4.14 kg; 95% CI
       6.30 kg to 1.99 kg; p  0.001). Although both treatment interventions achieved similar changes in body
       weight (approximately 7 kg), the pooled estimate for studies that investigated the effect of intermittent energy
       restriction in comparison to continuous energy restriction revealed no significant difference in weight loss
       (1.03 kg; 95% CI 2.46 kg to 0.40 kg; p ¼ 0.156).

Correspondence: Leanne Harris, Leanne.Harris@glasgow.ac.uk

    Catherine Hankey and Louisa Ells equally contributed to this article.
There is no conflict of interest in this project.
DOI: 10.11124/JBISRIR-2016-003248

JBI Database of Systematic Reviews and Implementation Reports                             ß 2018 THE JOANNA BRIGGS INSTITUTE                 507

      ©2018 Joanna Briggs Institute. Unauthorized reproduction of this article is prohibited.
SYSTEMATIC REVIEW L. Harris et al.
Conclusions: Intermittent energy restriction may be an effective strategy for the treatment of overweight and
obesity. Intermittent energy restriction was comparable to continuous energy restriction for short term weight loss in
overweight and obese adults. Intermittent energy restriction was shown to be more effective than no treatment,
however, this should be interpreted cautiously due to the small number of studies and future research is warranted to
confirm the findings of this review.
Keywords continuous energy restriction; Intermittent fasting; obesity; overweight; weight loss
JBI Database System Rev Implement Rep 2018; 16(2):507–547.
Summary of Findings
Intermittent energy restriction compared to usual care for treatment for overweight and obesity in adult population
Bibliography: Harris L, Hamilton S, Azevedo LB, Olajide J, De Brún C, Waller G, et al. Intermittent fasting interventions for treatment of overweight and obesity in
adults: a systematic review and meta-analysis. JBI Database System Rev Implement Rep 2018; 16(2):507–547.
Quality assessment No- of patients Effect
intermittent
No- of Study Other energy Absolute
studies design Risk of bias Inconsistency Indirectness Imprecision considerations restriction usual care (95% CI) Quality Importance
Weight (kg)
4 randomised seriousa not serious seriousb seriousc all plausible 161 126 MD 1.03 * IMPORTANT
trials residual lower (2.46 MODERATE
confounding lower to
would reduce 0.1 higher)
the demonstrated
effect dose
response gradient
CI, Confidence interval; MD, Mean difference.
GRADE Working Group grades of evidence.
High quality: Further research is very unlikely to change our confidence in the estimate of effect.
Moderate quality: Further research is likely to have an important impact on our confidence in the estimate of effect and may change the estimate.
Low quality: Further research is very likely to have an important impact on our confidence in the estimate of effect and is likely to change the estimate.
Very low quality: We are very uncertain about the estimate.
a
Two out of the four included studies present high risk of bias for: performance, detection and attrition.
b
There was a serious risk of indirectness due to the limited age range of participants and gender distribution.
c
There was serious imprecision considering the small number of studies and events and wide confidence interval.
Intermittent energy restriction compared to no treatment control for treatment overweight or obesity in adults
Bibliography: Harris L, Hamilton S, Azevedo LB, Olajide J, De Brún C, Waller G, et al. Intermittent fasting interventions for treatment of overweight and obesity in
adults: a systematic review and meta-analysis. JBI Database System Rev Implement Rep 2018; 16(2):507–547.
Quality assessment No- of patients Effect
intermittent
No- of Study Risk of Other energy no Absolute
studies design bias Inconsistency Indirectness Imprecision considerations restriction treatment (95% CI) Quality Importance
Weight (kg)
2 randomised seriousa very seriousb seriousc seriousd strong association 31 31 - ** IMPORTANT
trials all plausible residual MD 4.14 mean LOW
confounding would difference lower
reduce the demonstrated (6.30 lower to
effect dose response 1.99 lower)
gradient
CI, Confidence interval; MD, Mean difference.
GRADE Working Group grades of evidence.
High quality: Further research is very unlikely to change our confidence in the estimate of effect.
Moderate quality: Further research is likely to have an important impact on our confidence in the estimate of effect and may change the estimate.
Low quality: Further research is very likely to have an important impact on our confidence in the estimate of effect and is likely to change the estimate.
Very low quality: We are very uncertain about the estimate.
a
There was high risks of bias including: performance and detection bias.
b
There was serious inconsistency with high and significant heterogeneity.
c
There was a serious risk of indirectness due to the limited age range of participants and gender distribution.
d
There was serious imprecision considering the small number of studies and events and wide confidence interval.
JBI Database of Systematic Reviews and Implementation Reports ß 2018 THE JOANNA BRIGGS INSTITUTE 508
©2018 Joanna Briggs Institute. Unauthorized reproduction of this article is prohibited.SYSTEMATIC REVIEW L. Harris et al.
Introduction Intermittent fasting is currently a popular
he management of overweight and obesity is approach considered for weight management which
T considered a major public health priority inter-
nationally. Prevalence estimates of overweight and
has received significant media attention and hence
public popularity. In the UK, this dietary approach
obesity reported by the World Health Organization reached the mainstream after a BBC Horizon docu-
in 2014 showed that 39% (1.9 million) of adults mentary aired in August 2012 featured an intermit-
aged 18 and over were overweight, and of these 13% tent fasting approach called the 5:2 diet. The diet
(600 million) were obese.1 In adults there is evidence involved five days of regular eating patterns inter-
to support a persistent involuntary increase in body changed with two days of ‘‘fasting’’ (daily maximum
weight of between 0.24–0.45 kg per year in women of 500kcal for women and 600kcal for men) per
and 0.25–0.58 kg per year in men,2,3 with even week. In addition to the popular 5:2 approach, there
greater weight changes observed in younger adults are a number of other intermittent fasting patterns
(>2 kg annually).3 Excess weight gain in adulthood used to describe this dietary treatment approach,
has a negative impact on health and is associated including alternate day fasting (ADF), periodic fast-
with an increased risk of developing a number of ing or intermittent energy restriction (IER) for two
chronic diseases including type II diabetes, cardio- up to six days per week. The premise of this
vascular disease, muscular skeletal disorders and approach to dieting involves interspersing normal
some cancers.4,5 daily caloric intake with short periods of severe
The burgeoning obesity epidemic and its asso- calorie restriction/fasting. It does not involve a true
ciated health conditions not only have an adverse fast which would consist of complete abstinence
impact on the individual but are also an increasing from food and/or water. Intermittent fasting
financial burden to society. In the United Kingdom involves changing the ‘‘usual’’ daily energy intake
(UK), the cost of treatment of obesity related to a much lower calorie intake. For the purpose of
conditions to the National Health Service is esti- this review, the term IER will be used to describe all
mated to be £6.1 billion per year.6 Medical expen- intermittent fasting regimens.
diture in the United States of America (USA) has The potential health benefits and biological pro-
shown to be even greater with associated costs at cesses of IER are not well establised.11,12 There is
US$147 billion.7 Furthermore, if trends in obesity some evidence, predominantly from animal studies,
continue to increase, it is predicted that by 2050, to demonstrate beneficial effects from weight loss
50% of the population in the UK could be obese and additional improvements on cardio-metabolic
and the total costs in managing obesity could risk factors. It has been hypothesized that the mech-
escalate to £50 billion per year.8 Therefore, effec- anism for the possible additional benefits were
tive approaches to the management of obesity are through fat utilization and nutritional stress.13
essential internationally. Intermittent energy restriction is achieved pre-
Weight management approaches in the treatment dominantly through intermittent periods of dietary
of obesity include a wide range of lifestyle interven- intake based on a very low calorie diet (VLCD).
tions (including dietary, physical activity and psy- However, currently international clinical guidance
chological elements) to change unhealthy behaviors, on the treatment of adult obesity does not recom-
encourage weight loss and prevent chronic weight mend the routine use of VLCD (defined as a hypo-
gain. However, many approaches only achieve small caloric diet of 800 or less kcal/day) for the treatment
changes in body weight insufficient to have a clinical of adult obesity.4,5,14,15 Instead, continuous energy
impact on health.9 Furthermore, there are a number restriction (CER) involving a daily energy deficit of
of diet and weight management books published, 600 kcal/day is recommended as part of a multi-
with book sales sufficient to reach a best seller list, component weight management strategy, including
however, many of these lack comprehensive evalua- ongoing support and a maximum intervention dura-
tion and robust evidence to support their effective- tion of 12 weeks.4 In order for IER to be considered
ness.10 Therefore, it is vitally important that new as an alternative approach to weight management,
approaches to weight management are investigated systematic evaluation of the current evidence base is
for their potential efficacy in order to provide evi- necessary to provide support for this novel treatment
dence based approaches to the treatment of obesity. over current practice (CER).
JBI Database of Systematic Reviews and Implementation Reports ß 2018 THE JOANNA BRIGGS INSTITUTE 509
©2018 Joanna Briggs Institute. Unauthorized reproduction of this article is prohibited.SYSTEMATIC REVIEW L. Harris et al.
Despite the recent popularity of IER16 and asso- on clinical recommendations.5 Interventions were
ciated weight loss claims,17 the supporting evidence included if they provided a follow-up period of
base to justify the use in humans remains limited participants of at least 12 weeks from the start of
with only one published systematic review13 at the the intervention.
time of the search examining the health benefits of
this approach. The aim of this published review13 Comparator
was therefore to examine the impact of IER inter- Interventions were compared to control (no inter-
ventions on wider health benefits including coronary vention) or usual care (which consisted of advice to
artery disease risk of risk of diabetes (not specifically continuously follow a reduced calorie diet of
as a treatment approach for overweight and obesity). approximately 25% of estimated daily energy
However, it did not examine the efficacy of studies requirements).
which were consistent with clinical recommenda-
tions on a minimum 12-week intervention period, Outcomes
provide a critical appraisal of the methodology, or The primary outcome of the review was change in
meta-analysis of weight loss outcomes. Therefore, body weight. Secondary outcomes included in this
the aim of the current review is to address these gaps review were: change in BMI, waist circumference, fat
in the evidence base. mass, fat free mass, blood glucose and insulin, lipo-
This review was conducted according to an a protein profiles, blood pressure, diet, physical activ-
priori published protocol.18 ity, quality of life and adverse events (such as
physical or psychological side effects from taking
Review question/objective part in the interventions).
The objective of this study was to systematically Outcomes measures were only included in the
review the available evidence and quantify the effect meta-analysis if they were measured objectively,
of intermittent energy restriction in the treatment for used validated tools and procedures.
overweight and obesity in adults, when compared to
usual care treatment (continuous energy restriction) Types of studies
or no treatment (ad libitum diet). The review considered both randomized controlled
and pseudo-randomized controlled trials for inclusion.
Inclusion criteria
Participants Methods
This review considered studies that included free- Search strategy
living (not hospitalized) male and female adults aged The search strategy aimed to find peer reviewed
18 years and over who were overweight or obese (i.e. published studies, clinical trials, and gray literature
had a body mass index [BMI] greater than or equal such as reports and conference proceedings. A three-
to 25 or 30 kg/m2, respectively). Participants were step search strategy was utilized in this review. An
excluded if they had secondary or syndromic forms initial limited search of MEDLINE and CINAHL
of obesity or were diabetic, previously had or were was undertaken followed by analysis of the text
undergoing bariatric surgery, were pregnant or words contained in the title and abstract, and of
breast feeding, and were taking medication associ- the index terms used to describe the article. A second
ated with weight loss (e.g. orlistat, metformin) or search using all identified keywords and index terms
weight gain (e.g. steroids, antipsychotics). was undertaken across all included databases.
Thirdly, the reference list of all identified reports
Intervention and articles was searched for additional studies.
This review considered studies that evaluated inter- Only studies published in English language and
mittent fasting interventions (defined as consump- published up to November 2015 were considered
tion of 800 kcal or less on at least one day, but no for inclusion in this review.
more than six days in a calendar week). As there is no
accepted formal definition of ‘‘‘fasting’’, the clini- The databases searched included:
cally recommended5 upper limit for a very low MEDLINE via OVID Host
calorie diet was used (800 kcal) in this review based Embase via OVID
JBI Database of Systematic Reviews and Implementation Reports ß 2018 THE JOANNA BRIGGS INSTITUTE 510
©2018 Joanna Briggs Institute. Unauthorized reproduction of this article is prohibited.SYSTEMATIC REVIEW L. Harris et al.
CINAHL via EBSCO Host effects of two formats of IER in comparison to
Cochrane Central Register of Controlled Trials CER.20 To create a single pair-wise comparison,
(CENTRAL). and to prevent multi-comparisons and a unit-of-
The search for protocols and trials included: analysis error, IER interventions in the aforemen-
ClinicalTrials.gov tioned study were combined. Heterogeneity was
ISRCTN registry assessed statistically using the standard I squared
anzctr.org.au and tau-squared. Where possible, subgroup analyses
Initial keywords to be used were: intermittent were considered based on baseline weight status of
fasting or periodic fasting, ADF or intermittent cal- participants (i.e. overweight [BMI: 25–29 kg/m2],
orie restriction, and overweight or obesity. The full obese [BMI: 30–39 kg/m2] and morbidly obese
search strategy is available in Appendix I. [BMI 40þ kg/m2]), gender, age, length of study
and IER approach. Where statistical pooling was
Assessment of methodological quality not possible, the findings are presented in narrative
Quantitative papers selected for retrieval were form including tables and figures to aid in data
assessed by two independent reviewers for method- presentation where appropriate.
ological validity prior to inclusion in the review
using standardized critical appraisal instruments Grading of Recommendations Assessment,
from the Joanna Briggs Institute System for the Development and Evaluation assessment
Unified Management, Assessment and Review of A Grading of Recommendations Assessment,
Information (JBI SUMARI)18 (Table 1). To be con- Development and Evaluation (GRADE) assessment
sidered of adequate quality, the randomized and was conducted to assess the overall quality of
pseudo-randomized trials had to score a ‘‘yes’’ for evidence.23 A GRADE assessment comprises risk
a minimum six out of 10 quality appraisal questions. of bias to the internal validity of results, consis-
Any disagreements that arose between the reviewers tency of results across studies, directness and pre-
were resolved through discussion, or with a cision of results, and likelihood of publication bias.
third reviewer. The overall quality of evidence is then categorized
as high, moderate, low or very low. Grading of
Data extraction Recommendations Assessment, Development and
Data were extracted from papers included in the Evaluation assessments were conducted for the
review using the standardized data extraction tool primary outcome included in the meta-analysis.
from JBI SUMARI.18 The data included specific Two independent researchers (LA and LH) per-
details about the interventions, populations, study formed the GRADE assessments and consensus
methods, and outcomes of significance to the agreed.
review question.
Results
Data synthesis Study inclusion
Quantitative data were, where possible, pooled in The systematic search identified 69,097 studies.
statistical meta-analysis using Comprehensive Meta- After removing duplicate studies, 61,328 titles
Analysis software Version 3.0 (Windows: Biostat, and abstracts were reviewed. Full text articles were
Englewood, Colorado, USA). All results were subject sought for 119 studies and their eligibility for
to double data entry. Effect sizes were expressed as inclusion in this review assessed. One hundred
weighted mean differences (WMD) (for continuous and ten articles were excluded based on the rea-
data, calculated from the last available measure) and sons (Figure 1 and Appendix II). Nine studies were
their 95% confidence intervals were calculated for considered eligible. Three of these studies were
analyses. Three studies did not report the standard identified from the Clinical Trials Register and
deviation of the mean change.19-21 Therefore, these were considered ongoing studies, with final results
were calculated using an imputed correlation coeffi- not published at the time of the search. Six
cient, calculated from the variance of pre- and post-, studies reported adequate outcome data and were
and change in outcome variable from available data finally included in this systematic review and meta-
from Bhutani et al.22 One study investigated the analysis.
JBI Database of Systematic Reviews and Implementation Reports ß 2018 THE JOANNA BRIGGS INSTITUTE 511
©2018 Joanna Briggs Institute. Unauthorized reproduction of this article is prohibited.SYSTEMATIC REVIEW L. Harris et al.
69,097 records identified through 2 records identified through hand
database searching searches
61,328 records after duplicates removed
61,328 records title and abstract 61, 209 of records excluded
screened
110 of records excluded:
119 of full text articles assessed for - not randomized controlled
eligibility trial(10)
- not in English (2)
- interventionSYSTEMATIC REVIEW L. Harris et al.
Table 1: Assessment of methodological quality
Reference Q1 Q2 Q3 Q4 Q5 Q6 Q7 Q8 Q9 Q10 Total
22
Bhutani et al. Y N U U U Y Y Y Y Y 6
19
Harvie et al. U N U Y U Y Y Y Y Y 6
20
Harvie et al. Y N Y Y N Y Y Y Y Y 8
21
Hill et al. U N U N U U Y Y Y Y 4
26
Varady et al. U N U N U Y Y Y Y Y 5
25
Viegener et al. U N U N U Y Y Y U Y 4
% 33 0 17 33 0 83 100 100 83 100
Percentages indicate proportion of questions answered Yes (Y).
N, No; U, Unclear; Y, Yes.
Critical appraisal criteria for quantitative studies: Q1. Was the assignment to treatment groups truly random? Q2. Were participants blinded to treatment allocation?
Q3. Was allocation to treatment groups concealed from the allocator? Q4. Were the outcomes of people who withdrew described and included in the analyses? Q5.
Were those assessing outcomes blind to treatment allocation? Q6. Were the control and treatment groups comparable at entry? Q7. Were groups treated identically
other than for the named interventions? Q8. Were outcomes measured in the same way for all groups? Q9. Were outcomes measured in a reliable way? Q10. Were
appropriate statistical analyses used?.
was reviewed as unclear. Again, limited reporting of was 5.6 months (range: 3 to 12 months), with only
outcome measures meant that question nine was also one study conducting follow-up of outcome mea-
assessed as unclear in the study by Viegener et al.25 sures at six months post intervention.21 The majority
The reviewers judged that insufficient reporting of of studies focused their intervention on weight loss,
methodology limited these studies meeting the crite- with only two studies including a weight mainte-
ria for a ‘‘yes’’ in questions 6 and 9 and was likely not nance phase.20,25 In addition to examining the effi-
a limitation in the conduct of the methodology. All cacy of calorie restriction regimens, the effects of
studies fulfilled the ‘‘yes’’ criteria for treating inter- exercise interventions were also investigated in two
vention groups identically (Q7), consistency in mea- studies.21,22 Bhutani et al.22 included four interven-
suring outcomes for all interventions (Q8), and tion groups (ADF, exercise, combination (both exer-
providing appropriate statistical analysis (Q10). In cise and ADF) and a control group), while Hill
addition to the risk to the internal validity of studies et al.21 examined the efficacy of four interventions
assessed by the critical appraisal tool, high rates of of ADF and CER with and without exercise. As the
attrition (20%) were reported in four out of the six primary aim of the review was the efficacy of dietary
studies (Table 1). Rates of attrition were comparable restriction regimens, results are not presented for
between intervention groups with the exception of participants involved in the above exercise interven-
Bhutani et al.22 which had no dropouts in the control tions. All studies measured body weight as their
intervention in comparison to nine participants from primary outcome. Additional anthropometric out-
the IER intervention. comes included fat mass, fat free mass and waist
circumference. BMI26 and other circumferences
Characteristics of included studies measures (bust and thigh)19,20 were reported in
A summary of the characteristics of the six included few studies but not included in the meta-analysis.
studies is detailed in Table 2. The majority of studies Secondary outcome measures varied across studies;
were in general conducted in the USA (n ¼ 4), with the most commonly reported were cardio-metabolic
the exception of two studies by Harvie et al. which biomarkers including lipoprotein profiles, glucose
were conducted in the UK.19,20 Four studies investi- and insulin (presented in Table 3) and less commonly
gated the efficacy of IER interventions in comparison reported were satiety hormones (leptin and adipo-
to CER19-21,25 and two studies included a no treat- nectin) and inflammatory markers [including Inter-
ment control intervention (ad libitum diet) as the leukin 6 (IL-6) and Tumour Necrosis Factor Alpha
comparator. The mean duration of the interventions (THF- a)].
JBI Database of Systematic Reviews and Implementation Reports ß 2018 THE JOANNA BRIGGS INSTITUTE 513
©2018 Joanna Briggs Institute. Unauthorized reproduction of this article is prohibited.SYSTEMATIC REVIEW L. Harris et al.
Table 2: Characteristics of included studies
Study duration
Reference Study population Intervention (months) Attrition
Bhutani IER CER/Control IER CER/Control IER CER
et al.22
Weight 94.0 3.0 93.0 5.0 ADF: 75% energy restriction on fast days Control: Ad libitum Weight loss: 3 Enrolled: n ¼ 25 n ¼ 16
(kg): (24 hour) consumed between 12 pm & 2 dietary intake
pm & ad libitum on each alternating feed
BMI (kg/ 35.0 1.0 35.0 1.0 Completed: n ¼ 16 n ¼ 16
day (24 hour).
m2):
Age 42.0 2.0 49.0 2.0 Macronutrient composition: Attrition rate: 36.0% 0.0%
(years): 55% CHO; 25% FAT; 20% PRO (food
Gender 24/1 15/1 provided on fast days for controlled feed-
ing phase weeks 1–4)
(F/M):
Harvie IER CER/Control IER CER/Control IER CER
et al.19
Weight 81.5 84.4 (16.4) IER: 2 consecutive fast days (75% restric- CER: Daily 25% Weight loss: 6 Enrolled: n ¼ 53 n ¼ 54
(kg): (13.1) tion. 500 kcal/day) & to consume esti- restriction ( 1200–
mated requirements for weight 1800 kcal /day)
BMI 30.7 (5.0) 30.5 (5.2) Completed: n ¼ 42 n ¼ 47
maintenance for the remaining 5 days
(kg/m2):
Macronutrient
Age 40.1 (4.1) 40.0 (3.9) Macronutrient composition: composition: Attrition rate: 20.8% 13.0%
(years): 50 g PRO/day 45% CHO; 30%
Gender 53/0 42/0 FAT; 25% PRO
(F/M):
Harvie IER CER/Control IER CER/Control IER CER
et al.20
Weight 79.4 86 (17.3) IER: 2 consecutive fast days (70% restric- CER: Daily 25% Weight loss: 3 Enrolled: n ¼ 37 n ¼ 38
(kg): (14.7) tion, 600–650 kcal /day) & 5 days restriction ( 1200– Weight
(25% restriction. 1200–1800 kcal /day) 1800 kcal /day) maintenance: 1
BMI 29.6 (4.1) 32.2 (5.6) Completed: n ¼ 33 n ¼ 28
(kg/m2):
Macronutrient composition Macronutrient
Age 45.6 (8.3) 47.9 (7.7) 250g PRO/day & restricted 40g CHO composition: Attrition rate: 10.8% 26.3%
(years): IERRPF: Energy requirements as for IER 45% CHO; 30%
with addition of ad libitum PRO/FAT FAT; 25% PRO
Gender 37/0 38/0
(F/M):
IERRPF IERRPF
Weight 82.4 Enrolled: n ¼ 40
(kg): (16.4)
BMI 31.0 (5.7) Completed: n ¼ 27
(kg/m2):
Age 48.6 (7.3) Attrition rate: 32.5%
(years):
Gender 40/0
(F/M):
Hill IER CER/Control IER CER/Control IER CER
et al.21
Weight 85.8 (NR) 86.3 (NR) Energy intake altered between 600 kcal/ CER: Daily restric- Weight loss: 3 Enrolled: n ¼ 10 n ¼ 10
(kg): day & 1500 kcal/day on a weekly regi- tion of 1200 kcal/ Follow-up: 6
men of fasting from 3 to 7 days/week. day.
BMI 31.0 (2.0) 31.0 (3.0) Completed: n¼6 n¼8
(kg/m2):
Macronutrient composition:
Age 40.0 (5.0) 37.0 (11.0) 55% CHO; 25% FAT; 20% PRO Attrition rate: 40.0% 20%
(years):
Gender 10/0 10/0 Follow-up
(F/M):
Completed: n¼4 n¼3
Attrition rate: 60.0% 70%
JBI Database of Systematic Reviews and Implementation Reports ß 2018 THE JOANNA BRIGGS INSTITUTE 514
©2018 Joanna Briggs Institute. Unauthorized reproduction of this article is prohibited.SYSTEMATIC REVIEW L. Harris et al.
Table 2. (Continued)
Study duration
Reference Study population Intervention (months) Attrition
Varady IER CER/Control IER CER/Control IER CER
et al.26
Weight 77.0 3.0 77.0 3.0 ADF: 75% energy restriction on fast days Control: Weight loss: 3 Enrolled: n ¼ 16 n ¼ 16
(kg): (24hour) consumed between 12 pm & 2 ad libitum dietary
pm & ad libitum on each alternating feed intake
BMI (kg/ 26.0 1.0 26.0 1.0 Completed: n ¼ 15 n ¼ 15
day (24 hour)
m2):
Age 47.0 3.0 48.0 2.0 Macronutrient composition: Attrition rate: 6.3% 6.3%
(years): 55% CHO; 30% FAT; 15% PRO
Gender 10/5 12/3
(F/M):
Viegener IER CER/Control IER CER/Control IER CER
et al.25
Weight 94.7 (12.7) 98.6 (15.9) 4 days/ per week at 800 kcal & 3 days/ CER: Maintenance Weight loss: 6 Enrolled: n ¼ 43 n ¼ 42
(kg): per week at 1200 kcal of 1200 kcal /day Weight
maintenance: 6
BMI (kg/ 35.0 (NR) 35.6 (NR) Completed: n ¼ 30 n ¼ 30
Macronutrient composition Macronutrient
m2):
Restrict intake of FAT to 25% on 1200 composition
Age 47.1 (7.49) 47.1 (8.86) kcal days & to 15% 800 kcal days. 55% CHO; 30% Attrition rate: 30.2% 28.6%
(years): FAT; 15% PRO
Gender 43/0 42/0
(F/M):
Values represent Mean SEM; Mean (SD). ADF, Alternate day fasting; BMI, Body mass indes; CER, Continuous energy restriction; CHO, Carbohydrate; F, Female; IERþPF,
Intermittent energy restriction with ad libitum protein and fat intake; IER, Intermittent energy restriction; M, Male; NR, Not reported; PRO, Protein.
Participant characteristics majority of participants were in full time employ-
A total of 400 participants were enrolled in the ment (range: 64% to 82%), followed by part time
studies (excluding participants in the exercise inter- employment (range: 14% to 19%). Seventeen per-
ventions). The mean sample size was 67 participants cent were reported to be retired or unemployed. The
(range: 20–115 participants) and a mean of 31 majority of studies involved only female participants
participants per intervention (range: 10 to 54 par- with the exception of two studies which included
ticipants). The mean age of participants in each both genders; however, females were primarily
study ranged from 37 years to 49 years. Participants enrolled, with only 10 men participating in total
were overweight or obese (mean BMI range 26.0 kg/ across all studies.22,26 Participants were considered
m2 to 35.6 kg/m2). The ethnicity of the participants in general to be healthy, and were not reported to
was only reported in three studies.19,20,26 The major- have any obesity related health conditions such as
ity of participants were Caucasian (range: 46% to type II diabetes or cardiovascular disease. Five par-
97%). Other ethnic origins included African Ameri- ticipants were reported to have hypertension, a con-
can (46%), Afro Caribbean (2%), Hispanic (10%) dition associated with the development of chronic
and ethnic origin classified as other (2%). Socio conditions.19 Participants in the studies by Harvie
economic status (SES) was not reported across stud- et al.19,20 were at increased risk of developing breast
ies. However, an indication of employment level, cancer by virtue of a positive family history but had
relevant to SES, was reported in two studies.19,20 The no personal history of breast cancer.
Table 3: Change in weight, anthropometric and cardiometabolic outcomes of primary studies
Citation Weight change (kg) Anthropometric changes Cardiometabolic changes
IER CER/Control IER CER/Control IER CER/Control
22
Bhutani et al. Waist circumference (cm) Systolic blood pressure (mm/Hg)
3.0 (0.1) 0.0 (0.0)NS 5.0 1.0 1.0 1.0NS 3.0 1.0þ 2.0 3.0NS
Fat mass (kg) Diastolic blood pressure (mm/Hg)
2.0 1.0þ 0.0 1.0NS 2.0 2.0þ 2.0 3.0NS
JBI Database of Systematic Reviews and Implementation Reports ß 2018 THE JOANNA BRIGGS INSTITUTE 515
©2018 Joanna Briggs Institute. Unauthorized reproduction of this article is prohibited.SYSTEMATIC REVIEW L. Harris et al.
Table 3. (Continued)
Citation Weight change (kg) Anthropometric changes Cardiometabolic changes
IER CER/Control IER CER/Control IER CER/Control
Harvie et al.19 Waist circumference (cm) Glucose (mmol/l)
Pre Pre Pre
81.5 84.4 101.5 102.5 4.8 4.8
(77.5–85.4) (79.7–89.1) (97.8–105.2) (98.7–106.3) (4.7–4.9) (4.6–4.9)
Post Post Post
75.8 79.9 95.4 98.6 4.7 4.7
(71.4–80.2)þ (74.6–85.2)þ (91.3–99.5)þ (94.2–102.9)þ (4.6–4.8)þ (4.6–4.9)NS
Fat mass (kg) Insulin (mU/ml)
Pre Pre
33.6 35.3 7.3 7.4
(30.9–36.4) (31.9–38.7) (6.3–8.4) (6.4–8.6)
Post Post
29.1 31.7 5.2 6.3
(26–32.3)þ (27.9–35.5)þ (4.5–6.0)þ (5.4–7.4)þ
Lean mass (kg) Systolic blood pressure (mm/Hg)
Pre Pre
47.6 49.1 115.2 116.8
(46.3–49.0) (47.7–50.5) (111.2–119.2) (113.1–120.4)
Post Post
46.4 48.3 111.5 109.3
(44.9–47.9)þ (46.7–49.9)þ (107.7–115.2)þ (105.3–113.2)þ
Diastolic blood pressure (mm/Hg)
Pre
76.7 75.4
(73.9–79.4) (72.3–78.4)
Post
72.4 69.7
(68.9–76.0)þ (66.4–72.9)þ
Total cholesterol (mmol/l)
Pre
5.1 5.2
(4.9–5.4) (5.0–5.4)
Post
4.8 4.7
(4.5–5.0)þ (4.5–5.0)þ
HDL cholesterol (mmol/l)
Pre
1.5 1.6
(1.4–1.5) (1.4–1.7)
Post
1.5 1.5
(1.4–1.6)NS (1.4–1.6)þ
LDL cholesterol (mmol/l)
Pre
3.1 3.1
(2.9–3.3) (2.8–3.3)
Post
2.8 2.8
(2.6–3.1)þ (2.6–3.0)þ
Triglycerides (mmol/l)
Pre
Pre 1.2 Pre 1.3
(1.0–1.4) (1.1–1.4)
Post
1.0 1.0
(0.9–1.2)þ (0.8–1.2)þ
JBI Database of Systematic Reviews and Implementation Reports ß 2018 THE JOANNA BRIGGS INSTITUTE 516
©2018 Joanna Briggs Institute. Unauthorized reproduction of this article is prohibited.SYSTEMATIC REVIEW L. Harris et al.
Table 3. (Continued)
Citation Weight change (kg) Anthropometric changes Cardiometabolic changes
IER CER/Control IER CER/Control IER CER/Control
IER IERRPF CER IER IERRPF CER IER IERRPF CER
Harvie et al.20 (NR) Waist circumference (cm) Glucose (mmol/l)
Pre Pre Pre
79.4 82.4 86.0 100.5 104.1 106.0 4.9 5.0 5.0
(74.6–84.1) (77.2–87.6) (60.6–91.3) (96.6–104.5) (99.0–109.1) (101.9–110.2) (4.7–5.0) (4.8–5.1) (4.8–5.1)
Post Post Post
73.9 77.3 82.2 94.4 98.8 102.4 4.8 4.9 4.9
(69.4–78.5) (72.5–82.1) (76.9–87.5) (90.5–98.3) (94.1–103.6) (98.0–106.8) (4.6–5.0) (4.7–5.1) (4.7–5.0)
Fat mass (kg) Insulin (mmol/l)
Pre Pre
31.0 33.5 35.7 43.2 50.4 49.8
(27.9–34.2) (29.9–37.0) (32.3–39.2) (35.4–52.8) (42.6–60.0) (42.0–59.4)
Post Post
26.7 29.4 33.2 34.2 45.0 45.0
(23.9–29.5) (26.3–32.6) (29.7–36.7) (28.2–41.4) (38.4–52.2) (36.6–54.6)
Lean Mass (kg) Systolic blood pressure (mm/Hg)
Pre Pre
48.5 49.0 50.3 114.9 129.5 124.0
(46.4–50.5) (47.2–50.9) (48.2–52.3) (111.0–125.0) (115.0–138.0) (116.0–131.0)
Post Post
47.2 47.9 48.7 111.9 112.8 113.3
(45.1–49.3) (46.1–49.6) (46.5–50.8) (108.0–118.0) (108.0–121.0) (107.0–125.0)
Total cholesterol (mmol/l)
Pre
5.3 5.7 5.3
(5.0–5.6) (5.3–6.1) (5.0–5.7)
Post
5.1 5.5 5.3
(4.7–5.4) (5.1–5.9) (5.0–5.5)
HDL cholesterol (mmol/l)
Pre
1.4 1.4 1.3
(1.3–1.5) (1.3–1.5) (1.2–1.4)
Post
1.4 1.4 1.4
(1.2–1.5) (1.3–1.6) (1.3–1.5)
LDL cholesterol (mmol/l)
3.3 Pre 3.7 3.4
(3.0–3.6) (3.4–4.1) (3.1–3.6)
Post
3.2 3.6 3.3
(2.9–3.5) (3.2–3.9) (3.1–3.5)
Triglycerides (mmol/l)
Pre
(0.9–1.2) 1.1 1.1
(0.9–1.2) (0.9–1.3)
Post
0.9 0.9 1.0
(0.8–1.0) (0.8–1.1) (0.9–1.2)
21
Hill et al. Total cholesterol (mmol/l)
Pre
(NR) 7.2 2.7 9.5 2.9 5.5 0.3 5.1 0.2
JBI Database of Systematic Reviews and Implementation Reports ß 2018 THE JOANNA BRIGGS INSTITUTE 517
©2018 Joanna Briggs Institute. Unauthorized reproduction of this article is prohibited.SYSTEMATIC REVIEW L. Harris et al.
Table 3. (Continued)
Citation Weight change (kg) Anthropometric changes Cardiometabolic changes
IER CER/Control IER CER/Control IER CER/Control
Post
4.7 0.2 4.8 0.3
Varady et al.26 Fat mass (kg) Systolic blood pressure (mm/Hg)
5.2 0.9 3.6 0.7NS 7.0 2.0þ 1.0 3.0NS
Diastolic blood pressure (mm/Hg)
6.0 2.0þ 2.0 6.0NS
Total cholesterol (mg/dl)
26.0 6.0þ 9.0 5.0NS
HDL cholesterol (mg/dl)
2.0 3.0NS 1.0 2.0NS
LDL cholesterol (mg/dl)
18.0 6.0þ 9.0 4.0NS
Triglycerides (mg/dl)
22.0 11.0NS 10.0 7.0NS
Viegener et al.25 (NR) 9.0 (6.7) 9.0 (7.3)
CER, Continuous energy restriction; HDL, High density lipoprotein; IERþPF, Intermittent energy restriction with ad libitum protein and fat intake; IER, Intermittent
energy restriction; LDL, Low density lipoprotein; NR, Not reported; NS, Not significant.
Results are presented for within group changes. Values represent mean SEM; mean (SD).
NR: Within group statistics not reported (Harvie et al.20; Hill et al.21).
Varady et al.26 Between group differences for weight and fat mass.
Significance at p ¼SYSTEMATIC REVIEW L. Harris et al.
primarily focused on the efficacy of exercise were Secondary anthropometric outcome
excluded from this review. Secondary outcomes of interest in this review were
other measures of body composition and cardio-
Adherence/compliance metabolic markers. Few studies consistently
Measuring adherence to dietary advice is always reported anthropometric outcomes. The results for
challenging due to the subjective nature of self- change in outcomes are primarily from the studies
report dietary intake and a lack of valid objective conducted by Harvie et al.19,20 Pooled effect sizes
measurements.28 All studies with the exception of across these studies revealed significant reductions in
Bhutani et al.22 utilized self-report measures of die- waist circumference (WMD: 2.14 cm; 95% CI
tary intake through food diaries as a measure of 3.53 cm to 0.75 cm; p ¼ 0.002) and in fat mass
adherence/ compliance to the dietary regimen. (WMD: 1.38 kg; 95% CI 2.47 kg to 0.28 kg;
Based on the self-report measures, compliance with p ¼ 0.014) for the IER intervention in comparison to
diets (IER and CER) was high (mean adherence CER (Table 4).
range: 58% to 98%) and not different between
treatments. Furthermore, adherence to IER regi- Secondary cardio-metabolic outcomes
mens appeared not to be affected with increased Summary effect estimates for cardio-metabolic out-
number of fasting days (i.e. fasting for 2 days19,20 or comes were only included for outcomes which were
4 days per week21,25). reported by two or more studies. Results again were
primarily reported from the studies led by Harvie
Effects of interventions et al.19,20 Effect sizes for cardio-metabolic outcomes
Primary outcome change in body weight are presented in Table 4. There was a significant
Meta-analysis was conducted for four studies that effect of IER in comparison to CER for improve-
included CER as a comparator intervention.19-21,25 ments in insulin concentrations (WMD: 4.66 pmol/
Both interventions achieved comparable weight l 9.12 pmol/l to 0.19 pmol/l; p ¼ 0.041). How-
losses and there were no significant differences in ever, there were no significant between group differ-
change in body weight between interventions ences for IER in comparison to CER for lipoprotein
(WMD: 1.03 kg; 95% CI 2.46 kg to 0.40 kg; profiles (total cholesterol, LDL and HDL cholesterol
p ¼ 0.156 [Figure 2]). Statistical heterogeneity was and triglycerides) or glucose concentrations. It is
not present (Q [3] 1.2, P ¼ 0.76 I2 ¼ 0.0%). Only one important to note that due to the limited number
study examined the efficacy of IER at 12 months, of studies included in this analysis of cardio-meta-
illustrating that weight loss could be sustained long bolic outcomes (n ¼ 2; total cholesterol n ¼ 3),
term equivalent to that following CER.25 results should be interpreted with caution.
Reference Intermittent energy Continuous energy Mean difference Mean difference (95% CI)
restriction (IER) restriction (CER) (95% CI)
Mean (SD) N Mean (SD) N
Harvie et -5.70 (5.00) 42 -4.50 (6.40) 47 -1.20 (-3.61 to 1.21)
al.19
Harvie et -5.30 (5.29) 75 -3.80 (5.95) 40 -1.50 (-3.62 to 0.62)
al.20
Hill et al.21 -7.20 (10.10) 14 -9.50 (8.70) 9 2.30 (-5.73 to 10.33)
Viegener et -8.98 (6.73) 30 -8.96 (7.27) 30 -0.02 (-3.57 to 3.53)
al.25
Pooled estimate 161 126 -1.03 (-2.46 to 0.40)
(Random effect)
Tests for heterogeneity: p = 0.76, I2 = 0.0%, T2 = 0.0 -12.00 -6.00 0 6.00 12.00
Favors IER Favors CER
Figure 2: Weighted mean difference in body weight (kg) between the intermittent energy restriction
interventions and continuous energy restriction interventions (SD: standard deviation; CI: confidence
interval)
JBI Database of Systematic Reviews and Implementation Reports ß 2018 THE JOANNA BRIGGS INSTITUTE 519
©2018 Joanna Briggs Institute. Unauthorized reproduction of this article is prohibited.SYSTEMATIC REVIEW L. Harris et al.
Table 4: Pooled effect sizes (Weighted Mean Difference) of secondary outcomes
Heterogeneity
Pooled estimate Q
Outcomes K (95% CI) p-value (p-value) I2 T2
IER vs CER
Waist circumference 2 2.14 (3.53 to 0.75) 0.002 0.01 0.0% 0.00
(cm) (0.938)
Fat mass (kg) 2 1.38 (2.47 to 0.28) 0.014 0.49 0.0% 0.00
(0.483)
Fat free mass (kg) 2 0.02 (0.80 to 0.76) 0.958 1.90 47.5% 0.15
(0.168)
Glucose (mmol/l) 2 0.00 (0.05 to 0.05) 1.000 0.00 0.0% 0.00
(1.000)
Insulin (pmol/l) 2 4.66 (9.12 to 0.19) 0.041 2.57 61.1% 6.36
(0.109)
Total cholesterol 3 0.14 (0.50 to 0.23) 0.458 27.33 92.7% 0.10
(mmol/l) (SYSTEMATIC REVIEW L. Harris et al.
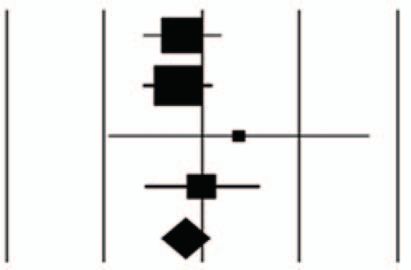
Reference Mean difference Mean difference (95% CI)
(95% CI)
Bhutani et al.22 -3.00 (-4.88 to -1.19)
Varady et al.26 -5.20 (-6.88 to -3.52)
Pooled estimate -4.14 (-6.30 to -1.99)
(random effect)
Tests for heterogeneity: p = 0.09,
I2 = 65.7%, T2 = 1.6 -8.00 -4.00 0 4.00 8.00
Favors IER Favors control
Figure 3: Weighted mean difference in body weight (kg) between the intermittent energy restriction
(IER) interventions and control interventions (CI: confidence interval)
Secondary cardio-metabolic outcomes treatments. However, there was a significant
The study by Varady et al.26 measured cardio-met- increase in the mental health component summary
abolic outcomes including lipoprotein profiles, score, indicating a slight improvement in quality of
however, due to the limited number of studies uti- life in the CER group in comparison to the IER
lizing a control comparator, pooled effect sizes intervention in the study by Harvie et al.19
could not be calculated. The results revealed that
there were no significant between group differences Adverse events
for total cholesterol, LDL and HDL cholesterol or No serious adverse events were reported across
triglycerides for the IER intervention in comparison studies. Three studies reported minor physical and
to no treatment. Meta-analysis was conducted for psychological effects.19,20,26 These were in general
blood pressure, with both studies reporting changes reported for a small number of participants and were
in systolic and diastolic pressures.22,26 There was no reported in both dietary interventions. The physio-
significant effect of IER in comparison to no treat- logical effects included headaches (IER 8%), reduced
ment in changing either blood pressure measure- energy levels (IER 4.9%; CER 5%), feeling cold (IER
ment (Table 4). 4.8%; CER 3%), constipation (IER 6.4%; CER
3%). Light headiness and bad breath were reported
Lifestyle outcomes on IER days for 3% and 8% of participants, respec-
Meta-analyses were not conducted to assess any tively. Psychological effects in both interventions
change in diet, due to limited reliability of reporting included a lack of concentration, pre-occupation
and a lack of valid objective measurements. This was with food, and mood swings (IER: range 3–15%;
also applicable to measures of physical activity. Only CER: range 3–7%). Adverse events were not
three studies measured physical activity through self- reported in studies utilizing a no treatment control
report methodologies, using the International Physi- intervention.22,25
cal Activity Questionnaire19 and physical activity
diaries.20,25 In the study by Viegener et al.25 record- Discussion
ing of physical activity in a diary was included as an Principal findings
outcome. There were minimal and non-significant This systematic review aimed to examine the efficacy
changes reported with no between group differences. of IER as an approach to weight management in
Quality of life was only assessed in two studies19,20 comparison to current clinical practice (CER) or no
and the methodology across studies was not consis- treatment. Based on current evidence, the primary
tent (RAND SF-36 and Profile of Mood Scores). results of the meta-analysis revealed that IER is as
Irrespective of methodology used, improvements effective as CER for short term weight loss. Both
in quality of life were comparable across dietary conditions led to a comparable and substantial
JBI Database of Systematic Reviews and Implementation Reports ß 2018 THE JOANNA BRIGGS INSTITUTE 521
©2018 Joanna Briggs Institute. Unauthorized reproduction of this article is prohibited.SYSTEMATIC REVIEW L. Harris et al.
weight loss (5–10 kg). However, the duration risk factors. However, weight loss based on between-
of the interventions was short (mean duration: group changes in mean body weight revealed that
5.6 months; range: 3 months to 12 months) with mean weight loss (7 kg) was of sufficient magni-
only one study comprising a 12-month intervention tude to be associated with clinical benefits in both
in accordance with current clinical guidance.4,5,14,15 the IER and CER interventions. This is an important
Results from this longer term study revealed that finding which illustrates that participants may have
change in body weight was sustainable in both IER lost equivalent or even greater than the 5–10%
and CER conditions.25 There was a significant inter- target amount and thus provides evidence that the
vention effect of IER on waist circumference and IER may be a clinically important approach for
body fat, in comparison to current CER. Raised weight management. For studies investigating the
waist circumference was the best anthropometric efficacy of IER in comparison to no treatment, mean
predictor of visceral fat, and signals both high percentage weight change was only reported in one
BMI and central fat distribution.29 These results study.20 Mean percentage weight change in this
are promising as reductions in waist circumference study was not of a magnitude associated with clinical
or central fat distribution reduce cardiovascular benefits. Future studies should aim to report per-
risk.30 The reduction in waist circumference may centage weight change and in particular weight
partially explain the decrease in fasting insulin, change associated with improvements in health
although this is also likely to be associated with risk factors.
the periods of acute energy restriction, particularly Despite not reporting clinically important
in the IER group. Waist changes of close to 9 cm weight loss, studies reported measuring changes
reflect a clinically important weight change of close in cardio-metabolic risk factors. The results for
to 9 kg.30 However, the efficacy of changes in the efficacy of IER on cardio-metabolic outcomes
secondary anthropometric outcomes should be inter- in comparison to CER was primarily investigated
preted cautiously due to the limited number of by the two studies by Harvie et al.19,20 Summary
studies. Future studies are required to assess the long estimates revealed that there was a significant
term effects of IER as a treatment approach to reduction in insulin concentrations following IER
weight management. in comparison to CER. A significant reduction in
The second element of the comparison is for the fasting insulin may potentially be attributed in part
two studies for which IER was compared with a to the concomitant significant reduction in total
control group. Both studies prescribed an ADF body fat and central adiposity. Although the mech-
approach to intermittent fasting. As expected when anisms of fasting on improvements on metabolic
offering no treatment as a comparator interven- outcomes are yet to be defined, the improvement in
tion, there was a significant effect of IER in com- insulin sensitivity is most likely to be associated
parison to the control intervention. A significant with periods of acute energy restriction, particu-
between group difference was also replicated in larly on fasting days. However, moderate weight
secondary anthropometric outcomes, waist cir- loss (7% body weight) in obese adults without
cumference and percentage body fat. These results acute periods of energy restriction has also shown
are consistent with the majority of weight manage- improvements in insulin sensitivity after fasting via
ment interventions.31 changes in cytokines, which are altered after weight
loss.32 Therefore, there is insufficient evidence to
Clinical effectiveness determine the acute mechanistic effects of fasting,
Clinical guidelines have concluded that in over- though the mediator for these changes is moderate
weight and obese adults, a reduction in body weight weight loss.33
of 5–10% of initial body weight (or approximately There was no significant difference in treatment
5–10 kg) was associated with improvements in approach on lipoprotein profiles or plasma glucose.
health risk factors.4,5 None of the included studies Despite a lack of between-group effect, both studies
investigating IER in comparison to CER reported reported significant changes in concentrations from
percentage weight change as an outcome and pre- to post-intervention. Although the significance
whether or not participants achieved sufficient of the change in cardio-metabolic outcome was
weight loss associated with improvements in health reported, clinically meaningful changes were not.
JBI Database of Systematic Reviews and Implementation Reports ß 2018 THE JOANNA BRIGGS INSTITUTE 522
©2018 Joanna Briggs Institute. Unauthorized reproduction of this article is prohibited.SYSTEMATIC REVIEW L. Harris et al.
Comparison of change in outcomes with clinically included heterogeneous study designs and observa-
important definitions (based on guidelines from evi- tional studies which induce bias such as unmeasur-
dence based practice4,5 and previous research exam- able confounding factors and reverse causality.
ining clinical risk factor changes in patients with type Randomized controlled trials are considered the
II diabetes)34 revealed that, in general, changes in criterion method to examining the effectiveness
cardio-metabolic outcomes in these studies were not of an intervention37 and therefore this review adds
sufficient to offer health improvements with the to the quality of the current evidence base. Further-
exception of changes in total cholesterol21 and more, this review aimed to fill the gap reported by
LDL cholesterol.26 It is important to note that the previous reviews by providing a more reliable esti-
limited findings of clinical benefits should be inter- mate of the effect size of IER interventions through
preted with caution, as few studies consistently mea- the inclusion of meta-analyses. The findings of the
sured cardio-metabolic outcomes and limited meta-analyses are consistent with the conclusions
reporting of outcomes prevented inclusion of all of previous narrative reviews in providing support
outcomes in the analysis. Furthermore, there were for IER as an effective approach to weight man-
a number of additional biomarkers that were not agement. Overall conclusions from the current evi-
included in the meta-analysis as they were only dence base and this review advocate the need for
measured in one study. For example, IER appeared further high quality, randomized controlled trials
to affect the production of adiponectin this has a to examine the long term efficacy and adverse
crucial role in insulin sensitivity, cancer progression effects of this dietary intervention in comparison
and development. However, due to the limited num- to current clinical practice.
ber of studies and sample sizes of studies, conclu-
sions on the potential health benefits of IER are Methodological limitations
limited and future studies are warranted to elucidate A limitation of the available literature is in relation
the potential metabolic effects of IER. The evidence to the study quality. Only two studies sufficiently
to date does not support any additional metabolic described the process of allocation concealment to
benefit of IER. intervention groups and were considered to be
Maintenance of body weight following a period truly randomized. Furthermore, most studies
of weight loss is an essential component to weight provided insufficient detail to determine whether
management. Evidence has demonstrated that indi- outcome assessors were blinded to treatment allo-
viduals who have sustained changes in body weight cation. Unblinded outcomes have shown to intro-
have been able to adhere to the new healthy lifestyle duce bias in terms of exaggerating the effect size of
choices and remain at a reduced risk of adverse interventions.38 Future studies should provide an
health conditions associated with weight gain.4,5 adequate description of the procedures of random-
Only two of the interventions in this review included ization and conduct single blinded studies to
a weight maintenance phase of varying durations: ensure and confirm that studies are at reduced risk
one month20 and six months.25 Weight loss was of potential bias.
maintained in both interventions, providing evi- High attrition rates were evident in the IER inter-
dence that IER might also be an effective strategy vention. This is comparable to previous reviews of
for preventing weight gain, following a period of weight management interventions,9,39-41 reporting
weight loss. However, future studies with a weight attrition rates of between 30–60%. Attrition rates
maintenance period of adequate duration such as a less than 20% indicate an intervention is acceptable
minimum six months as recommended by clinical and contributed in addition to rigorous study design
guidance is required to elucidate the long term effects (as assessed in the critical appraisal of the included
on sustainability of weight loss and improvements in studies) to a high quality study.42 The attrition rates
health risk factors. were, in general, comparable across treatment
groups, however, four studies reported greater than
Comparison with previous research 20% attrition. This is concerning, due to the short
To the author’s knowledge, this is the first review to duration of studies. Only one study reported attri-
solely include randomized or pseudorandomized tion rate at 12 months (IER 30.2%; CER 28.6%).25
controlled trials. Previous reviews13,35,36 have This was not greater than the studies reporting
JBI Database of Systematic Reviews and Implementation Reports ß 2018 THE JOANNA BRIGGS INSTITUTE 523
©2018 Joanna Briggs Institute. Unauthorized reproduction of this article is prohibited.You can also read