2020 Sustainability Report - Paramount Group Inc.
←
→
Page content transcription
If your browser does not render page correctly, please read the page content below
2020
Sustainability
Report
Introduction and Performance Highlights CEO Letter Environmental Social Governance Appendices
Company Profile
Headquartered in New York
City, Paramount Group, Inc.
(“Paramount”) is a fully-integrated
real estate investment trust that
owns, operates, manages, acquires
and redevelops high-quality, Class
A office properties located in
select central business district sub-
markets of New York City and
San Francisco. As of December 31,
2020, our portfolio consisted of 13
Class A office properties aggregat-
ing approximately 12.9 million
square feet that we own, and six
other properties aggregating one
million square feet that we manage.
Our business strategy is simple
and proven—we focus on the
best markets, own the best assets,
provide superior tenant service,
and hire and retain the best peo-
ple. We believe in staying true to
what we know and do best. This is
our formula for sustained success.
19
Properties
13.9 Million Sq. Ft.
7.5MM
Sq. Ft. 8
7
4.4MM 6
Sq. Ft.
323
5
4
3
NEW
YORK
SAN
FRANCISCO 1.0MM 2
Sq. Ft.
1
MANAGED
Employees
0
329
Tenants
PA R A M O U NT G RO U P, I N C. 2 02 0 SUSTA I N A B I LI T Y R E P O R T 1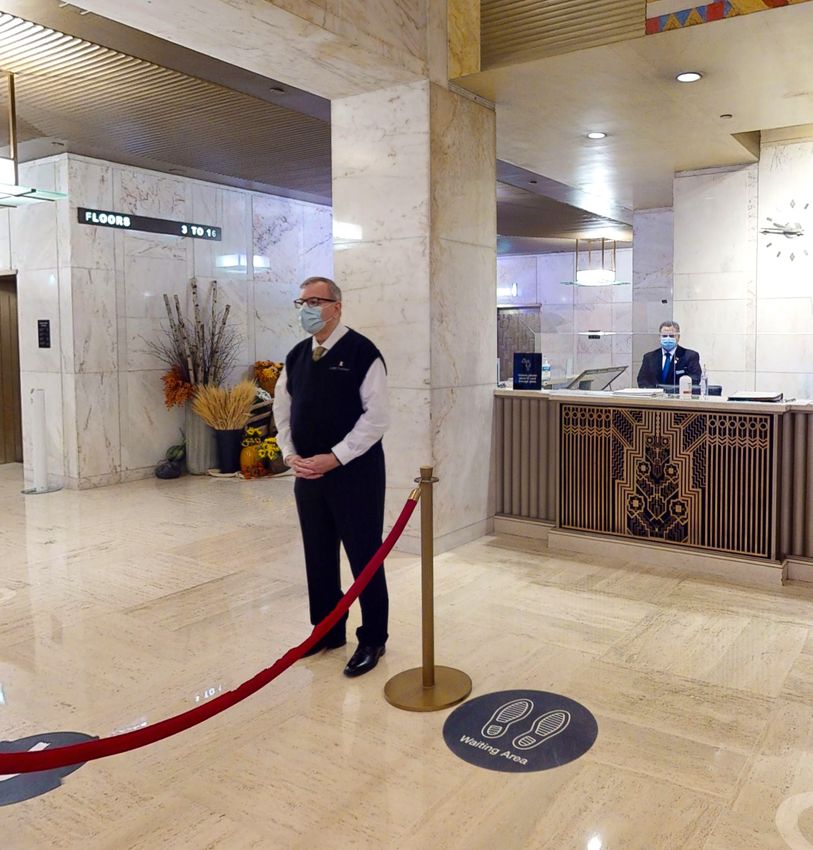
Introduction and Performance Highlights               CEO Letter   Environmental   Social   Governance   Appendices

     2020 Performance
     Highlights

                100%
                                                                                                                                       2020

          Properties Certified LEED
              Platinum or Gold
                                                                             100%
                                                                             Properties Certified
                                                                                                                        “5 Star”
                                                                                                                        Second Consecutive Year

                   17.8
         kWh/SF Energy Intensity
                                                                             59.2%
                                                                       Reduction in Water Intensity
                                                                                                                           42.5%
                                                                                                                          Waste Diversion Rate
                                                                           Since 2016 Baseline

                                                                                                                        Enhanced
                           9                                            Adopted                                        Transparency
          Fitwel Certified Properties
                                                                       “Modified                                       Added Resilience/Climate

      Fitwel Legacy                                                   Rooney” Rule
                                                                                                                        Reporting and GRI and
                                                                                                                            TCFD Indices

       Champion                                                    To Increase Consideration of Diverse
                                                                         Board-Level Candidates

PA R A M O U NT G RO U P, I N C. 2 02 0 SUSTA I N A B I LI T Y R E P O R T                                                                        2
Introduction and Performance Highlights               CEO Letter   Environmental   Social   Governance   Appendices

                                          Environmentally Conscious.
                                             Socially Responsible.
                                         Never before have we been so aware of the impact
                                         that our actions have on each other, both “in the
                                         now” and “in the future.” Whether it is efforts to
                                          reduce greenhouse gas emissions to protect our
                                         climate, efforts to reduce plastic waste to protect
                                        our planet, or a commitment to get vaccinated if we
                                          can to protect each other’s health and economic
                                               well-being, we are all in this together.

                                                          — Albert P. Behler, Chairman, CEO & President

PA R A M O U NT G RO U P, I N C. 2 02 0 SUSTA I N A B I LI T Y R E P O R T                                                          3
Introduction and Performance Highlights               CEO Letter   Environmental    Social    Governance       Appendices

  Letter from
  the CEO

                                                                                                 Albert Behler
                                                                                                 Chairman, CEO & President

     As I write this, business as “almost usual” is becoming a reality.                   improve their occupants’ health and productivity. Our
     Despite the uncertainty brought by 2020, we are slowly but                           endeavor to provide the “safest in class” workspaces took on
     surely finding our way back to normalcy as the government’s                          an entirely different meaning in a COVID-19 environment
     vaccination efforts have yielded tremendous success. We                              as we prepared our buildings for the safe re-entry of our
     successfully navigated the COVID-19 crisis, thanks to the                            tenants and employees. We redoubled our safety efforts,
     resilience of our employees, investors, and the communities                          going above and beyond CDC guidelines. We established
     in which we operate. While there are many key drivers to our                         a COVID-19 response taskforce, updated our cleaning
     success, including our years of discipline in curating a portfolio                   protocols, and installed the highest rated MERV air filters
     of some of the most desirable assets in gateway cities that are                      throughout our portfolio. We conducted regular indoor air
     long-term leased to a blue-chip tenant roster, one particularly                      quality testing. Moreover, to ensure we were using the best
     important driver of this resilience is an Environmental, Social                      in class infection-control policies and procedures we imple-
     and Governance (“ESG”) strategy that is fully integrated                             mented practices recommended by the industry-leading
     into our business. When the world was on pause due to the                            Arc Re-Entry tool. Our efforts didn’t go unnoticed—not
     global pandemic, we took the opportunity to further that                             only by our tenants and employees—but also by the industry
     strategy by improving many of our underlying ESG processes                           in general. We achieved Fitwel certifications for several
     and data analyses. I am therefore proud to present this year’s                       additional buildings, and earlier this year we were honored
     Sustainability Report highlighting our efforts. Never has the                        with the coveted “Fitwel Champion” status for our efforts
     interconnection between our overall performance and our                              in 2020. The past year required us all to find new ways to
     environmental performance, social impact, and governance                             live, work and connect. As vaccines are distributed across the
     policies been more apparent and critical. For this reason,                           country and our tenants and employees return to the office,
     even our compensation committee has for the first time                               we will continue to provide the highest quality workspaces
     approved explicit ESG goals as part of the compensation                              that meet the utmost health and safety standards.
     framework for our executive team.
                                                                                          I am also proud of our other industry-leading ESG practices.
     Even before Paramount went public in 2014, we had endeav-                            In early 2021, we reorganized our Sustainability Committee,
     ored to provide the safest and highest quality workplaces.                           giving it a formal charter and establishing a schedule for reg-
     Before the onset of COVID-19, several of our buildings had                           ular progress briefings to the Audit Committee. I appointed
     achieved Fitwel certifications, which is awarded to buildings                        Gage Johnson, Paramount’s General Counsel, to chair the
     that support healthier workplace environments by helping                             committee, which consists of a diverse group of leaders from

PA R A M O U NT G RO U P, I N C. 2 02 0 SUSTA I N A B I LI T Y R E P O R T                                                                                  4
Introduction and Performance Highlights              CEO Letter   Environmental   Social   Governance    Appendices

              Sustainability is more than just
            environmental performance: it is
             about the impact we leave on the
            world around us, the environment,
               and the communities where
                        we operate.

     each department. One of the first tasks of the committee was                         I n 2021, we plan to further demonstrate our industry
     to prepare a 2 degree Celsius climate impact analysis for our                         leadership by:
     executive team to better inform us about the “why” in our                             Pursuing three additional Fitwel certifications.
     efforts to reduce our environmental footprint. Sustainability
                                                                                           I mproving our environmental impact and reducing our
     is more than just environmental performance: it is about
                                                                                           greenhouse gas (“GHG”) footprint by monitoring each of
     the impact we leave on the world around us, the environ-
                                                                                           our buildings’ monthly progress.
     ment, and the communities where we operate. That is why
     we are proud of the recognition we have received for our                              E
                                                                                            nhancing our governance by aligning disclosures with the
     outstanding ESG efforts this year. Some of these include:                             Global Reporting Initiative (“GRI”).

            020 Global Real Estate Sustainability Benchmark
           2                                                                               S trengthening our resilience to climate impacts and further
           (“GRESB”): We received another GRESB 5-Star Rating                              evaluating any potential climate risks and opportunities for
           in 2020, highlighting our portfolio as a top 10% performer                      our portfolio.
           among American offices, placing us 24% above the global                         E
                                                                                            xpanding our diversity, equity, and inclusion initiatives.
           average and 10% better than our peer companies overall.
                                                                                          We are also committed to learning, listening and doing our
            eadership in Energy and Environmental Design
           L
                                                                                          part to address inequality and promote inclusive diversity.
           (“LEED”): 100% of our REIT portfolio has been certified
                                                                                          This year’s report includes additional data on these issues.
           LEED Platinum or LEED Gold. These certifications reflect
                                                                                          We are excited for the achievements we made together and
           our commitment to minimizing our impact on the environ-
                                                                                          those still to come, and are confident that our innovative
           ment as well as our operating costs.
                                                                                          employees and stakeholders will enable us to meet any
            itwel: We achieved “Fitwel Champion” status with five
           F                                                                              challenges ahead.
           more Fitwel-certified buildings for a total of nine, includ-
           ing three 2-star buildings and six 1-star buildings.                           Best wishes,
           A rc Re-Entry: We have stepped up our facility management
           processes and benchmarked 13 of our properties with the
           Arc Re-Entry tool sponsored by LEED.
                                                                                          Albert P. Behler

                                                                                          Chairman, CEO & President

PA R A M O U NT G RO U P, I N C. 2 02 0 SUSTA I N A B I LI T Y R E P O R T                                                                                 5
Introduction and Performance Highlights               CEO Letter   Environmental     Social    Governance   Appendices

  Environmental
                                                 Wilbur Paes
                                                 Chief Operating Officer, Chief Financial Officer and Treasurer

                                 “As our employees and tenants return to the office
                                 environment, we do not wish for a return to “business as
                                 usual”. We wish to bring forward the lessons we learned,
                  the solutions we created, and the ingenuity we fostered to strategically
                  position ourselves as an ESG champion.”

                                                                                                                                       745 Fifth Avenue (NY)

PA R A M O U NT G RO U P, I N C. 2 02 0 SUSTA I N A B I LI T Y R E P O R T                                                                             6
Introduction and Performance Highlights               CEO Letter   Environmental   Social   Governance   Appendices

     Sustainability Strategy and Goals

     At Paramount, we have an                                                             STEP ONE:
                                                                                          PLANNING (PLAN)
     Environmental Management                                                             We identify target achievement areas by setting goals,
     System (“EMS”) that influences all                                                   objectives and budget parameters for each asset.

     of our sustainability initiatives.                                                   STEP T WO:

     Our EMS is aligned with the                                                          IMPLEMENTATION (DO)
                                                                                          We implement environmental, social and governance project
     ISO 14001 standard and involves                                                      plans for each asset and enroll in local incentive programs.

     four stages as the basis of operation:                                               STEP THREE:

      P
       lan                                                                               VALIDATION (CHECK)
                                                                                          We evaluate the progress and create and implement
      D
       o                                                                                 corrective action plans, if needed.

      C
       heck                                                                              STEP FOUR:

      A
       ct                                                                                EVALUATION (ACT)
                                                                                          We use the results to improve ESG best practices.

     These stages guide our strategy
     to improve our portfolio’s
     environmental performance,
     increase our social impact within
     the community, enhance the health
     and well-being of our tenants and
     employees, and provide transparency
     for our stakeholders.

PA R A M O U NT G RO U P, I N C. 2 02 0 SUSTA I N A B I LI T Y R E P O R T                                                                               7
Introduction and Performance Highlights               CEO Letter        Environmental   Social   Governance   Appendices

     ENERGY STAR® & LEED

     In 2018, the Commercial Building Energy Consumption Survey baseline for ENERGY STAR® was raised from 2003 to 2012
     and so ENERGY STAR® scores across the nation fell, including our own. Paramount has always led the industry in energy
     performance and as we re-doubled our efforts, our buildings’ scores have rebounded and now are even higher than before.
     100% of Paramount’s portfolio is either LEED Platinum or LEED Gold certified. These certifications are a public display of
     our relentless commitment to sustainability and peak building performance.

       BUILDING*                                   LOCATION                  SQ.FT        ENERGY STAR®         LEED

       1633 Broadway                               New York                  2.5 MM                            Gold

       1301 Avenue of the Americas                 New York                  1.8 MM                            Gold

       1325 Avenue of the Americas                 New York                  0.8 MM                            Platinum

       31 West 52nd Street                         New York                  0.8 MM                            Gold

       900 Third Avenue

       712 Fifth Avenue
                                                   New York

                                                   New York
                                                                             0.6 MM

                                                                             0.5 MM
                                                                                                               Platinum

                                                                                                               Gold
                                                                                                                                          13
                                                                                                                                         REIT Assets

       60 Wall Street

       One Market Plaza
                                                   New York

                                                   San Francisco
                                                                             1.6 MM

                                                                             1.6 MM
                                                                                                               Gold

                                                                                                               Platinum
                                                                                                                               12.9MM    Square Feet

       Market Center                               San Francisco             0.7 MM                            Gold

       300 Mission Street                          San Francisco             0.7 MM                            Platinum

       One Front Street                            San Francisco             0.6 MM                            Platinum

       55 Second Street                            San Francisco             0.4 MM                            Platinum

       111 Sutter Street                           San Francisco             0.3 MM                            Gold

PA R A M O U NT G RO U P, I N C. 2 02 0 SUSTA I N A B I LI T Y R E P O R T                                                                             8
Introduction and Performance Highlights               CEO Letter      Environmental            Social     Governance          Appendices

     GRESB

     GRESB is the leading environmental, social and governance                                    Paramount’s overall GRESB score increased from an 85 in 2019
     assessment for real estate companies worldwide. Covering                                     to an 87 in 2020, maintaining our status as an industry leader
     a comprehensive set of key performance indicators, it is one                                 and earning five out of five stars for the second year in a row.
     of the most rigorous standards for real estate companies.                                    We also received the Green Star designation for the third
     Each year, GRESB assesses and benchmarks ESG performance                                     consecutive year. This accolade is awarded to entities with a
     for real estate companies globally, guided by the factors that                               score above a given percentage of the points allocated to
     investors and the industry consider to be material for sustain-                              each category.
     able performance and emerging regulations.

                                                       PARAMOUNT OVERALL                                      CURRENT INDUSTRY OVERALL
                                                          GRESB SCORES                                             GRESB SCORES
                                                                                                                                                           100
                                                                             85                    87
                                                                                                                          79
                                                                                                                                                            80
                                                              71                                         E                                   70
                                                                                                      AS
                                                                                                 RE
                                           54                                             I NC                                                              60
                                                                                    61%

                                                                                                                                                            40

                                                                                                                                                            20

                                                                                                                                                             0
                                           2017              2018            2019                 2020*                  2020              2020
                                                                                                                      Peer Average     Global Industry
                                                                                                                  (American Offices)      Average
                                                                                                                                       (All Asset Types)

                            HIGHLIGHTS
                            Top 10%...                                                            37% Greater...
                            Performance Score for                                                 Performance Score than the GRESB
                            American office assets                                                global average (all asset types)

                            24% Above...                                                          45% Better...
                            the GRESB global average                                              Environmental Score than the GRESB
                            (all asset types) Overall Score                                       global average (all asset types)

                            10% Higher...                                                         Perfect scores...
                            Overall Score than our peer companies’                                in building certifications, data monitoring,
                            (American office) average                                             GHG emissions, environmental targets, policies,
                                                                                                  reporting, and corporate risk assessments

                           * Note: The 2020 GRESB Assessment structure changed fundamentally, establishing a new baseline for Performance, and
                           affecting the comparability of benchmark scores with previous years.

PA R A M O U NT G RO U P, I N C. 2 02 0 SUSTA I N A B I LI T Y R E P O R T                                                                                           9
Introduction and Performance Highlights CEO Letter Environmental Social Governance Appendices
Monitoring Our Sustainability Progress
At Paramount, we know that measurement is a critical sources through energy efficiency measures and by favoring
component of an effective sustainability strategy. In 2018, procurement of renewable energy, including the purchase of
we established historical baselines for energy, emissions, renewable energy credits, when deemed environmentally
water and waste to help crystallize our 2025 goals, which and financially practicable. To achieve our water reduction
has shaped the actions that we take to catalyze the year- targets Paramount has installed high-efficiency fixtures at many
over-year progress towards those goals. of our properties. To achieve our waste goals, we seek to reduce
waste sent to the landfill, and encourage recycling and compost-
To achieve our GHG and energy reduction targets, Paramount
ing when available. We provide the following table evaluating
plans to reduce energy consumption from non-renewable
our progress and informing planned future improvements.
ENERGY 2020 200,135*
CONSUMPTION
in MWh 2019 253,777*
Baseline (2015) 294,094*
191,161*
2025 Target
(35% reduction from baseline)
GHG 2020 50,387*
EMISSIONS
in MtCO2e 2019 64,426*
Baseline (2015) 74,022*
48,114*
2025 Target
(35% reduction from baseline)
WATER 2020 257,313*
CONSUMPTION
in m3 2019 481,739*
Baseline (2016) 629,907*
566,916*
2025 Target
(10% reduction from baseline)
WASTE 2020 42.5%**
MANAGEMENT
% of Waste Diversion 2019 40.1%**
Baseline (2018) 42.9%**
50%
2025 Target
(17% increase from baseline)
* The information above, including baselines and targets, has been adjusted for property acquisitions and dispositions if available.
** Historical waste management data is unavailable for our three most recent acquisitions in San Francisco, so is excluded from 2018 and 2019;
however, data for 55 Second Street is included for 2020.
Paramount’s efforts to reduce energy and water across the portfolio promoted an overall net decrease in
consumption, GHG emissions, and waste production energy and water consumption in 2020, compared to 2019.
resulted in significant resource diversion. In 2020, Paramount:
COVID-19 presented countless challenges to the corporate R
educed energy consumption by 53,642 MWh, or 21.1%,
real estate industry as building management teams sought to equivalent to powering 4,578 homes.
conserve energy while meeting lease requirements and Reduced GHG emissions by 14,039 MtCO2 e, or 21.8%,
ensuring healthy indoor environmental conditions. With equivalent to emissions from 3,053 cars.
buildings in New York and San Francisco, two areas most R educed water consumption by 224,426 cubic meters, or
heavily impacted by the pandemic, our portfolio saw low 46.6%, equivalent to 90 Olympic size swimming pools.
occupancy across the board. Despite these unprecedented R
educed total waste by 3,603 metric tons, or 68.1%,
operating conditions, we committed to maintaining a healthy equivalent to the weight of 12.2 intercontinental jet airliners.
environment for our tenants by installing indoor air quality As we continue to evaluate the impact of Covid-19 and our
sensors and performing routine building flush-outs among level of progress over time, we may adjust these targets to
many other precautionary measures. The low occupancy meet our evolving circumstances and achievements.
PA R A M O U NT G RO U P, I N C. 2 02 0 SUSTA I N A B I LI T Y R E P O R T 10Introduction and Performance Highlights CEO Letter Environmental Social Governance Appendices
Monitoring Our Sustainability Progress (cont.)
RENEWABLE VERSUS NON-RENEWABLE RECYCLING PROGR AMS
ENERGY SOURCES
Waste Management
Electrical and Energy Use O
ur approach to decreasing waste, including hazardous
Gross Total Electrical Use (in MWh) and on a Percentage waste, is to set goals, then to validate progress annually and
Basis by Region adjust as needed.
During 2020, in San Francisco, we used 11,683 MWh (29%) In 2020, we partnered with ProTech, Bee Green, and Renewable
of our electric power from renewable sources and 28,604 MWh Path Inc. to offer our tenants the opportunity to recycle electronic
(71%) from non-renewable sources, with corresponding num- waste (computer monitors, batteries, toner, etc.)
bers in New York of 6,236 MWh (9%) from renewable sources Diverted 40,888 pounds of hazardous waste, enough material
and 66,273 MWh (91%) from non-renewable sources. to fill 2,540 household trash bags
Overall, 16% (17,919 MWh) of our electricity came from
renewable sources, with 84% (94,877 MWh) from non-renew-
able sources.
Our Strategy
O
ur approach to decreasing waste, including hazardous
Gross Total Energy Use (in MWh) and on a Percentage waste, is to set goals, then to validate progress annually
Basis by Region and adjust as needed.
During 2020, in San Francisco, we used 11,683 MWh (21%) Goal: 50% waste recycled and 100% of batteries/lamps recycled
of our energy from renewable sources and 43,339 MWh (79%)
G
oal: 75% of furniture recycled and 70% of construction
from non-renewable sources, with corresponding numbers in
waste recycled
New York of 6,236 MWh (4%) from renewable sources and
138,876 MWh (96%) from non-renewable sources. Overall, A
s we continue to evaluate the impact of COVID-19 and
we used 9% renewable source energy (17,919 MWh) with 91% our level of progress over time, we may adjust these targets
non-renewable source energy (182,215 MWh). to meet our evolving circumstances and achievements.
Energy and electricity is provided by utility providers
(Con Edison, PEPCO, and Pacific Gas & Electric)
through the grid. Totals and percentages above are derived
from the percentages disclosed by our utility providers in
2019 (the most recent available data).
Our Strategy
Our approach to decreasing energy and electrical
consumption from non-renewable sources will be based
on a combination of the following, amongst other
strategies:
Increased tracking and monthly monitoring of this information
at each property
Reduced overall energy and electrical consumption in line with
stated goals
Increased purchases from power plants using wind, solar, hydro
and other renewable sources, where feasible, and purchases of
renewable energy credits
PA R A M O U NT G RO U P, I N C. 2 02 0 SUSTA I N A B I LI T Y R E P O R T 11Introduction and Performance Highlights CEO Letter Environmental Social Governance Appendices
+2°
Resilience
GENER ALLY The framework for our analysis
History teaches that part of running a successful business turns on simply being was in line with that suggested
resilient—i.e., keeping your business running, and even thriving, when adverse events by the Financial Stability Board’s
such as fires, floods, earthquakes, cyberattacks, etc. get in the way. Paramount’s core Task Force on Climate-related
resilience strategy is grounded on (1) being invested in high quality office assets in Financial Disclosures (“TFCD”),
some of the most resilient business markets in the world, and (2) following prudent namely, to consider, among other
long-term business practices such as leasing to creditworthy tenants, insuring our things, the following risks in a 2°
assets against physical loss, following good information security and vendor Celsius scenario:
management practices, and testing our business continuity plan regularly. In 2020, Physical risks to our assets and
Paramount’s short-term resilience was tested across its platform by the global the surrounding New York and San
Francisco economies from what
pandemic with all of its corresponding challenges. Our business continuity planning
scientific research suggests is likely
paid off. Our business has proven robust, and we are positioned to thrive as vaccines to be increased episodic flooding and
are distributed and our gateway markets recover. rising sea levels, albeit likely fully
manifesting only many decades (or
CLIMATE CHANGE SCENARIOS even a century or more) from now
based on NOAA flood models that we
In February 2021, we paused to consider a longer-term threat to our business that accessed at ClimateCentral.org, and
is increasingly important to our stakeholders—specifically, climate change. We using their general assumptions and
included climate change as part of our overall risk management framework which is methodologies. We also assessed
administered by senior management under the supervision of the Audit Committee the location of and potential impact
of our Board of Directors. on building systems at each asset.
When we looked at climate change vulnerabilities, we considered multiple scenarios, Transition risks to our
business as materially lower GHG
starting with what will happen to our business if the earth warms 2° Celsius above
emissions become a goal
pre-industrial levels (the “2° Celsius scenario”), and we also considered opportunities increasingly mandated not just by
that these scenarios could present. As climate change occurs, there are multiple the Paris Accords, but by federal,
aspects of our business that will be impacted. Effects might include rising sea levels, state and local laws and regulations,
extreme weather, increased flooding, and changes in precipitation and temperature. and backed in some cases by
substantial fines on excess emitters,
Any of these developments could result in physical damage or a decrease in rent from,
amongst other remedies, potentially
and the value of, our properties located in the areas affected by these conditions. necessitating the need for increased
capital expenditures in our financial
planning to lower our emissions and
mitigate potential fines.
PA R A M O U NT G RO U P, I N C. 2 02 0 SUSTA I N A B I LI T Y R E P O R T 12Introduction and Performance Highlights CEO Letter Environmental Social Governance Appendices
+2°
The maps shown here demonstrate how our buildings are affected in the 2° Celsius sce-
nario. Paramount owns a number of properties in low-lying areas close to sea level, mak-
ing those assets, and the economies in which they reside, susceptible to adverse effects
from a rise in sea level and any associated increase in episodic storm surges. If sea levels
near our target markets were to rise as shown here, we could incur material costs to pro-
tect our low-lying properties, or we could sustain damage, a decrease in demand for or
total loss of these assets. These would obviously be part of significant adverse impacts on
the transportation systems and local and regional economies in which our properties are
located.
We emphasize that these analyses are preliminary and incorporate a number of scien-
tific and financial planning assumptions that may or may not turn out to be accurate.
They follow complex models concerning various ice sheets and glacier melts, and
assume, for example, a significant delay between GHG emissions and a warming cli-
mate, that no seawalls are built in our markets, and that there are no significant dis-
coveries in atmospheric carbon reduction, all of which, if varied, could produce
significantly different results. (See forward-looking disclosures page.) Still, these anal-
yses are a good start for us to acknowledge the importance of climate change and
focus us on how to address it proactively.
New York City (2° Celsius Scenario) San Francisco (2° Celsius Scenario)
2° C Warming (3.6° F) 2° C Warming (3.6° F)
Paramount buildings shown as orange dots
2° Celsius scenario assumes a 15.4 ft. average sea level rise at high tide. Other major assumptions: Accounts for carbon emissions only; Assumes global
cooperation (Paris, etc.); Uses NOAA ground-level estimates; No local seawalls; No discovery regarding reversal of atmospheric carbon uptake, etc.
4° Celsius scenario (not shown) results were similar, but with the coastline moving even higher into New York City and San Francisco for even greater
impact and potential economic stress. This scenario assumed a 29.2 ft. average sea level rise at high tide. Other assumptions were the same as the 2%
Celsius Scenario but with no Paris Accord in force and other mitigants over time to avoid more drastic outcomes.
PA R A M O U NT G RO U P, I N C. 2 02 0 SUSTA I N A B I LI T Y R E P O R T 13Introduction and Performance Highlights CEO Letter Environmental Social Governance Appendices
OUR EVOLVING CLIMATE STR ATEGY AND CONTINUED
FOCUS ON LOW CARBON INVESTMENTS
As a result of these analyses, Paramount has begun implementing an active climate
change strategy incorporating new disciplines into various aspects of our business—
e.g., monitoring the GHG emissions (in MtCO2e) of each of our buildings on a monthly
basis (and diligencing the location and GHG emissions of potential new acquisitions)
to help ensure that we remain on track to comply with the strict local requirements to
which we are now subject (e.g. NYLL 97 and SF ordinance 200–19, Ch.30) that are
designed to reduce GHGs and increase the level of renewable versus non-renewable
energy we use. Because we operate in forward-looking jurisdictions where local laws are
generally designed to be in line with the goals articulated by the Paris Accords, this
strategy should, over time, help keep our emissions in line with those permitted by
the Paris Accords, and thus not only help protect our assets, but help contribute to our
Assess Vulnerability +
chance of delaying and or escaping the more significant risks of a warming climate Plan & Response =
more generally. By following this strategy, we can also reduce and or hopefully elim- Resilience (Respond
inate potential fines that we will now be monitoring on a periodic basis as part of & Recover)
our long-term financial planning.
Paramount’s sustainable procurement practices also play a role here because these not only
Improved
apply to product procurement (see “Supply Chain Management”), but also to large roof
insulation
capital expenditures, investments, and even building acquisitions. Paramount considers
the environmental and emissions impacts of potential assets as part of the due diligence
process. This process should help ensure that over time Paramount will only invest in
low-carbon opportunities. As exemplified by our portfolio’s ENERGY STAR® Ratings
and LEED certifications, Paramount’s entire portfolio consists of low carbon investments Backup
generators
relative to traditional real estate assets.
NOT JUST RISK, BUT OPPORTUNITY…
Paramount is proud to have been an environmentally sensitive company for many years, Mechanical
spaces located on
well before it was fashionable—consider our record with LEED and ENERGY STAR® higher floors to
certifications. By providing increased transparency in the climate area, we hope to avoid flooding
give ourselves the tools to make better, environmental-friendly decisions, not only
in acquisitions and property management, but in identifying areas where we might Upgraded lighting
systems
further distinguish ourselves as a climate champion—for example by the use of “green to reduce energy
demand
bonds.” This is a great opportunity for us to lead and to save money by being energy
efficient and lowering waste and minimizing fines along the way. This exercise will
make us even more resilient. These issues matter to our stakeholders, including, we
believe, our tenants, and will be a driver for our continued success. As the saying Retro
commissioning
goes, change is inevitable. As a company that focuses on resilience, our goal is not and energy
audits
simply to survive, but to prosper when change comes!
Building
emergency
response
plans
PA R A M O U NT G RO U P, I N C. 2 02 0 SUSTA I N A B I LI T Y R E P O R T 14Introduction and Performance Highlights CEO Letter Environmental Social Governance Appendices
Leadership on
Local Laws
View of 745 Fifth Avenue (NY) from Central Park
Owning and operating an industry-leading real estate portfolio not only means managing Class A office buildings with some of
the industry’s most efficient equipment, but also monitoring, complying with, and supporting local sustainability and climate-
focused regulatory efforts. We own and operate Class A office buildings in New York and San Francisco, cities that have their
own unique laws and regulatory requirements. We not only meet but exceed local regulations in the communities where we
operate. Here are just some of the local laws and regulations we comply with and are proud to support:
Local Law 84 (New York) Benchmarking
Local Law 84 requires that all buildings over 25,000 square feet annually track their energy use and
water consumption through New York City’s ENERGY STAR® Portfolio Manager template.
A ll of Paramount’s buildings have used ENERGY STAR® Portfolio Manager for benchmarking.
This process has helped to standardize environmental metric tracking and has provided cross-
comparable benchmarks across all of our New York City buildings.
Local Law 33 (New York) Energy Efficiency Labels
Local Law 33 requires that buildings required to benchmark their energy efficiency are also required
Local Law 33 to post energy efficiency labels such as ENERGY STAR® scores and corresponding grades from A-D.
100% of our New York City portfolio has been ENERGY STAR® -certified with an average score
of 81, or equivalent to a “B” energy efficiency grade under Local Law 33.
Local Law 87 (New York) Energy Efficiency Audits
Local Law 87 requires that all New York buildings over 50,000 square feet undergo periodic energy
audits, retro-commissioning, and submit an Energy Efficiency Report to the city every 10 years.
Our buildings proactively undergo comprehensive energy audits every couple of years both to
comply with Local Law 87 as well as ensure our buildings’ equipment functions optimally, which
in turn also reduces operational costs. Over the last few years, we began early retro-commissioning
ahead of Local Law 87 mandates, and our sustainability consultant, SIG, performed all necessary
studies for early compliance. The findings from those reports have helped us better plan and
allocate capital to retrofit our buildings’ equipment.
PA R A M O U NT G RO U P, I N C. 2 02 0 SUSTA I N A B I LI T Y R E P O R T 15Introduction and Performance Highlights CEO Letter Environmental Social Governance Appendices
One Front Street (SF)
Local Law 97 (New York) Carbon Emissions Targets
Local Law 97, also known as the Climate Mobilization Act, established carbon emission reduction
NYC
LOCAL LAW requirements for most New York City buildings over 25,000 square feet. Covered buildings are
97
required to meet their emission targets, set by property type, with the first compliance deadline in
2024. The emission targets become progressively more strict in 2030 and 2035.
We track the carbon emissions of all our buildings and are aligning our portfolio to comply with
Local Law 97’s carbon emission reduction targets.
®
CALGreen (California)
California’s Title 24 - Part 11: Green Building Standards Code, better known as CALGreen, sets
standards for sustainable building design, construction, and retrofitting, including standards for:
energy efficiency, water conservation, resource use efficiency, and environmental impacts. California
updates CALGreen periodically. The recent 2019 CALGreen update sets new requirements for electric
vehicle charging stations, bike parking, water reuse systems, and light pollution.
To align with California mandates, our San Francisco buildings have focused on benchmarking,
disclosing building performance, and ramping up energy auditing. Two of our San Francisco
buildings have also designated bike parking.
an
Francis
c
Ordinance No. 200-19, Chapter 30 (San Francisco)
S
o
Ordinance No. San Francisco’s Ordinance No. 200-19, Chapter 30, mandated that by December 31, 2022,
200-19 nonresidential buildings over 500,000 square feet purchase and/or generate onsite renewable energy
Chapter 30
sources to meet 100% of their building’s electricity demand by 2024.
We are aligning our San Francisco portfolio to comply with Ordinance No. 200-19’s renewable
energy targets.
PA R A M O U NT G RO U P, I N C. 2 02 0 SUSTA I N A B I LI T Y R E P O R T 16Introduction and Performance Highlights CEO Letter Environmental Social Governance Appendices
Social
Peter Brindley
Executive Vice President, Head of Real Estate
“While our focus has always been the health and well being
of our employees and tenants, our response to the COVID-
19 pandemic only served to highlight it!”
Lobby View of 31 West 52nd Street (NY)
PA R A M O U NT G RO U P, I N C. 2 02 0 SUSTA I N A B I LI T Y R E P O R T 17Introduction and Performance Highlights CEO Letter Environmental Social Governance Appendices
COVID Response
In 2019, Paramount began
expanding our corporate
focus to include human
health and ensure that our
buildings promote the health
of our tenants, their employ-
ees, and the surrounding
community. When our nation
entered a global pandemic,
our first thought was how to
protect our tenants and our
employees. As is the case for
many of our tenants, within
Paramount we know that our
employees are our greatest
asset and their health and
well-being is our greatest
concern.
We have undergone several
corporate initiatives that focus
on healthy building entrances,
thorough workspace cleanli-
ness, and responding to
tenant expectations. For the
benefit of our employees and
our tenants, Paramount has
implemented our tenant
re-entry initiatives aligned
with Arc Re-Entry’s best
management practice recom-
mendations for cleaning,
lobby protocols, and exceed-
ing tenant and employee
expectations.
Lobby View at 745 Fifth Avenue (NY)
PA R A M O U NT G RO U P, I N C. 2 02 0 SUSTA I N A B I LI T Y R E P O R T 18Introduction and Performance Highlights CEO Letter Environmental Social Governance Appendices
BUILDING CLEANING HEALTH AND
AND LOBBY INITIATIVES SAFETY OF
ENHANCEMENTS EMPLOYEES
BUILDING AND LOBBY CLEANING INITIATIVES HEALTH AND SAFETY OF
ENHANCEMENTS EMPLOYEES
I mplemented continuous clean-
I nstalled thermal cameras in
ing and disinfection services for equired daily health screening
R
each lobby to take temperatures
all common areas and high- surveys.
for tenants, employees and
touch points.
visitors. equired bi-monthly COVID-
R
erformed weekly electrostatic
P 19 testing for employees.
stablished the following
E
disinfecting spray downs.
policies and protocols: rovided PPE, hand sanitizer,
P
Entrance and exit guidelines eployed portable ultraviolet
D disinfecting wipes and spray to
to ensure a safe path of travel light units to disinfect elevator employees.
into and out of the building cabs.
I mplemented temporary
Limited elevator and Installed Portable Disinfecting
alternate rotation schedule for
stairwell occupancies Filtration Systems (DFS) in
corporate employees.
Mask requirements for all common areas.
tenants, employees and Reconfigured workspaces
visitors to establish proper social
Installed the following in distancing where needed.
common areas, including our educed occupancy in common
R
corporate office: areas.
Touchless hand sanitizer
stations dopted strict quarantine and
A
Social distancing and testing guidelines for employees
maximum occupancy signage who travel and are affected by
Plexiglass shields where COVID-19.
needed stablished visitor restrictions
E
Technology to enable for essential services and meet-
reduction of high ings only.
touch-points
Upgraded to MERV-13 filters
in all HVAC systems.
Increased outside air intake to
maximum levels.
Installed Indoor Air Quality
(IAQ) sensors to monitor
indoor air quality.
Cleaned and flushed all
domestic water systems and
proactively performed periodic
legionella testing.
PA R A M O U NT G RO U P, I N C. 2 02 0 SUSTA I N A B I LI T Y R E P O R T 19Introduction and Performance Highlights CEO Letter Environmental Social Governance Appendices
PROPERTIES CERTIFIED IN 2020:
16 33 Broadway
Walk Score of 99
Paramount has always placed high
Two health programming events offered each month
value on human health. In 2020,
Walking distance to Hell’s Kitchen Park with basketball and handball courts
Paramount earned Fitwel certifica-
Restaurant, gym, and coffee shop within building
tion for five of our REIT properties
bringing our total certifications to 1325 Avenue of t he A mer ic as
nine, plus one managed asset, and
Walk Score of 99
we achieved the coveted “Fitwel
Access to 8 subway lines, including 4 that are through covered walkways
Champion” designation in early
Near Abby Aldrich Rockefeller Sculpture Garden
2021.
Pedestrian arcade with seating next to building
The Paramount portfolio has an 712 Fif t h Avenue
average WalkScore of 98.5 out of
100. Each property is in an excellent Walk Score of 97
location, with options for public Views of Central Park and Manhattan
transportation and outdoor amenities. Drinking water supply is quality tested twice per year
Paramount’s Fitwel buildings all Subsidized membership to Equinox gym 0.2 miles away
advocate for tenant health and 55 Second St re et
safety with exterior lighting, outdoor
Walk Score of 97
walking trails, and emergency
Close to trails and outdoor fitness classes in Salesforce Park
preparedness plans. While each
0.2 miles from extensive farmers market at Crocker Galleria year-round.
property has individual strengths,
25 on-site bike racks available with showers on-site
Paramount’s commitment to high
quality locations and unparalleled 111 Sut ter St re et
views is evident. Walk Score of 99
Onsite 24-Hour Fitness
Near the Presidio Trust Park and Saint Mary’s Square
Access to views and operable shades to increase tenant comfort control
74 5 Fif t h Avenue (M anag ed Prop er t y)
Walk Score of 100
Walking distance to Grand Army Plaza & Pulitzer Fountain
Thermal control for tenants
Walking distance to athletic fields in Central Park
PA R A M O U NT G RO U P, I N C. 2 02 0 SUSTA I N A B I LI T Y R E P O R T 20Introduction and Performance Highlights CEO Letter Environmental Social Governance Appendices
2019 Ice Cream Social event at 745 Fifth Avenue (NY)
Employee Engagement
Paramount places great value in being an equal opportunity
employer that strives to provide a variety of benefits for our
employees and create a higher quality of life. Our employees
are a top priority, and it is our goal to keep our employees
2019 Health Fair event at 712 Fifth Avenue (NY)
safe and our workplaces dynamic.
HEALTH AND WELLNESS FAMILY
Medical, dental and vision coverage Paid parental leave
Health Savings Account Dependent Care FSA
Healthcare Flexible Spending Account (“FSA”) Life and Accidental Death & Dismemberment Insurance
Limited Healthcare FSA FINANCIAL WELLNESS
Paid short and long-term disability leaves 401(k) retirement plan with matching program
omplimentary Employee Assistance Program providing
C Complimentary one-on-one financial planning sessions
confidential counseling for various issues that impact with our 401(k) provider
mental health, such as:
Stress and depression Commuter benefits program
Relationship struggles EMPLOYEE ENGAGEMENT EVENTS
Drug and substance abuse
Financial hardship Wellness day:
Flu shots
omplimentary Benefit Advocacy Center to assist
C Biometric testing
employees with various medical questions, such as: Virtual fitness classes
General medical benefits available Wellness gifts to promote healthy lifestyles and habits
Explanation of benefits
Claims issues JP Morgan Corporate Challenge
Prescription and pharmacy issues Cycle for Survival
Subsidized gym memberships Employee satisfaction survey
Complimentary fresh fruit, water and tea Summer internship program
PA R A M O U NT G RO U P, I N C. 2 02 0 SUSTA I N A B I LI T Y R E P O R T 21Introduction and Performance Highlights CEO Letter Environmental Social Governance Appendices
Employee Training
WORKPLACE AND SAFETY RELATED TRAININGS TECHNOLOGY RELATED TRAININGS
Preventing discrimination and sexual harassment Cybersecurity and security awareness
Code of business conduct and ethics Social engineering red flags
Fire safety and fire prevention practices Other financial application trainings:
Microsoft Office applications
Active shooter response
Excel
Bloodborne pathogens Word
PowerPoint
Electric safety
Outlook
Hazardous communications Teams
Visio
Preventing back injuries
RGUS and ARGUS Taliance
A
Preventing injuries when lifting, moving and transferring
CapEx database
Slip, trip and fall prevention MRI fixed assets
Nexus
Proper use of PPE
Telecom expense management
Earthquake safety training (San Francisco only)
ccupational Safety and Health Administration (OSHA)
O
10 course
Cardiopulmonary resuscitation (CPR) training
PROPERTY MANAGEMENT RELATED TRAININGS
R itz-Carlton Leadership Center
old Standards of Leadership
G
Customer Experience and COVID-19 Respose
New York Security Guard State certification training
ontinuous educational courses through Building
C
Owners and Managers Association (BOMA), Local 94
and Local 32BJ
PA R A M O U NT G RO U P, I N C. 2 02 0 SUSTA I N A B I LI T Y R E P O R T 22Introduction and Performance Highlights CEO Letter Environmental Social Governance Appendices
“New Lobby” Breakfast at 712 Fifth Avenue (NY) Pride Event at One Market Plaza (SF)
Diversity, Equity and Inclusion
While the social unrest that was brought to center stage last equal opportunity, discrimination, and harassment, and
year and the continuing attacks against some minority groups require participation in training on these matters.
in 2021 have captured public attention, they were by no
At Paramount, we are committed to fostering an inclusive
means the beginning of the movement in America for a more
workplace. We promote a culture of inclusion and value
just and equitable world. Racism and discrimination are
diverse viewpoints to strengthen our management practices
unacceptable in our society and never tolerated at Paramount.
and empower us to adapt to new challenges. While we do
We are committed to equal opportunity and workplaces that not have all the answers, we are committed to listening,
are free from discrimination or harassment on the basis of race, learning, and doing our part.
religion, sex, color, national origin, creed, ethnicity, age, dis-
Our Board of Directors recently conducted a review of all of
ability, political affiliation, sexual orientation, gender identity
our governance policies at the Board level relating to diversity
or expression, or any other status protected by applicable law.
and inclusion. As a result, the Nominating and Corporate
Recruitment, hiring, placement, development, training, com-
Governance Committee revised its polices and procedures
pensation and advancement may not be based on any of these
to add a “modified Rooney rule” provision (to use the
factors, but should instead be based on rational factors such as
sports analogy) which mandates the consideration of director
qualifications, performance, skills and experience. We do not
candidates of diverse race and gender whenever this
accept disrespectful or inappropriate behavior, harassment or
representation is lacking.
retaliation in the workplace or in any work-related circum-
stance outside the workplace. We provide each of our employ-
ees with detailed policies and materials to inform them on
EMPLOY EE METR ICS
CORPORATE
323
TOTAL EMPLOYEES
Female
Minorities
55 %
41 %
PROPERTY MANAGEMENT
Female 20 %
Minorities 52 %
94
CORPORATE
TOTAL WORKFORCE
Female 30 %
Minorities 49 %
WOMEN IN LEADERSHIP
229
PROPERTY MANAGEMENT
Women on Management Team
Women on Board of Directors
30 %
22 %
PA R A M O U NT G RO U P, I N C. 2 02 0 SUSTA I N A B I LI T Y R E P O R T 23Introduction and Performance Highlights CEO Letter Environmental Social Governance Appendices
May Lau
Vice President, Human Resources
“Our investments in human capital have been rewarded
by a diverse workforce and strong employee tenure.”
EMPLOYEE DIVERSITY AND RETENTION
On average, employees choose to ETHNICITY
ETHNICITY DATA
Total
DATA BY
BY REGION
REGION
Total Organization
Organization by
by Region
Region
GE
GE
remain with Paramount for NY
NY &
& SF
SF NY
NY SF
SF DC
DC NY
NY &
&
nearly eight years, with executives
39
39
remaining for nearly 14 years. 107
107 10
10 52
52
22
EMPLOYEE RETENTION 55
55
Average Tenure—Total Organization 7.7 years 100
100 99
42
42
11
Average Tenure—Executive Team 14 years
C
Coorp
rpoora
rattee P
Pro
roppeert
rtyy M
Maannaaggeem
meenntt C
Corpo
orpo
White
White Minority
Minority
GENDER DIVERSITY BY REGION AGE
AGE DIVERSITY
DIVERSITY
Total Organization by Region Total
Total Organization
Organization
DC NY & SF NY SF DC
34
61
61
52 10
2 2 25
25
173
108
108
9 87
87
42 12
12
1 1 30
30
t C o r p o r a te
te Property Management Under
Under 30
30 30–50
30–50 Over
Over 50
50
Male Female Male
Male Female
Female
PA R A M O U NT G RO U P, I N C. 2 02 0 SUSTA I N A B I LI T Y R E P O R T 24Introduction and Performance Highlights CEO Letter Environmental Social Governance Appendices
Human Rights
Unless a company is thoughtful about its day-to-day manage- All identified risks were addressed with specific actions and
ment policies and practices, business-as-usual activities can commitments in our Human Rights Policy. Specifically,
pose a risk to human rights. To mitigate these, in 2019 Paramount prohibits unfair work hours, forced labor,
Paramount implemented a formal Human Rights Policy. In human trafficking, and child labor. In our Human Rights
establishing this, Paramount considered several potential Policy, we also state our commitment to upholding workers’
risks that the traditional business-as-usual operations rights to the freedom of association and collective bargain-
could pose to human rights including: ing as well as providing reporting opportunities for any
Unsafe, unhealthy, or unsecure workplaces potential rights violations. We expect our suppliers and
vendors to uphold these principles and urge them to adopt
Workplace health, safety, and security
similar policies within their own businesses, and we have
Unfair work hours, forced labor, human trafficking,
a program to monitor compliance by our top business
and child labor
counterparties*. For more information on our human rights
L ack of reporting opportunities
values, please see our Human Rights Policy.** This was
Human rights violations in our supply chain adopted by our CEO in 2019 and has been reported to the
L ack of freedom of association and collective bargaining Paramount Board of Directors.
*Starting in 2021, the program will cover over 50 of our top counterparties including vendors and suppliers. This covers substantially all of our “critical vendors.”
**Human Rights Policy can be found on our website under the “Sustainability” tab.
PA R A M O U NT G RO U P, I N C. 2 02 0 SUSTA I N A B I LI T Y R E P O R T 25Introduction and Performance Highlights CEO Letter Environmental Social Governance Appendices
Philanthropy and
Tenant Engagement
Paramount believes giving back to the
communities around you is a basic
corporate responsibility.
Over the years Paramount has been proud to support various
charities and educational programs, both directly and by sponsor-
ing programs together with our tenants:
City Harvest food drives
Citymeals on Wheels
lothing and back-to-school supply and toy drives for local
C
charities
Education Through Music
Halloween candy drive for our troops
ids for Kids Foundation toy drives through St. Jude Children’s
K
Research Hospital
eukemia & Lymphoma Society fundraiser through NARS
L
Cosmetics
Reach Out and Read book drives
Red Nose Day
St. Francis Food Pantries & Shelters
World Central Kitchen
PA R A M O U NT G RO U P, I N C. 2 02 0 SUSTA I N A B I LI T Y R E P O R T 26Introduction and Performance Highlights CEO Letter Environmental Social Governance Appendices
Supply Chain
Management
Supplier enjoying spring event at 55 Second Street (SF) 2019 Earth Day event with Vendors at One Market Plaza (SF)
Paramount’s environmental In addition, we have implemented specific procurement poli-
cies and procedures which also aim to protect both human
footprint goes beyond just water health and environmental well-being by, for example, listing
and energy use in our buildings, minimum standards for use of materials that are locally
sourced, that contain certified recycled content, or that are
and also includes our supply chain otherwise designed to limit adverse impacts on human health
impacts. To help mitigate human and the environment:
HUMAN HEALTH STANDARDS
and environmental impacts Use of low VOC paints and sealants
resulting from our supply chain, Use of San Francisco Tier III pesticides
Use of low mercury lamps
we have implemented several ESG
ENVIRONMENTALLY FRIENDLY
and procurement policies aimed at PRODUCT CHOICES
reducing our upstream effects. Ecologo
Green Seal
The first component of our program is to provide our key CRI Seal of Approval
vendors and suppliers with copies of Paramount’s own FSC paper
enterprise-level Human Rights and Environmental Policies,
10% post-consumer or 20% post-industrial recycled content
and apprise them of our expectation that they too should
50% rapidly renewable materials
comply with those key elements that can fairly be applied to
50% harvested/extracted and
our supply chain. Starting in 2021, this is further explained processed/manufactured within 500 miles
in our Vendor Code of Conduct which sets forth additional ENERGY STAR® products
broad social and environmental principles for our vendors
and suppliers.* Our EMS now requires that we provide training to our
employees about our expectations in the procurement area
so that they can ensure successful communications with
our contractors and other vendors and suppliers concerning
these standards.
*Our Vendor Code of Conduct and monitoring program covers over 50 of our major vendors and suppliers and also requests compliance
information concerning certain information security practices. The information security requirements will also be applied to our partners.
PA R A M O U NT G RO U P, I N C. 2 02 0 SUSTA I N A B I LI T Y R E P O R T 27Introduction and Performance Highlights CEO Letter Environmental Social Governance Appendices
Governance
Gage Johnson
Senior Vice President, General Counsel and Secretary
Chair of the Sustainability Committee
“What gives a business ‘sustainability’ if you are its General
Counsel and focused on governance aspects? It’s simple. Have
a strong chief executive who can make decisions quickly and nimbly, and who
empowers and expects his executive team to do the same, while also having a
system of checks and balances in place, including an active board of directors
to provide guidance and oversight as needed, time-tested policies and procedures
to set a baseline for behavior, and transparency in reporting. Said differently:
know who has the ball on any given issue, and then hold them accountable
every day. That’s sustainability!”
PA R A M O U NT G RO U P, I N C. 2 02 0 SUSTA I N A B I LI T Y R E P O R T 28Introduction and Performance Highlights CEO Letter Environmental Social Governance Appendices
Corporate Governance
& Ethics
At Paramount we are proud of
our governance structure,
since having good governance
practices is the key to any
long-term, successful business.
There are both “general” ele-
ments to this structure, as
well as specific elements we
have built in over the last two
years to enhance sustainabil-
ity oversight at all levels.
GOVERNANCE HIGHLIGHTS
Code of Business Conduct and
Ethics Applicable to all
Directors, Officers and
Employees
A nnual Ethics Training and
Certifications for all
Corporate Office Employees
to Monitor Internal
Compliance
Ethics Hotline for
Confidential Reporting of
Issues Directly to Lead
Independent Director and
Chairman of Audit
Committee
8 of 9 Independent Directors
Majority Voting in
Uncontested Elections
L ead Independent Director
Chairman/CEO for Clear
Chain-of-Command
Quarterly Executive Sessions
of the Board without
Management
NCG, Audit and
Compensation
Committees are 100%
Independent
Formal policies covering
Political Contributions,
Shareholder Communications,
and Audit Committee
Complaint Procedures
31 West 52nd Street (NY)
PA R A M O U NT G RO U P, I N C. 2 02 0 SUSTA I N A B I LI T Y R E P O R T 29Introduction and Performance Highlights CEO Letter Environmental Social Governance Appendices
Board + ESG Oversight
The implementation of a sustainability strategy is essential
to our business operations and ensuring the creation of
lasting value for our stakeholders. At Paramount, the
Audit Committee of the Board of Directors is generally
responsible for oversight of our financial statements,
Board of Directors
PARAMOUNT
enterprise risk management, and compliance with legal and
regulatory requirements. These responsibilities are crucial
elements of our sustainability strategy.
In May 2020, the Board of Directors vested the Audit
Committee also with additional oversight responsibility for
environmental and social matters, including sustainability,
Audit Committee
climate change, corporate social responsibility, and health and
safety. In January 2021, our CEO appointed Gage Johnson,
the company’s General Counsel, to chair our manage-
ment-level Sustainability Committee. The committee meets
monthly and oversees and implements the Company’s sus- Sustainability Committee
tainability goals and ensures they are fully integrated into our
business strategy.
SUSTAINABILITY COMMITTEE RESPONSIBILITIES
Sustainability Team
Improve the environmental performance at all assets
Increase social awareness and the health and well-being of
employees and tenants
Provide spaces that promote physical health and mental Tenants, Suppliers,
well-being and are focused on tenant satisfaction
Report on the Company’s achievements toward best-in-class
Investors, Employees and
governance and transparency efforts including coordinating
internal and external stakeholder engagement
Communities
The Sustainability Committee chair reports to the CEO and
Audit Committee, as needed. The Sustainability Committee
also advises the Audit Committee and Board of Directors as
requested on sustainability strategy, emerging regulatory and
compliance issues, EMS updates, and stakeholder engagement.
The Sustainability Committee supports the implementation
of the Company’s sustainability goals, policies, and initiatives
that benefit Paramount stakeholders. This year, our executive
management team has an even stronger interest in the commit-
tee’s success because our Compensation Committee has
approved ESG-centric key performance indicators that will
impact variable pay awards. These encourage, for example,
achievement of additional LEED, ENERGY-STAR® and Fitwel
certifications, and increases and improvements in various ESG
ratings of leading organizations. We have included the current
Sustainability Committee and Sustainability Team members
on the following page.
PA R A M O U NT G RO U P, I N C. 2 02 0 SUSTA I N A B I LI T Y R E P O R T 30You can also read