ANNUAL REVIEW 2018/ 2019 - Banking Standards Board
←
→
Page content transcription
If your browser does not render page correctly, please read the page content below

BA N K I N G
BO A R D

               ANNUAL REVIEW 2018/ 2019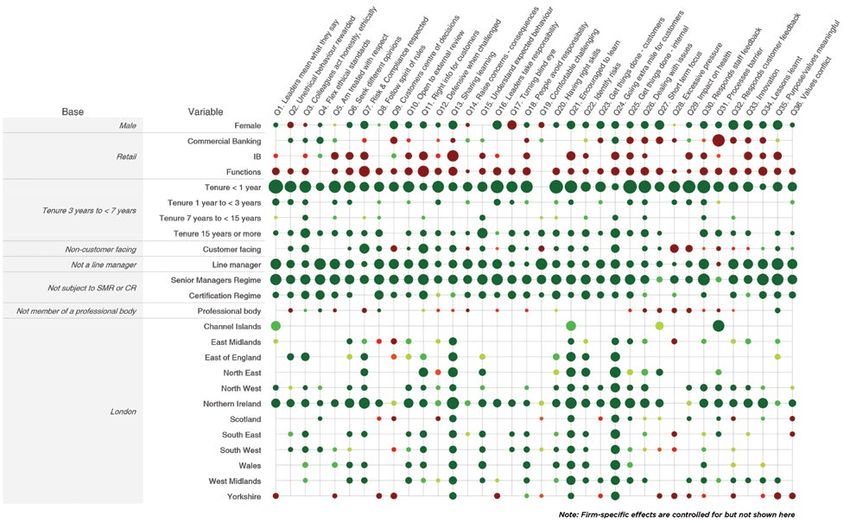
BA N K I N G                                                     BSB Annual Review 2018/2019

BO A R D
                                   TABLE OF CONTENTS

   CHAIRMAN’S FOREWORD                                                              6

   CHIEF EXECUTIVE’S REPORT                                                         8

   EXECUTIVE SUMMARY                                                                10

   THE 2018 ASSESSSMENT APPROACH                                                    13

   FINDINGS FROM THE 2018 SURVEY                                                    16

   SPEAKING UP AND LISTENING                                                        28

   PERCEPTIONS OF GENDER EQUALITY                                                   36

   VALUES AND CUSTOMER FOCUS                                                        46

   WELLBEING                                                                        53

   NEXT STEPS                                                                       61

   ANNEX A — ABOUT THE BSB                                                          62

   ANNEX B — THE BSB ASSESSMENT OF CULTURE, BEHAVIOUR AND COMPETENCE                66

   ANNEX C — 2018 BSB EMPLOYEE SURVEY QUESTIONS                                     70

   ANNEX D — METHODOLOGY USED IN THIS ANNUAL REVIEW                                 74

   ANNEX E — ADDITIONAL REGRESSION RESULTS BY BUSINESS AREA                         78

                                                                                               2
BA N K I N G                                                                              BSB Annual Review 2018/2019

BO A R D
                                           TABLE OF FIGURES
   1. BSB Assessment Framework                                                                               13

   2. Making sense of BSB Survey data (using Q1 as an example)                                               15

   3. BSB Survey responses 2016 – 2018                                                                       16

   4. BSB Survey 2018 responses, by business area                                                            17

   5. Who responded to the BSB Survey in 2018?                                                               17

   6. BSB Survey results — 2018 change from 2017                                                             18

   7. BSB Survey results — 2017 change from 2016                                                             18

   8. BSB Survey scores by characteristic 2016 – 2018                                                        19

   9. BSB Survey scores by question 2016 – 2018                                                              20

   10. BSB Survey Q16 ‘I believe senior leaders in my organisation take responsibility,                      21
   especially if things go wrong’ 2016 – 2018

   11. BSB Survey 2018 results, by characteristic                                                            22

   12. BSB Survey scores by business area 2016 – 2018                                                        23

   13. BSB Survey 2018 results — women’s responses relative to those of men                                  24

   14. BSB Survey 2018 scores by tenure in firm and banking sector                                           25

   15. Top 25 words employees used to describe their firm 2016 – 2018                                        25

   16. Top 25 words employees used to describe their firm, by business area 2016 – 2018                      26

   17. On balance, how positive are the words used by employees to describe their firm?                      27

   18. BSB Survey 2018 responses to speaking up questions (Q12, Q14 and Q19)                                 29

   19. BSB Survey scores — speaking up questions (Q12, Q14 and Q19) 2016 – 2018                              30

   20. BSB Survey 2018 additional questions — speaking up                                                    31

   21. BSB Survey 2018 additional question — issues about which employees had wanted                         31
   to raise concerns

   22. BSB Survey 2018 additional question— issues about which employees had wanted to raise                 32
   concerns, by business area

   23. BSB Survey 2018 additional question — proportion of employees who had wanted to raise                 33
   concerns, who did so

   24. BSB Survey 2018 – employees’ experience of feeling listened to, by type of concern                    34

                                                                                                                        3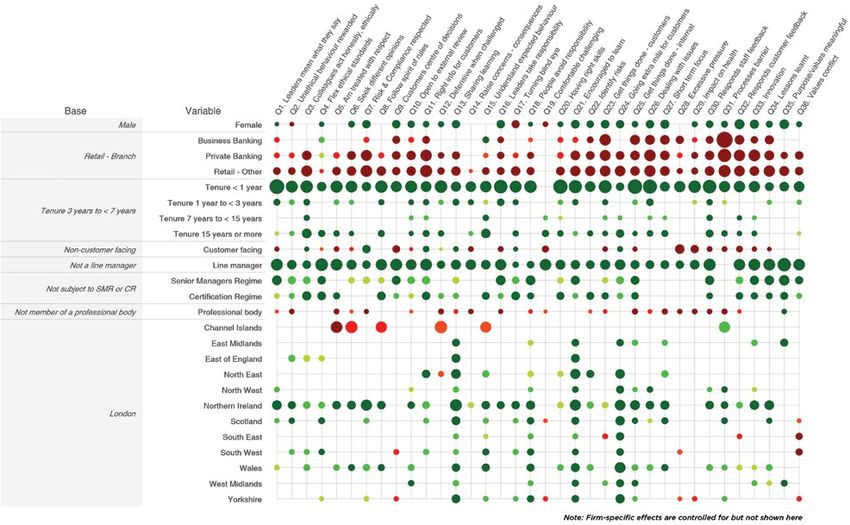
BA N K I N G                                                                           BSB Annual Review 2018/2019

BO A R D
   25. BSB Survey 2018 additional questions — (Of those who did raise their concerns)                     34
   Do you feel your concerns were (or are being) listened to and taken seriously?

   26. BSB Survey 2018 — proportion of employees who raised a concern and proportion                      35
   who felt listened to, by issue

   27. BSB Survey 2018 — reasons given by employees for not speaking up                                   36

   28. BSB Survey 2018 — reasons given by employees for not speaking up, by concern type                  37

   29. BSB Survey 2018 — futility and speaking up: perceptions and experiences, by business area          38

   30. BSB Survey 2018 additional questions — perceptions of equality of opportunity, by gender           40

   31. BSB Survey 2018 additional questions — perceptions of equality of opportunity, by gender           41
   and business area

   32. Qualitative analysis — choosing focus groups on which to apply grounded theory based               42
   on higher or lower Survey scores

   33. Identifying practices associated with good environments                                            43

   34. Gender equality — frequency with which issues were mentioned in focus groups from                  44
   higher and lower-scoring business areas in 2018 (differentiating factors)

   35. Gender equality — frequency with which issues were mentioned in focus groups from                  45
   higher and lower-scoring business areas in 2018 (shared factors)

   36. Grouping together firms’ stated values                                                             46

   37. Distribution of firms’ stated values                                                               47

   38. BSB Survey Q35 ‘My organisation’s purposes and values are meaningful to me’, at                    48
   firm level 2016 – 2018

   39. BSB Survey Q35 ‘My organisation’s purposes and values are meaningful to me’, by                    48
   business area 2016 – 2018

   40. BSB Survey Q36 ‘There is no conflict between my firm’s stated values and how we                    49
   do business’, at firm level 2016 – 2018

   41. BSB Survey Q36 ‘There is no conflict between my firm’s stated values and how we do                 50
   business’, by business area 2016 – 2018

   42. BSB Survey 2018 responses to customer-related questions (Q9, Q11, Q23, Q24, Q32 and Q33)           51

   43. Analysis of qualitative evidence gathered from focus groups on customer focus                      52

   44. BSB Survey Q28 ‘I often feel under excessive pressure to perform in my work’, at firm level        54
   2017 and 2018

   45. BSB Survey 2018 Q28 ‘I often feel under excessive pressure to perform in my work’,                 54
   by business area

                                                                                                                     4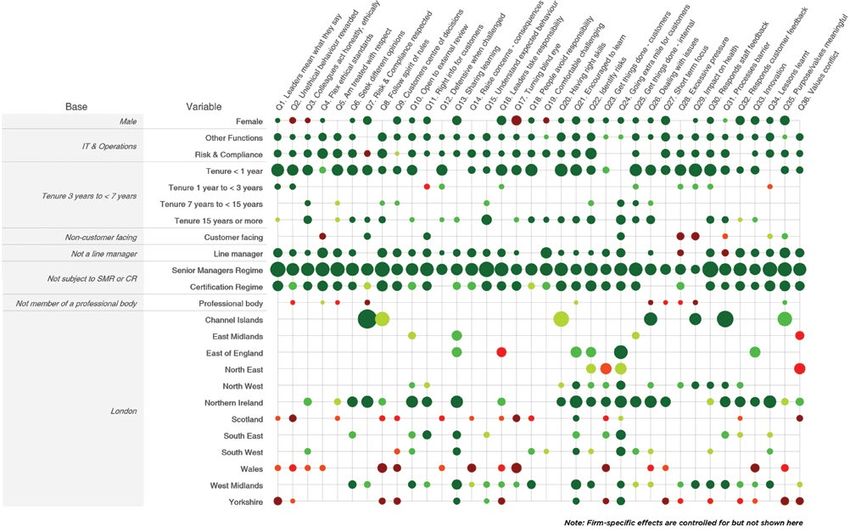
BA N K I N G                                                                        BSB Annual Review 2018/2019

BO A R D
   46. BSB Survey Q29 ‘Working in my organisation has a negative impact on my health                   55
   and wellbeing’, at firm level 2017 and 2018

   47. BSB Survey 2018 Q29 ‘Working in my organisation has a negative impact on my health              55
   and wellbeing’, by business area

   48. BSB Survey 2018 additional question — Q29a ‘Could you tell us what it is about working          56
   in your organisation that causes this?’, by factor

   49. BSB Survey 2018 additional question — Q29a ‘Could you tell us what it is about working in       57
   your organisation that causes this?’, by factor by business area

   50. BSB Survey 2018 — words used by employees in response to Q29a, relating to workload,            58
   long hours, pressure of expectations and resources

   51. BSB Survey 2018 — words used by employees in response to Q29a, relating to                      59
   working relationships

   52. BSB Survey 2018 — words used by employees in response to Q29a, relating to                      59
   physical environment

   53. BSB Assessment Framework                                                                        64

   54. Making sense of the data                                                                        75

   55. BSB Survey results 2018 by characteristic                                                       76

   56. Series of regressions and tests used to confirm robustness of results                           77

   57. BSB Survey 2018 — Retail ordinal logit results                                                  78

   58. BSB Survey 2018 — Commercial Banking ordinal logit results                                      79

   59. BSB Survey 2018 — Investment Banking ordinal logit results                                      79

   60. BSB Survey 2018 — Functions ordinal logit results                                               80

                                                                                                                  5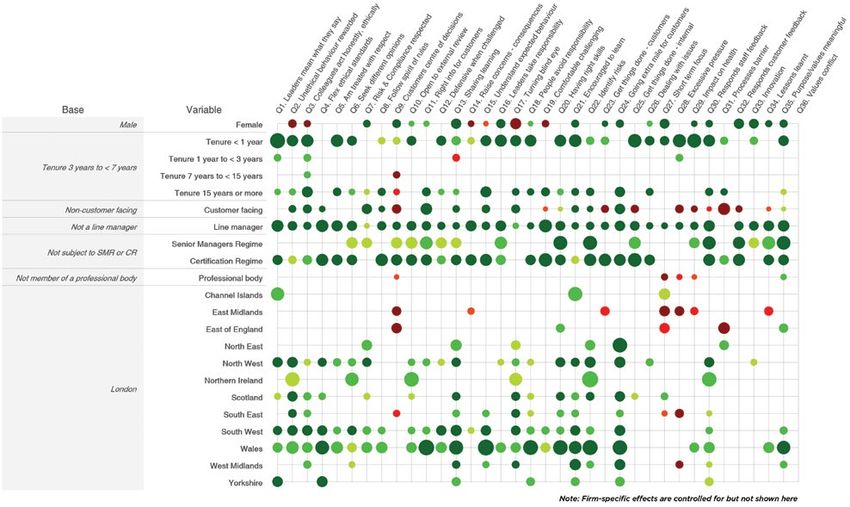
BA N K I N G                                                                                               BSB Annual Review 2018/2019

BO A R D

                                                    CHAIRMAN’S FOREWORD
      Ten years have passed since the financial crisis of 2008, which had enormous repercussions for people's
      welfare and the economic stability of many countries. There have been major developments as a
      consequence, many of them in the area of financial regulation. Regulation and the sanctions of the law have a
      very important part to play in responding to such catastrophic events.
      In the UK, the Parliamentary Commission on Banking Standards* ranged widely in its work to try to get to
      the bottom of what had happened and why. The Parliamentary Commission had some penetrating things to
      say about how the failures of the financial services sector had badly affected people's trust in the financial
      system. And one of the consequences of this suggested focus on ‘trust’ and ‘trustworthiness’ was the project
      to establish a Banking Standards Board (BSB).
      The distinctiveness of the BSB, which opened its doors in early 2015, was that it was not, and is not, a product
      of the law. It is instead a non-statutory collaborative effort, financed by the industry but steered by a strategic
      board, which has a majority of its people drawn from public life and working alongside industry practitioners.
      The second element of its distinctiveness is that it aims to focus on what it believes is the fundamental driver
      of how things are done in any business — the culture of the business.
      The BSB’s starting point is that the distinctive culture of any business will be a fundamental determinant of
      outcomes. And that, unless and until the culture of a business, which (among other things) involves a common
      purpose shared and carried through by everyone at all levels in the business, is clearly and consistently
      focused on doing the right things, then a business will not be worthy of trust.
      Trustworthiness is of the essence for the financial sector, as we saw in 2008, when it was lost.
      The BSB has developed a set of metrics for measuring key elements of the culture of its member firms. In
      this Review we report on the progress that has been made by firms themselves over the past three years in
      understanding their culture and, in some cases, changing it. I say ‘in some cases’: some, both large and small,
      have distinctive cultures that lead to good outcomes, and their membership of the BSB and participation in
      our work helps us all to understand the deep drivers of combining good business with good outcomes for
      customers, clients, members, employees and indeed society as a whole.
      This Annual Review reports on the results of our third Survey to which more than 72,000 people responded.
      We have also held many focus groups to explore specific issues and spoken individually with a large number of
      senior executives and board members.
      Key issues that have emerged, and which are unpacked in more detail in the body of this report include:
             •     Senior leaders in the banks are now perceived by their colleagues to be taking more
                   responsibility and to be more credible. As we note later, this result is of course consistent with,
                   and no doubt reflects, the considerable regulatory focus on responsibility and leadership in
                   recent years.
             •     The counterpart of encouraging people to speak up is a willingness to listen and act, at all
                   levels of a business. The Survey results show a much less positive picture here, reflecting either
                   a fear of consequences, or a conviction that speaking up would be futile.
     * http://www.bankingstandardsboard.org.uk/wp-content/uploads/2016/03/banking-standards-report.pdf

                                                                                                                                         6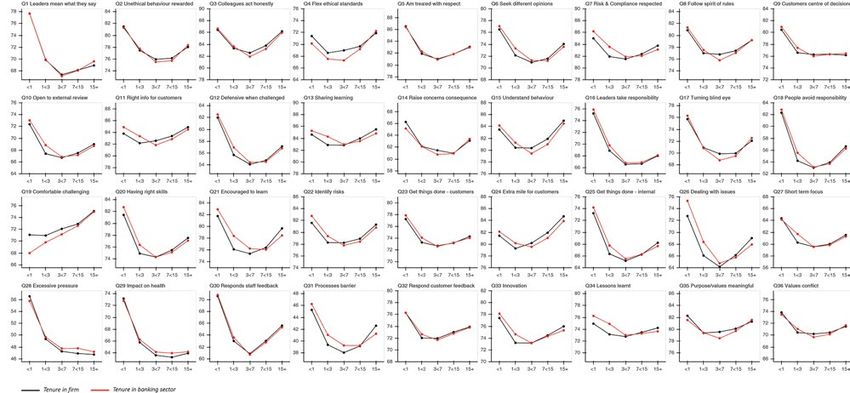
BA N K I N G                                                                            BSB Annual Review 2018/2019

BO A R D
           •   A quarter of all employees in our Survey say that working at their firm has had a negative
               impact on their health and wellbeing — a number that has barely changed in the three years
               we have been carrying out this Survey.
           •   Complex internal systems and processes are frequently identified by people working in firms
               as the main barrier to being able to serve customers well.
           •   Perceptions of equality of opportunity between men and women are strongly influenced by
               the leadership, or failure to exercise leadership, in this area by senior people in the firm.

     All of this is discussed in much greater detail in what follows.
     The overall picture is one of uneven progress.
     Is this a cause for concern?
     From the many discussions we have with firms in the BSB, we would say: these results are telling us that,
     making continuing significant changes to the method of operation of large and/or long established businesses
     is a hard slog, and that many firms are in the hard yards of achieving progress in improving their culture.
     The results in 2018 are not, in our view indicative of any reduction in the strong commitment of our member
     firms to making continuing improvements to their culture and practices, in the interest of their customers and
     their employees.
     The data accumulated over a (now) three-year period also allow us to focus on a wide range of issues that
     between them, go to make up a culture of trustworthiness.
     Rebuilding trust, and making themselves worthy of being trusted, is a long job. But the very fact of the
     existence of the BSB, and the participation of leading firms in the industry, is an important measure of firms’
     commitment to the job.
     The BSB does a lot more than running the Survey, the results of which are reported here. We are committed
     to identifying, supporting and sharing best practice across a wide range of issues, and to helping firms develop
     practical interventions and assess the effectiveness of these interventions. To carry through this wider work,
     we are very much supported not only by many member firms but by organisations in other sectors and wider
     civil society.
     We are grateful to you all.
     In the coming year we will be working with firms, both inside and outside the banking sector, particularly on:
           •   decision-making — using both the BSB Survey and other approaches to understand better the
               connection between decision-making, a firm’s social purpose, and outcomes.
           •   technology and culture — digging down into the perspectives of the people who design and
               manage technology for our member firms and their customers or members.
           •   speaking up and listening — collaborative work to understand best practice and to share it.

     I am personally grateful to the members of the Board of the BSB for all their hard and effective work this
     year. Two new members joined us this year, Loretta Minghella and Sir Alan Wilson, and each has brought new
     dimensions to our work.
     And I have been very pleased to be able to support the Irish banking industry in the setting up of the Irish
     Banking Culture Board.
     I am also grateful to all those in the UK and overseas who have worked with us this year and look forward to
     their continuing support for the BSB.

                                            Dame Colette Bowe, Chairman

                                                                                                                        7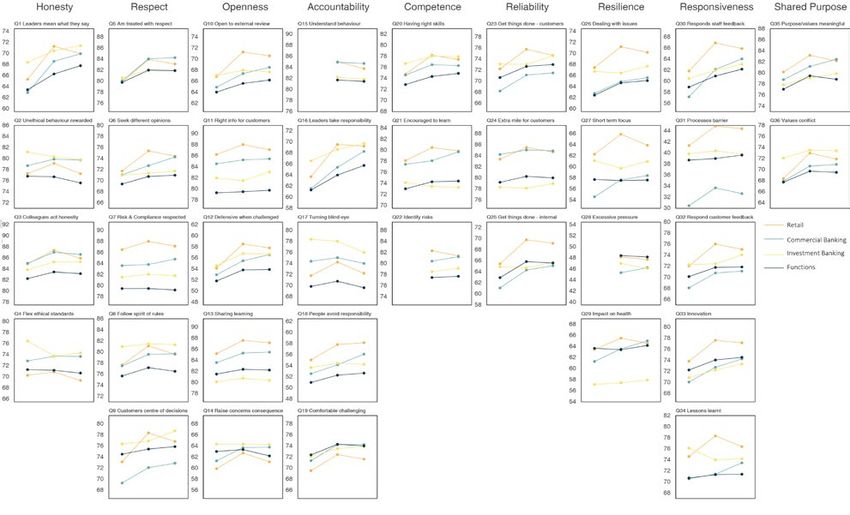
BA N K I N G                                                                              BSB Annual Review 2018/2019

BO A R D

                                     CHIEF EXECUTIVE’S REPORT
     Every organisation has its own culture (and some may have several); a continually evolving product of its
     leadership, people, environment and history. The question for boards and leadership teams of UK banks and
     building societies — and indeed for firms in any sector, in any jurisdiction — is not why they should care about
     culture. The implications of not doing so have made headlines on all too many occasions. The question is how
     best to create and maintain a good culture.
     Our annual Assessment examines the extent to which characteristics that we would expect to be associated
     with any type of good organisational culture, are demonstrated by and within firms. Over the three years
     that the BSB has been open for membership, we have seen member firms across the banking sector invest
     considerable time and resource in efforts to understand and manage their cultures. That our Survey scores in
     2018 showed, on aggregate, little change, may therefore seem surprising as well as disappointing. This makes
     it all the more important that we understand developments over the past year; not in order to ignore the
     sideways move or pretend it does not matter, but so as to interpret it correctly and act on it effectively. Three
     observations may be helpful here.
           •   First, on the data itself. While Survey scores across firms in aggregate showed little change in
               2018, movement was more evident within and between firms and business areas, and the
               overall sideways pattern followed broad-based increases in 2017. Taking 2016 to 2018 as a
               whole, the picture is one of improvement but with the gains concentrated in the earlier part
               of the period and then maintained but not extended. 2019 will help us see which year was the
               more representative of the direction of travel.
           •   Second, on causality. We cannot infer from these results that firms ‘tried harder’ in 2017 or
               took culture less seriously in 2018. Changing an organisation’s culture takes time and progress
               is likely to be uneven. The more positive picture of 2017 will have reflected in part initiatives
               that began well before that year, and the sideways pattern in 2018 could be consistent with
               firms having taken effective action, but with more time needed before the results are felt.
               Or, of course, neither of these may be the case. The effectiveness of what firms are doing (or
               could do) to manage their culture is, however, a question that we hope to cast light on both
               as our evidence base grows over successive time periods, and through our newly established
               Insights team.
           •   Third, on context. UK firms are operating in an environment of considerable change —
               domestic, global, technological and competitive — bringing its own uncertainty and pressure
               for employees at all levels. This is not to say that more improvement should not have been
               seen in 2018, or to excuse the lack of it. It is, rather, to consider whether firms may have been
               running hard simply to stand still. If so, this makes it all the more important that ongoing
               efforts to manage organisational culture are carefully targeted, and that outcomes are
               appraised and learned from so that more substantive progress can be achieved.

                                                                                                                         8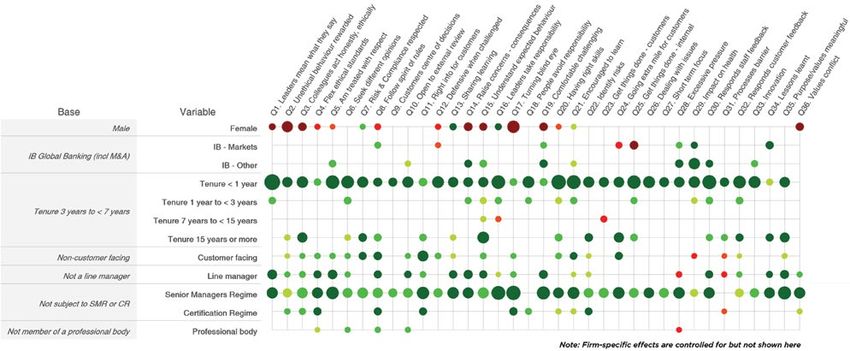
BA N K I N G                                                                             BSB Annual Review 2018/2019

BO A R D
     To help us analyse the Assessment data, translate it into practical information and work with firms to test the
     effectiveness of specific interventions, we have increased the BSB’s capability and capacity in behavioural
     economics and behavioural science. This is enabling us both to work with a wider range of experts and
     partners globally, and to learn more from the BSB’s unique and rapidly growing data set. 72,024 employees at
     26 firms responded to the Survey in 2018; this followed 36,268 respondents in 2017 and 28,113 in 2016. Nine
     firms in 2018 also took part in the qualitative Assessment exercise, during which we listened to 837 employees
     in 89 focus groups around the UK and interviewed 59 senior executives and 12 non-executive directors.
     The 2018 Assessment saw us undertake the Survey outside the UK banking sector for the first time. This
     included both the non-UK banking operations of some member firms, and member-firm non-banking
     operations in the UK. We also ran the BSB Survey in autumn last year for a number of banks in Ireland,
     providing a set of baseline data for these firms and for the newly established Irish Banking Culture Board.
     While this Annual Review focuses only on results drawn from UK banking sector members, the underlying
     approach — one in which firms take responsibility for managing culture, and are prepared to ask themselves
     difficult questions, invite independent scrutiny, and focus on outcomes — has application beyond the UK and
     outside the banking sector.
     We are grateful to all those employees, executives and board members who participated in the 2018
     Assessment and helped with the practicalities of running the exercise at their firm. We would also like to thank
     the members of our Certification Regime Working Group (whose experience has underpinned the publication
     of a set of widely shared good practice guidance on this topic). Thank you also to everyone who has attended,
     hosted or spoken at BSB events and workshops through the year, sharing experiences and perspectives
     on issues ranging from wellbeing to what research tells us about ethical behaviour, and from disruptive
     technology to the role of general counsel in banking.
     For banks and building societies, raising standards of behaviour and competence across the sector is a
     collective as well as an individual challenge. More than this, it is a responsibility and an opportunity. In an
     environment of ongoing change, having the right culture — a culture that promotes high standards, and
     produces good outcomes for customers, clients, members, employees, the economy and society as a whole
     on a sustainable basis — becomes all the more important. Even standing still, in such a context, may take
     considerable effort. Simply standing still, however, is not enough.

                                           Alison Cottrell, Chief Executive

                                                                                                                        9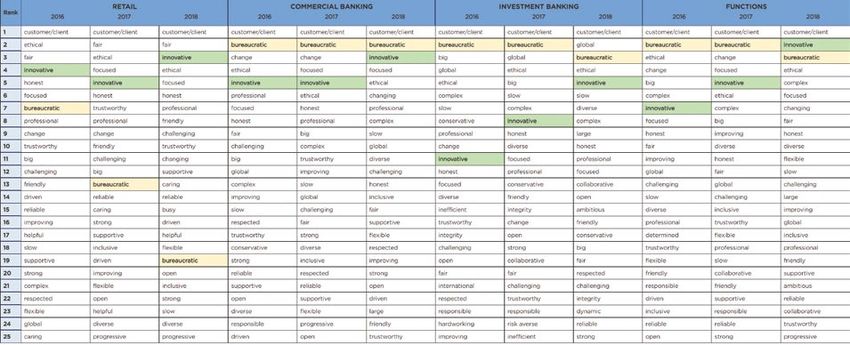
BA N K I N G                                                                            BSB Annual Review 2018/2019

BO A R D
                                         EXECUTIVE SUMMARY
      2018 marked the third year of the BSB’s annual Assessment. This is an exercise designed to inform, support
      and challenge banks and building societies that are committed to managing their cultures and raising
      standards of behaviour and competence across the sector, and prepared to invite an independent and
      comparative perspective in order to help them do this as effectively as possible. 72,024 employees across
      the UK and at all levels responded to the 2018 Survey, sharing their observations and perspectives on their
      firms. We also held focus groups with 837 employees to explore particular themes in more detail, received
      submissions from boards, and talked individually with 71 senior executives and non-executive board
      members.

      Drawing on all of this information enables us to build a picture of how far individual firms, and firms
      collectively, demonstrate characteristics that we would expect to be associated with good organisational
      cultures, i.e. cultures that produce good outcomes for a firm’s customers, clients or members, employees,
      the economy and society as a whole. Participating firms can monitor their progress and that of different
      business areas within the organisation, both over time and relative to other firms; and looking across the
      results as a whole, the BSB can identify common themes, emerging issues or areas of good practice that
      can then be explored with members to promote continuous collective improvement.

      Survey scores in 2018 showed, on average, little change across firms as a whole. This followed
      improvements in most question scores in 2017. The gains of the previous year were therefore maintained
      in 2018 but not, on aggregate, extended, despite the ongoing investment of time and resource by firms
      in managing their cultures. The reasons for this could be many and various. ‘Easy wins’ may, for example,
      have been exhausted, and some initiatives in managing culture may have been less effective than others.
      Initiatives already underway may prove to be effective, but may not have had time to come to fruition. As
      banking and society continue to change, banks and building societies will need to persevere in determining
      what does and does not work.

      The scale of participation in the Assessment exercise, as well as firms’ engagement with the BSB’s work
      more broadly, signals a strong commitment on the part of member firms to continuous improvement
      and to raising standards across the sector. As we continue to analyse the 2018 results, a number of initial
      observations can be made that firms will wish to take into account and that will help shape the BSB’s own
      work over the coming year.

      In the context of largely unchanged headline Survey scores in 2018, perceptions of leaders continue
      to improve

      Survey scores were, on average and across all firms, largely unchanged in 2018 (though greater movement
      was seen between and within firms). Scores relating to perceptions of leaders, however, continued to
      improve. The Survey question that has seen the largest positive change since it was first asked in 2016,
      relates to whether employees see senior leaders take responsibility when things go wrong. This ongoing
      improvement in leadership-related scores comes in the context of a considerable focus on leadership over
      recent years, and the introduction of the Senior Managers and Certification Regime.

      Listening up is as much of an issue as speaking up

      Of those employees who said in 2018 that they had wanted over the past year to raise a concern about
      something at work, 63% said that they had done so. 40% of those who spoke up said, however, that they
      had not felt listened to or taken seriously, and a further 19% were unsure.

      The experience of those who do speak out about something may affect the willingness of others to do
      likewise (whether that experience is relayed directly or observed at a distance). A firm that wishes to
      encourage people to say when something is going wrong or could be improved, needs to demonstrate
      beyond doubt — and keep on demonstrating — that it welcomes feedback and is prepared to listen to it.

                                                                                                                      10
BA N K I N G BSB Annual Review 2018/2019
BO A R D
Our findings also suggest a mismatch within individual firms between the extent to which those who
choose not to speak up, think that they would be listened to and the experience of those who do speak
up. These mismatches can run in either direction (i.e. the reality may be better, or worse, than the
expectation), posing different challenges for firms in addressing them.
Our 2018 results also suggest that individuals are more likely to be prepared to challenge what they see
as behaviour or practices that might damage the firm, its customers or markets than they are to speak up
about bullying, discrimination and harassment. Firms need to consider how to encourage speaking up on
both organisational issues and personal concerns, recognising in particular the importance of how the firm
itself listens and responds, and is seen to listen and respond.
A quarter of banking employees say that working at their firm has a negative impact on their health
and wellbeing; a proportion that has barely changed over three years, notwithstanding the attention
that firms have been giving this issue
More than four in ten employees who took part in the BSB Survey in 2018 said that they felt under
excessive pressure at work. This picture was consistent across all business areas.
A quarter said that working at their firm had an adverse impact on their health and wellbeing, with the
most common reasons given for this being an excessive workload, the pressure of expectations and a
lack of resources. Issues relating to line management, working relationships and the physical working
environment were also frequently mentioned. Some factors were more prevalent in different parts of the
banking sector. A relatively high proportion of employees in Retail Branch, for example, cited targets and
goals as affecting their health and wellbeing, while in Investment Banking long hours and a poor physical
working environment were mentioned more frequently than elsewhere.
This does not of course mean that employees in the banking sector are necessarily under greater pressure
than in other sectors, or that an adverse impact of work on wellbeing is particularly marked in banking.
The proportions may be higher or lower in other sectors. They may also, within the banking sector itself,
have been higher or lower in previous periods. None of this, however, detracts from the need for the
banking sector to address its own present problems. Issues around wellbeing and stress matter if we want
and expect people to be able to exercise judgement, manage risk, take decisions and demonstrate high
standards of behaviour and competence at work.
Customer-facing employees point to the complexity of internal systems and processes
as the main barrier to being able to serve customers well
55% of employees said that their firm’s internal processes and practices were a barrier to continuous
improvement. This proportion has shown little change over the three years of the Survey. Efforts to address
the issue may, however, be starting to have an effect; for the first time in our Survey, ‘innovative’ was more
commonly used by employees to describe their firm than ‘bureaucratic’.
As in 2017, 79% of employees said that their firm put customers at the centre of business decisions; 9%
disagreed.
Retail and Commercial Banking employees described greater efforts being made by their firms, using
different methods and new technology, to provide information in a way that catered to the needs of
different customers. Employees in both business areas, however, also referred to insufficient resources or
an overly risk-averse approach as constraining them in their efforts to serve customers well.
Perceptions of equality of opportunity between men and women are more positive in
business areas where leaders are seen to take responsibility for the need to improve
On average, 83% of men and 80% of women said that opportunities at their firm were equal irrespective
of gender. There was some variation between firms and business areas; perceptions among women were
11BA N K I N G BSB Annual Review 2018/2019
BO A R D
most negative in Investment Banking, where 24% of women felt that men had greater opportunities in
their firm.
Employees in most focus groups noted the limited representation of women in senior positions at their
firm. Other common observations were that:
• taking maternity or paternity leave hindered career progression;
• policies to promote gender equality were applied inconsistently across the firm; and
• their firm’s culture was itself a barrier to gender equality.
In areas of firms that scored relatively highly on perceived equality of opportunity, focus group participants
were more likely to talk about gender inequality as a challenge for the firm itself, to be self-critical on the
part of the firm, and to refer to senior-sponsored initiatives to raise awareness of gender inequality and
address it. In focus groups from lower-scoring business areas, gender tended to be described more as a
sector-wide problem than a firm-level issue, and employees were more likely to mention concerns about
positive discrimination.
Where leaders take personal ownership of tackling gender inequality and take steps to raise awareness
of and tackle the issue in their own firm, employees are more likely to recognise and be critical of the
progress the firm still needs to make, but also more likely to see equal opportunities by gender within the
firm. Accepting the issue as an industry fact of life, by contrast, does not appear to reduce its resonance
within the firm; rather, a perceived reluctance to discuss or take responsibility for tackling gender
inequality is associated with employees being less likely to regard opportunities as equal within the firm.
Next steps
Over the coming year, and informed by both the results of the 2018 Assessment and our wider work, the
BSB will explore three themes in particular:
• decision-making — using both the BSB Survey and other approaches to understand better the
connection between decision-making, a firm’s social purpose, and outcomes.
• technology and culture — digging down into the perspectives of the people who design and
manage technology for our member firms and their customers or members.
• speaking up and listening— collaborative work to understand best practice and to share it.
Alongside this, we will continue with work already underway on important topics such as wellbeing, the
question of what ‘good’ looks like for consumers of banking services, and (with our Certification Regime
Working Group) effective implementation of the Certification Regime. Sharing learning and experience
across member firms through BSB events and our Member Forum will remain a key activity. As we
continue to analyse the cumulative body of Assessment data and work with member firms and with other
organisations (both within and outside the UK banking sector), further topics and issues may of course
emerge, and our work programme will be kept under review.
We are continuing to develop the BSB Assessment with a view to making it ever more useful for member
firms. The Survey was run in 2018 across different countries and with some non-banking business areas
of global banking groups, demonstrating the scalability and applicability of this exercise for international
members and firms based outside the UK. While designed with the banking sector in mind, the issues that
the Survey explores are not unique to any sector or jurisdiction and we are continuing to talk with a variety
of organisations outside the UK banking sector.
12BA N K I N G BSB Annual Review 2018/2019
BO A R D
THE 2018 ASSESSMENT APPROACH
2018 was the third year in which the BSB conducted its Assessment with member firms. The Assessment
exercise is designed to provide firms with feedback and information to help them manage culture within their
organisations. It does not measure or rank ‘culture’ directly. Each firm will have its own individual culture;
some firms may contain several. There is no one good or model culture against which others can be measured
and ranked, and no single template or checklist for firms to adopt. Financial services is also no exception to
the ongoing change affecting all business sectors and their customers (domestic and global, technological and
competitive, social and demographic); a dynamic context that has been continuous through BSB events and
activities over the past year, and captured in particular by Howard Covington, Chairman of the Alan Turing
Institute, at a member event in February 2019.
That culture does not lend itself to measurement, however, does not mean that it cannot or should not
be assessed and appraised in order to manage it more effectively. In what follows we first describe our
Assessment approach and the way in which the results are presented in this Review and provide contextual
information on last year’s Survey (e.g. numbers of respondents). We then set out the 2018 Survey results
and, drawing on these latest results, explore in more detail some of the thematic work undertaken by the
BSB over the last year (on speaking up and listening, values and customer focus, and wellbeing). Finally,
this Review highlights areas of work for the coming year arising from the Assessment findings, policy
development and broader engagement.
Fig. 1 BSB Assessment Framework
The BSB Assessment: explaining our approach
The starting point of our Assessment approach is that good organisational cultures are defined not by
their type but by their outcomes. Good cultures are those that produce good outcomes for customers,
members, clients, employees, investors and the economy and society as a whole. Poor cultures are those
that produce poor outcomes. Culture is important, in other words, not for its own sake but because of
what results from it.
Measuring outcomes is itself, however, not straightforward. The outcome of a financial services transaction
may only be apparent some time — years, even — after the event, and retail customers in particular may
lack the information and experience to be able confidently to assess outcomes (as opposed to satisfaction
with the service provided, which is also important but not necessarily representative of the wider
outcomes picture).
13BA N K I N G BSB Annual Review 2018/2019
BO A R D
The BSB Assessment addresses this challenge by approaching it from a slightly different direction. It asks
how far a firm demonstrates characteristics that we might reasonably expect to be associated with good
outcomes for customers, clients and members; characteristics that we would expect to be associated with
any good culture in banking (and the absence of which would be likely to denote a poor culture). These
nine characteristics, illustrated in figure 1, encompass both ethical and professional attributes. A firm that
demonstrates these to a high degree would, we would argue, be better equipped and motivated to serve
its customers, clients and members well than one in which these characteristics were lacking. In applying
this framework, we take both a quantitative and a qualitative approach.
The quantitative element consists of an employee Survey that asks respondents to strongly agree,
somewhat agree, neither agree nor disagree, somewhat disagree or strongly disagree with 36 statements
about their firm; each question relates to one of the Assessment framework’s nine characteristics, and
the responses are transformed into a score of between 0 (the negative extreme) and 100. We also ask
employees for three words that they would use to describe their firm.
These 37 questions remain the same each year, allowing us to observe differences and change not only
between and within firms, but over time. Alongside these questions, we may also in any particular year
ask a small number of additional one-off questions; these are not used for benchmarking, but inform
our thematic work. In 2018, these additional questions related to speaking up, wellbeing and equality of
opportunity by gender.
To support our analysis and help us understand the feedback, we also ask respondents for information on a
small number of demographic attributes (e.g. tenure and business area). The anonymity of respondents is
of course protected throughout the process, from beginning to end.
Firms can choose to run the Survey on a sample basis (i.e. across a representative sample of their
workforce large enough to give statistically valid results) or on a census basis (i.e. across all employees).
The primary type of analysis we run on the Survey results is an ‘ordered logit regression’. This allows
us to explore how important one attribute (the ‘variable’) is relative to another (the ‘base attribute’),
in explaining how different questions are answered across the respondent population. We might, for
example, want to know whether people who are new to a firm — once all other known factors have been
allowed for — respond differently to those who have been with the firm for several years. The list of
attributes that we use in our analysis, and the base attribute against which each is compared, are shown in
figure 2.
The results of this analysis are presented in the form of ‘odds ratios’. If, for example, being female rather
than being male makes it likely — after controlling for all other factors — that a question will be answered
more positively, the odds ratio will be greater than one. If, allowing for all other characteristics, women are
likely to respond more negatively to a question than are men, the odds ratio will be less than one.
Throughout this Annual Review we illustrate odds ratios using circles of different sizes and colours. Green
circles indicate that possessing a particular attribute, e.g. being a line manager, positively influences
answers to that question in a statistically significant way (denoted by the ‘p-value’) relative to someone
with the base attribute (which in this example would be not being a line manager). Red circles conversely,
indicate that having a particular attribute negatively influences the response to that question, relative to
having the base attribute. The darker the shade of each circle, the greater the statistical significance. The
size of the circle indicates the strength of the influence of the attribute concerned on the answer.
For the purposes of this analysis, negatively phrased questions in the Survey are reversed, so that for every
question — whether positively or negatively phrased — a green circle represents a more positive response
for the variable attribute relative to the base.
Figure 2 displays the actual ordered logit regression results in 2018 for Q1.
14BA N K I N G BSB Annual Review 2018/2019
BO A R D
Fig. 2 Making sense of BSB Survey data (using Q1 as an example)
Base Variable Odds ratio p-value Q1
2017 2018 1.02 0.19
Male Female 1.12 0
Commercial Banking 0.95 0.04
Retail IB 0.8 0
Functions 0.89 0
Tenure < 1 year 2.3 0
Tenure 1 year to < 3 years 1.2 0
Tenure 3 years to 7 years
Tenure 7 years to < 15 years 1.08 0
Tenure 15 years or more 1.11 0
Non-customer facing Customer facing 1.01 0.68
Not a line manager Line manager 1.6 0
Senior Managers Regime 1.44 0
Not subject to SMR or CR
Certification Regime 1.13 0
Not member of a professional body Professional body 1.03 0.11
Channel Islands 1.18 0.06
East Midlands 0.98 0.53
East of England 0.96 0.46
North East 0.94 0.3
North West 1.09 0
Northern Ireland 1.3 0
London
Scotland 1.02 0.51
South East 0.95 0.1
South West 1.0 0.91
Wales 1.03 0.5
West Midlands 1.06 0.11
Yorkshire 0.89 0
Positive & significant at 1% Negative & significant at 1%
Positive & significant at 5% Negative & significant at 5%
Positive & significant at 10% Negative & significant at 10%
Note: Firm-specific effects are controlled for but not shown here
Note: Firm-specific effects are controlled for but not shown here
The qualitative part of the Assessment uses a variety of approaches to obtain views and perspectives from
all levels and parts of the firm. The approaches used may vary from year to year. In 2018 they included
written submissions by the boards of participating firms, interviews with non-executive directors and
executives, and focus groups with employees. The BSB website provides further detail on both the
quantitative and qualitative components of the BSB Assessment exercise.
Nine of the 26 firms that participated in the Survey in 2018 also chose to take part in the qualitative
Assessment exercise. The themes of this year’s exercise were those of our additional Survey questions
(speaking up, wellbeing and equality of opportunity by gender) and customer focus. We explored these
issues in 89 focus groups covering 837 employees, and in interviews with 71 executives and non-executive
directors.
15BA N K I N G BSB Annual Review 2018/2019
BO A R D
FINDINGS FROM THE 2018 SURVEY
Who responded to the Survey and participated in the Assessment in 2018?
The BSB Survey underpins the largest assessment of behaviour, competence and culture in banking not
only in the UK, but globally. It provides the BSB and its member firms with a unique and valuable dataset
on organisational culture. 72,024 employees from 26 banks and building societies across the UK (for
further information see Annex B) responded to the Survey in 2018; this followed 36,268 responses in 2017,
and 28,113 in 2016 (figure 3).
We undertook the Survey for the first time in 2018 outside the UK banking sector. This involved working
both with the non-UK banking operations of some member firms and with member firm non-banking
operations in the UK. We also ran the Survey in autumn 2018 for a number of banks in Ireland, providing a
first year of baseline data for these firms and for the newly established Irish Banking Culture Board. The
numbers in this Annual Review relate only to UK banks and building societies, and not to this wider work.
As the latter demonstrates, however, the underlying approach has applicability beyond the UK and beyond
the banking sector, and we have been happy to share ideas and experiences across a range of sectors and
jurisdictions: https://www.bankingstandardsboard.org.uk/governance-and-culture-reform-new-banking-
standards-board-Survey.
Fig. 3 BSB Survey responses 2016 – 2018
2016 2017 2018
294,596 299,218 292,165 Headcount
28,113 36,268 72,024
81,747 188,050
106,092
Survey sent to Responses
Number of Participating Firms
2016 22 2017 25 2018 26
Response Rates
2016 34% 2017 34% 2018 38%
The increase in response numbers in 2018 reflects in part an increasing preference among member
firms for a census (rather than sample) approach to running the Survey, to give all of their employees
the opportunity to take part in the exercise and have their views reflected. Figures 4 and 5 describe the
composition of respondents in 2018 by business area, tenure, gender, management responsibility, whether
they have a customer-facing role, and location.
16BA N K I N G BSB Annual Review 2018/2019
BO A R D
Fig. 4 BSB Survey 2018 responses, by business area
Retail 31,930 Functions 28,243 Commercial Banking 7,107
Commercial Banking
7,107
Investment Banking 4,744
Retail - Branch
11,247 IT & Operations Other Functions
13,360 8,856 IB - Other
IB - Markets 1,088
1,417
Private Business IB
Retail - Other Banking Banking Risk & Compliance (unspecified)
16,739 1,825 1,754 5,809 1,177
Retail (unspecified) Functions (unspecified) IB - Global Banking
365 218 (incl. M&A) 1,062
Fig. 5 Who responded to the BSB Survey in 2018?
Respondents by tenure at firm Respondents by location
8% 13% 18% 26% 15% 9% 11%
10%
Tenure ofBA N K I N G BSB Annual Review 2018/2019
BO A R D
Fig. 6 BSB Survey results — 2018 change from 2017
Note: The wording of Q15, Q22 and Q28 was amended in the 2017 Survey. While changes in results for these questions from 2016 to 2017 may reflect in part changes in the perceptions and observations of firms’
employees, they will also reflect the modified framing of these questions. Changes in results for these questions are therefore not included here.
The relatively stable 2018 picture followed a year in which scores either rose or held unchanged across all
of the comparable Survey questions. Improvements in 2017 were particularly evident on questions relating
to leadership, shared purpose, aspects of respect and perceptions of the competence and reliability of
colleagues. By business area, scores in 2017 improved most notably in Retail and in Commercial Banking,
and to a lesser extent in Functions. The changes in 2017 are illustrated in figure 7.
Fig. 7 BSB Survey results — 2017 change from 2016
Note: The wording of Q15, Q22 and Q28 was amended in the 2017 Survey. While changes in results for these questions from 2016 to 2017 may reflect in part changes in the perceptions and observations of firms’
employees, they will also reflect the modified framing of these questions. Changes in results for these questions are therefore not included here.
Survey scores in aggregate in 2018 therefore held onto, but did not extend, the improvements of 2017. The
picture over the two years taken together is one of improvement overall, but with momentum concentrated in
the earlier part of that period.
The results illustrated so far have all related to aggregate scores across firms or business areas. Even where
this cross-firm picture shows little change, as in 2018, more movement may be evident between and within
firms. The aggregate picture is not necessarily representative of each individual firm in terms of either the
level of or direction of change in scores.
18BA N K I N G BSB Annual Review 2018/2019
BO A R D
While the BSB does not report publicly on individual firms’ Survey scores, we show each year the range of
scores and whether and how this is changing. Figure 8 shows the range, distribution and median of firm
scores against our nine Assessment characteristics, in 2018 and the preceding two years. More detailed
analysis, including the range of results by business area and Survey question, can be found in the Assessment
section of the BSB website.
Fig. 8 BSB Survey scores by characteristic 2016 – 2018
95 2016 2017 2018 2016 2017 2018 2016 2017 2018 2016 2017 2018 2016 2017 2018 2016 2017 2018 2016 2017 2018 2016 2017 2018 2016 2017 2018
Top-ranking
firm
90
1st
Quartile
85
2nd
80 Quartile
75 3rd
Quartile
4th
70 Quartile
65 Bottom-
ranking
firm
60
55
50
Shared
45 Honesty Respect Openness Accountability 1 Competence 1 Reliability Resilience 1 Responsiveness Purpose
11 The
The wording
wordingofofthree
threequestions
questionschanged between
changed 20162016
between and 2017. This may
and 2017. Thishave
mayaffected the trendthe
have affected fortrend
accountability, competence
for accountability, and resilience.
competence and resilience.
Figure 9 shows the aggregate score across all participating firms for each of our core 36 Survey questions over
the past three years. We can see even more clearly here the general pattern of scores rising in 2017, and
these gains then being maintained but not extended in 2018. An exception is Q16, which asks whether
senior leaders are seen to take responsibility. The scores here improved markedly in both years.
While these results are unconditional and not controlled for any other factors, the same pattern is evident in
the results only of those firms that participated in the Survey in each of the three years, i.e. it is not a function
of changes in the set of participating firms during this period.
19BA N K I N G BSB Annual Review 2018/2019
BO A R D
Fig. 9 BSB Survey scores by question 2016 – 2018
1.
The minimum and maximum of the vertical axis differs for each chart, but the scale is consistent so that a one point improvement is always the same size.
2.
The wording of Q15, Q22 and Q28 was amended in the 2017 Survey. While changes in scores on these questions from 2016 may in part reflect changes in the perceptions and
observations of firms’ employees, they will also reflect the modified framing of these questions. Score changes for these questions between 2016 and 2017 are therefore not included here.
Figure 10 looks in more detail at Q16 (on senior leaders taking responsibility) which, as well as improving
in both 2017 and 2018, registered the largest sustained improvement of any question over the two years
taken together. In 2016, 58% of employees said that senior leaders took responsibility, especially if things
went wrong. This rose to 65% in 2017 and 66% in 2018; a change accompanied by improvement also
in our other leadership-related question (Q1, on believing that senior leaders meaning what they say).
This ongoing improvement in leadership-related scores comes in the context of a considerable focus on
leadership over recent years, and the introduction of the Senior Managers and Certification Regime.
20BA N K I N G BSB Annual Review 2018/2019
BO A R D
Fig. 10 BSB Survey Q16 ‘I believe senior leaders in my organisation take responsibility, especially if things
go wrong’ 2016 – 2018
Q16 I believe senior leaders in my organisation take responsibility,
especially if things go wrong
6% 5% 5%
20% 12% 11%
15% 26% 27%
2016 18% 2017 18% 2018
21%
38%
39% 39%
Strongly agree Somewhat agree Neutral Somewhat disagree Strongly disagree
Having looked at individual Survey questions, we now explore in more detail the extent to which
respondents’ demographic characteristics affect the way in which, on aggregate, questions are answered.
Figure 11 uses the same visual approach as figure 2, but presents results now for all 36 of our core Survey
questions. It shows that, for example, respondents who are new to a firm are likely to answer more
positively than those who have been there for any length of time, and managers to answer more positively
than those without line management responsibilities.
21BA N K I N G BSB Annual Review 2018/2019
BO A R D
Fig. 11 BSB Survey 2018 results, by characteristic
Overall ordinal logit results
Note: Firm-specific effects are controlled for but not shown here
Turning next to differences in responses by business area, we can see from figure 11 that, controlling for
other factors, respondents in Retail tended to be more positive in their responses in 2018 than employees
in other business areas (Retail is the ‘base’ attribute in figure 11; the other business areas that are then
compared to Retail show primarily red circles, indicating that their scores were lower than in Retail).
Respondents in Functions, by contrast, tended to be less positive than those elsewhere.
Relative to other business areas, Retail respondents were particularly positive in relative terms about
sharing learning and good practices with others (Q13, relating to openness) and innovating in the interest
of customers (Q33, relating to responsiveness).
Sustained improvements in Commercial Banking over the past two years mean that scores in this business
area are, on a number of questions, now close or comparable to those in Retail. Commercial Banking
respondents continue, however, to have relatively negative perceptions about aspects of responsiveness
and reliability, and in particular about internal processes and practices (Q31, relating to responsiveness).
Among the other demographic characteristics illustrated in figure 11, we can see that customer-
facing employees tended to be slightly more positive than those not in customer-facing roles. This is,
however, not the case for questions relating in particular to personal resilience (Q28, which asks about
excessive pressure, and Q29, which asks about the impact of working at the organisation on health and
wellbeing). Line managers, as already noted, tend to respond more positively than employees without
line management responsibility, and employees subject to the Senior Managers Regime tend to be more
positive than those outside the regime’s scope. Geographic area differences tend on the whole to be small.
Northern Ireland showed the most positive responses relative to other areas, and employees in most
geographic areas responded more positively than in London to questions relating to sharing learning (Q13),
being encouraged to learn (Q21) and going the extra mile for customers (Q24).
22BA N K I N G BSB Annual Review 2018/2019
BO A R D
Figure 12 shows the scores (uncontrolled for other factors) for each Survey question by business area over
the last three years.
Fig. 12 BSB Survey scores by business area 2016 – 2018
1.
The minimum and maximum of the vertical axis differs for each chart, but the scale is consistent so that a one point improvement is always the same size.
2.
The wording of Q15, Q22 and Q28 was amended in the 2017 Survey. While changes in scores on these questions from 2016 may in part reflect changes in the perceptions and
observations of firms’ employees, they will also reflect the modified framing of these questions. Score changes for these questions between 2016 and 2017 are therefore not included here.
Looking at what figure 13 tells us about the link between some of these demographic characteristics and
the way that Survey questions are answered, we can see that women responded more positively than men
on most Survey questions. This was also the case in 2017 and 2016.
When we look beneath the aggregate firm-level data, however, we find that while this pattern was evident
in Retail, Commercial Banking and Functions, it was not the case in Investment Banking. In Investment
Banking, women’s perceptions tended, where there was a difference, to be less positive than those of men.
This reflected differences in both women’s and men’s responses. Women in Investment Banking answered
our questions somewhat more negatively than women in other business areas, and men in Investment
Banking tended to respond slightly more positively than men elsewhere.
23BA N K I N G BSB Annual Review 2018/2019
BO A R D
Fig. 13 BSB Survey 2018 results — women’s responses relative to those of men
RegressionRegression
results (with
resultsjust
(withthe
justgender variable
the gender shown)
variable shown)
ur
y
s
rs
all
vio
ted ence
ck
me
s
rds thic
rs
d
ion
ed
ed
ful
ha
ba
lity
rde
me
lity
sto
l
ng
xp sequ
rul pect
na
g
say
ing
be
ed
e
ern decis
rrie back
iew
ers
ibi
gin
i
wa
sto
sib
ly,
ct
cu
ter
lle
r fe
an
ble pons
ey
pe
om
l st nest
pli ions
es
r re
rev
igh allen
n
cu
rn
ha
on
or
- in
d
foc s
me
me
o
of
t th
es
res
pir nce r
he e
ec
ue
ses ff fee
ea
ef
ls
t
nc
-c
ye
esp
e-
a
r
iou
h
us
al
s
t
o
g
su
res
tre
r
ura t skil
ne
d
Q8 k & C nt op
ol
alt
sto
iss
u
ch
ha
es
l
th
n
e
th
on
mi
rns
an
he
fen for c
ict
res
t
av
r
rni
n
o
a
de
tom it of
dt
arn
nd
alu
sta
nw
oid
wi
th
Inn ds cu
ke
s
ac
ce
sd
De ngs d
ba
ew
nfl
Rig o ext
Un once
tra
eh
isk
Im ive p
lea
sso n
m
ge
bli
wi
ere
tan
7. T ers ta
n
e/v
s le
ed
om
1.P onds
s
o
av
o
rta
ers
ing
ca
ea
co
lb
yr
ex
o
ue
ter
siv
inf
gr
ati
ng
ng
ing
t
on
diff
thi
s
ct
rm
s
le
Q9 low s
nt
n
c
i
Q3 ethia
a
o
Q2 entif
Q2 xcess
es
g
r
t th
Q2 et th
ing
Q3 oces
po
Q2 avin
ov
tre
or t
de
mf
ht
Q1 aise
op
pa
ali
ari
ea
co
ad
sp
sp
e
u rn
e
alu
de
ek
r
Op
Go
De
ex
Ge
Co
oll
Pu
Sh
En
Sh
Re
Re
Pe
us
Le
Le
m
Id
l
n
is
H
G
r
R
6. V
E
. Fo
. Se
. ea
. Fl
.U
.A
.C
.C
.R
1.
2.
3.
4.
5.
6.
7.
8.
9.
0.
2.
3.
4.
5.
0.
1.
2.
3.
4.
5.
6.
8.
9.
0.
Q2
Q2
Q2
Q2
Q2
Q3
Q3
Q3
Q3
Q3
Q1
Q2
Q4
Q5
Q6
Q7
Q1
Q1
Q1
Q1
Q1
Q1
Q1
Q1
Q1
Q2
Q3
Base Variable Overall
Male Female
Retail
Male Female
Commercial Banking
Male Female
Investment Banking
Male Female
Functions
Male Female
A factor that emerges very clearly from figure 11 as having an impact on Survey responses is that of tenure.
The perceptions of new employees are, on almost all questions, considerably more positive than those
who have been at their firm for a year or longer. While the BSB Survey is not itself an engagement Survey,
this observation is consistent with the findings of many engagement Surveys, and chimes with intuition.
We would expect, in most cases, someone who has only recently joined a firm to feel positive about that
decision, and a relatively new arrival may not yet have had sufficient experience of the firm and the way it
works to feel able to offer an informed view, whether positive or negative.
Respondents tend, in aggregate, to answer the Survey questions less positively as their time with the
firm (or in the sector) increases. Among those who have been with their firm or in banking for 15 years
or longer, however, scores begin to rise again; a relationship of scores and tenure that looks like a reverse
‘J’ (figure 14). The exception to this pattern is Q19, which asks how comfortable employees feel when
challenging their manager. Employees generally feel more comfortable challenging their manager the
longer they have been at their firm.
24You can also read