Central Asian Gas: prospects for the 2020s - Oxford Institute for Energy
←
→
Page content transcription
If your browser does not render page correctly, please read the page content below
December 2019

                     Central Asian Gas:
                      prospects for the 2020s

OIES PAPER: NG 155        Simon Pirani, Senior Research Fellow, OIES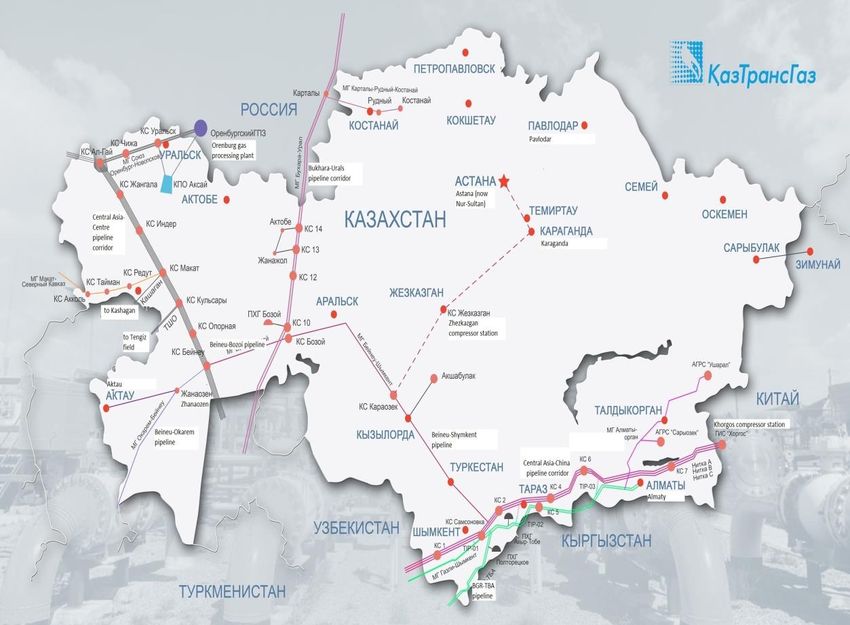
The contents of this paper are the author’s sole responsibility. They do not
         necessarily represent the views of the Oxford Institute for Energy Studies or any of
                                            its members.

                                          Copyright © 2019
                               Oxford Institute for Energy Studies
                                  (Registered Charity, No. 286084)

This publication may be reproduced in part for educational or non-profit purposes without special
permission from the copyright holder, provided acknowledgment of the source is made. No use of this
publication may be made for resale or for any other commercial purpose whatsoever without prior
permission in writing from the Oxford Institute for Energy Studies.

                                     ISBN: 978-1-78467-152-5

                           DOI: https://doi.org/10.26889/ 9781784671525

                                                                                                      i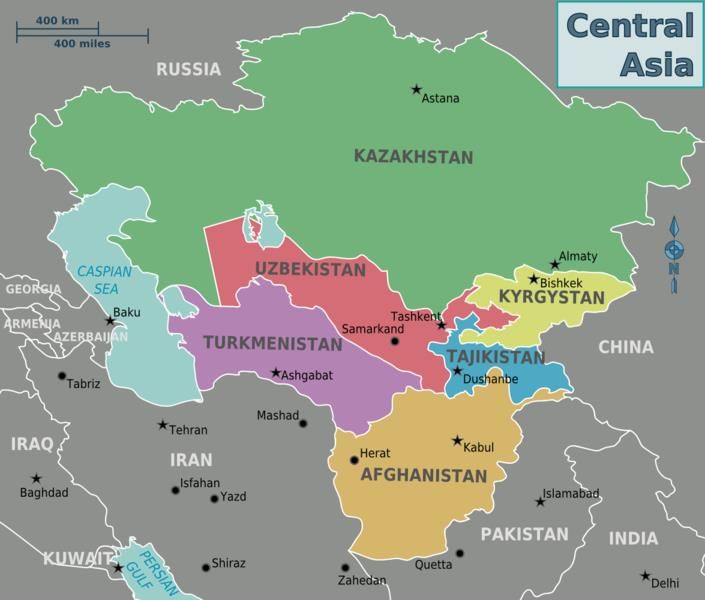
Preface
The gas sectors of countries in Central Asia have traditionally been of interest because of their
connection to Russia, but over the past decade this link has increasingly become less relevant as
exports to China have started to dominate. This has had significant commercial and political
consequences across the region, as well as influencing Sino-Russian energy relations, and as such
the question of the future of gas production in Central Asia remains a vital one. Simon Pirani therefore
presents this detailed working paper as an update and development of his earlier work on the subject,
as he reviews the gas production and export potential of the key Central Asian producers,
Turkmenistan, Kazakhstan and Uzbekistan. Each has its own unique characteristics but all have vital
questions to answer about their energy future, in particular: how reliant do they want to be on China
for a significant part of their export revenues; how close or distant do they want their ties to Russia to
be; how many, if any, alternative markets for their gas exports will it be possible to develop; and can
they develop greater domestic demand for their gas production into alternative export industries (such
as petrochemicals) that could provide further added value? Simon Pirani addresses all these issues in
this working paper, which we hope will be of interest not just to analysts of the Eurasian gas sector
but to all those who have an interest in the geo-strategic implications of Central Asian gas in the
global marketplace.
James Henderson
Director, Natural Gas Programme
Oxford Institute for Energy Studies

                                                                                                         ii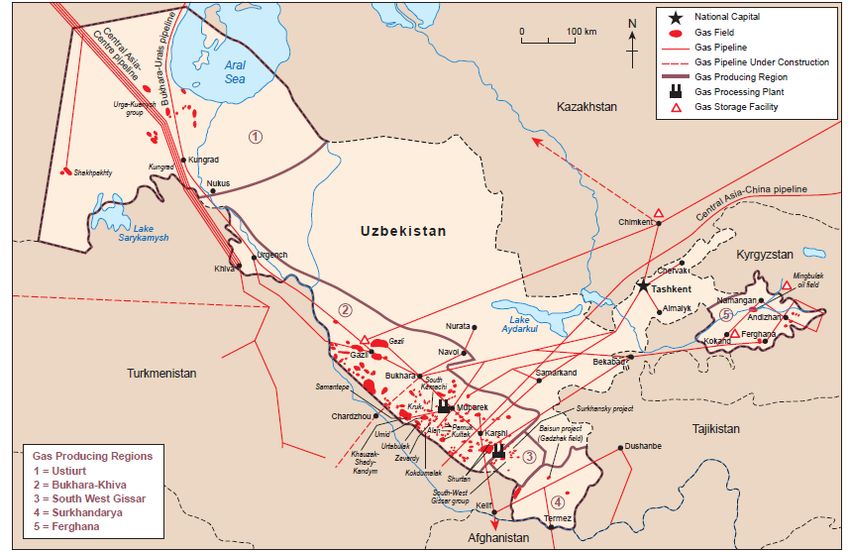
Executive summary
Over the last decade, China has replaced Russia as the main export destination for Central Asian
gas. Total exports in 2018 were 46.8 Bcm to China, 16.1 Bcm to Russia and 5.7 Bcm of intra-regional
trade. Due to strong gas demand in China, in the early 2020s, the Central Asia-China pipeline corridor
will be used close to its 55 Bcm/year capacity. An expansion to 85 Bcm/year is possible, by
construction of Line D from Turkmenistan via Uzbekistan, Tajikistan and Kyrgyzstan to China, but this
is unlikely to go ahead until it is seen as strategically necessary by China, that is probably not before
the late 2020s. The main source of additional volume to China will be Turkmenistan; Kazakhstan has
committed to 10 Bcm/year until 2023, after which its exports to China will fall; Uzbekistan will probably
contribute around 10 Bcm/year.
Central Asian exports to Russia may decline still further. The main destination for Kazakhstan’s
exports is Russia: 12.3 Bcm in 2018, compared to 3.8 Bcm from Uzbekistan. Turkmenistan resumed
exports to Russia at a low level of about 1 Bcm/year in 2019. However, in the 2020s Kazakhstan is
expected to be short of gas.
Turkmenistan has, in recent years, started production at the supergiant Galkynysh field. This will be
its main source of incremental production in the 2020s. There are some doubts about Turkmenistan’s
ability to manage development of this field, and one possibility is that Chinese activity in the upstream
will further increase. Projects operated by Chinese National Petroleum Corporation (CNPC) of China
and Petronas of Malaysia now account for more than one quarter of Turkmen output; CNPC has
undertaken field development and construction of processing capacity at Galkynysh. Turkmenistan
remains heavily dependent on hydrocarbon export revenues and its autarchic and dysfunctional
political system is under strain; this may produce changes in the 2020s, but predictions of a major
political crisis have not been borne out.
Uzbekistan produces similar volumes of gas to Turkmenistan (55-60 Bcm/year in recent years) but
most of this is consumed domestically. Unlike Turkmenistan, Uzbekistan has, since 2016, undergone
considerable political reform. Autarchic, state-driven economic policies have been abandoned with a
view to opening the economy to foreign investment. Gas sector reform is part of this. The major
foreign investor in Uzbek gas production is Lukoil, which in 2018 produced 13.4 Bcm of the national
total of 57.4 Bcm. Lukoil’s output has risen in recent years as Uzbekneftegaz’s has fallen. Uzbekistan
intends to increase its exports to China from 6.5 Bcm in 2018 to at least 10 Bcm. Competition
between export and the domestic market for gas volumes is evident and will sharpen during the
2020s.
Kazakhstan is predominantly an oil producer that works closely with international oil companies, and
is different from Turkmenistan and Uzbekistan in this respect. Gas is, therefore, of secondary
importance and most gas is produced in association with oil at the three major projects (Tengiz,
Karachaganak and Kashagan). Until the mid-2010s, the volume reinjected to support pressure in oil
reservoirs was in a similar range to that produced as sales gas. The proportion of sales gas has risen
in recent years but the government projects that sales gas volumes, and consequently volumes
available for export, will fall between now and at least the mid-2020s. At the same time, domestic
consumption is expected to grow. Having completed the Beineu-Shymkent pipeline linking the
western producing areas with the main consuming areas in the south-east, Kazakhstan is investing
further in gas transportation infrastructure and gasification. Thus its exports will probably fall, from 7-8
Bcm each to China and Russia in the early 2020s, to less than half that in the late 2020s.
Other export routes mooted for Central Asian gas – via a Turkmenistan-Afghanistan-Pakistan-India
(TAPI) pipeline to India, and via a Trans Caspian pipeline to Azerbaijan, Turkey and Europe – remain
economically infeasible. While TAPI might have gone ahead as a chiefly political project, the shift in
US foreign policy makes that extremely unlikely. While exports to Azerbaijan, either via a small Trans-
Caspian link or as swaps via Iran, are possible, large-scale Turkmen exports to Europe may be ruled
out.

                                                                                                          iii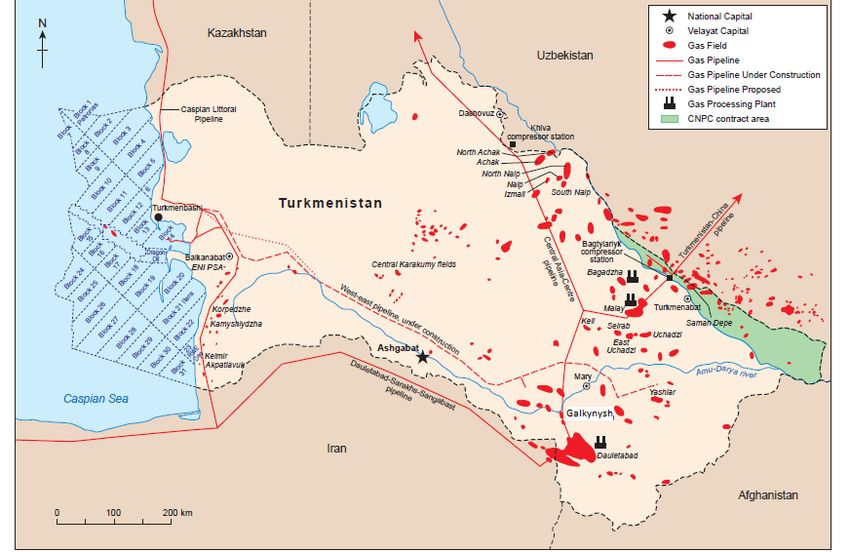
Kazakhstan’s domestic gas market will expand during the 2020s, as could Kyrgyzstan’s, where
Gazprom of Russia is now investing in gas distribution and supply. Uzbekistan’s market may well
contract, as price reforms and energy efficiency measures take effect. There is insufficient information
about Turkmenistan’s domestic gas sector to judge its progress. One significant change, in
Turkmenistan and Uzbekistan, is the completion of major petrochemicals projects using gas as
feedstock. Several more are planned, as a means of providing a diversified source of export
revenues. The future of these ventures is uncertain, though, because while petrochemicals markets in
Asia are expanding, they remain extremely volatile.

                                                                                                      iv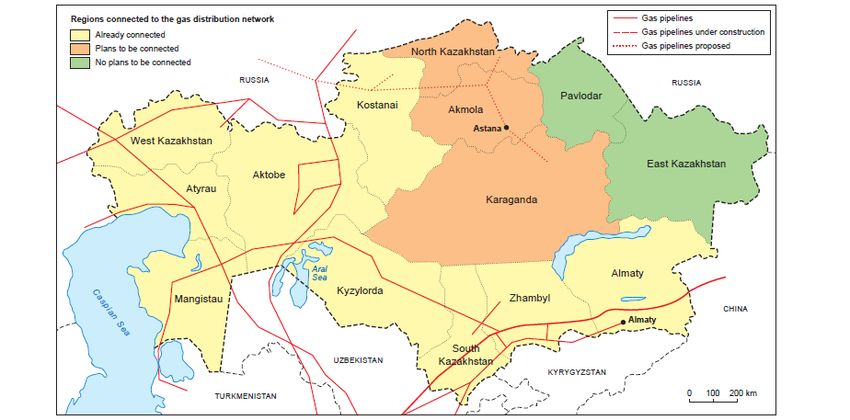
Acknowledgements
I would like to acknowledge the help and support of my colleagues on the OIES Natural Gas
Research Programme, including Mike Fulwood, James Henderson, Michal Meidan, Anupama Sen,
Jack Sharples and others. I am also deeply indebted to many people, including those in central Asia,
who have discussed the issues in the paper with me.

                                                                                                   v
Contents
Preface ................................................................................................................................................... ii
Executive summary ............................................................................................................................. iii
Acknowledgements .............................................................................................................................. v
Contents ................................................................................................................................................ vi
Figures .................................................................................................................................................. vi
Tables ................................................................................................................................................... vii
Maps ..................................................................................................................................................... vii
Introduction ........................................................................................................................................... 1
1. Turkmenistan ..................................................................................................................................... 2
Introduction.......................................................................................................................................... 2
Political and economic context ............................................................................................................ 3
Production ........................................................................................................................................... 5
Domestic market ................................................................................................................................. 8
Exports to China ................................................................................................................................ 10
Exports to Russia .............................................................................................................................. 12
Exports to Iran, Azerbaijan and Kazakhstan ..................................................................................... 13
Conclusions ....................................................................................................................................... 13
2. Uzbekistan ....................................................................................................................................... 14
Introduction........................................................................................................................................ 14
Political and economic context .......................................................................................................... 15
Production ......................................................................................................................................... 16
Lukoil ................................................................................................................................................. 18
Gazprom and other Russian partners ............................................................................................... 18
Chinese National Oil Development Corporation ............................................................................... 19
Western partners ............................................................................................................................... 19
The domestic market......................................................................................................................... 19
Exports .............................................................................................................................................. 21
Conclusions ....................................................................................................................................... 22
3. Kazakhstan ...................................................................................................................................... 22
Introduction........................................................................................................................................ 22
Political and economic context .......................................................................................................... 24
Production ......................................................................................................................................... 26
Domestic market ............................................................................................................................... 27
Exports .............................................................................................................................................. 30
4. Kyrgyzstan and Tajikistan .............................................................................................................. 30
5. Prospects for exports in the 2020s ............................................................................................... 32
China and the Central Asia-China pipeline ....................................................................................... 33
Russia ............................................................................................................................................... 34
South Asia and the Turkmenistan-Afghanistan-Pakistan-India pipeline ........................................... 35
Possible Turkmen exports westward ................................................................................................ 36
6. Conclusions ..................................................................................................................................... 37
Appendix. Sources for gas balances ............................................................................................... 40
Figures
Figure 1: Turkmenistan: export and import of goods, $m, 2003–2018 ................................................... 4
Figure 2: Central Asian gas exports to China, 2011–2018, Bcm .......................................................... 10
Figure 3: Winter deliveries of Central Asian gas to China, Bcm/month ................................................ 12
Figure 4: Uzbekistan - gas production by company, 2015–2020, Bcm ................................................ 17
viTables
Table 1: Turkmenistan gas balance, 2010–2018 .................................................................................... 2
Table 2: Turkmenistan gas production by company and destination, 2009–2019 ................................. 6
Table 3: Uzbekistan’s gas balance, 2010–2018 ................................................................................... 15
Table 4: Kazakhstan’s gas balance, 2010–2018 .................................................................................. 23
Table 5: Kazakhstan government projections of gas output, 2015–2040 ............................................. 25
Table 6: Kazakhstan gas production, 2018........................................................................................... 26
Table 7: Kyrgyzstan and Tajikistan gas balances, 2010–2018............................................................. 31
Table 8: Possible levels of gas exports from Central Asia in the 2020s ............................................... 33
Maps
Map 1: Central Asia (Political) ................................................................................................................. 1
Map 2: Turkmenistan gas infrastructure ................................................................................................. 3
Map 3: Uzbekistan Gas Infrastructure .................................................................................................. 15
Map 4: Kaztransgaz Transport network ................................................................................................ 24
Map 5: Kazakhstan regions and gas pipelines ..................................................................................... 28
viiIntroduction
This paper reviews the gas production and export potential during the 2020s of the Central Asian
producers: Turkmenistan, Uzbekistan and Kazakhstan. The Central Asian countries have, in the last
decade, become a key supplier to China’s rapidly expanding gas market, and that role will continue to
expand during the 2020s. The 55 Bcm/year pipeline corridor to China is now operating at close to
capacity. The question for the 2020s is whether – or more probably, when – a fourth string will be
added to the three existing lines, bringing the corridor’s capacity to 85 Bcm/year. Exports to Russia
have also recovered from a nadir reached in recent years but may not expand further. Export routes
to south Asia, or Turkey and Europe, remain elusive. The Central Asian producers, with support from
Japanese and other east Asian companies, have also begun to develop petrochemical capacity using
gas as feedstock, and both Turkmenistan and Uzbekistan have opened major complexes in the last
two years. These and other developments in domestic gas markets, including those of Kyrgyzstan
and Tajikistan, are also covered here. The paper covers the period since 2010, and prospects for the
2020s.1
Map 1: Central Asia (Political)
Source: Wikimedia / Creative commons licence
1
For additional details on gas production, readers are referred to an earlier, comprehensive publication: Pirani, S. (2012).
Central Asian and Caspian Gas Production and the Constraints on Export, NG69. Oxford: OIES
Other relevant publications from OIES are: Henderson, J., Pirani, S. and Yafimava, K. (2012). ‘CIS Gas Pricing: Towards
European Netback?’, in Stern, J. (ed.), The Pricing of Internationally Traded Gas, Oxford: OUP/OIES
Pirani, S. (2014). ‘Central Asian and Caspian gas for Russia’s balance’, in Henderson, J. and Pirani, S (eds.), The Russian Gas
Matrix: how markets are driving change, Oxford: OUP/OIES
Pirani, S. (2018). Let’s not exaggerate: Southern Gas Corridor Prospects to 2030, NG135. Oxford: OIES
Two other useful sources are: Raimondi, P. P. (2019). Central Asia Oil and Gas Industry: the external powers’ energy interests
in Kazakhstan, Turkmenistan and Uzbekistan, FEEM Working Paper 6. Milan: Fondazione Eni Enrico Mattei
On legal and political contexts, Boute, A. (2019). Energy Security along the New Silk Road: energy law and geopolitics in
Central Asia, Cambridge: Cambridge University Press
11. Turkmenistan
Introduction
Turkmenistan, the Central Asian producer with the largest gas reserves and the greatest export
potential, has now established itself as a major supplier to China. The 30-35 Bcm/year exported to
China has now replaced exports to Russia as the mainstay of Turkmenistan’s gas business, and of its
export revenues. Exports to Russia, which ceased completely in 2015, resumed in April this year, but
only at around one Bcm/year; exports to Iran have stopped, apparently permanently.
Along with the shift from Russia to China as the main export destination, Turkmenistan’s gas sector
has changed in two other significant ways. First, having shunned international oil companies, and
having been hesitant about working with foreign investors, Turkmenistan now relies on two foreign
companies – Chinese National Petroleum Corporation and Petronas – for more than one quarter of its
gas output. This proportion may increase further. Second, after years of plans and promises, last year
Turkmenistan commissioned a major petrochemicals plant, at Kiyanli, which could become a
significant source of revenue. The economics of a gas-to-liquids plant, opened in 2019 at Ovan-Depe,
are less obviously promising.
These trends will probably continue in the 2020s. Exports to China could increase, but probably only
in the second half of the 2020s. This will depend on the construction of a fourth string of the Central
Asia-China pipeline corridor, to raise its capacity to 85 Bcm/year from 55 Bcm/year. Turkmenistan
certainly has sufficient resources to supply whatever gas China decides to buy. But the extent of its
ability to develop these – in terms of governance, technology, skilled labour and capital – is less clear.
One possible scenario is a further expansion of Chinese participation in production.
The changes in Turkmenistan’s gas balance since 2010 are shown in Table 1.
Table 1: Turkmenistan gas balance, 2010–2018
Bcm 2010 2011 2012 2013 2014 2015 2016 2017 2018
Production (sales gas) 40.1 56.3 59.0 59.0 63.5 65.9 63.2 58.7 61.5
Total gas balance 40.1 56.3 59.0 59.0 63.5 65.9 63.2 58.7 61.5
Domestic consumption 18.9 20.7 17.6 18.7 20.0 27.0 25.5 22.9 24.5
Export (total) 21.2 35.6 41.4 40.3 43.5 38.9 37.7 35.8 37.0
To/through Russia 10.7 11.2 10.9 10.9 11.0 3.1 0 0 0
To Iran 7.0 10.0 9.0 5.0 6.0 7.0 7.0 0 0
To Azerbaijan (swaps via Iran) 0 0 0 0 0 0 0 1 1
To Kazakhstan 0 0.3 0 0.3 1 1 1.3 1.5 1.5
To China 3.5 14.1 21.5 24.1 25.5 27.8 29.4 33.3 34.5
Sources: BP Statistical Review, Gazprom, China customs data, Kazakhstan imports information. For details see
Appendix
The statistics presented are unreliable, but the best available. The total production figures in Table 1
are from the BP Statistical Review, which in turn relies on official statistics. It is likely that in 2015-17
the total production figures, and the domestic consumption figures, are overstated by up to 10
Bcm/year; there may be similar overstatements in other years. This is further discussed below, under
the sub-heading Production.
2Map 2: Turkmenistan gas infrastructure
Source: OIES
Note: The East West Pipeline, marked as ‘under construction’, is complete, but not being used
Political and economic context
Hydrocarbons, overwhelmingly gas with some oil products, account for the lion’s share (more than 90
per cent) of Turkmenistan’s export revenues. The sharp reduction in exports to Russia in 2009, from
around 40 Bcm/year to 10 Bcm/year, and in recent years the weakness of gas prices internationally,
therefore had a disproportionate impact on Turkmenistan’s economy.
The government does not publish any meaningful economic statistics. The International Monetary
Fund (IMF) publishes estimates based on information provided by the authorities, but these are a
poor reflection of the real state of the economy. For example, the IMF has estimated Turkmenistan’s
annual GDP growth at between seven per cent and ten per cent in 2009–13, and at between six per
cent and nine per cent in 2014-18.2 Observers have used externally observable data such as trade
statistics, supplemented by observations of the informal exchange rate, as more accurate indications
of the economy’s progress.
Figure 1 shows Turkmenistan’s trade balance since 2003. After a period of rising revenues, mainly
from gas exports to Russia, there was a downturn in 2009–10. But the start-up of the export trade to
China, and strong oil and gas prices, resulted in a renewed increase in export revenues, to record
levels in 2012–14. There was then a sharp fall, with export revenues in 2016 the lowest for a decade,
followed by a renewed upturn.
2
IMF press releases, IMF ‘Turkmenistan and the IMF’
3Figure 1: Turkmenistan: export and import of goods, $m, 2003–2018
25000
20000
15000
10000
5000
0
2003 2005 2007 2009 2011 2013 2015 2017
Export of goods of which: hydrocarbons Import of goods
Source: IMF
After registering a negative trade balance in 2015 and 2016, Turkmenistan returned to the black in
2018. The IMF attributed the fall in imports to ‘declining public investment and a more active use of
foreign exchange regulations, which have weighed on private investment and consumption’.3 Its staff
report continued:
The resulting significant decline in imports, together with higher-than-expected hydrocarbon
prices, have turned the external balance into a surplus. The improvement [...] is likely to be
temporary, given that the official exchange rate remains above the equilibrium value,
investment is expected to rise and the outlook for hydrocarbon prices is subdued. Risks are
tilted to the downside [...].
The IMF’s comments on the exchange rate are corroborated by media reports on the chronic
shortage of cash in the Turkmen economy, and the sharp rise in 2018 in the unofficial (i.e. black
market) exchange rate. While the manat is officially pegged at 3.5 to the US dollar, the unofficial rate
rose from 10 to the dollar in January 2018 to 29 to the dollar in June 2018. The rate then fell again, to
around 18-19 manats to the dollar in June 2019, and to 17-17.5 in July 2019.4
There has been a shortage of manats, leading to queues and crowds at cash machines, and also
severe shortages of goods to spend money on, including of essential foodstuffs (including flour,
cooking oil and sugar), in some localities. This has given rise to queuing, sporadic rationing and police
action restraining domestic trade. For several years, foreign companies, working with state-owned
companies in Turkmenistan, including some from Germany, Turkey, Russia and Belarus, have
3
IMF press release no. 19/112, ‘IMF Staff Completes 2019 Article IV Mission to Turkmenistan’, 10 April 2019
4
Reuters, ‘Foreign companies struggle in cash-strapped Turkmenistan’, 4 June 2018; Bne Intellinews, ‘Bread sellers demand
passports as Turkmenistan’s economic crisis goes from bad to worse’, 18 June 2018; Chronicles of Turkmenistan, ‘The dollar
value in Turkmenistan drops down by 1-2 manats’, 3 July 2019
4reported difficulties in getting paid. Earlier this year Unionmatex (Germany), Belgorkhimprom
(Belarus) and MTS (Russia) made public details of legal actions to recover sizeable debts. 5
Another external indicator of Turkmenistan’s economy, and indeed society, is migration. Media
reports have highlighted the government’s efforts to discourage young, skilled workers from leaving
the country. But UN statistics show that the level of emigration is not untypical for a developing
country, and that Turkmenistan has the lowest ratio of emigrants to total population of the Central
Asian countries.6
The conclusion is that, while Turkmenistan’s economy has been severely affected by the fall in gas
export revenues, this may not lead to fundamental political change. A recent report published by the
Foreign Policy Centre argued that Turkmenistan is ‘teetering on the edge of catastrophe’, 7 and
pictured:
…a regime under enormous pressure as years of economic turmoil place unprecedented
strain on a rigid but potentially brittle political structure. Hunger and hyperinflation are being
managed by further increasing the scale of human rights abuse and the level of intrusion into
people’s lives.
This reflects a danger of exaggeration. The report convincingly establishes that there are local,
potentially chronic, shortages of essential food items including flour and cooking oil – but does not
provide any evidence of famine, which the word ‘hunger’ might imply. While there is inflation,
discussed above, there is as yet no hyperinflation. Turkmenistan is suffering a grave economic crisis
that could indeed be sorely aggravated by the inflexibility of its political system, and in turn produce a
political crisis. But this is not the only prospect. A recovery in gas prices, and even a gradual increase
in exports to China and Russia, could stabilise the trade balance, or at least prevent its further
deterioration. This might further postpone political change that, while almost inevitable at some stage,
may not come in the short or medium term.
Production
There have been three significant changes in the profile of Turkmenistan’s gas production in recent
years. First, the supergiant Galkynysh field has come on stream, and, according to a recent report by
the authorities, now has 30 Bcm/year of production and processing capacity. Second, production has
risen rapidly at two fields operated by foreign companies – CNPC’s onshore production sharing
agreement (PSA) at Bagtyarlyk, output from which is exported to China, and Petronas’s block no. 1
Caspian offshore project, output from which is sold to Turkmengaz for processing onshore. These two
projects comprised less than one-tenth of Turkmenistan’s total production in 2011, but since 2017
have comprised more than one quarter. Third, although hardly any information is available about
Turkmengaz’s production capabilities, it appears that the constraints on output levels remain on the
demand side, and that Turkmengaz and its partners – while struggling to meet peak demand in the
winter of 2017–18 on the Chinese route – have, overall, reduced output in response to lower export
and domestic demand.
5
Reuters, ‘Foreign companies queue up to sue cash-strapped Turkmenistan’, 17 April 2019; Pannier, B. (July 2019), ‘Food lines
in a land of marble’, Foreign Policy Centre, Spotlight on Turkmenistan, London: FPC.
6
Khronika Turkmenistana, ‘Iz-za migratsii v Turkmenistan ne khvataet uchitelei i vrachei’, 2 April 2019; RFE/RL, ‘Turkmenistan
clips wings of citizens fleeing economic woes’, 16 April 2018; International Organization on Migration database. Turkmenistan’s
ratio of emigrants to total population is lower than the other Central Asian countries, even if the total population figure is
adjusted downwards from the official statistic (5.98 million) to a lower estimate reflecting international observers’ assumptions
(4.5 million)
7
Adam Hug, “Conclusions and Recommendations”, Foreign Policy Centre, Spotlight on Turkmenistan (London: FPC, July
2019), p. 39
5Table 2 presents the available information on production, broken down by company and destination.
In particular, it divides the output of Turkmengaz, the state-owned company, between gas exported to
China, and gas used for other export routes (Russia, Iran and Kazakhstan) and the domestic market.
During the 2010s, the Galkynysh field has become the main source of exports to China. In 2010 when
these exports began, Galkynysh was not yet producing gas, and the Chinese route was presumably
supplied from Dauletabad, Turkmenistan’s second largest field, and other fields in the south-east of
the country. By 2014, Galkynysh had 10 Bcm/year of capacity available, and by 2019, 30 Bcm.
Readers’ attention is drawn to the row ‘Turkmengaz, for other export routes and the domestic market’.
These estimates have been arrived at by subtracting the volumes exported to China from
Turkmenistan’s total output as reported by BP (as Turkmengaz does not report production volumes).
In 2015-17, in particular, these estimates are likely to be too high. In those years, exports fell sharply,
with Russia ceasing purchases in 2015 and Iran in late 2016. BP, presumably in the absence of more
accurate information, reported total production in the same range as previously (56-66 Bcm) –
suggesting that domestic consumption leaped up in 2015, to 27 Bcm from 20 Bcm the year before. In
reality, Turkmenistan probably produced less gas in response to the sharp reduction in aggregate
demand.
Table 2: Turkmenistan gas production by company and destination, 2009–2019
Bcm 2009 2010 2011 2012 2013 2014 2015 2016 2017 2018 2019
est
Total production (sales gas) 33.3 40.1 56.3 59.0 59.0 63.5 65.9 63.2 58.7 61.5 62
Turkmengaz and other state-owned companies
Turkmengaz: to China, including from Galkynysh* 0 1.0 11.0 18.1 19.6 19.2 15.5 17.8 20.5 25.7 25.8
Turkmengaz: for other export routes and the 33.2 35.5 40.2 34.1 32.7 33.4 36.2 30.4 23.0 19.5 18.9
domestic market**
Exports to Russia 11.8 10.7 11.2 10.9 10.9 11.0 3.1 0 0 0 0
Exports to Iran 7.0 7.0 10.0 9.0 5.0 6.0 7.0 7.0 0 0 0
Exports to Kazakhstan 0 0 0.3 0 0.3 1 1 1.3 1.5 1.5 1.5
For domestic market 14.4 17.8 18.7 14.2 16.5 15.4 25.1 22.1 21.5 18.0 17.4
Private companies
CNPC: under PSA at Bagtyarlyk* 0.1 3.6 4.6 5.5 5.5 9.1 12.5 12.8 13.0 13.0 13.2
Petronas: offshore Caspian block no. 1 0.58 1.28 1.23 1.75 1.69 2.22 2.16 3.33 4.15
Private companies, as % of total 0.03 8.9 9.2 11.4 11.4 17.1 21.5 23.8 25.8 26.5 28
* Total Turkmen exports to China are those from Turkmengaz, plus those from CNPC at Bagtyarlyk. In this table, I have used total volumes
exported, and CNPC volumes exported, as reported by CNPC. The sum is slightly larger than the volumes reported by the Chinese customs
authorities, used in table A; in most years this difference was 1-2 bcm, but in 2018 it was substantial (more than 4 bcm larger)
** This row includes all gas not exported to China. It also includes small volumes from Turkmenneft, the state-owned oil producer
Sources: total production: BP statistical review, author’s estimate (2019), CNPC, Petronas and Turkmengaz
export to China, presentations at Turkmenistan gas congress, Avaza, May 2019. Other exports: Table 1
Significant developments on production reported publicly are as follows:
Galkynysh. The first phase of Galkynysh field development, for output of 10 Bcm/year, was completed
in 2013 by Chuanqing Drilling Engineering Company, a CNPC subsidiary. CNPC proprietary
technology was installed for gas purification and processing. All this capacity – for production, gas
gathering and processing – started operation in 2014.8 For the second phase, Turkmengaz agreed
with a consortium including Gulf Oil & Gas, Petrofac International and LG International to undertake
field development, and install gas gathering infrastructure and gas processing capacity, for a further
20 Bcm/year. In September 2013, when Turkmenistan agreed with China to increase total gas exports
to 65 Bcm/year by 2020 (see Prospects for export in the 2020s, below), CNPC announced that it had
signed a turnkey engineering, procurement and construction contract for the second phase, with
Reported on the CNPC website ‘CNPC in Turkmenistan’ page, viewed in May 2019 but not available in October 2019
8
6capacity of 30 Bcm/year, to be completed by 2018. It is unclear how the Middle Eastern and Chinese
consortia worked together.9
In August 2019, the Turkmen government web site gave a rare progress update, indicating that the
second phase was complete. It said that Galkynysh now had more than 40 production wells, with an
average flow rate of two million cubic metres a day (i.e. at least 29.2 Bcm/year in total), and 30 Bcm
of gas processing capacity. A previous report, in 2017, had said there were 29 wells in place, of which
13 would be operational at the end of that year, and that Turkmengaz had earmarked 20 Bcm/year
from Galkynysh to export to China. 10
Galkynysh is now producing more than 20 Bcm/year, considerably below the numbers mentioned by
Turkmen officials during the development phase. Moreover, it seems that in the winter of 2017-18 in
particular, Turkmenistan was unable to meet nominations from China at peak times (see below): this
may have been related to difficulties in bringing on capacity at the field. Further field development,
mentioned in the government’s report, could raise total output to 95 Bcm/year. However, no timescale
for this development has been made public, and the authorities have stated that its main purpose is to
supply the Turkmenistan-Afghanistan-Pakistan-India (TAPI) pipeline, completion of which is in no way
assured (see Prospects for export in the 2020s, below11).
Another future possibility is that gas from Galkynysh and other fields in south-east Turkmenistan will
find markets to the west – for example, export to Russia, Kazakhstan or Azerbaijan, and/or domestic
uses. The East-West pipeline, which links these fields to gas transmission infrastructure in western
Turkmenistan and can carry 30 Bcm/year, was completed in 2015, but then capped. 12
Bagtyarlyk. This field, near Turkmenistan’s border with Uzbekistan, is operated by CNPC under a
production sharing agreement (PSA). It started production in 2009 and has now reached its plateau
output of 13 Bcm, all of which is exported to China. 13
Turkmengaz’s other fields. No information has been made available in recent years. The largest
fields, Dauletabad, Malay and the Uchadzi group, are in south-east Turkmenistan near to Galkynysh.
In western Turkmenistan, Turkmengaz produces gas at Korpedzhe, and there are some associated
gas volumes from Turkmenneft’s oil fields.
Offshore. Petronas, which produces oil from Block 1 in the Turkmen sector of the Caspian Sea,
started bringing associated gas offshore for processing and sale to Turkmengaz in 2011. By 2018,
output had reached 3.3 Bcm, bringing the cumulative total since 2011 to 16.6 Bcm. Petronas projects
4.1 Bcm of gas will be produced in 2019.
The Block 1 project is notable for two reasons. Firstly, it is the first project to produce any substantial
gas volumes in the Turkmen sector of the Caspian, after several false starts in the 1990s and
2000s. 14 Secondly, Petronas is the first non-Turkmen producer to agree terms for selling gas to
Turkmengaz. It is reported that gas from Block 1 is the main feedstock for the new Kiyanli
petrochemicals plant (see below).
9
Pirani, S. (2012). Central Asian and Caspian Gas Production and the Constraints on Export, NG69, 29-30. Oxford: OIES;
CNPC press release, ‘CNPC and Turkmengaz ink an agreement’, 6 September 2013
10
Turkmenistan Zolotoi Vek website, ‘TEK Turkmenistana: innovatsionnost’ i eksportnyi potentsial’, 2 August 2019; Argus FSU
Energy, ‘Slow progress at Galkynysh’, 8 August 2019
11
Natural Gas World, ‘Turkmenistan to work with Japan to further develop Galkynysh’, 18 October 2015; Reuters,
‘Turkmenistan has started work on a natural gas pipeline to Afghanistan, Pakistan and India’, 15 December 2015;
Turkmenistan Zolotoi Vek, ‘TEK Turkmenistana’, 2 August 2019.
12
Khaitun, A. ‘Energeticheskie perspektivy Turkmenistana v Evraziiskom regione’, Nezavisimaia Gazeta, 12 December 2017;
Cutler, R. ‘How Central Asian energy complements the Southern Gas Corridor’, Euractiv, 24 January 2018
13
CNPC website, ‘Amu Daryan natural gas project’ page ,
viewed 26 November 2019
14
‘Turkmenistan: an exporter in transition’ in Pirani. S. (ed.), Russian and CIS Gas Markets and their impact on Europe, Oxford:
OUP/OIES, 282, 283 and 294
7Dragon Oil, the upstream division of Emirates National Oil Company (ENOC) of Dubai, is working on
the Cheleken block in the Caspian under a PSA that expires in 2025. The company states that its
priorities are to extend the agreement to 2040; to develop a monetization agreement for gas; and to
work with the government on further PSAs for the North Koturdepe area. 15 Other companies including
Buried Hill, RWE, Wintershall, Eni and Mitro International have, at various times, signed agreements
to work in the Turkmen sector in the Caspian, but none of these have reported that exploration and
development work are completed.
A final point to bear in mind about production is the cost of processing. Gas produced in
Turkmenistan, as in Uzbekistan and Kazakhstan, has high sulphur content. Turkmenistan’s offshore
fields generally contain rich gas, that is, with liquids content; sales of these can help to offset
processing costs. But the onshore fields contain dry gas.
Domestic market
There is no publicly available information about total volumes of gas consumed on the domestic
market. Outside observers, including this author, can only produce estimates by subtracting the
volume of exports from total output – although the output figures are themselves estimates. As
indicated above in the comments on Table 2, the credibility of the output estimates could be all the
more strongly questioned since they did not change substantially between 2014 and 2017 in response
to Turkmenistan’s loss of the Russian and Iranian export markets. What can be stated with
confidence is: first, domestic consumption was estimated at 14-18 Bcm/year in the early 2000s; that
45-50 per cent of these volumes were for electricity and heat production and the energy industry’s
own use, 25-30 per cent for industry and 10-15 per cent for residential consumers. Second, at the
beginning of 2019, household customers began to be charged a nominal fee for gas, which had
previously been free, but it seems doubtful that this changed consumption habits. 16 Third, it seems
unlikely that consumption rose substantially in 2014–15, as Tables 1 and 2 imply; this is probably a
statistical anomaly. Fourth, it seems likely that domestic consumption is now substantially higher than
in the early 2000s, due in part to the opening of petrochemicals capacity.
A small corner of the domestic market, in the Balkan province in western Turkmenistan, has become
more transparent due to Petronas’s activity there. Petronas has reported that it has a contract
covering 2.45 Bcm/year of sales to Turkmengaz, and in 2018–19 was selling higher volumes.
Petronas stated in 2019 that it sees ‘high potential’ in the market where the largest consumers of gas
it produces are: the Kiyanli petrochemicals complex (see below); Turkmenbashi oil refinery; the
Garabogaz carbamide plant; the Balkanabat, Avaza and Turkmenbashi power stations; and outlets to
Balkanabat, Gumdag and surrounding villages.17
The most significant increment to gas demand in recent years has been the start-up of
petrochemicals plants that use gas as feedstock, with a view to adding value to Turkmenistan’s gas
resources.
In 2018, the country’s petrochemicals capacity increased from 160,000 tonnes per annum (tpa) to
600,000 tpa, with the commissioning of the Kiyanli complex in Balkan province. This plant is designed
to take 5 Bcm of rich gas, and return 3.7 Bcm of sales gas to the grid. Wood Mackenzie assessed the
plant’s start-up as ‘a step change in Turkmenistan’s ability to produce olefins and polyolefins
domestically’.18 The Kiyanli complex includes a gas separation unit, an olefin conversion unit (ethane
cracker unit), a high density polyethylene unit producing 386,000 tpa and a polypropylene unit
15
ENOC Annual Review 2017, 45; Turkmenistan Zolotoi Vek, ‘TEK Turkmenistana’
16
Pirani, S. (2012). Central Asian and Caspian Gas Production and the Constraints on Export, NG69,63-64, Oxford: OIES;
Radio Free Europe, ‘Turkmenistan Cuts Last Vestiges Of Program For Free Utilities’, 26 September 2018; Radio Free Europe,
‘The Gas Man Cometh: In Turkmenistan, Free Energy No More’, 11 November 2018
17
Petronas presentation, ‘The role of Petronas in developing gas industry of Turkmenistan’, at Turkmenistan Gas Congress,
Avaza, 21-22 May 2019
18
Wood Mackenzie, ‘New Turkmengaz gas and chemical complex good news for domestic petrochemicals industry’, press
release 18 Oct 2018
8producing 81,000 tpa. Construction was financed by syndicates of Korean banks (with a $492 million
loan and a $215 million Korea Eximbank guarantee), and Japanese banks (with a $730 million loan
and $438 million Japanese Bank for International Cooperation (JBIC) guarantee19).
In 2018 Turkmenhimiya, the state-owned petrochemicals company, commissioned a fertiliser plant at
Garabogaz, on the Caspian coast. It will produce 1.1 million tpa of urea, using natural gas as
feedstock, with the intention of exporting most of its output; sales contracts with Indian and Iranian
purchasers have been reported. The plant was built by Mitsubishi Corporation (Japan) and Gap
Insaat (Turkey), with finance provided by JBIC. 20 A potash plant at Garlyk, constructed by Belarussian
companies and opened in 2017, has reportedly so far produced only a small fraction of its 1.4 millon
tpa nameplate output, and a dispute with the Belarussian partners has now gone to arbitration.21
In June 2019, a gas-to-liquids plant, claimed by the construction consortium to be the first in the world
to produce gasoline from natural gas, was opened at Ovan-Depe in Akhalsky province. Haldor
Topsoe (Denmark)’s technology, used previously at Oryx (Qatar) and Sasol (South Africa) to produce
diesel, has been adapted to produce gasoline. The plant will take 1.78 Bcm/year of gas feedstock and
produce from it 600,000 tonnes of gasoline (Eco-93), 12,000 tonnes of diesel fuel and 115,000 tonnes
of liquefied petroleum gas. The plant was built by a consortium of Kawasaki Heavy Industries and
Ronesans Endustri (Turkey); finance to cover 85 per cent of the $1.7 billion construction costs was
arranged by JBIC.22 Turkmenistan’s existing producers of gasoline are the Turkmenbashi and Seidi oil
refineries, which cover domestic needs, plus a small amount for export. It has been reported that the
component of A-98 high-octane gasoline produced at Ovan-Depe will enable production of A-95, A-92
and A-80 gasoline conforming to Euro-5 standards. Doubt has been cast on the economics of the
gas-to-gasoline process, but much more information would be needed to assess this.23
Together these projects have the potential to reduce Turkmenistan’s dependence on natural gas
sales by exporting value-added products. A sense of proportion is needed, though: the two flagship
projects, Kiyanli and Ovan-Depe, process 5 Bcm/year and 1.8 Bcm/year respectively of gas – small
amounts compared to Turkmenistan’s gas export trade. Whether, and to what degree, they are
successful will depend on market conditions, and Turkmenistan’s ability to compete in them.
The market conditions are uncertain, and will remain so. Petrochemicals markets are not only
expanding very rapidly, but are also extremely volatile; factors such as the instability in US-China
relations, changing cost profiles and the growth of recycling may enhance volatility; and some
observers expect that the large-scale expansion of production facilities, in China in particular, will
outpace demand in Asia.24
19
Newsbase, ‘Turkmenistan starts up new petrochemical hub’, 26 September 2018; Chemicals-technology.com website,
‘Turkmengas Kiyanla petrochemical plant, Turkmenbashi’,
20
Reuters, ‘Turkmenistan launches fertiliser plant’, 17 September 2018 ; UK Foreign and Commonwealth Office,
Turkmenistan Energy Newsletter, October 2018
21
Reuters, ‘Turkmenistan opens potash plant, targets Chinese and Indian markets’, 31 March 2017,
; Turkmen News, ‘Turkmenistan impounds Belarusian equipment in potash plant dispute’, 27 Feburary 2019,
22
Argus Caspian Markets, ‘Turkmenistan launches Ovandandepe plant’, 21 June 2019; ‘Prezident Turkmenistana:
neobkhodimo prodolzhit’ rabotu’, Turkmenpor, 21 June 2019 ; Neftegaz.ru, ‘Turkmenistan zapustil 1-y v mire GTL-zavod po
proizvodstvu benzina’, 28 June 2019,
23
Natural Gas World, ‘Turkmenistan starts up GTL plant’, 28 June 2019; Eurasianet, ‘Turkmenistan: liquid lunch’, 2 July 2019;
Natural Gas World, ‘Kazakhstan ramps up gas-fired power, petchems’, 16 August 2019
24
S&P Global Platts, Global petrochemical outlook: H2 2019; S&P Global Platts, Asia petrochemical outlook H1 2019:
Petrochemicals special report; IEA, The Future of Petrochemicals, Paris: IEA, 2018; Hydrocarbon Processing, Business
Trends: Petrochemicals 2025, March 2019,
9Exports to China
China became the leading destination for Turkmen gas exports in 2011; exports to China reached
34.5 Bcm in 2018, and they are expected to continue to rise. Russia ceased imports from
Turkmenistan in 2015, and restarted them at much lower levels in 2019; Iran ceased imports,
probably for the foreseeable future, in 2017. The steady growth of gas exports to China from
Turkmenistan, Uzbekistan and Kazakhstan is shown in Figure 2.
Figure 2: Central Asian gas exports to China, 2011–2018, Bcm
50
45
40
35
30
25
20
15
10
5
0
2011 2012 2013 2014 2015 2016 2017 2018
Turkmenistan Kazakhstan Uzbekistan
Source: Chinese customs data
The Central Asia-China gas pipeline corridor, via which these volumes are transported, is the largest
new pipeline route to have been opened up anywhere in the world in recent years. Lines A and B of
the corridor, with a capacity of 30 Bcm (13 Bcm from CNPC/Bagtyarlyk and 17 Bcm from
Turkmengaz), were commissioned in 2009–10, and Line C, with a capacity of 25 Bcm, in 2014.
Turkmen exports to China began in 2010, under an agreement providing for total exports (from CNPC
and Turkmengaz) of 30 Bcm for 30 years from 2010 (via lines A and B), with the option of raising the
total volume to 40 Bcm.
It was originally reported that supplies for Line C would be provided by Uzbekistan (10 Bcm/year),
Kazakhstan (5 Bcm/year) and Turkmenistan (10 Bcm/year, bringing total Turkmen exports to China,
via the three lines, to 40 Bcm). More recently, it has been reported that Kazakhstan intends to
increase exports to China to 10 Bcm/year, implying that Chinese imports from Turkmenistan would be
limited to 35 Bcm/year.25 By 2018, Lines A-C were being utilised at close to capacity, at peak times.
Total annual volumes imported by China in 2018 were 34.4 Bcm from Turkmenistan, 6.5 Bcm from
Uzbekistan and 5.8 Bcm from Kazakhstan.26
In September 2013, the presidents of China and Turkmenistan signed an agreement providing for the
total export volume to rise to 65 Bcm/year by 2020; in return for this China would finance the second
25
Pirani, S. (2012). Central Asian and Caspian Gas Production and the Constraints on Export, NG69,83-84, Oxford: OIES;
Natural Gas Europe, ‘Turkmenistan supplied 125 Bcm of gas to China’, 28 September 2015; Vedomosti, ‘Turkmeniia lishilas’
krupnogo pokupatelia gaza v litse Irana’, 13 August 2017
26
Chinese customs data; UK FCO Turkmenistan Energy Newsletter, June 2018; Lelyveld, M., Radio Free Asia, ‘China Nears
Limit on Central Asian Gas’, 25 June 2018
10stage of development at Galkynysh. At the same time, it was agreed that Line D of the pipeline
corridor would be built, adding a further 30 Bcm/year of capacity, bringing the total capacity to 85
Bcm/year. Line D is planned to cross Uzbekistan, Tajikistan and Kyrgyzstan, rather than following the
route of the other three lines across Uzbekistan and Kazakhstan. Construction was originally planned
to start in 2015, but was postponed. In 2017 the project was frozen by decision of CNPC, its main
sponsor, and talks about restarting it have not yet reached a firm conclusion. 27 See below, Prospects
for exports in the 2020s.
While it seems likely that China will want to complete Line D eventually, the timing will depend on the
evolution of the Chinese gas market – but also on the evolution of China’s partnership with
Turkmenistan. In contrast to Gazprom, which in the 1990s and early 2000s took possession of
Turkmen gas at the border (and for some years used third party traders to do so, avoiding even a
commercial relationship with Turkmengaz), CNPC has insisted on active involvement in the Turkmen
upstream. In addition to its own PSA at Bagtyarlyk, it has played a significant, and growing, role in
developing Galkynysh. Furthermore, the Turkmen investment in the Central Asia-China corridor was
largely financed by Chinese institutions, with the loans being repaid from gas export proceeds. 28
In other words: China has left little to chance in ensuring the security of its gas supplies from
Turkmenistan. This caution appeared to have been justified in the winter of 2017–18, when upstream
technical problems meant that Turkmengaz was unable to meet nominations. In January 2018, a cold
spell in China coincided with a directive from the National Development and Reform Commission
banning coal-fired heating in 28 northern cities, with a view to avoiding the smog crisis of 2016-17.
This put strain on gas transportation and supply capacities. This was exacerbated in late January,
when volumes being delivered via the Central Asian Gas Pipeline dropped by half due to what CNPC
described in a statement as ‘frequent equipment failures’ in Turkmenistan.29 Figure 3 shows Turkmen
deliveries to China in the winter months, with the decrease in January 2018 marked by the arrow.
27
Platts, ‘Ashgabat, Beijing sign deals to expand Turkmen gas exports to China’, 4 September 2013; CNPC press release,
‘CNPC and Turkmengaz ink an agreement’, 6 September 2013; Reuters, ‘Turkmenistan has started work on a natural gas
pipeline’, 15 December 2015
28
Pirani, Central Asian and Caspian Gas, 25-26 and 83-86
29
Lelyveld, M., Radio Free Asia, ‘China Nears Limit on Central Asian Gas’, 25 June 2018
11Figure 3: Winter deliveries of Central Asian gas to China, Bcm/month
4.5 2018-19
2017-18
4 2015-16
3.5 2016-17
3
2.5
2
1.5
1
0.5
0
Nov
Dec
Nov
Dec
Nov
Dec
Nov
Dec
Mar
Jan
Mar
Mar
Mar
Jan
Jan
Jan
Feb
Feb
Feb
Feb
Oct
Oct
Oct
Oct
Turkmenistan Kazakhstan Uzbekistan
Source: China customs data
Exports to Russia
Turkmen gas exports to Russia, previously the main export destination, were cut sharply in 2009. As
demand fell in Europe and Russia, Gazprom cut purchases to 10-12 Bcm/year, and demanded a
revision of the oil-linked price formula agreed with Turkmengaz in 2008. No agreement was reached,
and in 2015 purchases were stopped altogether; Gazprom Export started arbitration proceedings in
pursuit of a price revision. In 2018, after political relations between Russia and Turkmenistan
improved, and progress was achieved in the long-frozen Caspian Sea delimitation talks, the
arbitration claim was set aside. By April 2019, Gazprom and Turkmengaz had agreed to restart
exports, under a five-year supply contract for delivery of 5.5 Bcm between 2019 and 2024. 30
The price of Turkmen gas being sold to Russia has not been made public, but has been reported at
$110/mcm at the Turkmen border. This seems plausible, as the average purchase price paid by
Gazprom for Central Asian gas in 2018 was around $133/mcm. This suggests that the long-term
problem for the Central Asian exporters remains: these purchase prices, plus transport to southern
Russia, are higher than Gazprom’s cost of production, and higher than Gazprom’s domestic sales
prices. For comparison, Gazprom’s average domestic sale price, net of VAT, in 2018 was about
$63.30/mcm.31 While prices in southern Russia are higher than in other regions, they are not currently
high enough for Central Asian gas to compete easily. For Central Asian exports to grow in the 2020s,
there would probably need to be a substantial price adjustment.
Given that pipeline capacity is in place, it is probably economically feasible for Turkmen exports to
Russia to increase by a few Bcm/year in future – if Turkmenistan finds it worthwhile to do so, making
the price adjustment mentioned. Turkmen volumes could replace those from Kazakhstan and
Uzbekistan, which have, respectively, exported 11-14 Bcm and 3-6 Bcm annually along this route in
recent years, but may have lower volumes available for export in the 2020s (see below).
30
Argus FSU Energy, ‘Gazprom secures Turkmen gas imports’, 4 July 2019; Vedomosti, ‘Gazprom zakliuchil piatiletnyi kontrakts
Uzbekistanom’, 6 April 2017. On 2008-09, see Pirani, S. (2014). ‘Central Asian and Caspian gas for Russia’s balance’, in
Henderson, J. and Pirani, S. (eds.), The Russian Gas Matrix: how markets are driving change, Oxford: OUP/OIES. 347-367
31
Natural Gas World, ‘Turkmenistan resumes flows to Russia’, 16 April 2019; Gazprom Annual Report 2017, average purchase
prices extrapolated by the author which gave an average purchase price of $121.55/mcm, 139; Gazprom Annual Report 2018
which reported a 9.5 per cent year-on-year increase, 121. Gazprom Annual Report 2018, for average domestic sales price
converted to dollars by the author, 120
12You can also read