Canada Investment Year-End | 2020 - Canadian Real Estate ...
←
→
Page content transcription
If your browser does not render page correctly, please read the page content below

Canada Investment

                    Year-End | 2020
                                  Page 1
Table of

Contents
Economic Overview   3

Key Trends          7

Toronto             13

Montréal            18

Montréal (french)   23

Vancouver           28

Calgary             33

Edmonton            38

Ottawa              43

Contact             48

                         Page 2
Canada Investment Outlook | Year-End 2020
                                                                                                    Economy                                                     Canadian

Macroeconomic Overview
In a country that has not experienced a deep recession in decades, 2020
                                                                                                                                                 GDP Growth Comparison
delivered a once-in-a-lifetime shock to Canadians. As the world weathered
the COVID-19 pandemic, the global economy contracted by 4%. The                                                      10%
Canadian economy experienced its sharpest downturn in almost a century,                                                                                              4.9%
shrinking by -5.5%. This was not as severe as what we saw in more densely                                             5%
                                                                                                                                                            1.7%
populated regions like Europe and the developing world. But it was worse
than industrialized Asian countries like South Korea, Japan, and China, as well                                       0%
as less interventionist countries like the United States. Yet while Canada’s
stringent lockdowns have been devastating for the economy, they seem to                                              -5%
have led to better health outcomes than what most regions experienced.                                                                2019                      -5.5%
                                                                                                                    -10%              2020
Like many other countries, Canada’s government implemented the most                                                                   2021 (f)
ambitious stimulus package in the nation’s history, essentially paying people
to stay home. More than CAD $115b in subsidy programs were passed in 2020,                                          -15%
covering nearly every facet of the economy from individuals and families to                                                      China           United         Canada        Mexico      United
                                                                                                                                                 States                                  Kingdom
companies and municipalities. The Bank of Canada has been purchasing
nearly $4b in bonds weekly and has provided over $300b in liquidity support
to the banking system. Deferrals were granted to nearly 15% of residential                                                              Job Growth and Unemployment
mortgage holders, and the overnight lending rate was cut from 1.75% to                                                2,000                                                                         14%
0.25% to spur private investment.                                                                                     1,500                                                                         12%
                                                                                                                      1,000
These interventions seem to have been largely effective in keeping businesses                                                                                                                       10%
                                                                                                                        500
afloat and households paying their bills. Unemployment peaked in May at                                                                                                                             8%
                                                                                                                           -
13%, before falling back down below 9% by the end of the year. However, by
shutting down the service sector for much of the year, these policies created a                                        (500)                                                                        6%
fragmented economy: what has commonly been referred to as the “K-shaped”                                             (1,000)
                                                                                                                                           Quarterly Job Growth, Thousands                          4%
recovery. On one hand, average household savings rose to almost 25% of net                                           (1,500)
income, compared to 3-5% in a normal year. Many took advantage of low                                                                      Unemployment Rate                                        2%
                                                                                                                     (2,000)
interest rates and invested their savings in a home - in fact, nearly 350,000
homes were sold in the second half of 2020 in Canada, the most ever in a six-                                        (2,500)                                                                        0%
month period. Between increased savings and soaring stock market                                                               4Q15        4Q16        4Q17          4Q18         4Q19      4Q20
valuations, the average Canadian household saw their net wealth increase by
nearly $50,000 over the course of 2020.                                                                                            Change in Employment by Wage Cohort:
                                                                                                                                             Q4 2020 vs. Q1 2020
These savings mostly came at the expense of the service sector. Retail,
accommodation, and food service industries lost nearly 300,000 jobs,                                                   15%
collectively, from a year ago. Employment levels for those making less than                                            10%
$14/hour - mostly service sector workers - are down 22% compared to pre-                                                5%
COVID levels. Youth unemployment is currently close to 20%, more than twice                                                            -22%               -6%
                                                                                                                        0%
the overall unemployment rate. Meanwhile, on the high end of the wage                                                                                                        2%              9%
                                                                                                                       -5%
spectrum, jobs paying at least $42/hour have grown by 9% compared to pre-
                                                                                                                      -10%
pandemic levels.
                                                                                                                      -15%
While 2021 brings with it renewed optimism and the promise of vaccinations,                                           -20%
challenges abound. Canada’s absence of vaccine manufacturing capacity                                                 -25%
means that it will be dependent on global supply chains to inoculate its                                                           < $14 / hr       $14 - $28 / hr      $28 - $42 / hr   > $42 / hr
population. There is some concern about the potential for inflation, if the
vaccine-fueled surge in consumer demand that is expected this year
                                                                                                                      Sources: JLL Research, Oxford Economics, StatCan Labour Force Survey

© 2021 Jones Lang LaSalle IP, Inc. All rights reserved. All information contained herein is from sources deemed reliable; however, no representation or warranty is made to the accuracy thereof.
Canada Investment Outlook | Year-End 2020
                                                                                                    Economy                                                                  Canadian

Capital Markets Overview
overwhelms supply chains. The swelling deficit may nudge the federal
government into deficit reduction mode later in the year and pulling back
                                                                                                                                               Real Estate Investment Volumes by Month, 2020
stimulus will be painful for many companies and households. Finally, if the
polarized, K-shaped recovery continues for some time, it could spill over into a                                                     $9
more polarized political environment as we have seen in other nations.                                                               $8
                                                                                                                                     $7

                                                                                                                    CAD, Billions
And yet, having seemingly faced the worst of COVID’s impact, it is hard not be                                                       $6
optimistic about 2021. Assuming vaccination programs are widespread and                                                              $5
effective, and that lockdowns gradually subside, people will once again work,
                                                                                                                                     $4
shop, eat, and socialize in person. Rooted in this assumption, analysts are
expecting Canada’s economy to grow by almost 5% in the coming year. With                                                             $3
a highly educated labour force, progressive immigration policies, and political                                                      $2
stability, we expect Canada to be well positioned not only through the                                                               $1
expected recovery in 2021, but beyond it.                                                                                            $-
                                                                                                                                                Jan Feb Mar Apr May Jun Jul Aug Sep Oct Nov Dec
One year into the pandemic, its effects on the real estate market have become
much clearer. Total investment volume surpassed $37 billion, a drop of 21%
from a year ago, but generally better than what was expected in March.                                                                          Canadian REITs: Equity and Debt Issuances
Investment activity slowed to a trickle in the second quarter as real estate
owners took stock of the situation, moved to preserved cash flow, and worked                                                                             Equity
                                                                                                                                                         Debentures
with tenants to build in safety protocols and restructure leases. By the end of                                                       $14
                                                                                                                                                         Secured Mortgage Bonds
the year many groups had resumed normal operations and were again                                                                     $12
looking for acquisition opportunities. Distressed sales have been rare,
                                                                                                                                      $10
                                                                                                                     CAD, Billions

amounting to just CAD $800m in 2020, or about 2% of the total market.
Government stimulus and loan forbearance policies are largely to thank for                                                                $8
that. REITs, for all their struggles in 2020, were still able to access over $11b in                                                      $6
new debt and equity, a testament to their strong balance sheets and robust
                                                                                                                                          $4
portfolios.
                                                                                                                                          $2
The industrial sector, fueled by an insatiable demand for e-commerce-related                                                              $0
warehousing needs and benefitting from supply constraints, performed the                                                                         2011 2012 2013 2014 2015 2016 2017 2018 2019 2020
best by many metrics. Rent collections have hovered around 97% during the
pandemic, rental growth was very strong, and industrial was the only sector to                                                                     Canadian REITs: 2020 Returns by Sector
generate a positive return in the equity markets.
                                                                                                                          10%
The multifamily sector has also fared well. Even without the usual tailwinds of                                            5%                  -30.7%            -26.9%            -15.9%           2.0%
immigration, rent collection remained high due to Canada’s supply-                                                         0%
                                                                                                                          -5%                                                                              7.6%
constrained markets and the government’s COVID Emergency Response                                                        -10%
                                                                                                                         -15%                                                               -9.9%
Benefit payments, which supported many household incomes. Fundamentals                                                   -20%
have softened a bit as COVID-related demand issues coincided with a large                                                -25%                                             -18.6%
wave of supply being delivered to the market, but investor sentiment remains                                             -30%                           -27.3%
                                                                                                                         -35%
as bullish as ever.

In a year of uncertainty, many groups turned to the land market. This asset
class has seen prices rise sharply in the last two years as demand has soared.
Approximately 80% of all land deals in 2020 were intended for multifamily or
industrial use. If we add this sales volume to the sales of built and stabilized
multifamily and industrial properties, this brings the “true” allocations of                                                                        Sources: JLL Research, BMO Capital Markets

© 2021 Jones Lang LaSalle IP, Inc. All rights reserved. All information contained herein is from sources deemed reliable; however, no representation or warranty is made to the accuracy thereof.
Canada Investment Outlook | Year-End 2020
Economy Canadian
Capital Markets Overview
capital to these sectors to approximately CAD $24b, or about two-thirds of the
national investment market for the year. Average Sector Cap Rates
7.0%
COVID will nudge the investment market even more toward the alternative Office: Suburban
6.5%
asset classes. Demand for data centres has boomed, as they have made
Zoom calls and remote schooling possible. Film production studios and cold Retail: Open Air
6.0% Retail: Enclosed
storage facilities are competing for a growing share of limited warehouse
space. Canada’s dependence on global supply chains for Personal Protective Office: CBD “A”
5.5%
Equipment (PPE) and vaccines has made a compelling case for the need to
build out life science and laboratory space. In today’s low-yield context, Industrial
5.0%
investors looking for better returns are studying these sectors.
4.5%
Similar to the broader economy, the retail sector has seen its own “K-shaped”
recovery. Essential needs plazas that are anchored by grocery stores have Multifamily
4.0%
seen robust sales, strong rent collection, stable and in some cases
Q416 Q417 Q418 Q419 Q420
compressed cap rates, and plenty of investor interest. However, other areas
within retail – enclosed malls, street retail, and power centres – have been
upended by lockdowns and social distancing guidelines. Valuations have 5-Yr GoC vs. 5-Yr CMB
fallen significantly, and debt and equity investors are reluctant to deploy.
5-Year GoC Yield
5%
5-Yr Commercial Mortgage Spread
Perhaps the most confounding sector for investors continues to be office.
Even with a spike in subleasing in the second half of 2020, vacancy remains 4%
very low by global standards, pre-lease commitments are holding up, rent
3%
collection is strong, and deferral requests generally make up a small fraction
of owner portfolios. The main issues are in the underwriting, as uncertainty 2%
relating to tenant space needs is making it difficult to assess the value of their
leases. Meanwhile, many owners who don’ t need to sell remain on the 1%
sidelines, waiting for some visibility into how that sector will look in a post-
COVID world. This has all led to fewer trades and therefore fewer 0%
1Q17
2Q17
3Q17
4Q17
1Q18
2Q18
3Q18
4Q18
1Q19
2Q19
3Q19
4Q19
1Q20
2Q20
3Q20
4Q20
comparables in the market, which makes valuing these buildings even trickier.
On the debt side, financing turned out much better than anticipated. In the
immediate aftermath of COVID, lenders had stopped almost all new
10-Yr GoC vs. 10-Yr CMB
commitments and were focusing on requests for deferrals. These requests
have dropped considerably since May, in line with the drop in requests for 10-Year GoC Yield
CERB and other programs. Through the second half of 2020, debt has been 5% 10-Yr Commercial Mortgage Spread
widely available, but lender strategies are growing more diverse –
understanding these different strategies is paramount for borrowers looking 4%
to access the debt markets.
3%
From an asset class perspective, debt investor sentiment mirrors the equity 2%
side. Multifamily and industrial continue to be the darlings of lenders, while
appetite for retail is skewed toward grocery- and pharmacy-anchored centres. 1%
Office remains an unknown, as lenders are concerned about the spike in
subleasing and the effect of remote work on office demand. Some groups are 0%
1Q17
2Q17
3Q17
4Q17
1Q18
2Q18
3Q18
4Q18
1Q19
2Q19
3Q19
4Q19
1Q20
2Q20
3Q20
4Q20
willing to finance office but under more conservative terms - lower leverage
ratios and more guarantees are becoming the norm.
Source: JLL Research, JLL Real Estate Investment Survey, Bank of Canada
© 2021 Jones Lang LaSalle IP, Inc. All rights reserved. All information contained herein is from sources deemed reliable; however, no representation or warranty is made to the accuracy thereof.
Canada Investment Outlook | Year-End 2020
                                                                                                    Economy                                                        Canadian

Capital Markets Overview
The trend in lower acquisition lending activity continues overall, still offset by
an increase in refinancing activity by borrowers looking to take advantage of
lower mortgage rates. Investors chasing yield are fuelling development
activity, and we are seeing ever increasing use of the A/B structure by lenders
to provide borrowers with the leverage they want at a still attractive all-in rate.                                                               Bank of Canada Yield Curve
Institutional debt funds are largely back in force after being mostly on the side
lines earlier in 2020.                                                                                                          3%                     Q4 2018            Q4 2019
                                                                                                                                                       Q2 2020            Q4 2020
One notable trend that pre-dates COVID but accelerated in 2020 on both the
equity and the debt side was the rise in private capital. Private debt funds,
backed by retail investors as well as high net worth/family offices, have                                                       2%
provided short-term, high-yield loans mostly for underperforming real estate.
On the equity side, private groups were responsible for over 50% of the
disclosed buyer pool. Without obligations to report to shareholders or                                                          1%
present opportunities to an investment committee, private groups are
increasingly well capitalized and able to move fast.

After spiking in the first half of 2020, 5-year spreads over the GoC benchmark                                                  0%
have continued to drop and are now in the 150-175 bps range, down by about                                                            6M    1YR      2YR    3YR    5YR     7YR      10YR   20 YR
50 pbs points from the peak of the pandemic. Retail and office are showing
higher spreads than pre-pandemic, generally at over 200 basis points. Most
noteworthy is the steepening of the yield curve over the course of the
pandemic. This has accelerated into early 2021, pushing the differential
between the 2- and 10-year yield from -14 basis points in February 2020 to
over 100 basis points in February 2021. Consequently, many borrowers are
choosing shorter terms to lock in rates at less than 2% on conventional
(noninsured) loans.

Lenders will continue to compete for the best performing asset classes, and                                                                 Global Closed-Ended Fundraising
this may translate to spread compression in these sectors. For highly
capitalized borrowers, cost of funds and conditions will remain strong. For                                                    250      Dry powder                                            700
less capitalized borrowers, the debt funds and banks outside of the Big Six will                                                        New fundraising
                                                                                                                                                                                              600
no doubt continue to step in and provide the liquidity to keep the real estate                                                          Average fund size
                                                                                                                                                                                                    Avg. Fund Size (USD, Millions)
                                                                                                                               200
market moving.                                                                                                                                                                                500
                                                                                                               USD, Billions

Looking forward to 2021, we expect the investment market to bounce back in                                                     150                                                            400
a resounding way. Institutional allocations are on the rise thanks to low
interest rates, stock market volatility, and concerns about the potential for                                                  100                                                            300
inflation. Global real estate dry powder (i.e. committed but unspent capital) is
close to record levels, with much of it targeting opportunistic or core                                                                                                                       200
strategies. The lessons learned during COVID – for example omnichannel                                                          50
                                                                                                                                                                                              100
distribution, a more mobile workforce, health and safety protocols, availability
of real-time data, and a heightened focus on Environmental, Social, and                                                         -                                                             -
Governance (ESG) initiatives – will ensure that the industry comes back                                                              2014   2015    2016    2017   2018    2019     2020
stronger than it was before the pandemic.

                                                                                                                                       Source: JLL Research, Bank of Canada, Preqin

© 2021 Jones Lang LaSalle IP, Inc. All rights reserved. All information contained herein is from sources deemed reliable; however, no representation or warranty is made to the accuracy thereof.
Key Trends                                                                                      Canada Investment Outlook | Year-End 2020

   Office                                                                                                         Historical Office Investment
                                                                                            $20
• The Great Work-From-Home Experiment: StatCan estimates that                                         Qtr1
  40% of Canadians worked from home during the pandemic. Office-                            $18       Qtr2
  using companies have mostly gotten by in this context, however they                                 Qtr3
  are increasingly concerned about issues relating to mental health,                        $16
                                                                                                      Qtr4
  onboarding, and sustaining culture. A JLL survey of Fortune 500
  office-using companies reveals that they are looking to have at least                     $14
  80% of their workforce back in the office by the end of 2021.
                                                                                            $12

                                                                            CAD, Billions
• Vacancy on the rise: Office vacancy was up across all markets,
  primarily driven by subleasing which increased by over 50% to 10m                         $10
  square feet nationally. Nevertheless, Montréal, Toronto, Vancouver,
  and Ottawa continue to have some of North America’s lowest                                 $8
  vacancy rates.
                                                                                             $6
• Kicking the can down the road: Lease renewals are accounting for
                                                                                                                                                                $4.1B
  60-70% of total leasing. Large block leasing was down by 48% y-o-y,
                                                                                             $4
  and most new leases were for shorter terms. This suggests that
  office occupiers are opting to postpone decisions until there is more                      $2
  clarity on vaccinations, which will dictate space utilization policies.
• Underwriting challenges: Assessing the value of office buildings will                      $0
  remain a highly challenging task until there is more certainty on                               2011 2012 2013 2014 2015 2016 2017 2018 2019 2020
  vaccinations and tenant footprints. In the meantime investors are
  much more conservative on leasing assumptions.
• Post-COVID opportunities: Softening office markets will create                            Source: RCA, RealNet , Gettel Network, Commercial Edge, CoStar. JLL Valuations
  opportunities for tenants who were long shut out of downtown                              All transactions > $5m, Direct and Entity Level
                                                                                            Excludes residential lots and residential occupier purchases
  ecosystems – this will especially be helpful for Canada’s small and                       Market data as of latest available
  medium-sized enterprises. Meanwhile, tenant preferences for lease
  flexibility are creating an opportunity for owners to build out and
  lease co-working spaces directly, rather than through an operator.
Key Trends                                                                                        Canada Investment Outlook | Year-End 2020

    Multifamily                                                                                                 Historical Multifamily Investment

•   Multifamily sets investment record: Multifamily was the highest grossing                    $14
    sector in Canada with nearly $12b in total investment sales, making 2020                               Qtr1
    a record year. Rent collection averaged 95% through 2020, almost                                       Qtr2                                                     $11.8B
                                                                                                $12
    unchanged from pre-COVID levels.                                                                       Qtr3
•   ...but not unscathed: National apartment vacancy rose from 2% in 2019                                  Qtr4
    to 3.2% in 2020, according to CMHC. Market softening was mostly                             $10
    contained to downtown and downtown-adjacent submarkets where
    newly arriving immigrants and university students generally settle. Many

                                                                                CAD, Billions
    tenants also bought homes or left for more spacious low-rise units in the                    $8
    suburbs – a trend that predates COVID but accelerated in 2020. While
    these migratory patterns may continue, an ongoing stoppage in
                                                                                                 $6
    immigration and university life is unlikely; therefore, we expect the
    market to rebound over the coming year as vaccinations become
    widespread.                                                                                  $4
•   Focus on Adaptive Reuse: As vacancies mount in hotels, low-grade office
    buildings, and other property types, government agencies are
                                                                                                 $2
    increasingly focused on formulating strategies that seek to repurpose
    these properties into affordable housing. CMHC’s Rapid Housing
    Initiative offers one high profile example of this, though provincial and                    $0
    city governments are rolling out similar initiatives.                                              2011 2012 2013 2014 2015 2016 2017 2018 2019 2020
•   Post-COVID opportunities: Canadians spend a greater portion of their
    net income on housing than almost any other nation. Softening rental
    and condo markets will provide relief to overstretched households.
                                                                                                 Source: RCA, RealNet , Gettel Network, Commercial Edge, CoStar. JLL Valuations
    Developers will be forced to reconsider their unit mix which is currently
                                                                                                 All transactions > $5m, Direct and Entity Level
    highly skewed toward studio, one-bedroom, and two-bedroom units. As                          Excludes residential lots and residential occupier purchases
    millennials look to start families, and tenants look for more space,                         Market data as of latest available
    developers will probably need to give more weight to two- and three-
    bedroom units and increase average unit size in general.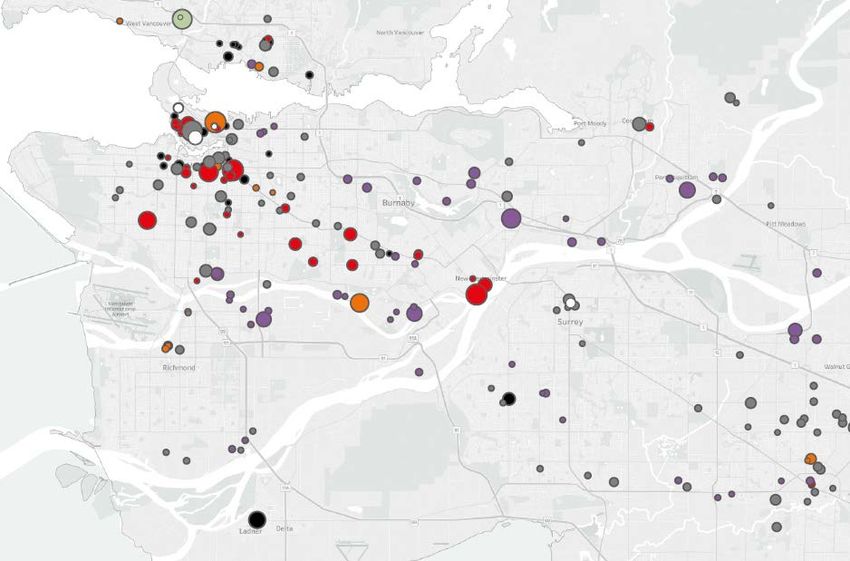
Key Trends                                                                                      Canada Investment Outlook | Year-End 2020

   Retail                                                                                                          Historical Retail Investment

• Retail investment slows to a trickle: Retail investment had its slowest                   $18
                                                                                                       Qtr1
  year in over a decade, with just $3.5b trading during 2020. Retail
                                                                                            $16        Qtr2
  owners were mostly in operational mode and were generally not
  looking at acquisition opportunities. This should change in 2021.                                    Qtr3
                                                                                            $14        Qtr4
• A Tale of Two Malls: Enclosed malls have been decimated by
  mandatory closures. In many cases owners have linked rent
                                                                                            $12
  payments to sales, which have been very low, especially during

                                                                            CAD, Billions
  lockdowns. Open-air, grocery-anchored retail centres, on the other
                                                                                            $10
  hand, have averaged above 90% rent collection over the same
  period and are in high demand by both equity and debt investors.
                                                                                             $8
• Mixed reviews for stimulus measures: The COVID Emergency Rent
  Subsidy program, which replaced the landlord-focused CECRA                                 $6
  program, attracted over 110,000 unique applicants, with almost $1b
  in aid granted. However, the Canadian Federation of Small                                                                                                       $3.5B
                                                                                             $4
  Businesses points out that only one quarter of its members have
  used the rent subsidy program, compared with two-thirds who have                           $2
  used the COVID Emergency Wage Subsidy program. Most landlords
  are offering private deferral agreements as an alternative.                                $0
• Post-COVID opportunities (1): Landlords have worked closely with                                 2011 2012 2013 2014 2015 2016 2017 2018 2019 2020
  tenants during the pandemic, investing in new technologies and
  capital expenditures to help tenants boost sales and adapt. We
  expect this collaboration to continue after the pandemic.
                                                                                             Source: RCA, RealNet , Gettel Network, Commercial Edge, CoStar. JLL Valuations
• Post-COVID opportunities (2): While 2020 was a nightmare year for                          All transactions > $5m, Direct and Entity Level
  many independent, small businesses, the aftermath of the pandemic                          Excludes residential lots and residential occupier purchases
                                                                                             Market data as of latest available
  will present far lower rents and more space for expansion. This will
  greatly benefit small businesses as the economy recovers.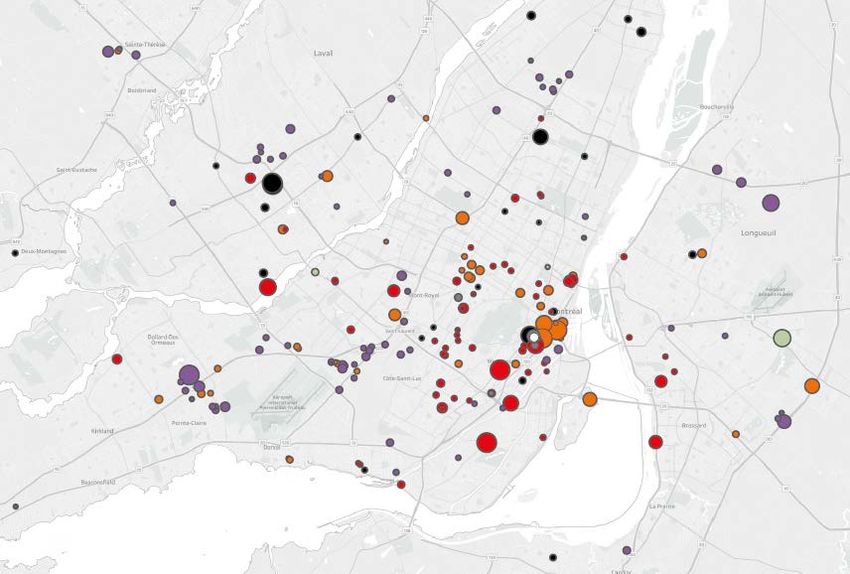
Key Trends                                                                                    Canada Investment Outlook | Year-End 2020

   Industrial                                                                                               Historical Industrial Investment
                                                                                      $12
• Industrial market continues red-hot pace: E-commerce and 3PL                                       Qtr1
  leasing have been relentless, pushing vacancy down to 2.7% as rents
                                                                                                     Qtr2
  grew almost 8% in 2020. Don’t be deceived by the fall in investment
                                                                                      $10            Qtr3
  volumes compared to 2017-2019: this is due to many owners not
  wanting to sell. There is no shortage of investor demand, and this is                              Qtr4
  driving pricing sharply up and compressing cap rates across Canada.
                                                                                          $8
• Industrial land a hot commodity: With sellers generally wanting to

                                                                          CAD, Billions
  hold on to industrial assets during this downturn, acquisition
  opportunities have been limited. Instead, buyers are moving to the                                                                                              $5.8B
                                                                                          $6
  land market as they focus on ground-up development; this gives
  them the option to build in next generation specs like higher clear
  heights, wider column spacing, and additional electric capacity to                      $4
  accommodate robotics.
• E-Commerce re-shaping the industrial landscape: E-commerce
  penetration in Canada jumped from sub-5% before COVID to 13% by                         $2
  the end of 2020. We anticipate that online order demand will be
  sustained as more shoppers come to appreciate its convenience. As
  this happens, more spaces will be repurposed into fulfillment                           $0
  centres and dark rooms to satisfy last-mile demand.                                          2011 2012 2013 2014 2015 2016 2017 2018 2019 2020
• Post-COVID opportunities: As online sales continue to grow, demand
  for warehouse workers and fulfillment professionals will increase
  further. In an already competitive labour market, amenities within                       Source: RCA, RealNet , Gettel Network, Commercial Edge, CoStar. JLL Valuations
  warehouse spaces – natural lighting, fitness centres, and shuttle                        All transactions > $5m, Direct and Entity Level
  buses, for example - will help attract more workers while also                           Excludes residential lots and residential occupier purchases
                                                                                           Market data as of latest available
  providing a safer, healthier and more enjoyable work environment.
Key Trends Canada Investment Outlook | Year-End 2020
Alternative Assets Historical Alternative Assets Investment
$5
• Life Science: With Canada having to import a large share of vaccines Qtr1
and personal protective equipment during the pandemic, COVID has Qtr2
$4
exposed Canada’s undersupplied life science and lab sectors. Qtr3
Growing employment and private investment on the demand side
$4 Qtr4
are making the case for more investment in this space. Real estate
investors, especially long-term-oriented institutional groups, are $3B
$3
taking a closer look at this space and we expect a supply response
over the next few years.
$3
CAD, Billions
• Data Centres: Based on US and European REIT indices, data centres
have outperformed every other asset class during the pandemic. In $2
Canada supply remains limited due to low industrial availability, but
this will likely change as our reliance on them should grow over time. $2
In October, Bell Canada sold 13 data centres to Equinix, the world’s
largest data centre provider by revenue. The transaction, valued at $1
just over CAD $1b, gives the US-based REIT immediate scale beyond
its existing portfolio in Toronto. $1
• Senior Housing: Canada’s senior housing operators are reporting
occupancy losses in the range of 250 – 400 basis points over the $0
course of 2020. Long-term care residents are first in line for 2011 2012 2013 2014 2015 2016 2017 2018 2019 2020
vaccinations, and no other sector has more to gain from them.
However, occupancy may not recover to pre-COVID levels for some
time as demand could lag. In the long-run we expect investor Source: RCA, RealNet , Gettel Network, Commercial Edge, CoStar. JLL Valuations
appetite to be strong for this sector with its needs-based demand All transactions > $5m, Direct and Entity Level
and limited supply. Excludes residential lots and residential occupier purchases
Market data as of latest available$37B
Total investment volume, 2020 YTD Foreign Buyer Pool by Origin
Singapore
Sweden 0.1%
0.1% Undisclosed
1.0%
United
States
4.2%
Canada
94.6%
Edmonton
$ 1.5B
Vancouver
$ 5.8B Calgary
$ 1.4B Ottawa
$ 1.6B
Montréal
Toronto
$ 6.1B
$ 11.8B
Real Estate Investment Volumes by Asset Class
$60 Multifamily Land
Hotel Industrial
Office Retail
$50 Alternative Assets
Buyer and Seller Profile, 2020
CAD, Billions
$40
User Seller
$30
Buyer
Public
$20
Private
$10
Pension Fund
$-
Fund Manager
2011 2012 2013 2014 2015 2016 2017 2018 2019 2020
Foreign
Source: RCA, RealNet , Gettel Network, Commercial Edge, CoStar, JLL Valuations. $0 $5 $10 $15 $20
All transactions > $5m, Direct and Entity Level
Excludes residential lots and residential occupier purchases CAD, Billions
Market data as of latest availableToronto Canada Investment Outlook | Year-End 2020
Toronto
 Canada Investment Outlook | Year-End 2020
Historical Real Estate Investment by Sector Disclosed Buyer and Seller Pool, 2020
Multifamily Land
$25 Hotel Industrial
Office Retail User
Alternative Assets
$20
Public
CAD, Billions
$15 Private
$11.8B
Pension Fund
$10
Fund Manager
$5 Buyer
Foreign
Seller
$0 $0 $1 $2 $3 $4 $5 $6 $7 $8
2015 2016 2017 2018 2019 2020 illi
Toronto Buyer Domicile, 2020 Source: RCA, RealNet, JLL Valuations
All transactions > $5m, Direct and Entity Level
Excludes residential lots and residential occupier purchases
Canada U.S. Rest of the world Market data as of latest available
96% 3% 1%
Multifamily Office
Land Retail
Hotel Alternative Assets
Industrial
* Higher point size represents
larger deal sizeToronto Canada Investment Outlook | Year-End 2020
General Office Investment and Price PSF
• In 2020 there were approximately $11.8b in total commercial Total Investment
investment sales in the GTA. Private capital continued to take market Avg. PSF: Downtown Class A
$10 Avg. PSF: Suburban Class A $1,000
share from institutional investors, accounting for 53% of all liquidity.
• Development land was the most heavily traded asset, accounting for
$8 $800
$3.6b, while multifamily ($2.2b) and industrial ($2.1b) followed. About
Avg. Sale Price PSF
$1.6b of land deals are zoned for multifamily residential, suggesting
CAD, Billions
that the true liquidity in the multifamily sector is much higher – not $6 $600
surprising given the continued undersupply in the housing market.
• Brookfield and Rogers are exploring plans to build a new stadium for $4 $400
the Blue Jays , either on the existing site or on the Quayside
waterfront. The development would be a large-scale mixed-use $2 $200
complex that incorporates office, condo, retail, and public space.
• The provincial government passed the Ontario Rebuilding and $- $-
Recovery Act, 2020. This legislation purports to accelerate the 2015 2016 2017 2018 2019 2020
construction of major infrastructure projects by expediting planning,
design, and construction.
• Toronto city council voted to review proposals for changes to the city's Office Supply and Demand
4 12%
minimum parking requirements. If this moves forward, Toronto will
join a growing number of cities who have abolished this policy, giving 3
developers more flexibility in designing projects. 10%
Office 2
8%
Vacancy Rate
Millions of s.f. 1
• Office investment within the GTA fell to its lowest level in over a decade
6%
with $1.4b transacting in 2020. Capital flows have been stalled mainly
0
because tenants are still working out their occupancy plans, and
owners are waiting for clarity before transacting. We expect a strong 4%
-1 Net Absorption
rebound in 2021 once investors have a better understanding of office Deliveries
utilization strategies and COVID vaccination rollouts. -2 Vacancy 2%
• In a market long dominated by institutional capital, private investors
accounted for over 30% of transaction volume as they continue to gain -3 0%
market share. Fund managers like BGO and Fengate were the most 2015 2016 2017 2018 2019 2020
active office buyers, accounting for 44% of total volume.
• Office restructuring led to an additional 1.4m sqft in subleasing in 2020, Office Cap Rates
pushing GTA vacancy up from 6.7% in 2019 to 8.6% today. While the 7%
entire market softened, downtown was disproportionately affected, 6%
rising to 4.2% vacancy from 1.7% a year ago. Landlord concessions 5%
have pushed net effective rents down by an estimated 5-10% on 4%
average. Yet with one of the world’s lowest office vacancy rates, 3%
Toronto landlords are confident in the underlying fundamentals and 2%
therefore have not rushed to lower their asking rents. 1%
• Brookfield is rumoured to have sold a 50% non-managing interest in 0%
Bay Adelaide Centre North to Dadco Investments for $370m, or $902 2015 2016 2017 2018 2019 2020
psf. The transaction is valued at a 4.1% cap rate and represents the
first major financial core transaction since the beginning of COVID. Avg. Cap Rate: Downtown Class A
Avg. Cap Rate: Suburban Class A
• Even amidst the market downturn, large-scale development plans GoC 10-yr Bond
were announced. Oxford and CT REIT will partner on a 650,000 sqft
redevelopment of Canada Square, while Dream Office REIT announced
a 79-storey tower at King and Simcoe. Source: JLL Research, JLL Real Estate Investment Survey, Altus ITS
© 2019 Jones Lang LaSalle IP, Inc. All rights reserved. All information contained herein is from sources deemed reliable; however, no representation or warranty is made to the accuracy thereof.
Page 15Toronto Canada Investment Outlook | Year-End 2020
Multifamily Investment Volumes and Cap Rates
Multifamily
Total Investment
• Multifamily investment sales reached $2.2b for 2020 in the GTA, down $4.0 Avg. Cap Rate: Downtown 6%
from $3.7b in 2019, a record year for this sector. Investors largely Avg. Cap Rate: Suburbs
$3.5 GoC 10-yr Yield
focused on asset management rather than acquisitions from March to 5%
August, resulting in lower investment volumes. $3.0
Avg. Cap Rate
4%
CAD, Billions
• GTA multifamily vacancy rose from 1.1% in 2019 to 3.4% due to a $2.5
confluence of factors: a lack of immigration, an exodus of university $2.0 3%
students and young families, the addition of AirBnB rentals to the long-
$1.5
term supply, and record condo and rental deliveries. Vacancy rose to 2%
2% in the 905 suburbs and 5.7% in the urban core. $1.0
1%
• Low interest rates and demand for more space have led to strong price $0.5
growth across the for-sale housing market. Condos were the $0.0 0%
exception, with prices falling by an average 6.8% y-o-y. According to 2015 2016 2017 2018 2019 2020
Urbanation, 61% of new condo units delivered in 2020 are studio or
one-bedroom, precisely where pricing has fallen the most.
• According to StatCan, over 50,000 people left the city of Toronto from
Multifamily Sale Price Per Suite and Vacancy
July 2019 to July 2020. This trend of out-migration is not new; $500 5%
Avg. PPU, Downtown
however, it is the highest annual outflow of people from Toronto on
Avg. PPU, Suburban
record. The suburbs that seemed to benefit the most from this $400 Vacancy 4%
spillover were Milton, Brampton, and Oshawa, which saw population
CAD, Thousands
growth of 4%, 3.4%, and 2%, respectively. Further out cities like
Vacancy Rate
Hamilton, Kitchener-Waterloo, Guelph, and Barrie saw some of $300 3%
Canada’s highest housing price growth, suggesting that these cities
also received a significant share of GTA population spillover. $200 2%
• The Province of Ontario passed Bill 204: Helping Tenants and Small
Businesses Act, which implemented a freeze on rent increases in $100 1%
Ontario through the end of 2021 and extended a commercial evictions
moratorium as well. $- 0%
Retail 2015 2016 2017 2018 2019 2020
• Retail investment sales in the GTA fell to their lowest point in over a Retail Investment Volumes and Cap Rates
decade at $885m. Private buyers accounted for 84% of total market $4.0 8%
Total Investment Regional Malls
liquidity as institutional investors and REITs are mostly divesting or
Power Center Food Anchored Strip
focusing on developing complementary uses like multi-residential.
GoC 10-yr Bond
• Grocery- and pharmacy-anchored retail continues to perform strongly $3.0 6%
with rent collection generally in the range of 85-90% and pricing that is
in some cases higher than before COVID. The same cannot be said for
Avg. Cap Rate
CAD, Billions
the enclosed and non-essential sectors, where collections have been
$2.0 4%
far lower, and tenants have had to rely on either government subsidies
or rent deferrals with their landlord.
• The federal government replaced the highly criticized CECRA program
- which split rent costs evenly among tenants, landlords, provincial, $1.0 2%
and federal governments - for the Commercial Rent Subsidy program,
where tenants apply directly. However, high compliance costs have
limited its reach. $0.0 0%
• Storefront retail has been highly bifurcated: Quick Service Restaurants 2015 2016 2017 2018 2019 2020
(QSR) and electronics stores have performed above average, but full-
service restaurants and clothing stores have seen sales fall sharply
Source: JLL Research, JLL Real Estate Investment Survey, Altus ITS, Urbanation, CMHC
from 2019 levels.
© 2019 Jones Lang LaSalle IP, Inc. All rights reserved. All information contained herein is from sources deemed reliable; however, no representation or warranty is made to the accuracy thereof.
Page 16Toronto Canada Investment Outlook | Year-End 2020
Industrial Investment Volumes and Price PSF
Industrial
$4.5 $250
Total Investment
• The GTA saw about $2.1b in total industrial asset sales over the past
$4.0 Single Tenant
year. This represents a significant decrease compared to the last three
$3.5 Multi Tenant $200
years, but this is mostly because industrial owners are not eager to sell
at a time when these assets are providing strong cash flows. The
CAD, Billions
$3.0
Avg. Price PSF
market was dominated by private investors (60% of liquidity) and REITs $150
(19%). $2.5
• With unprecedented demand for e-commerce driving the market, cap $2.0
$100
rates have continued to fall and now average 4.43% for multi-tenant $1.5
buildings and 4.31% for single-tenant buildings. Asset pricing has risen
by an astonishing 65-70% on average since 2016. $1.0 $50
• Vacancy rose slightly from 1.3% a year ago to 1.6%, mostly due to the $0.5
completion of nearly 11m square feet of space. Even still, Toronto $0.0 $-
boasts the lowest industrial vacancy in North America, and one of the 2015 2016 2017 2018 2019 2020
lowest in the world. Average net rents have surged to $10.25 psf,
compared to $9 psf a year ago. To the extent that there was market Industrial Supply and Demand
softening during COVID, it was concentrated in the small bay segment
of the market. 18 Net Absorption 4.5%
• Several new projects were announced in late 2020. Amazon will add Deliveries
16 4.0%
two more fulfillment centres in Ajax and Hamilton, while CN Avg. Vacancy Rate
announced that it will make a financial commitment of $250m to 14 3.5%
develop Milton Logistics Hub. After closing its Ottawa plant last year, 12 3.0%
Vacancy Rate
General Motors announced that it will invest $1.3b to reopen the Millions of s.f. 10 2.5%
factory this year to make Chevrolet Silverados and Sierras. GM will also
invest another $1b to make its Ingersoll plant Canada’s first large-scale 8 2.0%
Electric Vehicle manufacturing plant. 6 1.5%
• With industrial owners not in a hurry to sell, demand is spiking for
4 1.0%
industrial development land. Rising ICI land prices are extending
throughout the Golden Horseshoe Region but have grown fastest on 2 0.5%
GTA brownfield land. 0 0.0%
2015 2016 2017 2018 2019 2020
Alternative Assets Industrial Cap Rates
• Between sales in senior housing, data centres, self storage facilities, 6%
automotive dealerships, and life science labs, the GTA saw a record
5%
year for alternative asset sales with over $1.4b in total sale volume.
• Strategic Storage Trust finished construction of its 1,050-unit facility in 4% Single Tenant
Vaughan, which was developed in partnership with SmartCentres REIT, Multi Tenant
adjacent to their Vaughan retail centre. 3% GoC 10-yr Bond
• The Ontario government is providing significant aid to the province’s
Long Term Care homes to help stem COVID outbreaks and fast-track 2%
vaccination. Thus far the province has committed $1.4b in assistance
1%
and looks to have all residents and employees vaccinated by March.
0%
2015 2016 2017 2018 2019 2020
Source: JLL Research, JLL Real Estate Investment Survey, Altus ITS
© 2019 Jones Lang LaSalle IP, Inc. All rights reserved. All information contained herein is from sources deemed reliable; however, no representation or warranty is made to the accuracy thereof.
Page 17Montréal Canada Investment Outlook | Year-End 2020
Montréal
   Canada Investment Outlook | Year-End 2020
Historical Real Estate Investment by Sector Disclosed Buyer and Seller Pool, 2020
$10
Multifamily Land
Hotel Industrial User
$8 Office Retail
Alternative Assets Public
$6.1B
CAD, Billions
$6
Private
$4 Pension Fund
Fund Manager
$2 Buyer
Foreign Seller
$0
2015 2016 2017 2018 2019 2020 $0.0 $0.5 $1.0 $1.5 $2.0 $2.5 $3.0 $3.5
CAD, Billions
Montréal Buyer Domicile, 2020 Source: RCA, JLL Valuations
All transactions > $5m, Direct and Entity Level
Canada Excludes residential lots and residential occupier purchases
U.S. Sweden
Market data as of latest available
91% 8% 1%
Multifamily
Land
Hotel
Industrial
Office
Retail
Alternative Assets
* Higher point size represents
larger deal sizeMontréal Canada Investment Outlook | Year-End 2020
Office Investment Volumes and Price PSF
General
• Total investment sales in the Greater Montréal Area (GMA) reached Total Investment Avg. PSF, Downtown
Avg. PSF, Suburban Avg. PSF, Midtown
$6.1 billion in 2020. While this represents a 30% fall from 2019 – $2.5 $500
which was a record year - it remains 15% above the market’s five-
year average. Investor appetite in Montréal remains very strong $2.0 $400
despite the difficult circumstances of the past year.
Avg. Sale Price PSF
CAD, Billions
• The GMA saw real GDP growth of -6.2% for 2020, compared to -5.5% $1.5 $300
for the province of Quebec. Unemployment peaked in the second
quarter at 15.1% before falling to 10.5% by December. However, $1.0 $200
with a local economy heavily reliant on retail and tourism, Montréal
should also be one of the cities to post the highest growth during an $0.5 $100
expected recovery in 2021.
• Despite plummeting ridership during COVID, CDPQ announced a $0.0 $-
$10 billion plan to extend the REM train 32 km east from downtown 2015 2016 2017 2018 2019 2020
to Montréal-Nord and Pointe-aux-Trembles. The REM de l'Est lines
would bring much needed transit service to some of the most
underserved sectors of the city.
Office Supply and Demand
• 2020 saw a definitive trend of off-island migration. The areas that 3.0 14%
are benefitting most from this spillover are suburbs like Brossard,
2.5
Laval, and Saint-Eustache. Suburban corridors that are served by 12%
Net Absorption
transit have seen strong buyer interest for development land. 2.0 Deliveries
10%
Millions of s.f. Vacancy Rate
Vacancy Rate
1.5
Office 8%
1.0
• Montréal’s office sector saw over $1.2b in total sales, though most
6%
of this liquidity came in the first quarter before lockdown 0.5
restrictions kept employees at home. The sales of Centre de
4%
Commerce Mondial to Allied Properties and 1100 Rene-Levesque 0.0
W. to Groupe Mach netted over $500m just days into 2020. 2015 2016 2017 2018 2019 2020
-0.5 2%
• A shift in fundamentals took hold beginning in the third quarter
when subleasing began to tick up. Total sublease availability in -1.0 0%
the GMA rose to over 2m square feet, pushing vacancy up to 10%
and absorption down to -673,500 s.f. for the year. Most of the Office Cap Rates
negative absorption occurred in the Class B and C segments. As
more tenants are expected to consolidate and purge excess space, 10% Avg. Cap Rate: Downtown Class A
this could lead to a continued rise in vacancy into 2021 that will 9% Avg. Cap Rate: Midtown
8% Avg. Cap Rate: Suburban
further dampen rents. GoC 10-yr Bond
7%
• Challenging leasing fundamentals have made it difficult to
6%
underwrite office buildings, and most buyers and sellers are in a
5%
holding pattern. Still, Montréal’s low vacancy and strong demand
4%
entering the pandemic have kept many investors bullish. With
bond yields trading at cyclical lows, Montréal office continues to 3%
deliver strong returns on a risk-adjusted basis. As soon as there is 2%
more clarification on vaccines and the trajectory of the pandemic, 1%
we expect market liquidity to return. 0%
2015 2016 2017 2018 2019 2020
Source: JLL Research, JLL Real Estate Investment Survey, Altus ITS
© 2019 Jones Lang LaSalle IP, Inc. All rights reserved. All information contained herein is from sources deemed reliable; however, no representation or warranty is made to the accuracy thereof.
Page 20Montréal Canada Investment Outlook | Year-End 2020
Multifamily Investment Volumes and Cap Rates
Multifamily
Total Investment GoC 10-yr Yield
• The city of Montréal saw a net loss of nearly 30,000 people, mostly to Downtown Midtown
surrounding suburbs. With no new immigrants coming into the city $2.0 Suburban 6%
and an exodus of university students, residential vacancy is on the rise. 5%
According to CMHC, overall apartment vacancy in the GMA rose from $1.5
Avg. Cap Rate
CAD, Billions
1.5% in 2019 to 2.7% in 2020, but vacancy in the downtown core rose 4%
from 2.5% to 10.7%. Rental vacancy in core suburbs was more stable.
$1.0 3%
• Notwithstanding rising vacancy, Montréal’s multifamily investment
market stayed red-hot through the pandemic. Overall volume reached 2%
over $1.7b, marking the fourth straight year of rising liquidity. Pricing $0.5
remained aggressive; with investors competing for limited product, 1%
cap rates continued to fall throughout 2020. Pricing per unit is pushing
$0.0 0%
record levels with few discounts to be found.
2015 2016 2017 2018 2019 2020
• Developers continue to position ambitious projects around transit
stations. Cadillac Fairview has unveiled plans to build over 5,000
residential units, retail, a hotel, and seniors housing at Pointe-Claire Multifamily Sale Price Per Suite and Vacancy
station. At Montmorency, Group Montoni, Groupe Sélection, and FTQ
$350 Avg. PPU, Downtown 8%
are partnering on a 1.36m s.f. mixed use development, the largest yet
Avg. PPU, Midtown
in Laval. Meanwhile Devimco continues to progress on Solar $300 7%
Avg. PPU, Suburban
Uniquartier in Brossard, the largest TOD project on the South Shore.
Vacancy 6%
The provincial moratorium on residential evictions was lifted in late $250
CAD, Thousands
•
5%
Vacancy Rate
July. To cushion a potential spike in evictions, the provincial
$200
government earmarked over $70m in funding towards a housing action 4%
plan to support tenants. $150
3%
Retail $100
2%
$50 1%
• With an economy that is highly correlated to the vitality of its street
retail, Montréal’s recovery will be fragmented and uneven throughout $- 0%
2021. Mindful of this, the city implemented the Active Mobility 2015 2016 2017 2018 2019 2020
Corridors program that provided $20m in funding to enhance foot
traffic and help retailers set up online sales channels. The provincial
government contributed an additional $20m in subsidies aimed at
Retail Investment Volumes and Cap Rates
helping Montréal Small and Medium-Sized Enterprises (SMEs). Total Investment Regional Malls
• Retail investment in Montréal reached just over $1b for the year, more Power Center Food Anchored Strip
$2.0 8%
than any other Canadian city. Cadillac Fairview’s share sale of GoC 10-yr Bond
Carrefour Laval to TD Asset Management, at an overall price of $463m,
was the largest retail sale in Quebec this past year. First Capital, Vista, $1.5 6%
Choice Properties, and Forum each divested Quebec retail portfolios
Avg. Cap Rate
CAD, Billions
over the course of the year.
• Sharp pricing adjustments have been made across the retail spectrum, $1.0 4%
with investors reporting cap rate hikes in the order of 30-50 basis
points for enclosed malls and 30-40 basis points for power centres.
Grocery-anchored plazas have been least affected, with cap rates $0.5 2%
slightly compressing and investors eager to deploy. Perhaps more
than any other property type, investors and lenders are giving more
$0.0 0%
scrutiny than ever to retail assets in terms of location and covenant.
2015 2016 2017 2018 2019 2020
Source: JLL Research, JLL Real Estate Investment Survey, Altus ITS, CMHC
© 2019 Jones Lang LaSalle IP, Inc. All rights reserved. All information contained herein is from sources deemed reliable; however, no representation or warranty is made to the accuracy thereof.
Page 21Montréal Canada Investment Outlook | Year-End 2020
Industrial Investment Volumes and Price PSF
Industrial $1.4 Total Investment $180
• As we have seen in other Canadian markets as well as globally, Multi Tenant $160
$1.2
industrial demand has proven insatiable during the pandemic. Net Single Tenant $140
absorption surpassed 2.5m square feet in 2020, the lowest level since $1.0
$120
Avg. Price PSF
2016 but still far above new supply. Demand is driven by short-term
CAD, Billions
leases from essential service users, including food processing and e- $0.8 $100
commerce fulfillment. By the end of 2020 vacancy was down to 1.9%,
$0.6 $80
an all-time low, and average asking rents were up to $7.58 psf.
• These fundamentals are attracting more development, with over 5m $60
$0.4
square feet in the construction pipeline. This could push vacancy up $40
slightly in the short-term, but with most of the pipeline already pre- $0.2
$20
leased, we expect the market to remain firmly landlord-favourable.
Some notable completions for 2021 include Sobey’s fulfillment centre $0.0 $-
at 2400 Trans-Canada Highway and the WIPTEC fulfillment centre in 2015 2016 2017 2018 2019 2020
Longueuil. Amazon also made several moves: a 520,000 sqft sortation
center in Coteau-du-Lac and three delivery stations in Laval and Industrial Supply and Demand
Lachine.
• Montréal’s undersupplied industrial market has risen dramatically in Net Absorption
6 8%
value over the past few years. Warehouse pricing is now above $150 Deliveries
psf for multi-tenant buildings and above $160 psf for single-tenant – an Avg. Vacancy Rate
7%
5
appreciation of around 70% since 2017. Cap rates continue to fall at 6%
an average of 4.72% for multi-tenant and 4.64% for single-tenant,
Vacancy Rate
4
Millions of s.f.
based on the most recent JLL Real Estate Investment Survey. 5%
• Strong investment performance and resilient fundamentals are 3 4%
drawing record levels of liquidity to the market. Investment volume
3%
reached $1.2b in 2020, nearly a 20% rise over 2019. 2
2%
1
1%
Alternative Assets 0 0%
2015 2016 2017 2018 2019 2020
• Montréal saw nearly $300m in alternative asset sales between data
centres, senior housing, automotive dealerships, and self storage
facilities. Industrial Cap Rates
• Equinix, a US-based REIT specializing in data centre operations, 7%
established a foothold in Montréal as part of its acquisition of 13 Bell
6%
Canada data centres across Canada.
• With over 35,000 seniors, Quebec’s Long Term Care system has been 5%
under intense pressure during COVID with multiple outbreaks across Single Tenant
4%
the region. However, as vaccination has spread, average daily cases Multi Tenant
have fallen from around 60 in late 2020 to single digits in early 2021 3% GoC 10-yr Bond
and all outbreaks have been contained.
• The largest transaction of the year was a joint venture between 2%
Chartwell and Welltower. The two groups each acquired a 42.5% 1%
interested in the 345-suite Le St. Gabriel retirement residence in Saint-
Hubert at a cost of $37.9m each, or nearly $260,000 per bed. 0%
2015 2016 2017 2018 2019 2020
Source: JLL Research, JLL Real Estate Investment Survey, Altus ITS
© 2019 Jones Lang LaSalle IP, Inc. All rights reserved. All information contained herein is from sources deemed reliable; however, no representation or warranty is made to the accuracy thereof.
Page 22Montréal Aperçu des marchés des capitaux | T4 2020
Montréal
   Aperçu des marchés des capitaux | T4 2020
Investissement immobilier par catégorie d’actif Profil des investisseurs immobiliers du marché
$10 Multi-résidentiel Terrains
Hôtels Industriel
$9 Utilisateur
Bureaux Détail
$8 Actifs Alternatifs
Publique
$7
$6.1B
CAD, Milliards
$6 Privé
$5
Fonds de
$4 pension
$3 Gestionnaires de
Placement
$2
Acheteur
$1 Étranger
Vendeur
$0
2015 2016 2017 2018 2019 2020 $0.0 $0.5 $1.0 $1.5 $2.0 $2.5 $3.0 $3.5
CAD, Milliards Billions
Domicile des acquéreurs, T4 2020
Source : JLL Valuations, RCA
Canada États-Unis Suéde transactions > 5 millions $, directement et au niveau des entités
91%
Exclut les lots résidentiels et les achats des occupants résidentiels
8% 1% Données de marché au plus tard disponibles
Multi-résidentiel
Terrains
Hôtels
Industriel
Bureaux
Détail
Résidences pour
personnes âgées
* La taille du cercle
correspond au montant de la
transactionMontréal Aperçu des marchés des capitaux | T4 2020
Général Bureaux: Investissement Total et Prix par Pi2
• Le volume d’investissement total a atteint 6,1 milliards $, en 2020, dans la grande $2.5 $500
région de Montréal (GRM). Bien que cela représente une baisse de 30 % par rapport
à celui de 2019—qui fut une année record—le volume d’investissement demeure 15 $450
% au-dessus de la moyenne du marché des cinq dernières années. Cela suggère $2.0 $400
que Montréal est demeuré un marché extrêmement fluide et liquide et ce, malgré $350
CAD, Milliards
les circonstances difficiles de la dernière année.
$1.5 $300
Prix par pi2
• La GRM a connu une croissance négative du produit intérieur brut réel de - 6,2 %
$250
pour l’année 2020, contre un taux - 5,5 % pour le Québec dans son ensemble. Le
taux de chômage a atteint un pic au cours du deuxième trimestre, à 15,1 %, avant $1.0 $200
de retomber à 10,5 %, en décembre. Après avoir été l'une des villes canadiennes $150
dont l’économie a été la plus durement touchée en 2020, Montréal sera également $0.5 $100
l'une des villes qui affichera la plus forte croissance lors de la reprise attendue en
$50
2021.
$0.0 $0
• Malgré la chute de l'achalandage des transports en commun causée par la
pandémie de COVID-19, la Caisse de dépôt et placement du Québec a annoncé un T4 2015 T4 2016 T4 2017 T4 2018 T4 2019 T4 2020
plan de 10 milliards $ pour prolonger le Réseau express métropolitain (REM) de 32 investissement total centre-ville, Cat. A
km vers l'est, et ainsi relier le centre-ville à Montréal-Nord et Pointe-aux-Trembles.
centre-ville, Cat. B banlieue, Cat. A
Les lignes du REM de l'Est fourniront enfin un service de transport en commun
indispensable à certains des secteurs les plus mal desservis de la ville.
• L'année 2020 a été marquée par une tendance indéniable : la migration vers Bureaux: l'offerte et la demande
3.0 15%
l’extérieur de l’île de Montréal. Les régions qui profitent le plus de cet effet sont les
banlieues de Brossard, Laval et Saint-Eustache. Les corridors situés en banlieue qui
sont desservis par le transport en commun ont connu un fort intérêt de la part des
acheteurs de terrains. 2.0 10%
taux d'inoccupation
Bureaux Millions de pi2
• Le secteur des immeubles de bureaux montréalais a enregistré des ventes totales de 1.0 5%
plus de 1,2 milliard $, bien que la majeure partie de ces transactions ait eu lieu au
cours du premier trimestre, avant l’entrée en vigueur des restrictions liées à la
pandémie. Les ventes du Centre de Commerce Mondial (au FPI Allied) et du 1100, 0.0 0%
boulevard René-Lévesque Ouest (au Groupe Mach) ont totalisé plus de 500 millions
$, au tout début de 2020. Absorption totale nette, totale
Construction complétées, totale
• Les indicateurs du marché ont connu un changement important à partir du taux d'inoccupation, totale
troisième trimestre, avec l’afflux de locaux offerts en sous-location. La disponibilité -1.0 -5%
totale des espaces en sous-location dans la grande région de Montréal a augmenté à T4 2015 T4 2016 T4 2017 T4 2018 T4 2019 T4 2020
plus de 2 millions de pieds carrés, ce qui a fait monter le taux d'inoccupation à 10 %
et a fait chuter l'absorption à - 673 500 pieds carrés pour l'année. La majeure
partie de l’absorption négative a été enregistrée dans les segments des catégories B 8% Bureaux: taux d' capitalisation
et C. Comme l’on s'attend à ce que davantage de locataires regroupent leurs 7%
espaces de travail et se départissent de leurs locaux excédentaires, cela pourrait
entraîner une hausse du taux d'inoccupation jusqu'en 2021 et réduire davantage les 6%
loyers. 5%
• Le contexte difficile des activités de location a rendu très ardu l’établissement de la 4%
valeur des immeubles de bureaux. En effet, les acheteurs et les vendeurs ont du mal 3%
à s'entendre sur un enjeu crucial : les hypothèses relatives aux revenus locatifs.
Néanmoins, le faible taux d'inoccupation des immeubles de bureaux montréalais et 2%
la vigueur de la demande qui prévalait avant la pandémie font en sorte que de 1%
nombreux investisseurs demeurent optimistes quant à ce marché. En raison des 0%
rendements obligataires qui demeurent à des creux cycliques, nous considérons
T4 2014 T4 2015 T4 2016 T4 2017 T4 2018 T4 2019 T4 2020
que le secteur des bureaux de Montréal offre de solides opportunités de rendement
sur une base ajustée au risque. Dès que l'on aura plus de précisions sur la
centre-ville, Cat. A centre-ville, Cat. B
vaccination et la trajectoire de la pandémie, nous nous attendons à un retour aux
banlieue, Cat. A obligations du Canada de 10 ans
niveaux de liquidités antérieurs sur ce marché.
Source : Recherche JLL, REIS JLL, Altus ITS
© 2019 Jones Lang LaSalle IP, Inc. All rights reserved. All information contained herein is from sources deemed reliable; however, no representation or warranty is made to the accuracy thereof.
Page 25You can also read