Colonization from divergent ancestors: glaciation signatures on contemporary patterns of genomic variation in Collared Pikas ( Ochotona collaris)
←
→
Page content transcription
If your browser does not render page correctly, please read the page content below
Molecular Ecology (2015) 24, 3688–3705                                                                        doi: 10.1111/mec.13270

Colonization from divergent ancestors: glaciation
signatures on contemporary patterns of genomic
variation in Collared Pikas (Ochotona collaris)
H A Y L E Y C . L A N I E R , * R O B M A S S A T T I , † Q I X I N H E , † L I N K E . O L S O N ‡ and L . L A C E Y K N O W L E S †
*Department of Zoology and Physiology, University of Wyoming at Casper, Casper, WY 82601, USA, †Department of Ecology
and Evolutionary Biology, The University of Michigan, Ann Arbor, MI 41809-1079, USA, ‡University of Alaska Museum,
University of Alaska Fairbanks, Fairbanks, AK 99775, USA

             Abstract
             Identifying the genetic structure of a species and the factors that drive it is an important
             first step in modern population management, in part because populations evolving from
             separate ancestral sources may possess potentially different characteristics. This is
             especially true for climate-sensitive species such as pikas, where the delimitation of
             distinct genetic units and the characterization of population responses to contemporary
             and historical environmental pressures are of particular interest. We combined a restric-
             tion site-associated DNA sequencing (RADSeq) data set containing 4156 single nucleo-
             tide polymorphisms with ecological niche models (ENMs) of present and past habitat
             suitability to characterize population composition and evaluate the effects of historical
             range shifts, contemporary climates and landscape factors on gene flow in Collared
             Pikas, which are found in Alaska and adjacent regions of northwestern Canada and are
             the lesser-studied of North America’s two pika species. The results suggest that contem-
             porary environmental factors contribute little to current population connectivity. Instead,
             genetic diversity is strongly shaped by the presence of three ancestral lineages isolated
             during the Pleistocene (~148 and 52 kya). Based on ENMs and genetic data, populations
             originating from a northern refugium experienced longer-term stability, whereas both
             southern lineages underwent population expansion – contradicting the southern stability
             and northern expansion patterns seen in many other taxa. Current populations are com-
             parable with respect to generally low diversity within populations and little-to-no recent
             admixture. The predominance of divergent histories structuring populations implies that
             if we are to understand and manage pika populations, we must specifically assess and
             accurately account for the forces underlying genetic similarity.
             Keywords: Alaska, climate change, mammal, phylogeography,             STRUCTURE

             Received 30 September 2014; revision received 27 May 2015; accepted 29 May 2015

                                                                     separating populations and environmental connectivity;
Introduction
                                                                     e.g. Storfer et al. 2007) contribute to patterns of genetic
The characterization of the genetic structure of a species           variation, but differences between the present and past
and the factors that drive it are important first steps in           distributions, where contemporary populations are
population management because the dynamic spatio-                    founded from divergent ancestral source populations,
temporal histories of populations can profoundly impact              may act to structure genetic diversity among extant pop-
their future evolutionary potential. For example, not                ulations (e.g. Massatti & Knowles 2014). Understanding
only do contemporary factors (i.e. geographic distance               the relative roles of these factors is critical as unrecog-
                                                                     nized historical patterns may potentially mislead analy-
Correspondence: Hayley Lanier, Fax: +1 307 268 2416;                 ses of population connectivity (He et al. 2013) and
E-mail: hlanier@uwyo.edu                                             divergent histories among populations may impact the

                                                                                                      © 2015 John Wiley & Sons Ltd
G L A C I A T I O N S I G N A T U R E S O N G E N O M I C V A R I A T I O N 3689 potential for similar evolutionary responses to environ- dispersed secondarily to higher latitudes from lower mental change (Palumbi et al. 2014). This is especially North American latitudes (Galbreath & Hoberg 2012). true in species with limited vagility (Franken & Hik Fossil (Guthrie 1973; Harrington 2011) and molecular 2004; Zgurski & Hik 2012), strong territoriality (Franken evidence (Lanier & Olson 2013) indicate that small-bod- 2002) or narrow habitat requirements (Horn 2013). For ied pikas (similar to either O. collaris or O. princeps) climate-sensitive species such as pikas (Smith et al. were present in parts of Beringia during most of the 2004), understanding the joint influence of present envi- Pleistocene; however, the location of refugial popula- ronmental factors and historical population connectivity tions is not well understood (Lanier et al. 2015). (i.e. over evolutionary timescales) on genetic composi- Studies of historical biogeography of Collared Pikas tion is not only important, but absolutely pressing for have concluded that population differentiation has been population management decisions (USFWS 2010; COSE- in part driven by Pleistocene population distributions WIC 2011). (Lanier & Olson 2013). Two mitochondrial lineages are Pikas (Mammalia: Lagomorpha; Ochotonidae) are present, corresponding to inferred western (Beringian) small (~150 g), alpine-associated herbivores found in and eastern Pleistocene refugia (Lanier & Olson 2013). mountainous regions of western North America and Studies of mountain goats (Shafer et al. 2011) and alpine Asia (Smith 2008). Like their closest living relatives – plants (Marr et al. 2008) suggest that northern British rabbits and hares – pikas do not hibernate and instead Columbia may be a hot spot of genetic diversity due to spend much of their summer months collecting and the presence of nunataks (isolated rock peaks sur- caching food to survive the winter (Broadbooks 1965). rounded by glaciers or ice sheets; Pielou 1991) that Unlike rabbits, pikas are particularly sensitive to warm served as refugia. However, the limited resolution affor- temperatures; the American Pika (Ochotona princeps) ded by mtDNA has hindered efforts to identify the ref- cannot survive for more than 2 h at ambient tempera- ugial locations for Collared Pikas (Lanier & Olson tures above 28 °C (82.4 °F) before succumbing to hyper- 2013). If nunatak refugia were important in shaping thermia and death (MacArthur & Wang 1973). This contemporary genetic diversity, we expect to observe sensitivity and their association with fragmented habi- multiple source populations (i.e. refugia) and small tats such as alpine talus slopes and boulder fields are ancestral population sizes in genomic data. Further- thought to have contributed to ongoing local extirpation more, genomic diversity should be the highest in in multiple pika species and have led to their consider- regions where historically separated lineages intersect ation as a sentinel species for climate change (Smith (Petit et al. 2003), such as Wrangell-St. Elias National et al. 2004). However, much of our current understand- Park (as indicated from mtDNA; Lanier et al. 2015). ing of pika response to warming is based on either Ecologically, much is known about the American Pika highly localized studies (e.g. Morrison & Hik 2007) or but far less is known about the Collared Pika, particu- those conducted in a questionably representative larly with regard to its response to ongoing climate portion of one species’ range (e.g. Beever et al. 2003). change. This is due in part to the short summer field Furthermore, environmental factors influencing the col- season at higher latitudes and extremely limited road onization process and thus the potential for gene flow access throughout the range of the Collared Pika. Most in pikas remain poorly understood. Because genetic recent research on Collared Pikas has focused on a sin- signals of contemporary connectivity are influenced by gle locality in southwest Yukon Territory (‘Pika Camp’; shared ancestry as well as ongoing gene flow, under- see Morrison & Hik 2007; Horn 2013). Like American standing how contemporary factors shape genetic struc- Pikas, Collared Pikas specialize on alpine talus and ture requires a joint analysis of historical connectivity boulder fields (MacDonald & Jones 1987). During the and current environmental pressures. summer, they rarely forage >10 m into surrounding North America is home to two species of pika, both meadows (McIntire & Hik 2002). Their overwinter sur- occurring in mountainous regions in the western half of vival is dependent on the collection of sufficient forage the continent. Approximately 650 km currently sepa- (Morrison et al. 2009) and enough snowpack to insulate rates the range of Collared Pikas (Ochotona collaris), the talus they inhabit (Morrison & Hik 2007). Collared found in Alaska and northwest Canada, from that of the Pikas are notably poor dispersers (539 m average and American Pikas to the south (COSEWIC 2011). Diver- 1.8 km maximum individual movements, based on gence between these two sister species appears to have genetic evidence; Zgurski & Hik 2014), which should occurred as far back as the Pliocene (~4.6 mya; Lanier & lead to high differentiation among disjunct populations Olson 2009). Although pikas originally evolved in Asia and an erosion of diversity in peripheral populations (Dawson 1967) and migrated into North America (Fig. 1). Thus, the contemporary configuration of popu- through the Bering Land Bridge, strong evidence lations relative to low-elevation barriers would suggest suggests that O. collaris originated from an ancestor that mountain ranges may play an important role in shaping © 2015 John Wiley & Sons Ltd
3690 H . C . L A N I E R E T A L .

                                                                                              Fig. 1 Northern (triangles), southern (cir-
                                                                                              cles) and Pika Camp (star) populations of
                                                                                              Ochotona collaris (see Table 1 for details
                                                                                              about populations) in relation to the
                                                                                              topography of the region.
                                      ge
                      B r o o ks R an                Jawbone Lake

                  Eagle Summit
                                           Crescent Creek

                        Denali Hwy
                                                Rock Lake

        Lake Kenibuna
                                             [          Pika Camp

                                            Allie's Valley
                                    Anchorage

 6089 m                                                      N

   0m                                                                500 kilometers

Table 1 Details for the sampled O. collaris populations, including population name and abbreviation, mountain range, the number of
individuals collected per population, population coordinates (latitude, longitude) and the elevation of the collection site

Population                      Mountain range                   Number of individuals         GIS coordinates             Elevation (m)

Allie’s Valley (AV)             Chugach Mtns                     8                             60.9724,   143.1411         1325
Anchorage (AN)                  Chugach Mtns                     6                             61.4510,   148.4652         1038
Crescent Creek (CC)             Yukon–Tanana Uplands             7                             64.8212,   143.7509         1542
Denali Hwy (DH)                 Alaska Range                     6                             63.0741,   145.6358         1202
Eagle Summit (ES)               Yukon–Tanana Uplands             6                             65.4833,   145.4167         1111
Jawbone Lake (JL)               Mackenzie Mtns                   2                             65.0000,   127.6167          868
Lake Kenibuna (LK)              Alaska Range                     8                             61.1564,   152.8551         1000
Pika Camp (PC)                  Wrangell-St. Elias Mtns          8                             61.2170,   138.2670         1798
Rock Lake (RL)                  Wrangell-St. Elias Mtns          7                             61.7864,   141.2095         1381

phylogeographic structure. In addition, Collared Pika                      within the Collared Pika, (ii) test proposed biogeo-
populations are also known to persist on nunataks                          graphic scenarios and distinguish refugial locations,
(Murray & Murray 1969) and may disperse further                            and (iii) evaluate the degree to which specific contem-
through glacial corridors than in unglaciated areas                        porary factors (habitat continuity and glacial corridors)
(COSEWIC 2011), indicating that glacial corridors may                      affect gene flow. This represents the first RADSeq study
also play an important role in population connectivity.                    in any Alaskan mammal and is thus an important
If genetic diversity is being primarily shaped by con-                     opportunity to evaluate the degree to which earlier
temporary environments, gene flow should be highest                        mtDNA analyses capture relevant phylogeographic pat-
between proximate populations, that is those within the                    terns within a species.
same mountain ranges or connected by glaciers, and
lowest between populations separated by low-elevation
                                                                           Methods
areas with extensive tree and shrub cover.
   To simultaneously and comprehensively evaluate the
                                                                           RAD library preparation and sequence analysis
roles of contemporary and historical environmental fac-
tors, we conducted a restriction site-associated DNA                       Samples of 58 Collared Pikas from nine populations
sequencing (RADSeq) analysis of population structure.                      were collected, and their DNA was extracted as
Our objectives were to: (i) delimit genetic boundaries                     described previously (Lanier & Olson 2013; Table S1,

                                                                                                          © 2015 John Wiley & Sons Ltd
G L A C I A T I O N S I G N A T U R E S O N G E N O M I C V A R I A T I O N 3691
Supporting information). Localities were chosen to been shown to underestimate heterozygotes (Catchen
broadly represent the species’ range (Fig. 1; Table 1). et al. 2013). A catalogue of consensus loci among
Extracted genomic DNA was individually barcoded individuals was constructed with the CSTACKS program
and processed into a reduced-complexity library using from the USTACKS output files, with loci recognized as
a double-digestion restriction-fragment-based procedure homologous across individuals if the distance between
(for details, see Peterson et al. 2012). Briefly, DNA was the consensus sequences (n) was ≤2. Alleles were identi-
double-digested with EcoRI and MseI restriction fied in each individual against this catalogue using the
enzymes, followed by the ligation of Illumina adaptor SSTACKS program.
sequences and unique 10-base-pair barcodes. Ligation Variable RADSeq loci present in all individuals and
products were pooled among samples and size-selected containing only two alleles were exported from the MYSQL
between 350 and 450 base pairs using a Pippin Prep database after excluding two individuals that were miss-
(Sage Science) machine. The targeted-size ligation prod- ing more than 20% of the total loci. This data set, hereaf-
ucts were amplified by iProofTM High-Fidelity DNA ter referred to as the ‘complete data set’ because it
Polymerase (BIO-RAD) with 12 cycles. The library was contains no missing data, was used in all analyses, except
sequenced in one lane on the Illumina HiSeq2000 plat- where noted. Population genetics statistics, including
form according to the manufacturer’s instructions to observed heterozygosity (Hobs), nucleotide diversity (p)
generate paired-end 100-base-pair reads. Sequences and Wright’s F-statistic (FIS), were calculated using the
were demultiplexed, and reads with an average Phred POPULATIONS program in the STACKS pipeline (Catchen et al.
score of at least 30 and an unambiguous barcode and 2013). For biallelic RADSeq loci, p is a measure of
restriction cut site were retained (raw genomic data expected heterozygosity and is therefore a useful mea-
available on Dryad: doi:10.5061/dryad.jh2fp). Only the sure of genetic diversity of populations. Furthermore, FIS
first read was maintained due to the need for unlinked measures the reduction in observed heterozygosity as
single nucleotide polymorphisms (SNPs) in our analyses. compared to expected heterozygosity for an allele in a
Reads showed consistently high sequence quality (Fig. population, where positive values indicate nonrandom
S1, Supporting information) and remained untrimmed, mating or cryptic population structure (Nei & Kumar
except for the barcode and restriction enzyme cut site. 2000; Hartl & Clark 2006; Holsinger & Weir 2009). Pair-
Single nucleotide polymorphisms were called from wise FST values were calculated among populations in
RADSeq loci (i.e. contigs assembled from overlapping ARLEQUIN 3.5 (Excoffier & Lischer 2010), and significance
sets of homologous fragments), and genotypes were (P < 0.05) was determined using 1000 permutations.
assigned using a maximum-likelihood statistical model
(Catchen et al. 2011; Hohenlohe et al. 2012) with the
Characterization of population genetic structure
STACKS v1.03 pipeline (Catchen et al. 2013); default set-
tings were used except where noted below. Specifically, Population genetic structure was characterized using
loci and polymorphic nucleotide sites were identified in STRUCTURE 2.3.4 (Pritchard et al. 2000) with K-values
each individual using the USTACKS program, which ranging from 1 to 11 (two more than the total number
groups reads with a minimum coverage depth (m = 3) of populations). Given the low divergence exhibited in
into a ‘stack’; increasing the minimum depth generally this data set and the importance of a full site-frequency
helps to avoid erroneously assigning sequencing errors spectrum for downstream uses (described below), loci
as SNPs (Catchen et al. 2013). Reads were filtered using were not filtered based on minimum allele frequency.
a removal algorithm that eliminated highly repetitive We filtered out linked SNPs from the complete data set
stacks (i.e. stacks that exceed the expected number of using the –write_single_snp option in POPULATIONS. In
reads for a single locus given the average depth of cov- addition, we analysed the data set excluding the highly
erage, for example, when loci are members of multigene divergent Pika Camp population (see Results), which
families) and a ‘deleveraging algorithm’ to resolve over- could potentially obscure genetic composition of the
merged loci (i.e. nonhomologous loci misidentified as a remaining populations (see Ryan et al. 2007; Massatti &
single locus). SNPs were identified at each locus and Knowles 2014). Ten independent runs per K were con-
genotypes were called using a multinomial-based ducted, each with 100 000 burn-in and 200 000 MCMC
likelihood model that accounts for sequencing error iterations, using the ‘admixture model’ and the ‘corre-
(Hohenlohe et al. 2010; Catchen et al. 2011; Catchen lated allele frequency model’ with default settings.
et al. 2013), with the upper bound of the error rate (e) Results based on more burn-in or MCMC iterations
set to 0.1. A conservative upper bound was selected for were not different (data not shown). STRUCTURE HARVESTER
e, as these models have been developed primarily for (Earl & vonHoldt 2012) and DISTRUCT (Rosenberg 2004)
higher-coverage data; a conservative bound was pre- were used to visualize results, and the most probable K
ferred over the unbounded model because the latter has was chosen based on DK (Evanno et al. 2005).
© 2015 John Wiley & Sons Ltd3692 H . C . L A N I E R E T A L .
To visualize the major axes of population genetic of isolation by distance (i.e. tests of the effect of geogra-
variation, a principal components analysis (PCA) was phy alone on patterns of genetic differentiation) used a
performed on the complete data set without linked map with equal per-cell conductance values among
SNPs (the same as in the STRUCTURE analysis) using the sampling populations. For tests of the impact of glaciers
‘adegenet’ package (Jombart 2008) in R (R Core Team on patterns of genetic differentiation among popula-
2012). Major axes for genomewide SNP data were tions, areas covered by glaciers were coded to have
identified using the R ‘dudi.pca’ function. PCA is free either twice or half of the conductance value as cells in
from many of the population genetics assumptions nonglaciated areas to test the respective hypotheses that
underlying STRUCTURE (Gao et al. 2007; Jombart et al. glaciers facilitated (i.e. high conductance) or inhibited
2009) and can be more useful with continuous patterns (i.e. low conductance) pika dispersal. Two resistance
of differentiation (e.g. isolation by distance – IBD; matrices among populations were also generated based
Engelhardt & Stephens 2010) than STRUCTURE. The first on the ENMs for the present and the LGM to investigate
two PCA eigenvectors and the sample locations the impact of current and past environmental factors on
(latitude and longitude) were also used in a Procrustes patterns of genetic differentiation, respectively, where
analysis with the ‘vegan’ package (Oksanen et al. 2013) the cell-specific habitat suitability scores were translated
in R. This analysis is especially useful for quantifying into cell-specific conductance values.
the correlation between genetic variation and geography
(see Wang et al. 2014). Specifically, the Procrustes analy-
Estimation of demographic history
sis superimposes the PCA plot of genetic variation on
the geographic map, rotating the PC axes to achieve To better understand the historical demographic trends
maximum similarity to the geographic distribution of for pika populations, we estimated divergence time,
sampled locations (i.e. the sum of squared differences gene flow and population size changes among different
between the two data sets are minimized); significance populations using the site-frequency spectrum (SFS).
of the association was evaluated based on 10 000 Populations were grouped into three clusters based on
permutations. the PCA, Procrustes and population tree analyses to
To examine the patterns of population relationships, capture the main characteristics in the population histo-
a maximum-likelihood phylogeny was estimated from ries: northern group (Jawbone Lake, Eagle Summit,
unlinked SNPs with a general time-reversible (GTR) + Γ Crescent Creek), southern group (Denali Hwy, Allie’s
substitution model using PHYML 3.0 (Guindon et al. Valley, Anchorage, Lake Kenibuna, Rock Lake) and Pika
2010). This algorithm is able to estimate phylogenies Camp. The data set used for this analysis was generated
using standard IUPAC coding for polymorphic nucleo- by exporting all RADSeq loci from the MySQL database
tide sites, allowing us to include all unlinked RADSeq containing two alleles (39 797 RADSeq loci). Further-
loci within our concatenated data set; a PHYLIP file more, we selected only one SNP per RADSeq locus, and
was generated by the POPULATIONS program in STACKS it had to be present in at least 80% of the individuals in
using the –phylip_var setting and a white list contain- each cluster (i.e. northern, southern, or Pika Camp); the
ing the loci names included in the complete data set. final SFS contained 10 892 variable SNPs. The sample
Nodal support was estimated from 1000 bootstrap repli- sizes of gene copies for the northern, southern and Pika
cates. The Pika Camp population was used as an out- Camp clusters are 24, 56 and 8, respectively. Because we
group, based on PCA and STRUCTURE results. did not include invariable sites in the SFS, we fixed the
parameter for ancestral pika population size (Nanc;
Fig. 2) to be 114 000 to enable the estimation of other
Patterns of population isolation
parameters in FASTSIMCOAL2 (see Excoffier et al. 2013; see
A series of Mantel and partial Mantel tests were used to Table S2, Supporting information for simulation details).
test for associations between genetic distance and the The population tree recovered a shared common ances-
geographic distance separating populations, as well as tor between the northern and southern groups relative
associations between genetic distance and environmen- to Pika Camp. Population sizes were allowed to vary,
tal resistance, where an environmental factor mediates and gene flow was permitted between the three popula-
the degree of isolation among populations. For tests of tion lineages during recent expansions (Fig. 2). Fifty
isolation by resistance (IBR; McRae 2006), a resistance independent parameter estimations were performed in
matrix based on raster maps of per-cell conductance val- FASTSIMCOAL2 to achieve the maximum composite likeli-
ues was generated among populations using CIRCUITSCAPE hood of the joint SFS, in which parameterized simula-
v3.5.8 (Shah 2007), where cells with high conductance tions were sampled from priors and the parameter
values represent regions of probable migration relative estimation was optimized through 40 cycles of a condi-
to cells with low conductance values. Specifically, tests tional maximization algorithm (ECM). Divergence time
© 2015 John Wiley & Sons LtdG L A C I A T I O N S I G N A T U R E S O N G E N O M I C V A R I A T I O N 3693
tions into novel climates (reviewed in Alvarado-Serrano
Nanc & Knowles 2013), an iterative approach was used to
generate ENMs for the LGM. Specifically, multivariate
T pns environmental similarity surfaces (MESS maps) were
used to identify bioclimatic variables that result in areas
Ncomb of low reliability due to predicted values that are out-
Np_anc side of the range of present-day environmental values
T ns (Elith et al. 2010). MAXENT was rerun excluding these
out-of-range variables, and this process of analysis with
Ns_anc Nn_anc MESS maps was repeated until no LGM variables were
T exp
out of range compared to present-day bioclimatic vari-
mps mns ables. Because MESS maps do not indicate changes in
Np_cur Ns_cur Nn_cur
the correlations among the environmental variables
mps mns
used for LGM reconstructions (Elith et al. 2010), we
Fig. 2 Hypothesized demographic history of pika populations checked our ENM for the LGM using only the most
used in FASTSIMCOAL2 analyses. Pika ancestors diverged (Tpns informative variable (Bio10) to ensure that we were not
generations ago) into ancestral populations of Pika Camp reporting errant distributional patterns. In addition, a
(Np_anc) and the other populations (Nns). Later, the divergence present-day ENM was generated using the subset of
into southern (Ns_anc) and northern refugia (Nn_anc) occurred, variables that were not out of range during the LGM
and populations experienced recent expansions and exchanged
and compared to a ENM constructed using all climatic
migrants. The estimates of these parameters are listed in
variables with >5% importance (determined by jackknif-
Table 4.
ing) to assess their similarity.
Because underlying genetic similarity may be driven
estimates depend on the genomic mutation rate esti- by habitat similarity, we examined environmental gra-
mate, which is also associated with some uncertainty. dients in the 19 present-day bioclimatic variables. These
The point estimates were selected from the run with the variables were reduced by PCA to 19 orthogonal axes
highest maximum composite likelihood. Confidence using the ‘Principal Components’ tool in the Spatial
intervals of parameter estimates were obtained by 100 Analyst package of ARCGIS 10.3 (ESRI), to examine
parametric bootstrapping runs from simulated SFS of gradients that might influence patterns of population
the point estimates (see doi:10.5061/dryad.jh2fp in connectedness and/or genetic differentiation. The PC
Dryad for specific settings). values were extracted for each O. collaris sampling
point used in MAXENT with the ‘Extract Multi Values to
Points’ tool in the Spatial Analyst package. Informative
Environmental niche modelling
PC axes were graphed using R (R Core Team 2012)
Environmental niche models (ENMs) of O. collaris were and contrasted with the relative configuration of
generated from bioclimatic variables for the present and sampled populations in environmental and genetic
the Last Glacial Maximum (LGM; 21 kya) with MAXENT space.
v3.3.3e (Phillips et al. 2006) using the following parame-
ters: regularization multiplier = 1; max number of back-
Results
ground points = 10 000; replicates = 50; and replicated
run type = cross-validate. Georeferenced distribution
Sequence data quality and processing
points (161 distinct localities) from vetted occurrence
data used in the modelling were representative of the More than 169 million reads were produced from one
entire range of O. collaris (Dryad doi:10.5061/ lane of Illumina sequencing for 58 O. collaris individuals
dryad.jh2fp). (average of 3 035 160 1 271 412 per individual;
We used 19 bioclimatically informative variables to Table 2 and Fig. S2, Supporting information). After
model present-day distributions (WORLDCLIM v1.4; excluding two individuals containing prohibitively high
Hijmans et al. 2005) and LGM distributions (PMIP2- missing data (>20% of the loci; raw, filtered and analy-
CCSM; Braconnot et al. 2007). To avoid overfitting of sed reads shown in Table S1, Supporting information),
the distribution models, the geographic extent of the we identified 513 443 RADSeq loci containing 89 167
environmental layers was reduced to an area approxi- SNPs. Subsequently, we identified 4156 RADSeq loci
mately 20% larger than the known distribution of the containing at least one biallelic SNP and that were pres-
species (Anderson & Raza 2010). To guard against the ent across all individuals (in contrast to other RADSeq
inherent difficulties involved in extrapolating distribu- data sets; see Wagner et al. 2013; Massatti & Knowles
© 2015 John Wiley & Sons Ltd3694 H . C . L A N I E R E T A L .
Table 2 Population summary statistics calculated for the 4156 RADSeq loci. Included are the average number of individuals geno-
typed at each locus (N), the proportion of SNPs unique to each population (% private), the percentage of SNPs (% polymorphic) in
each population, the average nucleotide diversity (p), the average observed heterozygosity per locus (Hobs) and the Wright’s inbreed-
ing coefficient (FIS). The total number of DNA sites (polymorphic + invariable) in the RADSeq loci is 375 480
N % private % polymorphic p Hobs FIS
Allie’s Valley 8 8.8 0.26 0.00073 0.00072 0.00004
Anchorage 6 6.1 0.15 0.00048 0.00043 0.00013
Crescent Creek 7 11.9 0.29 0.00087 0.00090 0.00006
Denali Highway 6 7.1 0.21 0.00073 0.00067 0.00012
Eagle Summit 6 4.3 0.15 0.00059 0.00064 0.00012
Jawbone Lake 2 3.4 0.10 0.00055 0.00055 0.00000
Lake Kenibuna 8 5.6 0.10 0.00032 0.00037 0.00010
Pika Camp 6 12.6 0.21 0.00061 0.00064 0.00005
Rock Lake 7 8.0 0.33 0.00104 0.00105 0.00004
Glaciated
0.10 – 0.20 0.10 – 0.19
0.20 – 0.29 0.19 – 0.29
0.29 – 0.39 0.29 – 0.38
0.39 – 0.49 0.38 – 0.48
0.49 – 0.59 0.48 – 0.57
0.59 – 0.69 0.57 – 0.67
0.69 – 0.78 0.67 – 0.76
0.78 – 0.88 0.76 – 0.86
0.88 – 0.98 0.86 – 0.95
Habitat suitability Habitat suitability
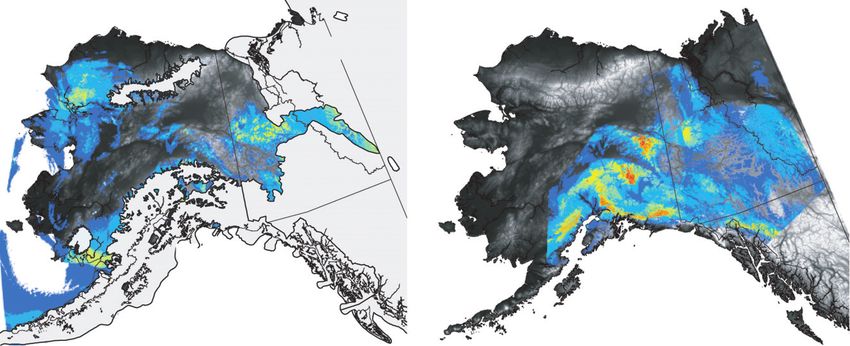
Fig. 3 Habitat suitability predicted by the ENMs for the LGM (on the left) and the present (on the right) relative to sampled popula-
tions (stars). The glacial extent at the height of the Wisconsin glaciation is shown in light blue, and the colour scale represents habitat
suitability. Note that the glacial reconstruction is based on independent geologic information from glacial moraines.
2014);G L A C I A T I O N S I G N A T U R E S O N G E N O M I C V A R I A T I O N 3695 refugial populations remains unclear. Populations in the in every RADSeq locus comprising the complete data interior (Crescent Creek, Eagle Summit and Jawbone set) as well as other common measures (e.g. observed Lake; Fig. 1) also likely experienced distributional shifts; heterozygosities; Table 2). Although differentiation however, such shifts appear less pronounced, as would among populations was significant, with FST values be predicted given that this region remained relatively ranging from 0.23 to 0.84 (Table S3, Supporting informa- unglaciated. Suitable habitat is projected both along the tion), no significant pattern of isolation by distance was margins of the glaciers and in more ice-free regions in detected (r = 0.4433, P-value = 0.116; Fig. 4). However, the interior (Figs 3 and S4, Supporting information). examination of the isolation-by-distance pattern (i.e. the The sampled Collared Pika populations are geograph- association of geographic distance and FST between pop- ically and environmentally representative of the entire ulation pairs; Fig. 4) shows much higher FST values species – they span the spectrum characterized by the between Pika Camp and other populations. If Pika Camp PCA of environmental characteristics as well as the lati- is excluded, a significant pattern of isolation by distance tudinal and longitudinal extent for all pika populations is observed among the remaining populations throughout their range (Fig. S5, Supporting informa- (r = 0.7278; P-value =
3696 H . C . L A N I E R E T A L .

Table 3 Results of isolation-by-resistance as calculated using         lations (Lake Kenibuna, Anchorage, Denali Hwy, Rock
Mantel and partial Mantel tests (with geography and the gla-           Lake and Allie’s Valley). Patterns of population related-
cier or ENM as covariates) between the pairwise FST values             ness suggest a similar regional structuring (Fig. S7, Sup-
with resistance matrices (i.e. rescaled geographic distances
                                                                       porting information). The northern clade composed of
according to the suitability of habitats) separating populations
(see also Fig. 7). Four resistance matrices are tested: the first is   Eagle Summit, Crescent Creek and Jawbone Lake is sis-
calculated from geography only, the second from glacier influ-         ter to the remaining southern populations, although
ence, the third from current habitat suitability score and the         Rock Lake is not a part of either regional group identi-
last from the past suitability. Correlation coefficients (r) and       fied from the concatenated SNPs (Fig. S7, Supporting
the P-values from 1000 permutation tests are shown, with sig-          information). Rock Lake’s sister relationship to the
nificant results shown in bold. In partial Mantel tests, geogra-       northern and southern clades may be attributable to the
phy is treated as a covariate with other testing predictors. Note
                                                                       inclusion of two individuals with a purportedly mixed
that these results are based on comparisons without Pika
Camp                                                                   ancestry between Pika Camp and the coastal/interior
                                                                       lineage (Fig. 6).
                       Mantel test              Partial Mantel test       The Procrustes analysis identified a significant simi-
                                                                       larity score between the populations in PC space and
                       r             P          r             P        their actual geographic locations (t0 = 0.62; P < 1.0 5).
                                                                       Examination of the rotated genetic coordinates graphi-
Geography              0.7278
G L A C I A T I O N S I G N A T U R E S O N G E N O M I C V A R I A T I O N 3697
1.0
0.8
0.6
Assignment probability
0.4
0.2
0
1.0
0.8
0.6
0.4
0.2
0
Fig. 5 Plots of posterior probabilities for individuals assigned to K genetic clusters from STRUCTURE analyses for K = 2 and K = 4 (each
separate block corresponds to one analysis). Each of the K genetic clusters within a given analysis is shown as a different colour
delimited by a thin black line, with the corresponding population names listed along the bottom of the plot. The regional member-
ship of populations (i.e. mountain ranges) is listed along the topmost analysis of K = 2.
trast, southern populations and Pika Camp appear to with a broad 95% CI on Pika Camp due to the small
have experienced a dramatic (10–409) population sample size.
expansion starting around 36 kya (22–46 kya). Geneflow
estimates were low; the inferred migration rate per gen-
Discussion
eration between the southern populations and Pika
Camp (2.55E-06) was nearly twice that between the Our results indicate that contemporary factors alone
northern and southern populations (1.44E-06). Estimates (i.e. current habitat continuity and glacial corridors) are
of current population sizes were larger in southern pop- not sufficient to explain connectivity among populations
ulations than in the northern populations, although of Collared Pikas across their range. Instead, the results
© 2015 John Wiley & Sons Ltd3698 H . C . L A N I E R E T A L .
Table 4 Inferred parameters and their confidence intervals
50 Allie's Valley
(95%) under the demographic model illustrated in Fig. 2. Note
Anchorage
that estimates of time are shown in units of generations, with a
Crescent Creek
generation time of 2 years (Table S2, Supporting information)
Denali Hwy
30 Eagle Summit
Parameters Point estimates Lower bound Upper bound
Jawbone Lake
Lake Kenibuna
Ns_cur 298 059 227 406 462 018
Pika Camp
Nn_cur 167 623 117 761 278 937
PC2
Rock Lake
10 Np_cur 736 419 528 636 1 105 579
Ns_anc 28 425 36 884 62 470
Nn_anc 285 409 139 884 508 318
Np_anc 18 896 16 476 37 899
–10 Ncomb 45 186 41 898 112 117
Mns 1.44E-06 6.278E-07 1.92E-06
Mps 2.55E-06 1.89E-06 4.07E-06
Texp 18 276 11 178 23 114
–30 Tns 26 674 19 581 37 285
Tpns 72 822 62 950 161 261
–100 –60 –20 20
PC1
Fig. 6 Distribution of individuals along PC1 and PC2 axes of provide strong support for the predominance of three
genetic variation based on the analysis of 4000 unlinked SNPs; divergent lineages, likely separated in different Pleisto-
individuals are colour-coded according to their population cene refugia, with population expansion among lineages
identities. PC1 and PC2 explained 15.4% and 5.6% of the varia- predating the Last Glacial Maximum. These three sepa-
tion among individuals, respectively.
rate lineages (one northern and two southern) corre-
spond to the major genetic boundaries observed within
72.51
contemporary populations. The populations in our
study are similar with respect to generally low genomic
variation within populations and little-to-no contempo-
rary gene flow between populations. These results
support a growing biogeographic paradigm of Pleisto-
ES CC JL cene substructure in eastern Beringia (Shafer et al. 2010;
Lanier et al. 2015), with implications for population
Latitude
DH
62.51
RL
management as well as future studies of adaptation and
AN
PC climate change.
LK AV
Pleistocene fragmentation and genetic structure
Genomic data strongly suggest that Collared Pika popu-
lations originated from three divergent ancestral
52.51
sources, representing northern, eastern and coastal/cen-
tral (hereafter southern) refugia, which were sundered
–154.37 –144.37 –134.37 –124.37 well before the LGM. These data, as well as the pro-
Longitude jected habitat at the LGM, suggest multiple potential
Fig. 7 Procrustes-transformed PCA plot of genetic variation
allopatric refugia as well as several important patterns.
with each individual mapped in PC space (the small black cir- First and foremost, the genetic distinctiveness of the
cles) relative to the geographic location of populations (shown southeast Pika Camp population most likely represents
by the larger, coloured circles). Dashed lines show the orienta- an isolated ancestral source, which shared ancestry with
tion of PC1 (oriented NW-SE) and PC2 (oriented NE-SW) for other Collared Pika populations during the last intergla-
the genetic data (explaining 15.4% and 5.6% of the genetic vari- cial (~148 kya [126–323 kya]; Table 4). Second, the pop-
ation, respectively) relative to the geographic longitude and lat-
ulation tree, PCA and STRUCTURE analyses all suggest
itudinal axes (the x and y axes). The length of the line
connecting individuals in PC space to their geographic location
that the remaining populations were colonized from
represents the extent of the deviation from the expected pat- northern and southern lineages that diverged well
tern of genetic variation based on geography. Population before the LGM (~52 kya [39–75 kya]; interstadial mar-
abbreviations are shown in Table 1. ine isotope stage 3). Third, the southern and Pika Camp
© 2015 John Wiley & Sons LtdG L A C I A T I O N S I G N A T U R E S O N G E N O M I C V A R I A T I O N 3699
lineages have undergone population expansions, Franken 2002), as well as inferred boundaries in the
whereas the northern lineage has remained relatively present created by unsuitable habitat (e.g. Fig. 3), indi-
stable over the same period (Table 4). This work pro- cates that the pattern of shared ancestry among distant
vides additional evidence that the pattern of southern northern populations is not the result of ongoing gene
stability and northern expansion described for many flow, but instead is a signature of shared ancestry. Any
taxa (Hewitt 2004) may be insufficient to describe local- past connectivity among these populations is likely also
ized range expansions at higher latitudes. being eroded due to recent and ongoing tree and shrub
Several lines of evidence indicate that colonization encroachment into arctic and subarctic regions (Sturm
from a single ancestral source in the recent past is unli- et al. 2001).
kely. For example, the lack of a significant pattern of
isolation-by-distance (Fig. 4), unless the Pika Camp
Geographic locality of refugial source populations
population is excluded, and the absence of a latitudinal
pattern of genetic diversity (levels of diversity are fairly Collectively, these results suggest relative, but not exact,
comparable across populations; Table 2) would be locations for three refugial populations. Northern popu-
expected under a single refugium hypothesis but are lations of Crescent Creek, Eagle Summit and Jawbone
not supported by the data. Furthermore, the most Lake probably originated from a geographically proxi-
likely number of genetic clusters from the STRUCTURE mate source as opposed to a distant northern refuge in
analyses does not correspond to the number of sampled the Brooks Range. Despite apparently suitable habitat in
populations (Fig. 5), suggesting that population-specific the western Brooks Range during the LGM (Fig. 3; La-
demographic events, such as strong bottlenecks associ- nier & Olson 2013 – Fig. 6), the lack of present-day pop-
ated with population colonization, do not dominate or ulations in this region (despite focused survey efforts
override the signal associated with regional differentia- by LEO and colleagues) and the relationship between
tion. If the signal of shared ancestry was completely geography and genetic differentiation (Fig. 7) suggest
overridden by demographic factors (e.g. genetic drift) that this was an unlikely ancestral source for any of the
associated with colonization, K = 9 would be the most populations in our study. A proximate refugium is also
probable STRUCTURE result. Additionally, demographic indicated by the fact that Eagle Summit and Crescent
simulations suggest smaller, isolated source populations Creek populations are only slightly more divergent than
with subsequent population expansions, not the recent expected based on geography alone, and Jawbone Lake
separation and population contraction that would be is much less divergent than would be expected based
expected if a single large population was fragmented on geographic distance (Fig. 7). This suggests that the
during post-Pleistocene warming. refugial source for the northern populations may have
These results also highlight the important roles of been closer to Eagle Summit and Crescent Creek than
habitat stability and turnover during the Pleistocene. the current Jawbone Lake site. Pleistocene fossil pikas
Based the ENMs (Fig. 3), habitat in the northern have been reported from northeast and southwest of
periphery of the Collared Pika’s range (including Eagle Eagle Summit/Crescent Creek sites (Guthrie 1973;
Summit, Crescent Creek and Jawbone Lake popula- Harrington 2011), areas with higher predicted habitat
tions) appears to have remained relatively constant, suitability at the LGM (Fig. 3). Estimated population
whereas southern and Pika Camp populations under- sizes for the northern lineage have remained fairly
went broad expansion and commensurate population constant (and generally high) since ~52 kya, as would
growth. While the prediction of northern stability dif- be expected if the lineage underwent little Pleistocene
fers from previous ENM reconstructions (Lanier & Ol- movement. Further tests of population movements
son 2013), it is consistent with genetic data based on the (e.g. He et al. 2013) may help distinguish probable ref-
level of differentiation relative to the other populations ugial locations and colonization routes for these
(Fig. 7). Given this support and the fact that the ENMs regions.
presented herein exclude out-of-range climate variables While an eastern refugium is clearly indicated by our
– a preferred approach for extrapolating distributions data, its exact location is difficult to determine from our
into novel climates (Alvarado-Serrano & Knowles 2013) data (see also Lanier & Olson 2013). Pika Camp individ-
– these reconstructions are likely a more accurate repre- uals are genetically distinct from geographically proxi-
sentation of historical distributions. Furthermore, the mate populations (Fig. 5), but with only one location
ancestral and current population estimates (Table 4) represented in our data set, there are no comparative
provide additional support for long-term stability of Procrustes deformations for this lineage. Reconstruc-
northern populations, with demographic estimates that tions of glacial margins indicate that this site (Fig. 3)
remain constant (or decline slightly) from the LGM to was probably ice free during the LGM, although much
the present. High philopatry in Collared Pikas (e.g. of the surrounding habitat was not; thus, populations
© 2015 John Wiley & Sons Ltd3700 H . C . L A N I E R E T A L .
may have persisted in situ and expanded to fill avail- Valley are differentiated from the other coastal popula-
able habitat as it became available. An alternative possi- tions along PC2; Fig. S5, Supporting information).
bility is suggested by the sub-Laurentide origin of
Collared Pikas, which diverged from American Pikas
Relevance of this work to eastern Beringian
during the Pliocene (Lanier & Olson 2009; Galbreath &
phylogeography
Hoberg 2012). Simulations indicate that the Pika Camp
lineage diverged from the other two lineages around As the first genomic study to evaluate phylogeographic
148 kya (marine isotope stage 6), predating both the patterns in an Alaskan mammal, our results are partic-
Wisconsin glaciation and the last interglacial. Based on ularly revealing with regard to the degree of nuance
the timing, a population of Collared Pikas could have that such data sets can provide to existing regional
been isolated within or south of the ice sheet and studies. Previous research employing mitochondrial
undergone northward migration during an interstadial. DNA (Lanier & Olson 2013) identified two haplo-
However, estimates suggest population expansion groups in Collared Pikas: an Eastern haplogroup occur-
around 36 kya (22–46 kya) (Table 4), well before the ring in populations from Pika Camp, Rock Lake and
most recent opening of the ice-free corridor between the the surrounding populations; and a Beringian haplo-
Laurentide and Cordilleran ice sheets at 15 kya (Dixon group, which encompasses populations from the rest
2013). In either model, eastern populations may have of the range (from Lake Kenibuna to Allie’s Valley,
occupied nunatak refugia or ice sheets margins, as has north through Eagle Summit and Jawbone Lake). The
been suggested for Mountain Goats (Nagorsen & Ked- geographic location of this suture zone differed slightly
die 2000; Shafer et al. 2011) and alpine plants (Marr based on marker type, with some Allie’s Valley indi-
et al. 2008), but multiple nunatak microrefugia are not viduals carrying mtDNA haplotypes from the Eastern
suggested by our data. As Collared Pika populations lineage (Lanier & Olson 2013) on a mostly Beringian
from the Coast Mountains belong to the same mtDNA genomic background (Fig. 5). Given that dispersal is
haplogroup as those in Pika Camp, additional fresh tis- not sex-biased in Collared Pikas (Zgurski & Hik 2012),
sues from these sites could provide further resolution this may indicate a moving contact zone among lin-
on refugial locations for the lineage. eages (Toews & Brelsford 2012). This further under-
The joint consideration of the geographic distribution scores the importance of combining genomic data sets
of populations and the patterns of genetic variation with analytical approaches that can harness their
among populations provides an opportunity to hypoth- power in revealing phylogeographic patterns across
esize about the potential location of a southern refu- species.
gium from which the remaining coastal/central Our results also add to a growing body of regional
populations were colonized. During the LGM, ice sheets phylogeographic work that reveals regional complexity
covered most of the current population locations, leav- and shared geographic barriers within the Beringian
ing diffusely distributed suitable habitat. Because the refugium. For example, the deep split between Pika
ENMs do not identify a particular circumscribed area Camp and the other lineages mirrors the Beringian–East-
with high suitability values, the geographic location of ern (B-E) split in mtDNA evident across multiple species
a southern refugium is difficult to predict from these of codistributed mammals, including Singing Voles (We-
results (Fig. 3). However, the Procrustes shifts suggest ksler et al. 2010), Nearctic Brown Lemmings (Fedorov
that populations from this lineage likely had a central et al. 2003) and Hoary Marmots (Lanier et al. 2015). It
location (Fig. 7). Lake Kenibuna, Anchorage and Allie’s has been suggested that B-E divisions in these species
Valley are genetically closer to one another than could be the result of isolation into two refugia (Fedorov
expected based on geography alone (Fig. 7). Both the et al. 2003; Weksler et al. 2010), one located in central
Lake Kenibuna and Anchorage populations exhibit Beringia, and one located either along the northern mar-
genetic patterns consistent with an ancestral population gin between ice sheets or south of the ice sheets (Lanier
at the Denali Highway longitude, as do the more east- et al. 2015), possibly corresponding to the northern Brit-
ern Allie’s Valley and Rock Lake populations. Results ish Columbia hot spot identified in previous work (Marr
also indicate that long-term survival in nunataks is unli- et al. 2008; Shafer et al. 2011). The third divergence
kely, as localized nunatak refugia would result in a between northern and southern Collared Pika lineages
stronger correlation of geography and populations in revealed in genomic data, in addition to the deeper
PC space. Although we cannot rule out the possibility divergence between Pika Camp and the other popula-
of two central refugia, where only one contributed to tions, provides further evidence of regional substruc-
Rock Lake and Allie’s Valley (see Fig. 5), it is also pos- ture. These results are similar to the roughly sympatric
sible that population differentiation is indicative of Arctic Ground Squirrel, which includes four distinct lin-
environmental differences (i.e. Rock Lake and Allie’s eages (Galbreath et al. 2011), three of which appear to
© 2015 John Wiley & Sons LtdG L A C I A T I O N S I G N A T U R E S O N G E N O M I C V A R I A T I O N 3701
have originated in central or eastern Beringia. Although migrant alleles within a population, so multiple lines of
previous studies have suggested that the coastal ice genomic evidence provide important support of past
shield and Yukon River Delta may underlie these breaks connectivity among sites.
(see review in Shafer et al. 2010), neither of these puta-
tive barriers appears to correspond with observed diver-
Importance of environmental factors
sity in Collared Pikas, suggesting that ecological barriers
may be driving the observed patterns. Likewise, the esti- Although there appears to be some a correspondence
mated timing of these divergences between lineages between regional environmental differences and popu-
(148 and 52 kya) and the inferred population expansion lation relatedness, this relationship may be more indica-
indicates that the glacial contraction/postglacial expan- tive of geographic proximity and common ancestry
sion paradigm (Hewitt 2004) may be overly simplistic than environmental gradients. Although the northern
for Beringian taxa. Instead, regional diversity appears to populations in the interior cluster together in both envi-
be shaped by older historical fragmentation, similar to ronmental and genetic space, the environmental vari-
Arctic Ground Squirrels (Galbreath et al. 2011) and Sing- ables included in our models were not good predictors
ing Voles (Weksler et al. 2010), patterns that would have of population relationships overall. For example, the
been impossible to discern from mtDNA alone. populations originating from the southern refugium (i.e.
Denali Highway, Lake Kenibuna, Anchorage and Allie’s
Valley) share common ancestry but are characterized by
Genomic variation and gene flow
fairly different climates (Fig. S5, Supporting informa-
Across the range of Collared Pikas, genomic data reveal tion). Likewise, Rock Lake, which shares alleles with
significant differentiation among populations, but gen- both Allie’s Valley and Pika Camp, is geographically,
erally low variation within populations (Table 2; Fig. 6). but not climatically, intermediate (Figs 1 and S5, Sup-
This is likely the result of habitat specialization and lim- porting information). Thus, the environmental and
ited dispersal among alpine-associated populations, genetic similarities among northern populations may be
which will decrease genomic similarities (e.g. Ferchaud driven by shared history across a similar habitat rather
et al. 2010). Both North American pika species are nota- than contemporary environmental gradients.
bly poor dispersers (most individuals disperse3702 H . C . L A N I E R E T A L .
dispersal is limited by landscape features such as topo- ulations will respond in a similar manner. Divergent
graphic relief (e.g. cliffs), water and, to a lesser extent, histories (Galbreath et al. 2009) may explain why Amer-
west-facing slopes (Castillo et al. 2014). Whether these ican Pikas appear to be responding idiosyncratically to
features represent important barriers to dispersal in environmental conditions and/or warming across their
Collared Pikas at the local scale remains unknown. range (e.g. Simpson 2009; Millar & Westfall 2010; Rod-
house et al. 2010; Jeffress et al. 2013). If we are to fully
understand the potential for populations to adapt
Relevance to adaptation and climate change
locally to warming temperatures, we must specifically
One of the most pressing and important aspects this assess and accurately account for the role of historical
work suggests is the incorporation of population history associations shaping variation and shared alleles among
into studies of the effects of ongoing climate change. As populations, as well as current population connectivity.
temperature-sensitive alpine specialists, pikas may be
particularly sensitive to climate change (Smith et al.
2004). These threats may be amplified in Collared Pikas, Acknowledgements
which have been shown to harbour less genetic varia- This work was funded by NSF (DEB 1118815 to LLK, DDIG
tion and possibly less adaptive potential than their DEB 0808619 to LEO and HCL) and the Alaska Department of
more southerly congeners (Lanier & Olson 2013). From Fish and Game (State Wildlife Grant T-1-6 to LEO). In addi-
a management perspective, identifying discrete histori- tion, we thank B. Jacobsen and A. Gunderson, for access to
samples at the University of Alaska Museum, and D. Hik and
cal genetic breaks that may lead to significantly genetic
J. Zgurski for providing samples of DNA from Pika Camp.
differentiation among populations (i.e. due to different Finally, we are extremely grateful to the 18 collectors (not
refugial origins), and possibly differential adaptive including the authors) without whose arduous efforts to
potential, is important. Recent species status updates in responsibly collect and prepare voucher specimens this study
Canada classified Collared Pikas as a species of ‘special would not have been possible.
concern’ but noted that no designatable units had been
identified within the species (COSEWIC 2011). Our
References
results indicate three different, historically derived
genetic lineages that should be considered in future Alvarado-Serrano DF, Knowles LL (2013) Ecological niche
management strategies and ecological studies. In partic- models in phylogeographic studies: applications, advances
and precautions. Molecular Ecology Resources, 14, 233–248.
ular, targeting future studies at populations within each
Anderson RP, Raza A (2010) The effect of the extent of the
of these distinct lineages will provide greater resolution
study region on GIS models of species geographic distribu-
of environmental interactions as well as a stronger tions and estimates of niche evolution: preliminary tests with
broad-scale understanding of how the species as a montane rodents (genus Nephelomys) in Venezuela. Journal of
whole is responding to changing climates. Biogeography, 37, 1378–1393.
Multiple documented extirpations of American Pikas Beever EA, Brussard PE, Berger J (2003) Patterns of apparent
in the Great Basin underscore the concern that climate extirpation among isolated populations of pikas (Ochotona
princeps) in the Great Basin. Journal of Mammalogy, 84, 37–54.
change may force one or both North American species
Braconnot P, Otto-Bliesner B, Harrison S et al. (2007) Results of
to extinction (Beever et al. 2003; Smith et al. 2004). How-
PMIP2 coupled simulations of the Mid-Holocene and Last
ever, the clearly divergent and disparate histories exhib- Glacial Maximum-Part 1: experiments and large-scale fea-
ited by the extant populations sampled here suggest tures. Climate of the Past, 3, 261–277.
that we cannot simply assume populations represent Broadbooks HE (1965) Ecology and distribution of the pikas of
interchangeable units that will respond in the same Washington and Alaska. American Midland Naturalist, 73, 299–335.
fashion to ongoing change (Palumbi et al. 2014). In the Castillo JA, Epps CW, Davis AR, Cushman SA (2014) Land-
scape effects on gene flow for a climate-sensitive montane
case of Collared Pikas, nearly all longitudinal research
species, the American pika. Molecular Ecology, 23, 843–856.
(e.g. Franken & Hik 2004; Morrison & Hik 2007; Zgurski
Catchen JM, Amores A, Hohenlohe P, Cresko W, Postlethwait
& Hik 2014) has been carried out at Pika Camp (Fig. 1), JH (2011) Stacks: building and genotyping loci de novo from
which is the most divergent and perhaps least represen- short-read sequences. Genes, Genomes, Genetics, 1, 171–182.
tative site with respect to the allelic variation observed Catchen J, Hohenlohe P, Bassham S, Amores A, Cresko WA
across the species’ range. While we may be able to use (2013) Stacks: an analysis tool set for population genomics.
studies of local adaptation, behaviour and response to Molecular Ecology, 22, 3124–3140.
COSEWIC (2011) COSEWIC assessment and status report on the
climate change in pikas to inform our expectations with
Collared Pika Ochotona collaris in Canada. Committee on the
regard to climate change impacts (Erb et al. 2011; Henry
Status of Endangered Wildlife in Canada, Ottawa, Ontario.
et al. 2012; Horn 2013; Lemay et al. 2013), strong sup- Dawson MR (1967) Lagomorph history and the stratigraphic
port for divergent histories and divergent alleles among record. University of Kansas Department of Geology Special Pub-
populations means that we cannot assume that all pop- lications, 2, 287–316.
© 2015 John Wiley & Sons LtdYou can also read