Bats distress vocalizations carry fast amplitude modulations that could represent an acoustic correlate of roughness - Nature
←
→
Page content transcription
If your browser does not render page correctly, please read the page content below
www.nature.com/scientificreports

            OPEN           Bats distress vocalizations carry
                           fast amplitude modulations
                           that could represent an acoustic
                           correlate of roughness
                           Julio C. Hechavarría1 ✉, M. Jerome Beetz1,2, Francisco García-Rosales1 & Manfred Kössl1

                           Communication sounds are ubiquitous in the animal kingdom, where they play a role in advertising
                           physiological states and/or socio-contextual scenarios. Human screams, for example, are typically
                           uttered in fearful contexts and they have a distinctive feature termed as “roughness”, which depicts
                           amplitude fluctuations at rates from 30–150 Hz. In this article, we report that the occurrence of fast
                           acoustic periodicities in harsh sounding vocalizations is not unique to humans. A roughness-like
                           structure is also present in vocalizations emitted by bats (species Carollia perspicillata) in distressful
                           contexts. We report that 47.7% of distress calls produced by bats carry amplitude fluctuations at rates
                           ~1.7 kHz (>10 times faster than temporal modulations found in human screams). In bats, rough-like
                           vocalizations entrain brain potentials and are more effective in accelerating the bats’ heart rate than
                           slow amplitude modulated sounds. Our results are consistent with a putative role of fast amplitude
                           modulations (roughness in humans) for grabbing the listeners attention in situations in which the
                           emitter is in distressful, potentially dangerous, contexts.

                           The ability to communicate fear and discomfort using sounds is ubiquitous in vertebrates. Humans, for example,
                           produce fearful screams to advertise the presence of uncomfortable socio-contextual scenarios, such as dangerous
                           situations that could lead to potential harm. In humans, recognizing sounds as fearful is linked to an acoustic
                           feature defined as “roughness”, i.e. amplitude modulations (AMs) in the sounds uttered occurring at frequencies
                           between 30–150 Hz1,2. In addition to naturalistic screaming, in humans, roughness is also found in infant cries3,
                           in harsh sounds produced in musical compositions such as the opera and hard rock4,5, as well as in sounds used
                           in artificial alarm systems1.
                               The ability to produce screams is not unique to humans6–11, but, at present, we do not know whether
                           human and non-human animals rely on similar strategies to create harsh sounding, alarm vocalizations. The
                           word “rough” has been used in several studies to describe agonistic vocalizations of animal groups including
                           non-human primates, otters, and birds, among others12–17. In those species, the acoustic correlates of roughness
                           were not studied quantitatively using methods similar to those employed for characterizing the human sound-
                           scape. Thus, it is unclear whether the acoustic correlates of roughness observed in non-human animals are com-
                           parable to those described in studies on humans. Answering this question is important, as it would allow us to
                           assess whether roughness is an evolutionarily preserved acoustic regime of mammalian vocalizations produced in
                           fearful contexts or a unique feature of human vocalizations. In other words, roughness could be a shared feature
                           of animal alarm and fearful vocalizations.
                               To test this idea, in this article, we searched for fast amplitude fluctuations -the acoustic correlate of rough-
                           ness - in distress vocalizations emitted by bats (species: Carollia perspicillata). Note that throughout this article,
                           we refer to fast amplitude modulated or rough-like sounds and not to “rough” sounds in the same sense they
                           have been described in humans1. The reason for this distinction is simple: we can only speculate about what
                           non-human animals perceive when listening to fast amplitude modulated vocalizations.
                               Bats constitute a highly vocal animal group that relies on sounds for navigation (echolocation) and
                           inter-individual communication18–20. Bats emit distress calls when tangled in catch nets or caught by a predator

                           1
                             Institut für Zellbiologie und Neurowissenschaft, Goethe-Universität, Frankfurt/M., Germany. 2Zoology II Emmy-
                           Noether Animal Navigation Group, Biocenter, University of Würzburg, Würzburg, Germany. ✉e-mail: Hechavarria@
                           bio.uni-frankfurt.de

Scientific Reports |   (2020) 10:7332 | https://doi.org/10.1038/s41598-020-64323-7                                                             1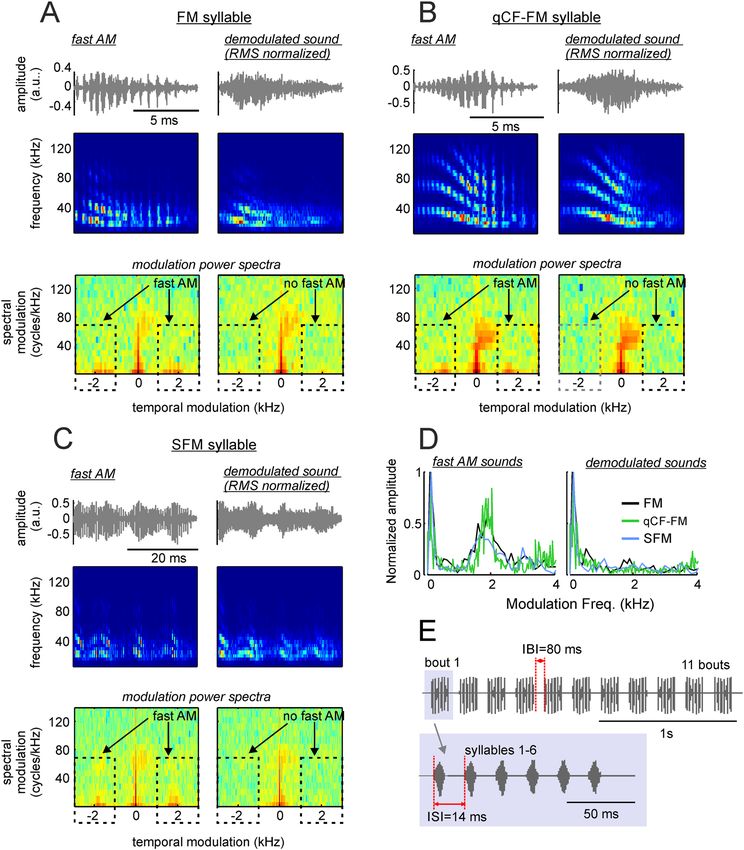
www.nature.com/scientificreports/                                                                www.nature.com/scientificreports

                           Figure 1. Bat distress vocalizations carry superfast periodicities. (A) Example distress sequence containing 14
                           syllable groups (bouts) and 71 syllables. A zoom-in into the bout composed of syllables 55–59 is provided. (B)
                           spectrograms, (C) time waveforms, (D) envelope and (E) temporal modulation spectra (TMS) of syllables 55–
                           59. Note that fast periodicities at ~1.7 kHz occur in syllables 55, 57–59, but are less clear in syllable 56. Also note
                           that all example distress syllables shown are harmonically-structured downward frequency modulated sweeps.

                           or a person21–24. Bat distress vocalizations are typically noisy and broadband and trigger exploratory and mob-
                           bing behaviors in individuals from the same and other species22,23,25,26. Bats utter distress calls in “sequences”
                           composed of many syllables24,27–30, making these sounds ideal for exploring whether rough-like sounds occur
                           at preferred sequence positions. Bat distress vocalizations are known to evoke strong neural responses in the
                           amygdala31, to entrain field potentials and spiking in the auditory cortex27,28,30, and to boost activity in the
                           hypothalamic-pituitary axes32,33.
                               Bat distress vocalizations share functional similarities with fearful human screams, in the sense that both have
                           the potential of influencing the behavior and physiology of listeners while the broadcaster faces a distressful,
                           potentially dangerous, context. Following this idea, and assuming that fast amplitude modulations are a gener-
                           alized trait linked to vocalizations emitted in dangerous situations, we expected to find fast periodicities in bat
                           distress calls. Bat distress calls are typically short, lasting on average less than 10 ms24. Since amplitude modulation
                           cycles have to fit within the sounds’ duration, we reasoned that any form of roughness found in bat distress calls
                           should be much faster than that observed in human screams. The data corroborated our hypotheses. We show
                           that there exists a form of acoustic roughness in bat distress vocalizations and that rough-like sounds entrain field
                           potentials and are more effective in accelerating the heart rate of listening bats than slow amplitude modulated
                           sounds. We also describe that, as suspected, temporal modulations found in bat distress calls are superfast, reach-
                           ing the order of kHz (i.e. bat roughness occurs at ~1.7 kHz vs. 30–150 Hz in humans). Albeit large interspecific
                           differences between bats and humans, our findings speak in favor of fast temporal modulations in the sounds
                           uttered as generalized trait capturing the listeners’ attention while the emitter is under duress.

                           Results
                           Fast amplitude modulations are present in bat distress vocalizations. We recorded distress calls
                           from 13 adult bats (6 females and 7 males) of the species C. perspicillata. This species emits sequences of distress
                           calls composed of basic vocalization units defined as “syllables”24. In bats, the production of distress calls can be
                           triggered by holding the animals in the hands while carefully caressing the neck-skin22,23.
                               We studied a total of 114 distress “sequences”. Each of those sequences was composed of sound units defined
                           as “syllables” (see ref. 24. for the definition of distress sequences and syllables). An example distress sequence is
                           shown in Fig. 1A. This sequence contained 71 syllables arranged over a time period of 2.38 s. As shown in Fig. 1A
                           and in a previous article24, within a distress sequence, syllables are temporally arranged in groups defined as
                           “multi-syllabic bouts”. A zoom-in into the multi-syllabic bout containing syllables 55–59 is shown at the bottom
                           of Fig. 1A to illustrate the temporal separation between syllables.
                               We searched for fast, periodic amplitude fluctuations (i.e. roughness-like patterns) in individual distress syl-
                           lables (Fig. 1B–E). To that end, the energy envelope of each syllable was calculated (Fig. 1D) and the spectrum

Scientific Reports |   (2020) 10:7332 | https://doi.org/10.1038/s41598-020-64323-7                                                               2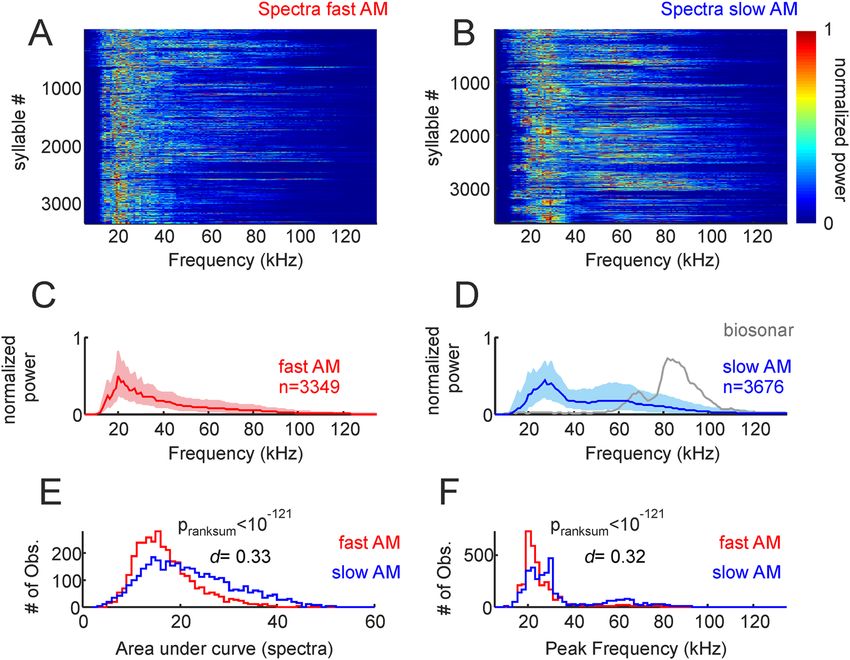
www.nature.com/scientificreports/                                                              www.nature.com/scientificreports

                           of the envelope (defined as the temporal modulation spectrum, TMS, Fig. 1E) was obtained and analyzed in the
                           range between 0–4 kHz. As it can be noted in the example distress syllables represented in Fig. 1B–E, a single
                           distress sequence could contain syllables with different types of TMS. For example, the TMS of syllables 55, 57,
                           58 and 59 (Fig. 1B–E) had a pronounced peak at ~1.7 kHz. In syllable 56, the peak at ~1.7 kHz was less evident.
                           We reasoned that syllables modulated at rates ~1.7 kHz could represent rough-like sounds in bats, since they
                           contained a pronounced temporal modulation pattern, the hallmark feature of acoustic roughness, at least in
                           humans1. Note that 1.7 kHz is a very low frequency for C. perspicillata, a bat species that can reach frequencies
                           above 100 kHz both while echolocating and while producing communication calls24,34,35. In fact, the cochlear fre-
                           quency response curves of C. perspicillata, calculated using distortion product otoacoustic emissions, suggest that
                           hearing in this animal species deteriorates at frequencies below 5 kHz (see upcoming text in the results section).
                                We classified the distress syllables recorded into fast amplitude modulated vocalizations (fAMVs) and slow
                           amplitude modulated vocalizations (sAMVs) based on their TMS. For that purpose, we relied on a binary support
                           vector machine (SVM) classification algorithm that was fed with the TMS of all 7025 distress syllables recorded.
                           The SVM classifier was trained with two sets of TMSs comprising the TMS of 50 fAMVs and 50 sAMVs (see
                           training TMS sets in Supplementary Fig. S1). The results obtained with the SVM classifier are depicted in Fig. 2.
                           Altogether, 3349 out of 7025 syllables studied (47.7%) were classified as fAMVs. The TMS of all fAMVs and
                           sAMVs are shown as colormaps in Fig. 2A,B, respectively. Note that in the range from 1.15 to 2.45 kHz, brighter
                           colors are present in the population of fAMVs when compared to sAMVs. This range is marked by a rectangle
                           in Fig. 2A,B and it was defined as the “Frequencies of Interest” (FOIs) for further analysis. The presence of high
                           energy at the FOIs was also visible in median curves for the populations of fAMVs and sAMVs (Fig. 2C,D) iden-
                           tified by the SVM classifier.
                                To validate amplitude modulation differences at the population level, we calculated the area under the curve
                           at the FOIs in the two syllable groups (Fig. 2E). As expected, the power at the FOIs was significantly higher in
                           fAMVs than in sAMVs (Wilcoxon ranksum test, p < 10−200) and this differences had a large effect size (Cliff ’s
                           delta (d)= 0.94, following36: negligible effect: absolute d value (abs (d)) < 0.147, small: 0.147 < abs(d) < 0.33,
                           medium: 0.33 < abs(d) < 0.474, large: abs(d) > 0.474). Note that the statistical analysis described in the preced-
                           ing text was conducted by pooling together data from all fAMVs and sAMVs recorded across animals and dis-
                           tress sequences. Strong differences regarding amplitude modulation were also observed when comparing the
                           median power at FOIs in fAMVs and sAMVs recorded within the same distress sequences using paired statistics
                           (Signrank, p = 3.6*10−15, see Supplementary Fig. S2A).
                                The best modulation frequency (BMF) of each fAMV was calculated by searching for the frequency that
                           contained the highest energy in the FOI range (that is, between 1.15 and 2.45 kHz). The BMF distribution had a
                           median of 1.75 kHz with an interquartile range (IQR) of 0.4 kHz (Fig. 2F). To determine if fAMVs occurred at a
                           preferred position within distress sequences, the normalized position of each fAMV was calculated relative to the
                           length of the sequence in which it occurred. Though fAMVs occurred throughout the sequences, the distribu-
                           tion of preferred positions was slightly skewed to the left (Fig. 2G, median = 0.45, IQR = 0.49). The latter points
                           towards a higher probability of finding rough-like syllables in the first half of the distress sequences. This trend
                           was validated statistically by comparing the temporal syllable distribution observed to a bootstrap distribution
                           created by randomizing the positions of fAMVs and sAMVs in each sequence (100 randomizations for each
                           sequence, two-sample Kolmogorov-Smirnov test: p = 1.12*10−7, Fig. 2G). Comparing the probability of finding
                           fAMVs in the first and second sequence halves also indicated statistical significance (Signrank test, p = 0.03).

                           Fast amplitude modulation could be a hallmark feature of bat distress calls. The results pre-
                           sented thus far in this article demonstrate the occurrence of fast amplitude modulation ~1.7 kHz in 47.7% of
                           the distress syllables studied. However, if fast amplitude fluctuations are a hallmark of distress calling, then the
                           percentage of fAMVs should be much lower in other types of social vocalizations. To test this idea, we studied
                           vocalizations of the same 13 bats in which distress calls were studied but, in this case, when the animals were
                           interacting in a keeping cage. We reasoned that bats that are accustomed to each other (they were placed together
                           for an entire week before the recordings took place) should not engage often in agonistic interactions that could
                           involve the production of distress-like sounds. Note that acoustic recordings obtained in this broad “social” con-
                           text cover many types of interactions between bats and we cannot link each sound recorded to specific behavioral
                           contexts as only acoustic data was collected.
                               Altogether, we recorded 3641 vocalizations in the “social” context (echolocation calls were excluded based
                           on their spectral design). The same SVM classifier used to split distress calls into fAMvs and sAMVs was used to
                           classify social calls. Supplementary Fig. S3 shows the TMS and spectra of all social calls studied based on their
                           classification as fAMVs and sAMVs. The number of social calls classified as fAMs amounted to 229, representing
                           6.3% of the total number syllables studied in the social context (3641 syllables). This value is much lower than
                           the value obtained during distress calling (47.7%, see Fig. 2H) suggesting that the occurrence of fast amplitude
                           modulations could indeed be a hallmark of distress calling in bats.

                           Fast and slow amplitude modulated distress vocalizations differ in their peak frequency and
                           bandwidth. For the remaining acoustic analysis presented in this manuscript we will focus only on vocaliza-
                           tions studied in the distress calling context (i.e. handheld bats while massaging the neck skin).
                               We tested for spectral differences between fAMVs and sAMVs produced during distress calling. At the popu-
                           lation level, there was a tendency for fAMVs to have a narrower spectrum than sAMVs, with fAMVs tending to
                           have higher power in the range from 40–80 kHz. The latter is visible in both the normalized spectra of all fAMVs
                           and sAMVs (colormaps in Fig. 3A,B) and in the median spectra of the two syllable groups (Fig. 3C,D). Differences
                           in spectral bandwidth between the two syllable groups were statistically significant, as validated by a ranksum test
                           that compared the area under the normalized spectra in fAMVs and sAMVs (Fig. 3E, pranksum < 10−121). Note that

Scientific Reports |   (2020) 10:7332 | https://doi.org/10.1038/s41598-020-64323-7                                                           3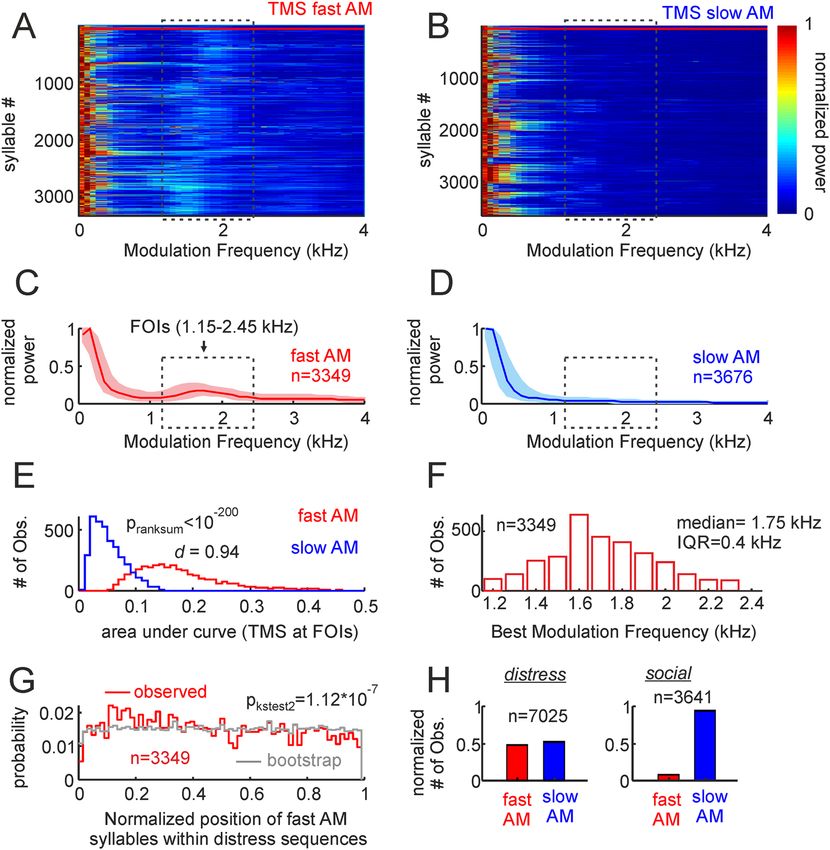
www.nature.com/scientificreports/                                                             www.nature.com/scientificreports

                           Figure 2. Temporal properties of fast and slow amplitude modulated (AM) vocalizations. (A,B) Show the
                           TMS of the two syllable groups, represented as colormaps. The first 50 fast AM and slow AM calls in the
                           colormaps (border marked by horizonal red lines) were used to train the support vector machine classifier (see
                           also supplementary Figure S1). (C,D) Are median TMS of all fast and slow AM calls studied (25th and 75th
                           percentiles shown as shaded areas). Note that a peak occurs at the frequencies of interest (FOIs) in fast AM calls
                           but not in slow AM vocalizations. (E) Histogram of the area under the TMS curve at the FOIs in the two call
                           groups. The p-value of a Wilcoxon ranksum test and the d size-effect metric are provided. (F) histogram of best
                           modulation frequencies found in the population of fast AM calls. Median and inter-quartile range are provided.
                           (G) Probability of finding fast AM vocalizations in certain positions along the distress sequences. To calculate
                           probability values, the relative position of each fast AM call was obtained taking into account the length of the
                           sequence in which it occurred. This “observed” probability distribution was compared (Kolmogorov-Smirnov
                           two-sample test) with an “expected” distribution obtained by randomly swapping the position of syllables
                           within each sequence 100 times. (H) The percentage of fast and slow AM calls found when bats where under
                           duress (distress) and when interacting between them in a keeping cage (social, see also Supplementary Fig. S3).

                           the d-metric obtained for this comparison indicated a medium/small size effect (d = 0.33). Besides these small
                           differences in spectral bandwidth, fAMVs and sAMVs also differed in their peak frequencies (Fig. 3F, medianfA-
                           MVs = 22 kHz, mediansAMVs = 27 kHz, pranksum = 10     ) with fAMVs tending to have lower peak frequency values,
                                                                             −121

                           although the size effect in this case was also small (d = 0.32). Note that spectral differences between fAMVs
                           and sAMVs were also apparent when comparing median bandwidth and peak frequency values obtained within
                           the same distress sequences using paired statistics (see Supplementary Fig. S2B,C, peak frequency, Signrank,
                           p = 1.6*10−6, bandwidth, Signrank, p = 4.7*10−4).
                               Our data allows to assess how much bats separate carrier and modulating waves during natural calling, since
                           we measured peak frequency (i.e. the carrier with the strongest energy expressed in Hz) and BMF (frequency of
                           modulating wave, also in Hz) of each distress syllable classified as fAMV. To that end, we calculated carrier/mod-
                           ulator ratios by dividing the peak frequency of each fAMV by its BMF. The data indicated that fAMVs produced
                           during distress calling have median carrier/modulator ratios of 15.2 (IQR = 5.0), in other words, in rough-like
                           sounds (fAMVs) produced by bats the modulating wave is well separated from the most energetic carrier.

Scientific Reports |   (2020) 10:7332 | https://doi.org/10.1038/s41598-020-64323-7                                                          4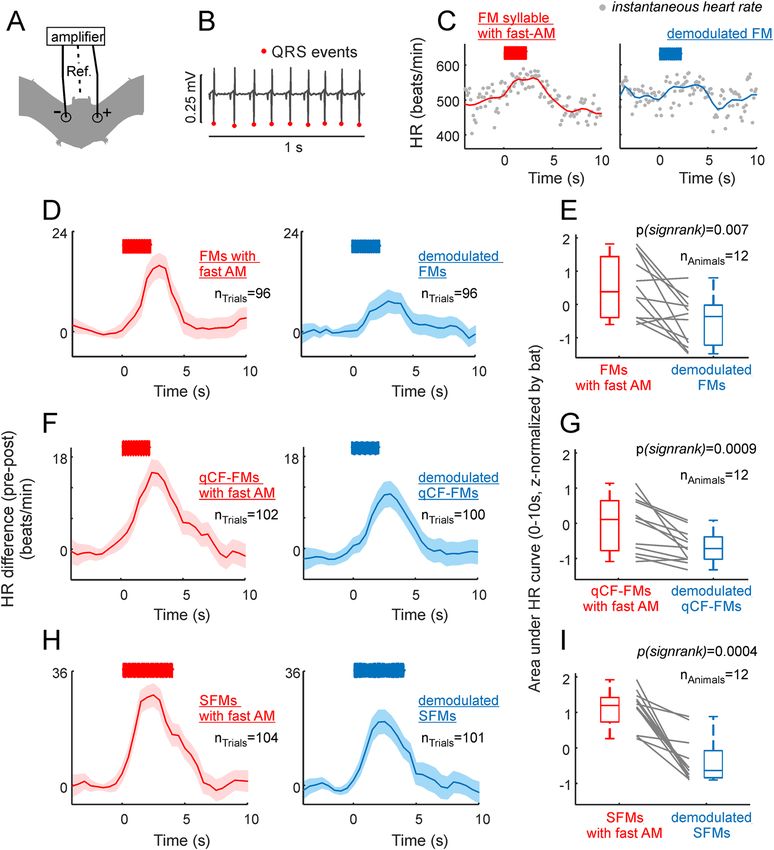
www.nature.com/scientificreports/                                                               www.nature.com/scientificreports

                           Figure 3. Spectral properties of fast and slow amplitude modulated (AM) vocalizations. (A and B) Show the
                           spectra of the two syllable groups, represented as colormaps. (C and D) Are median spectra of all fast and slow
                           AM calls studied (25th and 75th percentiles shown as shaded areas). The median spectrum of 100 biosonar calls
                           is shown in D for comparison purposes. (E) Histogram of area under curve calculated from the spectra of fast
                           and slow AM vocalizations. The p-value of a Wilcoxon ranksum test and the d size-effect metric are provided.
                           (F) Histogram of peak frequency in fast and slow AM calls.

                           Fast and slow amplitude modulated distress vocalizations differ in their spectral smooth-
                           ness and regularity. There were also differences between distress fAMVs and sAMVs regarding their
                           harmonic-to-noise difference (HND, Fig. 4). The HND-metric is useful for quantifying spectral “smoothness”,
                           and it is calculated as the difference between the observed spectrum and the same spectrum smoothened using a
                           moving average filter (here a 5 point moving window applied to spectra calculated with 200-Hz frequency resolu-
                           tion; see Fig. 4A–D for illustration of the HND calculation in one SAMV (Fig. 4A,C) and one sAMV (Fig. 4B,D)).
                           This method was originally proposed for studying “hoarseness” in human speech37 and it has since been used in
                           several studies on vocalizations produced by humans and other animal species (e.g. dog barks38). Calculating the
                           HND of fAMVs and sAMVs produced by C. perspicillata rendered statistical differences between the two syllable
                           groups (Fig. 4E, pranksum = 10−20, medianfAMVs = 0.45, mediansAMVs = 0.39, small effect size (d = 0.3)) thus indicat-
                           ing that the spectra of rough-like syllables (fAMVs) is less smooth than that of slow modulated syllables (sAMVs).
                           This effect was also observable when comparing median HNDs obtained within the same distress sequences using
                           paired statistics (see Supplementary Fig. S2D, Signrank test, p = 0.02).
                               Note that the fact that fAMVs had the least smooth spectra does not imply that their spectra were “irregular”.
                           In fact, we observed that in the spectra of fAMVs peaks occurred at regular intervals. The latter is illustrated in
                           the spectrum autocorrelation function represented in Fig. 4F for one example fAMV (same as in Fig. 4A,C). In
                           this example autocorrelogram, local peaks (Matlab findpeaks function, peak prominence 0.025) could be detected
                           every 1.6 kHz (i.e. 8 samples of the autocorrelogram of a 200-Hz resolution spectrum). Side-peaks indicating
                           spectral regularity were also observed in the median autocorrelogram of all syllables labeled as fAMVs by the
                           SVM classifier, but not in the median autocorrelogram of syllables labeled as sAMVs (Fig. 4G). The local-peak
                           detection algorithm rendered more than 1 peak in 2699 out of 3349 syllables identified as fAMVs (80.6%). In
                           those syllables, we calculated the mean inter-peak distance (MIPD) from the autocorrelogram as a metric of
                           spectral regularity. The MIPD distribution peaked at 1.6 kHz (Fig. 4H). Note that this value is close to best ampli-
                           tude modulation frequency values determined by analyzing the temporal modulation spectrum (i.e. 1.75 kHz for
                           all fAMVs, see Fig. 3, but 1.65 kHz for the 2699 fAMVs in which the MIPD could be measured). In fact, paired
                           statistics comparing MIPD and best amplitude modulation frequencies of sAMVs rendered no statistically signif-
                           icant differences (psignrank = 0.49). The latter suggests that temporal and spectral modulations are strongly linked
                           to each other, a situation that is expected if one considers the spectral regularities observed as “sidebands” created
                           by the presence of a modulating wave.

Scientific Reports |   (2020) 10:7332 | https://doi.org/10.1038/s41598-020-64323-7                                                             5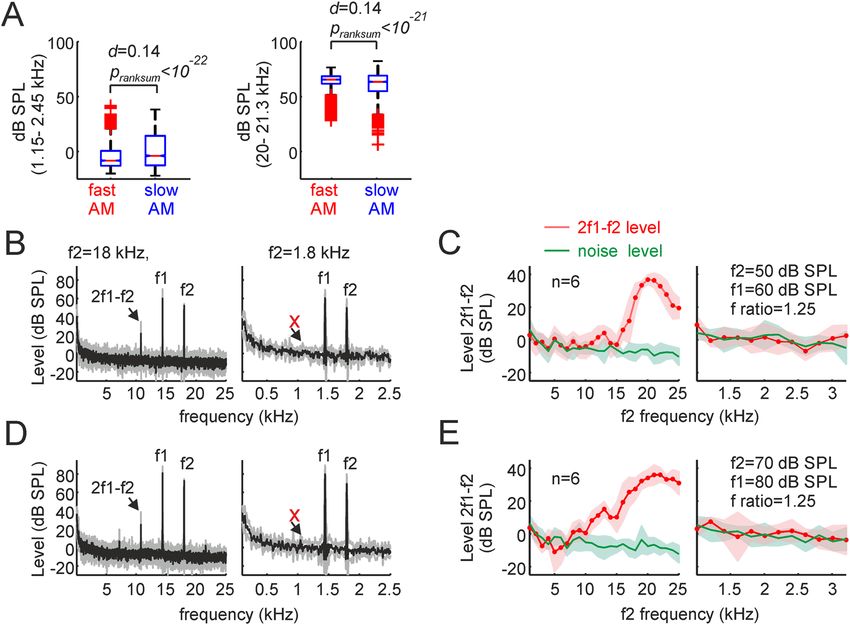
www.nature.com/scientificreports/                                                            www.nature.com/scientificreports

                           Figure 4. Spectral regularities are a characteristic feature of fast amplitude modulated vocalizations (fAMVs).
                           (A and B) Show the spectrograms and waveforms of one example fAMV and one slow modulated vocalization
                           (sAMV, A and B, respectively). (C and D) Are the spectra of the same two example vocalizations. Note that the
                           observed spectra (200-Hz frequency resolution) and “smooth” spectra are represented. Smooth spectra were
                           calculated using a 5-point moving average. The difference between the observed and the smooth-spectra was
                           used for harmonic-to-noise difference (HND) calculations. (E) Histograms of HND for fAMVs and sAMVs.
                           The p-value of a Wilcoxon ranksum test and the d size-effect metric are provided. (F) Spectral autocorrelograms
                           for the example fAMV and sAMV shown in (C and D). Note that spectral regularities (i.e. peaks spaced at
                           regular distances) occurred in the example fAMV. In this example, the median inter-peak distance (MPID) was
                           1.6 kHz. (G) Median spectral autocorrelograms for all fAMVs and sAMVs studied (25th and 75th percentiles
                           shown as shaded areas). Note the side- peaks occurring in the population of fAMVs. (H) Histogram of MPID
                           for the fAMVs in which more than one peak could be detected in the spectral autocorrelogram. Median and
                           interquartile range are (iqr) given.

                           1.7 kHz is absent as carrier frequency in fast amplitude modulated vocalizations. We have
                           shown that almost half of the bat distress syllables carry periodicities (roughness-like patterns) at frequencies
                           ~1.7 kHz. Such periodicities can be measured in both the time and spectral domains and could be interpreted as
                           the syllables’ modulating frequency. We tested whether 1.7 kHz was missing or present as carrier in the syllables’
                           spectra. The latter was achieved by measuring the level (in dB SPL) in the range between 1.15 kHz–2.45 kHz (the
                           FOIs) in the frequency spectrum of each syllable (not in its TMS). The level in this frequency range was obtained
                           by computing the logarithm of the root-mean-square (RMS) of the filtered signals in the FOI range (3rd order
                           Butterworth filter), and by comparing the results with the RMS of a 94 dB SPL pure tone (1 kHz) produced by a
                           calibrator (see methods). Overall, the level in the FOI range never exceeded 50 dB SPL, regardless of whether it
                           was studied in fAMVs or sAMVs (Fig. 5A). The average FOI level for fAMVs was −3.9 dB SPL while for sAMVs

Scientific Reports |   (2020) 10:7332 | https://doi.org/10.1038/s41598-020-64323-7                                                         6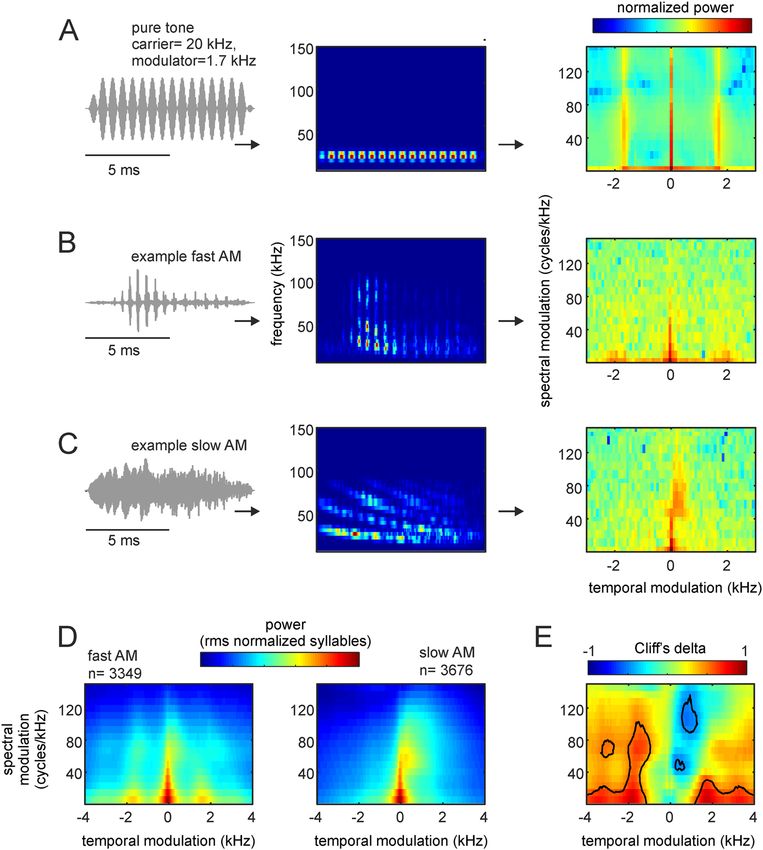
www.nature.com/scientificreports/                                                              www.nature.com/scientificreports

                           Figure 5. 1.7 kHz is has low power as carrier frequency and does not trigger responses in the bat cochlea. (A,
                           left) Sound pressure level (in dB SPL) calculated in the range from 1.1–2.5 kHz. Note that this frequency range
                           was not well represented in the sounds uttered, i.e. values were always below 50 dB SPL in fast modulated and
                           slow modulated vocalizations, and median SPLs were close to 0. The p-value of a Wilcoxon ranksum test and
                           the d size-effect metric are provided. The same analysis is shown in the right panel of A for the frequency range
                           between 20–21.3 kHz for comparison purposes. On each box, the central mark indicates the median, and the
                           bottom and top edges of the box indicate the 25th and 75th percentiles, respectively. The whiskers extend to the
                           most extreme data points not considered outliers, and the outliers are plotted individually using the ‘+’ symbol.
                           (B) Average distortion product (DP) measurements obtained in six animals for f2 frequencies of 18 kHz and
                           1.8 kHz (left and right, respectively), when the f2 level was set to 50 dB SPL. Note that a strong cubic DP (2f2-f1)
                           appeared when f2 was equal to18 kHz, but not when it was 1.8 kHz. (C) Coarse and high-resolution DPgrams
                           obtained with frequency steps of 1 kHz and 200 Hz (left and right, respectively). Coarse DPgrams covered f2
                           frequencies from 1–25 kHz, while high-resolution DPgrams covered f2 frequencies from 1- 3.2 kHz. In high-
                           resolution DPgrams, the DP level measured remained within the acoustic noise level, thus indicating poor
                           hearing sensitivity for those frequencies. (D,E) Show DP measurements similar to those depicted in B and C,
                           but for stimulus levels of 80/70 dB SPL.

                           the average level reached the 0.6 dB SPL. FOI level values were significantly higher in sAMVs than in fAMVs
                           (pranksum < 10−22) although the size effect of this comparison indicated negligible effects (d = 0.14). Note that
                           the level values obtained in the FOI range were much lower than those obtained in the range from 20–21.3 kHz
                           (mean level fAMVs = 64.4 dB SPL, mean level sAMVs = 61.2 dB SPL, pranksum < 10−21, d = 0.14). Overall, the
                           low sound pressure levels observed when syllables were filtered in the FOI range suggest that 1.7 kHz is not a
                           carrier frequency but rather a modulating wave responsible for the temporal and spectral regularities measured
                           in rough-like distress syllables.

                           The bat cochlea does not respond to carriers ~1.7 kHz based on non-linear mechanics. We also
                           tested whether the bats’ ears were sensitive to carrier frequencies ~1.7 kHz (the putative modulator of fAMVs).
                           This was a necessary test, because we noticed that previous studies on C. perspicillata’s audiogram always meas-
                           ured hearing sensitivity at frequencies above 5 kHz39–41. We measured the cochlear audiogram of 6 adult awake
                           C. perspicillata (3 males, 3 females) by means of distortion product otoacoustic emissions (DPOAE). DPOAEs
                           are a by-product of nonlinear ear mechanics and they represent a non-invasive objective method for measuring
                           sensitivity and tuning of the cochlear amplifier42–44. We focused on the cubic DPOAEs that occur at frequencies
                           of 2f1-f2, were f2 and f1 represent the frequencies of two sounds produced simultaneously by loudspeakers placed
                           closed to the bats’ tympanic membrane. The ratio between f1 and f2 was kept constant at 1.25 and there was a level
                           difference of 10 dB between the sounds to optimize stimulus parameters (see refs. 44,45). To test for the occurrence
                           of DPOAEs, two stimulus level combinations were used (L1/L2 = 50/60, 80/70 dB SPL). DPOAEs were measured

Scientific Reports |   (2020) 10:7332 | https://doi.org/10.1038/s41598-020-64323-7                                                            7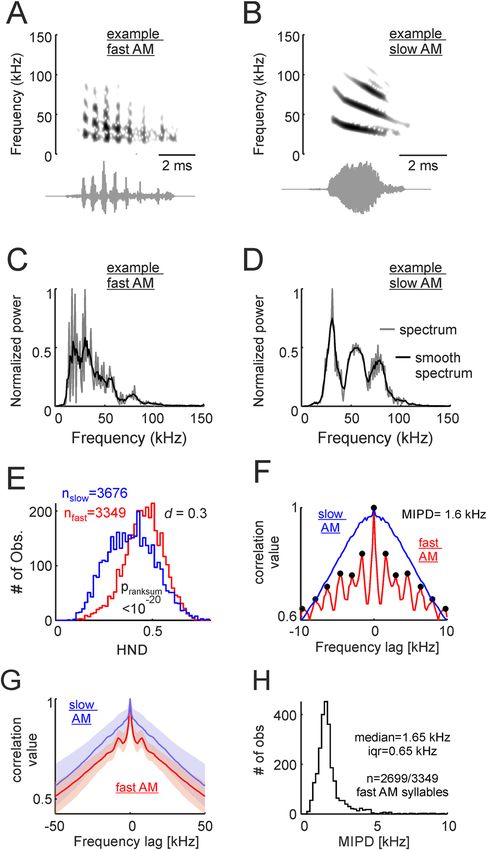
www.nature.com/scientificreports/                                                               www.nature.com/scientificreports

                           Figure 6. Modulation power spectra (MPS) of bat distress vocalizations. (A, from left to right) The waveform,
                           spectrogram, and MPS of a pure tone temporally modulated at 1.7 kHz. Note that the temporal modulation
                           appears in the MPS as side-peaks at −1.7 and 1.7 kHz. (B,C) show the waveform, spectrogram, and MPS for
                           an example fast and one slow amplitude modulated (AM) vocalization, respectively. Note that fast temporal
                           modulations are visible in the modulation power spectrum of the example fast AM vocalization. (D) Average
                           MPS for the population of fast and slow AM calls studied. (E) Cliff ’s delta (d) obtained after comparing the
                           MPS of the syllable groups. Contour lines indicate large size-effects (i.e. d > 0.478), indicating consistent MPS
                           differences.

                           with coarse and fine frequency steps, covering f2 frequencies between 1–25 kHz (steps of 1 kHz) and between
                           1–3.2 kHz (steps of 200 Hz), respectively.
                               As it can be seen in Fig. 5B,D, when f2/f1 sound pairs of 18/14.4 kHz were presented, a noticeable cubic dis-
                           tortion appeared, regardless of whether f2 was presented at 50 or 70 dB SPL (Fig. 5B,D (leftmost panels), respec-
                           tively). However, no visible distortion product occurred in response to f2/f1 pairs of 1.8 and 1.44 kHz, regardless
                           of the f2 level tested (Fig. 5B,D (rightmost panels)). Overall, high amplitude distortion products, indicating strong
                           cochlear amplification, were visible only for f2 frequencies above 5 kHz (Fig. 5C,E, leftmost panels). In response
                           to lower f2 frequencies, distortion product amplitude fell within the acoustic noise level (Fig. 5C,E, rightmost
                           panels). These results indicate that C. perspicillata’s cochlea is not well suited for dealing with faint low frequency
                           sounds and can therefore not respond to potential 1.7 kHz carrier frequencies of fAMVs even if those frequencies
                           were more intense than 60 dB SPL, which is not the case according to our data (see SPL values in Fig. 5A).

                           The modulation power spectrum of distress syllables. The modulation power spectrum (MPS) of
                           fAMVs and sAMVs was calculated (Fig. 6). The MPS is calculated from the 2D fast Fourier transform (FFT) of
                           the syllables’ spectrogram (see below and methods). The MPS represents power in the two-dimensional space
                           of temporal and spectral modulations and it has been used to study vocalizations in other highly vocal animal
                           groups such as humans and birds1,46,47.

Scientific Reports |   (2020) 10:7332 | https://doi.org/10.1038/s41598-020-64323-7                                                              8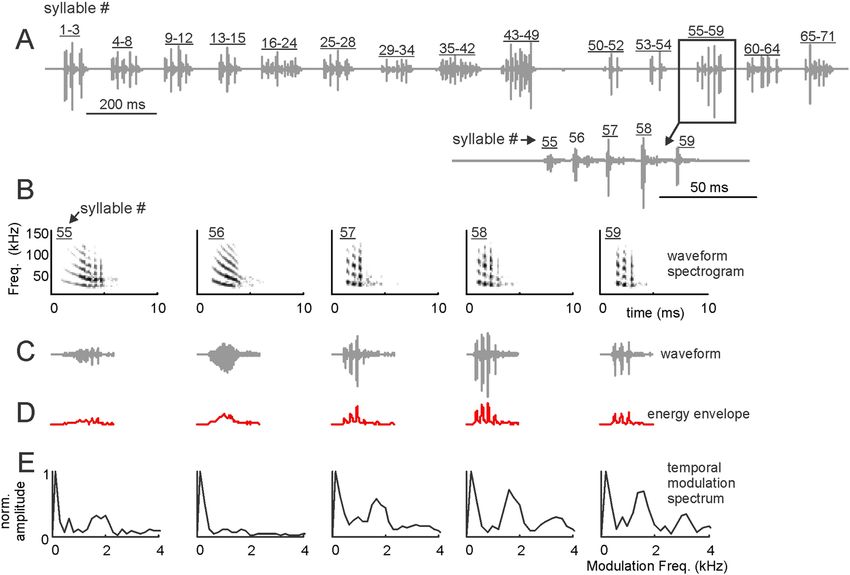
www.nature.com/scientificreports/ www.nature.com/scientificreports
We were interested in the MPS because of two reasons: (i) unlike classical acoustic analysis techniques (as
those described in the preceding text), the MPS allows to quantify amplitude and spectral modulations simul-
taneously in each syllable47; and (ii) filtering the MPS provides a robust technique for removing modulation
components of the signal without changing other signal attributes. In our case, we were interested in determining
whether the presence/absence of fast amplitude fluctuations (putative roughness) had differential effects on the
bats’ heart rate and neural responses (see below).
The oscillogram, spectrogram, and MPS of a 20 kHz pure tone modulated at 1.7 kHz, one example fAMV, and
one example sAMV are shown in Fig. 6A–C, respectively. It can be noted that in both the amplitude modulated
pure tone and the example fAMV, more power occurred at temporal modulation frequencies close to 1.7 kHz. In
the MPS, temporal modulations are represented in the positive and negative planes, with the former indicating
the presence of downward frequency modulations and the latter corresponding to upward frequency modula-
tions46,47. The presence of strong downward spectral modulations (hence positive values in the temporal modu-
lation domain) is noticeable in the example sAMV represented Fig. 6C. This downward spectral modulation was
strongest in the range between 50–80 kHz, corresponding to the call’s bandwidth.
As expected, pronounced power at temporal modulation frequencies close to 1.7 kHz was also evident when
averaging MPS curves of all distress syllables classified as fAMVs (n = 3349), but not in the average MPS of
sAMVs (n = 3676, Fig. 6D). We calculated Cliff ’s delta to assess the effect size of differences between the MPS of
fAMVs and sAMVs (Fig. 6E). The comparison between the two syllable types was done for each temporal- and
spectral-modulation combination in the MPSs. As mentioned in the preceding text, d values above 0.478 were
considered as large effect size (contour lines in Fig. 6E) following previous studies36. Overall, the values obtained
from d calculations validated the existence of two main MPS differences between fAMVs and sAMVs: (i) faster
temporal modulations in fAMVs than in sAMVs, and (ii) more pronounced downward spectral modulations in
sAMVs.
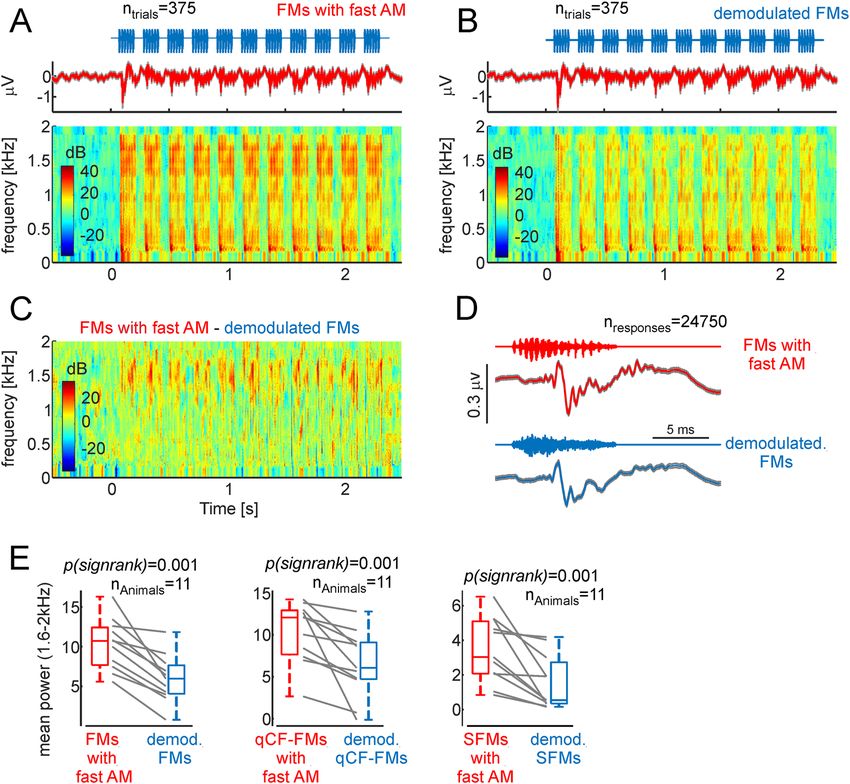
Testing the effect of fast amplitude modulations on the listeners’ physiology. The acoustic anal-
ysis described in the previous sections revealed the presence of fast amplitude modulation (putative roughness) in
3349 out of 7025 syllables studied (47.7%). To determine whether bats could actually perceive fast amplitude fluc-
tuations at 1.7 kHz we measured the heart rate (HR) response of awake animals while they listened to sequences
of natural fAMVs and their demodulated versions. Previous studies have shown that the bats’ HR increases when
the animals are subject to fear conditioning, when they listen to aggression (versus non-aggression) calls, or after
electric stimulation of the amygdala31,48,49. We thus reasoned that the HR could be a useful indicator of autonomic
changes driven by the presence of fast amplitude modulations in the sounds.
To determine whether roughness had specific effects on the bats’ HR the MPS of three natural fAMVs was
filtered to produce their “demodulated” versions (Fig. 7). Using natural sAMVs as control also could have been
an option. We did not choose this option because natural vocalizations always differ between them in more than
one acoustic parameter (even if in a subtle manner unperceivable to us). We reasoned that multi-parametric
differences between sounds that are not under precise control of the experimenter could have hampered the
interpretation of the results obtained.
As stimuli for sound demodulation we chose one frequency modulated (FM) syllable (Fig. 7A), one syllable
containing quasiconstant frequency and FM components (qCF-FM, Fig. 7B), and one containing sinusoidal fre-
quency modulations (SFM, Fig. 7C). Note that in a previous study we reported that syllables containing down-
ward FM components represent 94% of the distress vocalizations produced by C. perspicillata, SFMs (the next
best represented group) amounted to ~4% of the syllables analyzed, while qCF syllables represented less than 1%
of the syllables studied24.
The procedure used for MPS filtering was designed according to previous studies in humans47 and is described
in detail in the methods section and in the Supplementary Fig. S4, which shows the demodulation procedure for
one of the sounds used as stimuli. MPS filtering allows to modify certain features of the vocalizations without
affecting others. Here, we used MPS filtering for removing the syllables’ putative roughness occurring at ~1.7 kHz
without changing their spectro-temporal structure (see spectrograms in Fig. 7A–C). The result (Fig. 7A–D) was
three pairs of natural fAMVs and software-demodulated syllables (artificial sAMVs) that were used as stimuli for
measuring HR responses. Note that the TMS of artificial sAMVs produced after MPS filtering resembles that of
natural sAMVs produced by the bats (Fig. 7D).
The final stimuli presented to the bats were sequences of either natural fAMVs or artificial-sAMVs in which
the same sound was repeated 66 times in the form of 11 bouts (Fig. 7E, top panel), with 6 repetitions of the same
syllable per bout (see Fig. 7E, bottom panel). The inter-bout interval was fixed to 80 ms and, within bouts, syl-
lables were repeated at intervals of 14 ms. These parameters were chosen based on median values reported in a
quantitative study on the structure of C. perspicillata’s distress sequences24. HR changes in response to the acoustic
signals described above were measured by attaching three electrodes (active, reference and ground) to the left
and right sides of the chest and to the back of the animals, respectively (Fig. 8A). The resulting voltage differ-
ences were measured and the location of QRS complexes were detected automatically based on their amplitudes
(Fig. 8B). Instantaneous HR was then calculated considering the interval between consecutive QRS complexes
and expressed in beats/min. HR was measured from 5 s before (baseline) until 10 s after stimulus presentation.
Listening to fast amplitude modulated vocalizations boosts the bats’ heart rate. As mentioned
in the preceding text, acoustic stimulation is known to increase the bats’ HR31,49. This effect was also visible in our
data, as illustrated in Fig. 8C (left) for two stimulation trials in which sequences of FM syllables were presented to
an awake bat, with the syllables occurring either in their natural (with fast modulations) or demodulated forms
(Fig. 8C left and right, respectively). Note that the example individual trials presented in Fig. 8C already point
towards larger HR increments in response to rough-like than to demodulated sounds.
Scientific Reports | (2020) 10:7332 | https://doi.org/10.1038/s41598-020-64323-7 9www.nature.com/scientificreports/ www.nature.com/scientificreports
Figure 7. Removing fast periodicities by filtering modulation power spectra (MPS) of fast amplitude
modulated (AM) vocalizations. (A) Left column shows the waveform, spectrogram, and MPS of a downward
frequency modulated (FM) syllable containing fast periodicities. (A) Right column shows representations
of the same sound after demodulation by filtering the MPS in the range marked with the dashed lines (see
methods and Supplementary Fig. S4). (B,C) show the same representations as A, but for one syllable containing
quasiconstant-frequency and downward frequency modulated components (qCF-FM syllable, B) and one
syllable composed of sinusoidal frequency modulations (SFM syllable, C). The three syllables represented in
(A–C) and their demodulated treatments were used as stimuli for measuring electrocardiogram (ECG) and
neural responses. (D) The temporal modulation spectra of the FM, qCF-FM, and SFM syllables (left) and their
demodulated treatments (right). (E) Temporal arrangement of syllables in the sequences used as stimuli during
ECG and neural measurement experiments. Altogether, six sequences were constructed, each composed of the
same syllable repeated at inter-syllable intervals (ISIs) of 14 ms. The syllables formed 11 bouts that were repeated
at inter-bout intervals (IBIs) of 80 ms.
Average HR curves obtained by pooling data from all stimulation trials in all bats tested are shown in
Fig. 8D,F,H (12 bats; 10 trials per animal and stimulus treatment, trials with movement artifacts were not con-
sidered, see methods). Regardless of the syllable analyzed, the natural treatment containing fast amplitude
modulation always produced higher HR increments than the demodulated treatment of the corresponding syl-
lable. This was statistically validated by comparing the area under the HR curve in the first 10 s after stimulation
in each bat using paired statistics (Fig. 8E,G,I, nbats = 12, FM syllable: psignrank = 0.002, qCF-FM syllable: psign-
rank = 0.00009, SFM syllable: psignrank = 0.0004). Altogether the data obtained indicates that the presence of fast
Scientific Reports | (2020) 10:7332 | https://doi.org/10.1038/s41598-020-64323-7 10www.nature.com/scientificreports/ www.nature.com/scientificreports
Figure 8. The presence of fast amplitude modulation boosts the bats’ heart rate (HR). (A) Schematic
representation of electrode positioning during electrocardiogram (ECG) measurements. (B) 1s-segment of
ECG recording. The position of QRS events is indicated. (C) Instantaneous HR in two recording trials in which
the fast amplitude modulated (AM) FM syllable and its demodulated treatment were used as stimuli (left and
right, respectively). HR-curves (solid-lines) were obtained by interpolation from the instantaneous HR data.
(D) Average HR curves obtained considering all presentations of the fast-AM FM syllable (left panel) and its
demodulated treatment (right panel). Shaded areas indicate the standard error of the mean. Note that stronger
HR responses followed the presentation of the fast-AM FM. (E) Area under the average HR curve calculated in
12 awake bats in response to the two treatments of the FM syllable. Note that the fast-AM treatment rendered
the strongest HR responses. Area values have been z-scored for illustration purposes due to the HR variability
across animals (z-scoring does not affect the results of paired statistics reported). (F,G) Show similar results
as those reported in (D,E), but in response to the quasiconstant-frequency/frequency-modulated (qCF-FM)
syllable and its demodulated treatment. (H,I) Show the results obtained when the sinusoidally frequency
modulated syllable (SFM) was used as stimulus.
amplitude modulation (putative roughness) make signals more effective in accelerating the bats’ HR. The latter
points towards a role of fast amplitude modulation for influencing the listeners’ physiology.
Listening to fast amplitude modulated vocalizations triggers frequency-following responses in
the bat brain. Our results show clear evidence on the existence of fast amplitude modulation ~1.7 kHz in bat
distress vocalizations. Hearing rough-like sounds accelerates the bats’ heart rate. For the latter to occur, amplitude
modulation patterns related to roughness-like acoustic regimes must be represented in the bats’ brain. We inves-
tigated whether frequency-following responses (FFRs) occurred in response to fAMVs. FFRs appear as rhythmic
Scientific Reports | (2020) 10:7332 | https://doi.org/10.1038/s41598-020-64323-7 11www.nature.com/scientificreports/ www.nature.com/scientificreports
Figure 9. Fast amplitude modulated (AM) vocalizations trigger frequency following responses in the bat
brain. (A) Average neural responses to a sequence of fast-AM FM syllables across all trials and animals (n = 11)
studied. Responses are represented as voltage vs. time and in the form of neural spectrograms. (B) Same as
panel A, but in response to the sequence of demodulated FMs. Note that at frequencies ~1.7 kHz, more power
occurred in response to fast-AM than to demodulated FMs. (C) Difference between the neural spectrograms
depicted in (A,B). (D) Voltage fluctuations obtained after averaging neural responses to each fast-AM FM (red)
and each demodulated FM syllable (blue) across trials and animals. Note that responses to fast-AM FMs carried
faster modulations than those obtained in response to demodulated FMs. (E) Mean power in the range from
1.6–2 kHz across animals and sequences studied. In each animal, fast AM syllables rendered higher power than
their demodulated treatment.
brain signals occurring at the same frequency of the sensory input (i.e. 1.7 kHz in fAMVs). In humans and other
animal species, FFRs have been used to study the auditory system’s ability to process temporal periodicities50–54.
FFRs were studied by measuring intracortical electroencephalogram signals (iEEG, active electrode placed
over the auditory cortex) in 11 head-restrained, awake bats. As stimuli, the same sequences of natural fAMVs and
demodulated syllables used for measuring HR (see Fig. 7) were presented. Figure 9A,B show the average iEEG
obtained across animals in response to the sequence of FMs carrying amplitude modulation at 1.7 kHz (Fig. 9A,
top panel) and demodulated FMs (Fig. 9B, top panel). Spectrograms of the signals recorded were calculated to
assess the power relations at the FOIs in the neural responses to rough-like and demodulated FMs (Fig. 9A,B,
bottom panels). From the spectrografic representations, it is clear that responses evoked by natural fAMVs had
high power in frequencies close to 1.7 kHz. The latter becomes obvious after subtracting the two spectrograms
(Fig. 9C). Such pronounced power at frequencies close to 1.7 kHz is likely related to the occurrence of an FFR that
represents the bat auditory system’s ability to represent fast amplitude modulations occurring in distress sounds
(see below for a discussion of possible neural sources). The FFR can also be visualized as fast fluctuations in the
neural signals obtained after averaging the 20 ms time-window following the presentation of each syllable across
sequences, trials and animals (Fig. 9D, n = 24950 responses to the FM syllable).
To statistically validate the presence of FFRs in response to rough-like syllables, the average power (across
time) at the FOIs was calculated in the neural spectrograms obtained for each animal in response to each of the
six sequences studied (sequences composed of: (1) natural modulated FM syllable, (2) demodulated FM syllable,
Scientific Reports | (2020) 10:7332 | https://doi.org/10.1038/s41598-020-64323-7 12www.nature.com/scientificreports/ www.nature.com/scientificreports
(3) natural modulated qCF-FM syllable, (4) demodulated qCF-FM syllable, (5) natural modulated SFM syllable,
(6) demodulated SFM syllable). Average neural spectrograms corresponding to responses to the qCF-FM and
SFM syllables can be found in Supplementary Fig. S5. At the population level, when considering the power of the
neural responses in the range from 1.6 to 2 kHz, there were significant differences between responses to natural
fAMVs and demodulated vocalizations in all three cases studied (psignrank = 0.001 for all three cases studied,
Fig. 9E). The latter indicates that the bat auditory system is capable of representing the fast amplitude modulations
found in rough-like sounds using a temporal code.
Discussion
The main aim of this article was to study the temporal modulation pattern of distress syllables produced by bats,
a highly vocal animal group. We tested the idea that fast amplitude fluctuations (roughness-like patterns) could
be a generalized trait of mammalian vocalizations produced in distress contexts. If this hypothesis was true,
then, a large percentage of bat distress vocalizations should carry fast temporal periodicities characteristic of the
roughness regime.
Four main observations support our driving hypothesis. (i) Almost half (47.7%) of the distress syllables pro-
duced by bats (species C. perspillata) carry amplitude modulations at ~1.7 kHz and the percentage of rough-like
vocalizations is much lower during social interactions (6.3%). (ii) 1.7 kHz (putative bat roughness) is not present
as carrier frequency in bat vocalizations and, in addition, this frequency does not evoke responses in the bats’
cochlea based on non-linear mechanics. (iii) Vocalizations carrying fast amplitude modulation produce larger
heart rate increments than their demodulated versions, thus suggesting that sounds carrying rough-like patterns
can indeed elicit alarm state in bats. (iv) Rough-like vocalizations evoke frequency following responses in the
brain, suggesting that the bats’ auditory system can represent fast amplitude modulations based on a temporal
code.
Comparison with previous studies. Several studies in bats and other animal species have characterized
the amplitude modulation pattern of natural vocalizations. A recent study in the bat species Phyllostomus dis-
color (a sister species of C. perspicillata) described vocalizations carrying amplitude modulations at rates close
to 130 Hz55. Periodicity values below 500 Hz also have been described in previous studies in frogs and birds56–61,
although some of these periodicities have been linked to acoustic correlates of pitch rather than to amplitude
modulation. In humans, amplitude fluctuations occur in screamed vocalizations at amplitude modulation rates
between 30–150 Hz1. The periodicity values reported in the present article reach 1.7 kHz, that is, >10 times faster
than modulation rates reported in human screams and at least 8 times faster than modulation rates reported in
other vertebrates57,60, including other bat species55. Note that describing a sound as rough implies a perceptual
evaluation of the acoustic waves heard. Throughout this article we referred to rough-like or fast amplitude mod-
ulated sounds because we cannot know what other animals perceive when they listen to amplitude modulation.
It is possible that amplitude modulation frequencies linked to the perception of roughness differs across species.
If this is the case, then researchers need to re-define the concept of “roughness” to fast amplitude modulations or
transients that (at least in humans) remain perceived as discrete events (i.e. below the pitch percept62).
Our data suggests that amplitude modulations at ~1.7 kHz could be a hallmark feature of distress calling in
bats, since the percentage of rough-like vocalizations is much lower in social contexts (distress: 47.7% vs social:
6.3%). Note that our definition of social context is quite broad and could include several types of interactions
between bats such as grooming, mating, aggression, appeasement, among others. Our assumption was that
non-aggressive interactions would prevail in the group of bats studied. The latter was ensured by waiting 7 days
before conducting acoustic recordings. Though likely fulfilled, our assumption is impossible to prove without
video feeds depicting bat interactions. Future studies could try to quantify the occurrence of amplitude mod-
ulations in call types matched to specific behaviors. Such approach has been used before but without looking
specifically at the pattern of amplitude modulation of single syllables35,63–66. In humans, acoustic roughness is not
specific to fearful screams. This feature also has been found in other harsh sounding vocalization types such as
infant cries3. The same could be true for bats.
Bats and humans are phylogenetically distant species that do not share common ecological niches. Yet, in both
species fast temporal periodicities are present in vocalizations emitted in distressful contexts. According to our
data, in bats, the average ratio between peak frequency (the main carrier frequency) and amplitude modulation
frequency is equal to 15.2 (see Results). It is difficult to estimate this ratio for human screams. The original study
describing human roughness (ref. 1) did not report peak frequency values of screamed vocalizations. A recent
study on human screams did report peak frequency and roughness values of screams (ref. 2) but they estimated
roughness using a different approach that renders unitless values. Considering 21 sounds that were classified as
screams by at least 95% of the participants in the Schwartz et al. study2, one can calculate an average mean peak
frequency of 1929 Hz. If all these sounds carried roughness at values ~90 Hz (the center of the roughness regime
reported by Arnal et al.1, we could calculate a peak frequency/roughness ratio of 19.3 for human participants. The
ratio calculated from bat data (15.2, this study) and that calculated from human data (after estimations) do not
appear to be far off from each other. A possible interpretation of this result is that the two species separate carrier
and modulator frequencies by a similar ratio. Future studies could explore what specializations (if any) exist in the
auditory system for processing carriers and modulators separated by this ratio.
We want to point out that although a roughness-like acoustic regime is a likely candidate for explaining the
fast amplitude modulations observed in the bat vocalizations, temporally periodic structures leading to complex
spectra could also be related to non-linear phonation phenomena such as “torus” and “deterministic chaos”67–69.
In bats, these two explanations (roughness-like patterns and non-linear phenomena) might not be mutually
exclusive. Non-linear phenomena are identified based on the sounds’ spectrograms while acoustic roughness is
identified based on the sounds’ oscillogram. Therefore, it is difficult to disentangle between these two phenomena
Scientific Reports | (2020) 10:7332 | https://doi.org/10.1038/s41598-020-64323-7 13www.nature.com/scientificreports/ www.nature.com/scientificreports
(roughness vs. vocal non-linearities). In other words, it remains open if roughness and non-linear phenomena are
the same thing measured in different ways.
Previous studies in bats have reported the occurrence of non-linear phenomena64,66. Particularly deterministic
chaos appears to be linked specifically to high aggression contexts66. The occurrence of non-linearities during
vocalization production is ubiquitous in vertebrates64,66,69–72. It has been argued that non-linear sounds result
from saturation in the vocal production apparatus, and that their generation does not require complex neural con-
trol mechanisms67,69. Yet, non-linearities occur in sounds uttered by several vertebrate species, including human
infants, and they capture the listeners’ attention due to their non-predictable structure (for review see ref. 67). It
has also been argued that non-linear sounds prevent behavioral habituation73. The presence of spectro-temporally
complex sounds (like the rough-like vocalizations reported here) within bat distress broadcasts could make emit-
ted signals more successful in grabbing the listeners’ attention. Most bat distress sequences are long (>1 s) and
repetitive, since the same syllable spectro-temporal design is used throughout the broadcast24,65. Our data indi-
cates that rough-like syllables occur at different positions within distress sequences but there is a preference for
these sounds to occur at the beginning of the broadcasts (see Fig. 2G). One could speculate that a listener exposed
to sequences with transitions between rough and non-rough sounds could experience less neuronal adaptation
of responses to the individual syllables. Future studies could explore this possibility by studying phenomena such
as stimulus specific adaptation74,75 in response to combinations of fast and slow temporally modulated sounds at
the neuronal level.
Note that the present study presents evidence on the occurrence of rough-like patterns during distress calling
in bats and the effect of these calls on the listeners’ physiology and brain processes, but we do not present any
evidence of bats producing these sounds “intentionally”. It has been suggested that in humans, growl-like voices
(related to anger) could be a byproduct of abdominal muscle contraction which changes resonances in the vocal
tract4. Abdominal muscle contraction is a mechanism for enhancing spine stability76, which in turn is funda-
mental for achieving advantageous postures to produce and/or withstand physical attacks in distressful contexts.
The mechanism that accounts for growl-like voices in humans is largely reactive and could account as well for
roughness in human screams and even for the fast amplitude modulations reported in the present study in bat
distress calls.
Possible neural mechanisms for roughness extraction. Our data shows that the presence of rough-
ness accelerates the heart rate of awake bats. This indicates that fast amplitude fluctuations are extracted some-
how in the bats’ brain. Note that the audiogram of most bat species is shifted towards ultrasonic frequencies
(>20 kHz). For example, auditory thresholds in C. perspicillata have values above 70 dB SPL for frequencies below
10 kHz39,41. In fact, the DPOAE measurements presented here showed no cochlear responses to low frequency
sounds below 5 kHz. According to our data, sound pressure level measured at ~1.7 kHz is very low (average values
~0 dB SPL), which further hampers its representation at the cochlear level.
Two possibilities come to mind when thinking about neural strategies for coding fast periodicities related to
roughness: (i) the use of spectral harmonic codes and (ii) temporal codes77,78. Spectral harmonic coding does not
depend on a region of the cochlea being able to extract low frequencies that are poorly represented as carriers but
rather on the ability of the cochlea to resolve closely placed harmonics of the modulator57. Whether the cochlea
of C. perspicillata can resolve harmonics separated by 1.7 kHz remains to be tested. It has been argued that the
exact periodicity value at which a switch from temporal to spectral coding occurs might differ across species57.
At least in the auditory nerve of squirrel monkeys, spiking activity can statistically lock to the occurrence of peri-
odicity cycles for frequencies up to 5 kHz (temporal coding79). If the same is assumed for bats, then the 1.7 kHz
modulation shown here could be encoded in auditory nerve activity patterns. FFR measurements reported in this
manuscript are in agreement with this idea.
We show that surface potentials represent the fast temporal periodicities occurring at frequencies ~1.7 kHz
based on a temporal code. Note that FFRs in response to amplitude fluctuations faster than 1 kHz are not unique
to bats51. Our recordings were based on surface potentials (iEEG) that are suited for studying whole-brain activ-
ity, but are not ideal for identifying possible generators contributing to the neural signal measured. iEEGs can be
influenced even by signals such as the cochlear microphonic, reflecting the response of hair cells rather than cen-
tral neural generators80. Previous studies measuring FFRs in humans concluded that FFRs obtained in response
to fast frequencies (i.e. >100 Hz) typically result from activity in subcortical structures 53,81,82. The same could
be true for C. perspicillata, since in this species most auditory cortex neurons cannot track amplitude modu-
lations above 20 Hz30,83, even though field potentials measured at the cortical level do entrain to faster acoustic
rhythms27,28. Note that structures outside the classical ascending auditory pathway could also be involved in the
representation of rough sounds. For example, the amygdala is a likely candidate for providing such representa-
tions. In humans, this structure is differentially activated by screamed and non-screamed sounds1. In bats, electric
stimulation of the amygdala triggers changes in heart rate48. It is thus plausible to suggest an involvement of the
amygdala in the elevated HRs reported in this article in response to rough sounds.
Taken together, the findings reported in this manuscript indicate that bats can utter sounds that carry superfast
temporal modulations in the order of kHz. Such sounds are more likely to occur in distress contexts and, albeit
many differences, they share similarities with the acoustic correlates of roughness found in human screams1,2.
Rough-like sounds are represented in the bats’ auditory system by means of frequency following responses and
they accelerate the bats’ heart rate, an autonomic response to alarm signals that could be instrumental for the bats’
survival.
Scientific Reports | (2020) 10:7332 | https://doi.org/10.1038/s41598-020-64323-7 14You can also read