The Economic Significance of the Australian Logistics Industry
←
→
Page content transcription
If your browser does not render page correctly, please read the page content below
The Economic Significance of
the Australian Logistics Industry

                             C O N S U L T I N G
ACIL Allen Consulting Pty Ltd        Level Nine, 60 Collins Street      Suite C2 Centa Building,
        ABN 68 102 652 148                   Melbourne VIC 3000 Australia       118 Railway Street
                                             T+61 3 8650 6000                   West Perth WA 6005         Australian Logistics Council
         Level
ACIL Allen      Fifteen,Pty
            Consulting   127Ltd
                             CreekLevel Nine, 60 Collins Street
                                             F+61 3 9654 6363 Suite C2 Centa       Building,
                                                                                Australia                  PO Box 20 DEAKIN WEST ACT 2600
ABN 68 Street
         102 652 148               Melbourne VIC 3000 Australia     118 Railway Street
                                                                                T+61 8 9449 9600
         Brisbane QLD 4000 Australia                                                                       17b National Press Club Building,
                                   T+61 3 8650 6000                 West Perth WA 6005
Level Fifteen,                                                                  F+61 8 9322 3955           16 National Circuit, Barton, ACT, 2600
         T+61 7 3009 8700                    Level
                                   F+61 3 9654     One, 50 Pitt Street
                                                6363                Australia
127 Creek Street                                                                                           P: +61 2 6273 0755 F: +61 2 6273 3073
         F+61 7 3009 8799                    Sydney NSW 2000 Australia
                                                                    T+61 8 9449 9600
Brisbane QLD 4000 Australia                                                     acilallen.com.au
                                             T+61 2 8272 5100       F+61 8 9322 3955
T+61 7 3009
         Level8700                 Level One, 50 Pitt Street
                Two, 33 Ainslie Place                                                                      E: admin@austlogistics.com.au
F+61 7 3009    8799 ACT 2600 Australia
                                   Sydney NSWF+61  2 9247
                                                2000        2455
                                                       Australia
         Canberra                                                               © ACIL Allen               austlogistics.com.au
                                                                    acilallen.com.au
         T+61   2 6103  8200       T+61 2 8272 5100                             Consulting 2014
Level Two, 33 Ainslie Place
         F+61   2 6103  8233       F+61 2 9247 2455
Canberra ACT 2600 Australia                                         © ACIL Allen
T+61 2 6103 8200                                                  Consulting 2014
F+61 2 6103 8233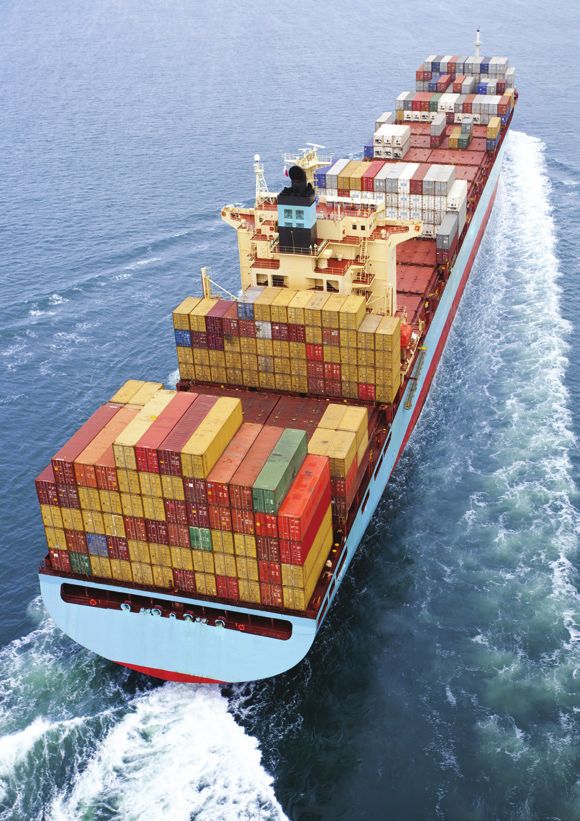
C O N S U L T I N G

Executive summary
 Key Findings

 •   Logistics is an end-to-end supply chain activity which is not well-represented by the system of
     national accounts.
 •   Australia’s Logistics industry was estimated to account for 8.6 per cent of GDP, adding $131.6 billion
     to Australia’s economy in 2013.
 •   The Logistics industry is estimated to employ 1.2 million people.
 •   In 2011–12 BITRE estimated that the domestic freight task totalled almost 600 billion tonne kilometres
     —equivalent to about 26,000 tonne kilometres of freight moved for every person in Australia.
 •   An increase in Logistics total factor productivity of 1% is estimated to increase GDP by $2 billion.
 •   Many issues currently affecting Logistics will impact the industry’s future productivity.

This report estimates the size of Australia’s Logistics industry, which is not well represented by the system of
national accounts. In arriving at this estimate, this report has used the following definition of logistics:

     Logistics management is that part of supply chain management that plans,
     implements, and controls the efficient, effective forward and reverses flow and
     storage of goods, services and related information between the point of origin
     and the point of consumption in order to meet customers’ requirements.

                                                    Council of Supply Chain Management Professionals, 2014

                                                               The Economic Significance of the Australian Logistics Industry                i
The efficiency of Australia’s Logistics industry is vital to the nation’s productivity and wellbeing. Measures of
1

         the economic significance of transport are reported by the Australian Bureau of Statistics but they significantly
         understate the expenditure on Logistics because they do not record these services when they are undertaken
         by firms on their own account and they fail to capture logistics activities not directly related to the movement of
         Where
         physicaldoes  freight move in Australia
                  goods.
         The
          ACILAustralian
                Allen hasfreight
                            madetask
                                   an isestimate
                                         diverse, of
                                                  and  encompasses
                                                     the true size andtheimpact
                                                                          movement    of bulk export
                                                                                 of Logistics        commodities,
                                                                                               in Australia         such as that
                                                                                                            and estimated
         iron ore, coal, liquefied natural  gas (LNG)  and  grains, the transport of imported   motor  vehicles, machinery
          Logistics employs 1.2 million people and added $131.6 billion dollars to Australia’s economy in 2013. This
         and other manufactured goods, and the transport of finished products for household consumption through
          represents 8.6 per cent of the nation’s GDP in 2013. The major movements of freight around Australia are
         distribution centres to retail outlets. Figure 2 provides a stylistic representation of the major elements of
          shown below:
         Australian freight movements in 2011–12. Several of the more notable aspects of the freight task are
         described below.
            Figure ES 1 Major freight movements around Australia
         Figure 2: Major freight flows in Australia, 2011–12

         Note:     Line widths show relative freight volume (tonnes). Share estimates related to freight tonne kilometres.
         Source:   ABS (2013), ARA (2013), BITRE (2010b, 2013a, 2013b) and BITRE estimates.
         Note: The figure above is a stylistic representation of the major elements of Australian freight movements in 2011–12.
         Rail freightshow relative freight volume (tonnes). The percentage shares are related to freight tonne kilometres.
         Line widths
         Source: Freightline 1, BITRE, 2014
         Rail is dominated by transport of bulk freight over longer distances and plays a significant role in transporting
          Every rice,
         grains,  industry  in Australia
                       cotton   and sugar depends       on transport
                                             for processing            and logistics to some degree. Low cost transport and
                                                             and/or export:
          logistics  allows   Australian    exporters   to profitably  reach   key markets, helps Australian manufacturers to keep
         • Iron ore and coal together account for over 80 per cent (in tonne kilometre terms) of all rail freight.
          cost-competitive in the face of cheap imports and enables firms within Australia to compete over a larger area,
         •bringing
              Grains,lower
                       sugar,prices
                               fertilisers
                                      and and   otherchoice
                                            greater    bulk products   accountUsing
                                                              to consumers.       for a further   8 per cent
                                                                                         Computable          of all Equilibrium
                                                                                                          General   rail freight. ACIL Allen has
         •estimated
              Non-bulk that
                         railafreight,
                                1 per cent
                                         whichimprovement      in the8efficiency
                                                comprises around       per cent ofoftotal
                                                                                      this rail
                                                                                           industry   generates
                                                                                                freight,           $2 billiononofthe
                                                                                                         is most significant      gains to the
              long Eastern
          economy      each states–Perth
                              year.           corridor, where it accounts for the majority of intercapital origin–destination
              non-bulk freight, and the Melbourne–Brisbane corridor, where it has roughly about 30 per cent share of
          There   are risksnon-bulk
              intercapital   to the efficiency
                                        freight. Onof other
                                                      Logistics   in Australia,
                                                            corridors,           for example
                                                                         rail carries            urban congestion,
                                                                                      a much smaller                    inefficient
                                                                                                         share of intercapital   non-regulation,
          an ageing    workforce and difficulty in identifying and investing in infrastructure because of financing and
              bulk freight.
          planning constraints.

3

    ii
C O N S U L T I N G

List of Abbreviations
ABARE   Australian Bureau of Agriculture and Resource Economics
ABS     Australian Bureau of Statistics
ALC     Australian Logistics Council
ARTC    Australian Rail Track Corporation
BITRE   Bureau of Infrastructure, Transport and Regional Economics
BREE    Bureau of Resource and Energy Economics
GDP     Gross Domestic Product, a measure of economic activity
GVA     Gross Value Added, the revenue from an activity less the cost of intermediate inputs
Mtpa    Million tonnes per annum
Ntk     Net tonne kilometre
TEU     Twenty Foot Equivalent Container (a standard measure)

                                                     The Economic Significance of the Australian Logistics Industry                   iii
C O N S U L T I N G

Contents
Executive summary.................................................................................................................................................................................................... i

List of Abbreviations............................................................................................................................................................................................. iii

1.        Introduction............................................................................................................................................................................................................. 1

2. The Australian transport task....................................................................................................................................................... 3
2.1 Rail freight........................................................................................................................................................................................................................ 5
2.2 Road freight.................................................................................................................................................................................................................... 6
2.3 Air freight.......................................................................................................................................................................................................................... 8
2.4 Sea freight........................................................................................................................................................................................................................ 8
2.5 Warehousing and postal services............................................................................................................................................................ 9

3. Modelling the impact of the Logistics industry...............................................................................................11

4. Current issues in Logistics.............................................................................................................................................................17
          4.1.1 Harmonising regulation and reducing bureaucracy........................................................................................................17
          4.1.2 Securing adequate investment in infrastructure................................................................................................................18
          4.1.3 Identifying and then efficiently delivering key infrastructure projects................................................................19
          4.1.4 Adopting whole-of supply chain planning..............................................................................................................................19
          4.1.5 A desire to make greater use of railways.................................................................................................................................19
          4.1.6 High productivity vehicle access and charging................................................................................................................. 20
          4.1.7 Establishing a network of efficient intermodal facilities............................................................................................... 20
          4.1.8 Giving freight a voice in urban planning................................................................................................................................... 20

Appendix A: Estimating the size of the Logistics industry........................................................................ 21

Appendix B: The Tasman Global model.................................................................................................................................. 35

                                                                                                                                The Economic Significance of the Australian Logistics Industry                                                            v
List of figures
     Figure 1             Australian freight volumes by transport mode, FY2006 to FY2012................................................................... 3
     Figure 2             Major freight flows in Australia, FY2012.................................................................................................................................... 4
     Figure 3             Historical and projected freight task, FY1972 to FY2040........................................................................................... 4
     Figure 4             Australian rail network............................................................................................................................................................................. 5
     Figure 5             Allocation of road freight by area served................................................................................................................................. 7
     Figure 6             Inter-regional road freight task, FY2001................................................................................................................................... 7
     Figure 7             Australian port-related freight by volume, FY2012........................................................................................................... 8
     Figure 8             Australian port-related freight by value, FY2012................................................................................................................ 9
     Figure 9             Change in real output by broad industry, relative to the reference case:-
                          +1 per cent scenario.............................................................................................................................................................................13
     Figure 10 Change in employment by occupation (1-digit ANZSCO), FTE jobs:- +1 per cent scenario.......14
     Figure 11 Change in employment by occupation (3-digit ANZSCO), FTE jobs:- +1 per cent scenario.......15
     Figure A1 Summary of our methodology....................................................................................................................................................... 25
     Figure A2 Size of the true transport industry.............................................................................................................................................. 30
     Figure A3 Logistics costs as a percentage of GDP for selected countries........................................................................ 33

     List of tables
     Table 1              Projected macroeconomic impacts of change in Logistics industry factor productivity,
                          relative to the reference case...........................................................................................................................................................12
     Table 2              Decomposition of the projected change in Australian real GDP and real income
                          under +1 per cent factor productivity, relative to the reference case..............................................................13
     Table A1             Floor and ceiling cost proposal for the Pilbara Infrastructure.............................................................................. 28
     Table A2             Estimated floor and ceiling costs of Pilbara Railways................................................................................................. 29
     Table A3             Domestic road transport of goods in the EU (1995,1985)....................................................................................... 32
     Table B1             Industries in the Tasman Global database.......................................................................................................................... 36

vi
C O N S U L T I N G

1. Introduction
 Key Finding 1

 •   Logistics involves more than just transport of goods, it is an end-to-end supply chain process.
 •   Australia’s system of national accounts does not capture all the logistics activities undertaken.
 •   The efficiency of logistics is important to Australia’s productivity because the industry affects all of
     Australia’s other industries.
 •   Efficient logistics costs enable competition over larger areas, crucial for the export performance of
     key industries, and for competitive domestic industries.

Australia’s system of national accounts measures the economic impact of a industry called Transport, Portal
and Warehousing which includes transport, postal services, warehousing and other transport support services
offered to customers across all industries in Australia.
By only recording transport services offered to third parties (called ‘Hire and Reward’ services) the national
accounts miss a significant amount of freight transport that is carried out by companies on their own account
(so called ‘ancillary transport’) and which is allocated in the national accounts to the primary industry of those
companies.
Even including ancillary transport leaves an industry definition that is very narrow and misses many of the
logistics activities that must be undertaken to bring goods to customers. There are many possible definitions
of logistics, but a definition which has been adopted for this analysis is:

     Logistics management is that part of supply chain management that plans,
     implements, and controls the efficient, effective forward and reverses flow and
     storage of goods, services and related information between the point of origin
     and the point of consumption in order to meet customers’ requirements.

                                                     Council of Supply Chain Management Professionals, 2014

Under this definition there are clearly many more tasks to logistics than the transport task. The Transport,
Postal and Warehousing industry definition fails to capture these logistics activities except the physical
movement and storage of goods.
The logistics industry encompasses the transport industry (including ancillary transport) to define and quantify
the Australian Logistics (Logistics) industry and capture the economic activity undertaken by firms across
Australia in managing and operating their supply chains. This definition represents the costs of Logistics borne
by Australian industries and represents the overall significance of the true Logistics industry.
The Logistics industry affects every industry. Australia is a large country and one which is geographically
isolated from many key international markets. The efficient movement of goods and information along the
supply chains of Australian companies is central to Australia’s ability to compete in international markets, and
to compete with imports to the domestic market. Efficient logistics allow suppliers to compete across a larger
distance, enabling greater competition within the country and resulting in benefits to consumers.
‘Productivity’ is what goods and services an economic actor (business, government, state, nation, etc.)
receives for what it ‘puts in’, in terms of labour, capital and other factors of production. Productivity growth is
a critical element in delivering an enhanced standard of living, meeting environmental obligations and coping
with population growth. In the decade to 2011 Australia’s productivity growth stagnated, averaging below one
per cent per annum over the 9 years to 2010/11. This means that over that time period economic growth was
mostly generated from increases in population and labour participation, and Australia’s increasing wealth was

                                                               The Economic Significance of the Australian Logistics Industry                    1
driven largely by a favourable movement in the nation’s terms of trade. In the past two years productivity has
    been double the average over the preceding nine years with economic conditions leading to a period or relative
    restraint in wage claims, however this performance cannot be guaranteed to continue.
    Logistics is a critical element in the productivity of the nation. The true Logistics industry is estimated to
    represent 8.6 per cent of the nation’s Gross Domestic Product, it is a significant cost in Australia’s bulk export
    trades, and Australia’s significant import of manufactured goods means that efficient supply chains from ports
    to customers are essential for ensuring that consumers of imported goods are receiving the goods at the lowest
    possible prices.
    There are challenges to the efficiency of the Logistics industry. Fuel prices remain high, regulatory burdens to
    the industry have increased and state and national regimes overlap, as do the scopes of different regulatory
    agencies, creating costly duplication and confusion. Urban congestion is slowing the nation’s roads and
    hindering pick up and delivery activities for all modes of transport. Urban encroachment is hindering planning
    approvals and development of necessary infrastructure, including: railways, roads, airports, port expansions
    and intermodal facilities.
    The Australian Logistics Council’s focus is to improve the productivity, efficiency and safety of the freight logistics
    industry. It has commissioned this report from ACIL Allen Consulting (ACIL Allen) to develop an estimate of the
    size of the ‘true’ Logistics industry, which combines the Hire and Reward and Ancillary transport operations
    and estimates the scale of supporting logistics activities. Details of ACIL Allen’s calculations are contained in
    Appendix A.

2
C O N S U L T I N G
2. The Australian transport task
Key Finding 2
• In 2011–12 BITRE estimates that the domestic freight task totalled almost 600 billion tonne kilometres
—equivalent to about 26,000 tonne kilometres of freight moved for every person in Australia.
• Australia’s freight task is projected to increase by 80 per cent between 2010 and 2030 with this rate
of growth seeing freight triple by 2050.
• By volume rail freight has grown largely as a result of increasing bulk exports.
• On a number of intercapital and regional corridors road freight have increased their share of the freight task.
• Higher productivity road freight vehicles will have an important role in road accommodating this freight growth.
• Rail freight supported by improved rail infrastructure, can also play an important role in accommodating
this freight growth
• Access to ports will be critical to ensure projected growth of bulk exports and imports can move efficiently
to their destinations.
ACIL Allen estimates that the Logistics industry directly contributed $111.5 billion to Australia’s GDP in 2010,
or if using the same GDP share, $131.6 billion in 2013. What does this value mean in terms of the movement
of goods around Australia?
A common measure of freight task, particularly for the movement of bulk goods, is net tonne kilometres (‘ntk’),
one net tonne kilometre is the equivalent to one tonne of freight moved one kilometre. In 2011–12 BITRE
estimates that the domestic freight task totalled almost 600 billion tonne kilometres—equivalent to about
26,000 tonne kilometres of freight moved for every person in Australia.
The figure below shows the growth of freight in Australia overAtime,
CIL Aand
L L Eshows
N C O Nthe
S Uincreasing
LTING dominance of
bulk freight movements on rail as Australia supplied an increasingly large share of the world export market.
Figure 1 Australian freight volumes by transport mode, FY2006 to FY2012
Figure 1 Australian freight volumes by transport mode, FY2006 to FY2012
Source:
Source: Freightline
Freightline 1, BITRE,
1, BITRE, MayMay 2014
2014
The The
significant freight
significant movements
freight by volume
movements are related
by volume to bulk
are related ore movements:
to bulk ore movements:
—• IronIron
ore ore
exports fromfrom
exports the the
Pilbara
Pilbara
—• CoalCoal
exports from Newcastle or Hay Point
exports from Newcastle or Hay Point
• Coal exports, bauxite imports, cement and alumina exports from Gladstone. The geography of Australia’s
— freight Coaltask
exports, bauxite imports, cement and alumina exports from
is illustrated in Figure 2 below:
Gladstone. The geography of Australia’s freight task is illustrated in Figure 2
below:
The Economic Significance of the Australian Logistics Industry 3Where does freight move in Australia
The Australian freight task is diverse, and encompasses the movement of bulk export commodities, such as
iron ore, coal, liquefied natural gas (LNG) and grains, the transport of imported motor vehicles, machinery
and other manufactured goods, and the transport of finished products for household consumption through
distribution centres to retail outlets. Figure 2 provides a stylistic representation of the major elements of
Australian freight movements in 2011–12. Several of the more notable aspects of the freight task are
described below.
Figure 2 Major freight flows in Australia, FY2012
Figure 2: Major freight flows in Australia, 2011–12
Note: Line widths show relative freight volume (tonnes). Share estimates related to freight tonne kilometres.
Source: ABS (2013), ARA (2013), BITRE (2010b, 2013a, 2013b) and BITRE estimates.
Note: The figure above is a stylistic representation of the major elements of Australian freight movements in 2011–12.
Rail freightshow relative freight volume (tonnes). The percentage shares are related to freight tonne kilometres.
Line widths
Source: Freightline 1, BITRE, May 2014
Rail is dominated by transport of bulk freight over longer distances and plays a significant role in transporting
Australia’s
grains, freightand
rice, cotton tasksugar
is projected to increase
for processing and/or by 80 per cent between 2010 and 2030, with the BITRE’s
export:
ACIL ALLEN CONSULTING
latest projections shown below:
• Iron ore and coal together account for over 80 per cent (in tonne kilometre terms) of all rail freight.
Figure 3 • Historical and projected
Grains, sugar, fertilisers freight
and other bulk task,
products FY1972
account to FY2040
for a further 8 per cent of all rail freight.
Figure 3 Historical and projected freight task, FY1972 to FY2040
• Non-bulk rail freight, which comprises around 8 per cent of total rail freight, is most significant on the
long Eastern states–Perth corridor, where it accounts for the majority of intercapital origin–destination
non-bulk freight, and the Melbourne–Brisbane corridor, where it has roughly about 30 per cent share of
intercapital non-bulk freight. On other corridors, rail carries a much smaller share of intercapital non-
bulk freight.
3
Source: Freightline 1, BITRE, May 2014.
Source: Freightline 1, BITRE, May 2014.
The expected growth in road and rail freight are expected to put significant pressure on key
rail corridors and many road networks which will also have to contend with increasing urban
congestion
4
related to growth of passenger vehicles and trips.C O N S U L T I N G
The expected growth in road and rail freight are expected to put significant pressure on key rail corridors
and many road networks which will also have to contend with increasing urban congestion related to growth
of passenger vehicles and trips.
2.1 Rail freight
Industry studies estimate that across Australia 929 million tonnes were transported on rail in 20121, BITRE
estimates2 that 290.6 billion Ntks of bulk goods were moved in 2012 which would imply the average loaded
haul was 313 kilometres.
ACIL ALLEN CONSULTING
There are estimated to be over 40,000 kilometres of railways across Australia, as shown in Figure 4 below.
FigureAustralian
Figure 4 rail network
4 Australian rail network
Source: ARA, 2004
Source: ARA, 2004
The recent resurgence in rail freight is driven by the movement of bulk ores and continued
The recent resurgence growth
in rail of long haul
freight freight toby
is driven Perth.
theRail has been losing
movement modeores
of bulk shareand
to road freight overgrowth
continued the of long
past
haul freight to Perth. Rail decade
has been on losing
shorter hauls
mode such as Melbourne-Sydney
share to road freightand Sydney-Brisbane.
over the past decade on shorter hauls
such as Melbourne-Sydney and railways
The Pilbara Sydney-Brisbane.
are the most productive in the world with almost 3,000 kilometres of rail
and capacity in excess of 600 Mtpa.
The Pilbara railways are the most productive in the world with almost 3,000 kilometres of rail and capacity in
excess of 600 Mtpa. ARTC manages over 8,500 kilometres of Australia’s interstate track, as well as the Hunter
Valley Network. It is currently in discussions with Queensland Rail (QR) over government
ARTC manages over 8,500 plans kilometres
to transfer the of Australia’s
management interstate
of up track, as
to 7,000 kilometres well track.
of QR’s as the HunterrailValley Network. It is
Brookfield
currently in discussionsowns
withthe interstate trackRail
Queensland from(QR)
Kalgoorlie
overtogovernment
Perth as well asplans
other track in Westernthe
to transfer Australia.
management of up
Asciano,
to 7,000 kilometres of QR’s Aurizon
track. and SCT are
Brookfield theowns
Rail main train
theoperators operating
interstate trackintercapital container to Perth as well as
from Kalgoorlie
services. Over
other track in Western Australia. 70 per cent
Asciano, (up to 90and
Aurizon per cent)
SCTofarethe contestable
the main container freight between
train operators operating intercapital
Sydney/Melbourne and Perth is moved by rail.
container services. Over 70 per cent (up to 90 per cent) of the contestable container freight between Sydney/
Melbourne and Perth isThe Adelaide-Darwin
moved by rail. railway line commenced operations in 2004, the line from Alice
Springs to Darwin. Its 1,420 kilometres of rail was sold to Genesee and Wyoming Australia
(GWA) in 2010. It is estimated that GWA currently serves 90-95 per cent of the contestable
1 Freight on Rail, ARA, 2013.
2 Freightliner 1, BITRE, May 2014. 7
ECONOMIC SIGNIFICANCE OF THE AUSTRALIAN LOGISTICS INDUSTRY
The Economic Significance of the Australian Logistics Industry 5The Adelaide-Darwin railway line commenced operations in 2004, with the completion of the line from Alice
Springs to Darwin. Its 1,420 kilometres of rail was sold to Genesee and Wyoming Australia (GWA) in 2010. It is
estimated that GWA currently serves 90–95 per cent of the contestable container market between Adelaide and
Darwin—this is carried on 6 services per week3. Significant growth is occurring as a result of mineral and ore
mine developments within 300 kilometres of the two termini of the line at Adelaide and Darwin.
Significant investments are also being made in urban and short haul rail services, with supply chain infrastructure
investments in port and intermodal terminals by companies such as Qube Logistics, which also operates short
haul rail services.
The Australian Government has also made a commitment to the inland freight railway between Melbourne
and Brisbane by committing $300 million to ARTC to undertake pre-construction activities such as detailed
corridor planning, environmental assessments, community consultation and land acquisition. The inland
railway would reduce transit times between the two cities, improve rail connectivity for rural businesses along
its length and would enable the operation of longer and higher productivity freight trains on the corridor. It
would also provide an improved crossing of the Toowoomba Range and would link to the Port of Brisbane via
Acacia Ridge, reducing supply chain costs. Furthermore, the railway would create additional rail capacity on the
Melbourne‑Sydney and Sydney-Brisbane corridors, which could be used in satisfying the growing freight task
on those corridors.
2.2 Road freight
Australia’s road freight task has continued to grow with little moderation by competing modes. Over 95 per cent
of Australia’s road freight is carried in heavy vehicles weighing 4.5 tonnes or more. The B-Double is the most
significant heavy vehicle combination accounting for 40 per cent of all freight movement4. This is significant
given that B-Doubles operate on a restricted road network.
Advances in vehicle technology have allowed freight to be moved on Australia’s roads for a relatively low
unit cost. The adoption of heavy vehicle reforms should open the door to more high productivity vehicle
combinations such as B-Triples, which will allow road to maintain its growth without a matching increase in
the numbers of trucks on the roads. Congestion and fuel costs remain key issues for road freight, as does
the potential for staff shortages as the current workforce ages. Reform of road investment and heavy vehicle
charging also present opportunities and risks for road freight.
The freight task undertaken on road (measured in Ntks) is split as shown in Figure 5 below:
3 Genesee & Wyoming Services, GWA Australia webpage, http://www.gwrr.com/operations/railroads/australia/genesee_wyoming_
australia/gwa_services, accessed 13 June 2014.
4 That is, including urban freight.
6Road freight in capital cities accounted for over one fifth of total road freight in Australia 2011–12, with
road freight in other urban areas outside capital cities comprising a further 10 per cent. Intercapital road
freight accounts for an approximately 18–19 per cent of total road freight movements. The remaining, C O N S U L T I N G
approximately 50 per cent, comprises freight transported between capital cities and regional areas and
other inter- and intrastate freight. ACIL ALLEN CONSULTING
Figure 5 Allocation of road freight by area served
Over 95 per cent of Australia’s
Figure 5 Allocation of road freight
road freight is carried
by area served in heavy vehicles (i.e. vehicles weighing 4.5 tonnes
2
or more). Articulated trucks accounted for around 78 per cent and heavy rigid trucks approximately 18
per cent of total road freight, and these shares are little changed over the last decade or so (ABS 2013).
B-double heavy vehicle combinations are now the most significant road freight vehicle combination,
accounting for around 40 per cent of total road freight in 2011–12.
Notwithstanding their contribution to the freight task, however, freight vehicles account for less than 10
per cent of total road use—light vehicles account for approximately 92 per cent of vehicles on the road.
ure 3 illustrates where road freight moves across the road network, showing road freight volumes across
non-urban transport network in 2000–01—the last time a comprehensive survey of regional road freight
ovements was undertaken across Australia. The figure highlights the significance of road freight volumes on
National Land Transport Network, and particularly on the Hume Highway (between Sydney and
lbourne), Pacific Highway (Sydney–Brisbane) and Newell Highway (Melbourne–Brisbane). Freight volumes
oss the NationalSource:
LandFreightline
Transport 1. BITRE, Network
May 2014. accounted for approximately 25 per cent of all road freight in
00-01. The ABS isThe undertaking a survey
›Source: Freightline 1. BITRE, May 2014
use ofof the
the road
of regional road ten freight movements in 2013–14, which will provide
The use roadnetwork
networkwaswas
last last
investigated in detailinover
investigated yearsten
detail over agoyears
and the figure
ago and the figure below illustrates
dated estimates of the regional
below illustrates
major road
the major
road freight freight
road freightmovements
corridors: corridors: across Australia.
ure 3: Inter-regional
Figure 6 road freight
Inter-regional task,task,
road freight 2000–01
FY2001.
9
ECONOMIC SIGNIFICANCE OF THE AUSTRALIAN LOGISTICS INDUSTRY
rce: ABS (2002) and BITRE
Source: estimates.
Freightline 1. BITRE, May 2014.
Since there are no public records of what is carried in containers on the back of trucks estimates of the freight task
on road are typically conjecture and educated guesses, or based on samples periodically undertaken by the ABS.
Articulated trucks are trucks comprising a prime mover towing one or more The
trailers attached
Economic by aofturntable.
Significance the Australian Logistics Industry 7Sea freight
Shipping and ports are an important interface with the land freight task, transporting Australian-made goods
and raw materials between major domestic centres and gateways for international trade.
• Coastal shipping is responsible for around 17 per cent of total domestic freight movements (measured in
mass distance terms) and comprises 10 per cent of total freight volumes through Australian ports. Bulk
2.3 Air freight
commodities, such as aluminium ores, iron ore and petroleum, account for over 70 per cent of domestic
coastal shipping movements—transport of bauxite between Weipa and Gladstone (in Queensland) and
Air freight
iron is athe
ore from small element
Pilbara of Kembla
to Port Australia’s overall
alone task, suited
accounted to moving
for 30 per cent andhigh-value and
20 per cent, time-critical goods such
respectively,
astotal
of parcels and seafood.
domestic BITRE
sea freight. estimates
Eastern that in
states–Perth 2012
and Bassonly 0.3
Strait billion together
shipping Ntks wasaccount
carriedfor
byover
air, this is less than
18
0.1per
percent
centofoftotal coastal shipping
Australia’s movements
total freight (see Figure
task. Airports often2).have nearby freight precincts to handle parcels and
• competition
In 2011–12, thewith passenger
volumes vehicles accessing
of merchandise imports andairports
exportscan lead approximately
totalled to significant congestion
1110 millionissues.
tonnes—exports of 1014 million tonnes and imports of 99 million tonnes—with a total trade value of
$A528 billion free on board (FOB)—exports: $264.2 billion and imports $264.4 billion.
2.4 Sea freight
• By volume, the major iron ore and coal exporting ports—Port Hedland, Dampier, Cape Lambert,
Newcastle, Hay Point and
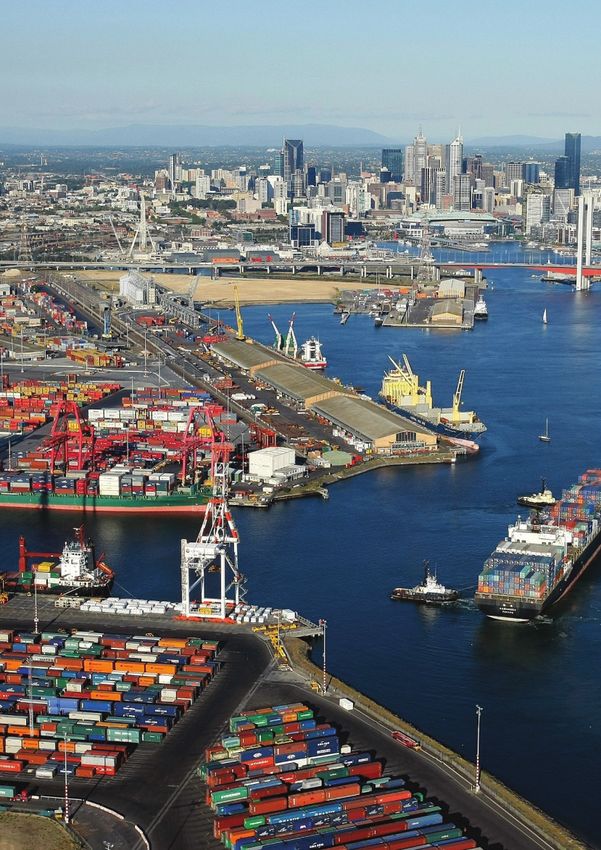
The most significant sea Gladstone—are the largest
freight movements relate Australian ports,
to the export of accounting for around
bulk ores and 80 per
minerals, and the import of
cent of total merchandise
manufactured goods intoexports volumes—521
the state Mt iron
capitals around ore and The
Australia. 316 Mt coal—in
figure below2011–12 (ABS 2012).
shows these freight flows:
(Figure 4 illustrates merchandise trade volumes through Australian ports in 2011–12, for ports exceeding
50,000 tonnes of imports or exports in 2011–12.)
Figure 7 Australian port-related freight by volume, FY2012
Figure 4: Australian port-related trade, by volume, 2011–12
Notes: The figure shows the total volume of all port-specific import and export trade flows exceeding 50,000 tonnes in 2011–12. Not
shown
Source: here are the
Freightline 1, volume
BITRE,ofMay
exports
2014from off-shore oil and gas terminals in WA and NT.
Source: ABS (2012) and BITRE estimates.
Despite the massive volumes being exported through Australia’s bulk ports there remain opportunities for
growth with potential new port developments in most states. A Galilee Basin State Development Area has been
5 declared5, LNG developments in the Northern Territory are coming on line, a bulk export port in South Australia
is being considered, as is development of the Port Hastings in Victoria. There are several large bulk export ports
being considered in WA, including Oakajee, Anketell Port, and the development of Geraldton.
The volume of freight is dominated by the Pilbara, but in value terms a significant trade relates to the import of
manufactured goods such as containerised goods and fuel.
5 Media Statements, Deputy Premier, Minister for State Development, Infrastructure and Planning The Honourable Jeff Seeney, Monday,
June 16, 2014 “Galilee rail zone reduced by 94 per cent” http://statements.qld.gov.au/Statement/2014/6/16/galilee-rail-zone-reduced-by-
94-per-cent accessed 26 June 2014.
8C O N S U L T I N G
1
The following figure shows BITRE’s estimate of significant freight flows by value.
Figure 8 Australian port-related freight by value, FY2012
Figure 5: Australian port-related trade flows, by value, 2011–12
Notes: The figure shows the total value of all port-specific import and export trade flows exceeding $50 million in 2011–12. Not shown
hereFreightline
Source: are the value1,ofBITRE,
exports May
from 2014
off-shore oil and gas terminals in WA and NT.
Source: ABS (2012) and BITRE estimates.
• The continued
Capital growth in imports
city ports—Sydney, andBrisbane
Melbourne, the potential to reduce the costamong
and Fremantle—number of exports is leading
the next to increasing demand
five largest
ports
for (afterports
inland the bulk
andcoal and iron ore ports)
well-connected by total
intermodal trade volume.
terminals. Strategic planning for future intermodal terminals
• would provide
By contrast, greater
capital certainty to theMelbourne,
city ports—Sydney, private sector and drive
Brisbane greater investment
and Fremantle—are amonginthethefive
Logistics
largest industry.
Australian ports by value of merchandise trade in 2011–12, due to their importance as major import
gateways. (Figure 5 illustrates the value of merchandise trade through Australian ports in 2011–12, for
2.5 Warehousing and postal services
ports exceeding $50 million of imports or exports in 2011–12.) Melbourne is the largest merchandise
import
Hire andport, by value,
Reward and Sydneyand
warehousing the postal
secondservices
largest. employs approximately 45,000 people and accounts for
Air 2.2 per cent of Australia’s value added. Employment in this area declined between 2009 and 2010 and in
freight
June 2014 Australia Post announced 900 redundancies with a likelihood of more to come as its traditional
letter business
Air freight declines.
is more suited to lowAgainst
densitythis is the
and/or strong
high value growth of package
commodities, such asdeliveries resulting
newspapers, from increased online
parcels,
shopping. Technology
perishable/short-lived is having
products, a huge
precious metalsimpact to these trades,
and gemstones, with declining
and generally comprisesletter
only mail, increased
a small share of internet
shopping,
freight volumes:and in the longer term the possibility of personalised deliveries by helicopter drone being trialled
by Amazon, improved logging, tracking and receival of items thought better use of IT.
• For example, domestic air freight, accounts for less than 0.01 per cent of total domestic freight
movements,
Typically withholding
stock the majority
costscomprising
are just shy newspapers, parcels
of 20 per cent and other
of total lightcosts.
logistics goods transported
between capital cities in either dedicated freighters or in freight holds of regular passenger service
Warehouses
aircraft. are concentrated in and near to industrial and agricultural areas, and on urban fringes with good
transport connections. Intermodal terminals are warehouses typically locate near to each other in a location
• with
International air freight
good access also represents
to urban populations lesstothan 0.1 perefficiencies.
generate cent of Australia’s total merchandise trade, by
volume, but makes up over 21 per cent of total trade by value (17 per cent of total exports and 26 per
Current and planned intermodal terminals include:
• New South Wales: Moorebank, Enfield, Chullora, Minto Eastern Creek/Badgery’s Creek (both proposed)
• Victoria: Altona, Somerton, Dynon, Lyndhurst, Western Interstate Freight Terminal (proposed)
6 • South Australia: Penfield, Islington, Dry Creek
• Queensland: Acacia Ridge, Bromelton (proposed), Ebenezer (proposed)
• Western Australia: Kewdale, Forestfield
• Tasmania: Brighton.
The Economic Significance of the Australian Logistics Industry 9C O N S U L T I N G
3. Modelling the impact of the
Logistics industry
Key Finding 3
• The Logistics industry is strongly connected with many industries with forestry, manufacturing,
construction, wholesale and retail trades and processed food being the most intensive users.
• Efficient Logistics enable competition over a greater area, allowing our key export industries to
compete for international markets, and domestic industries to be more competitive.
• There are estimated to be 1.2 million people employed in Logistics activities.
• Logistics accounted for $131.6 billion of value added to Australia’s economy in 2013, this is estimated
to be 8.6 per cent of GDP.
• A 1 percent increase in the productivity of Logistics adds $2 billion to Australia’s GDP.
ACIL Allen has estimated the size of the economic value added by the Logistics industry to be $131.6 billion
based on the ABS estimate of 2013 GDP6. ACIL Allen also estimates that there are approximately 595,000
employees engaged in the freight transport task, and almost as many people involved in other logistics activities
in organisations (a further 406,000) employees.
These estimates of the true size of the Australian Logistics industry have been incorporated into the ACIL Allen’s
computable general equilibrium (CGE) model of the Australian and world economy, Tasman Global, through a
complete revision of the underlying input-output tables.
To show the linkages and importance of the Logistics industry to the Australian economy, two hypothetical
scenarios have been modelled where there is a ±1 per cent factor productivity improvement across all Logistics
activities in FY2015. In other words, there is a change in the average productivity of labour and capital that, all
else equal, allows the same amount of labour and capital to change real output of the Logistics industry by
±1 per cent.
The change in productivity impacts on the cost of supplying Logistics services by affecting their requirement for
scarce labour and capital resources per unit of output. The productivity change also affects all other industries
in the economy both directly through their use of Logistics services and indirectly through their use of scarce
labour and capital.
A key issue when estimating the economic impact is determining how the labour market will clear.7 For this
analysis, the supply of labour has been assumed to be the same as the reference case with real wages
adjusting to clear the labour market. This is a conservative assumption as in reality changes in the demand
for labour can be met in various ways including changes in participation rates and/or average hours worked
and by changes in the unemployment rate. For comparison, the sensitivity of the projected impacts have been
presented by using the standard Tasman Global labour market framework which allows moderate changes in
participation rates in response to the changes in real wages paid to workers.
Table 1 presents the projected macroeconomic impacts associated with a ±1 per cent factor productivity
improvement across all Logistics activities in FY2015 under the alternative labour market closures.
6 The details of ACIL Allen’s calculation are contained in Appendix A on page 21.
7 As with other CGE models, the standard assumption within Tasman Global is that all markets clear (i.e. demand equals supply) at the start
and end of each time period, including the labour market. CGE models place explicit limits on the availability of factors and the nature
of the constraints can greatly change the magnitude and nature of the results. In contrast, most other tools used to assess economic
impacts, including I-O multiplier analysis, do not place constraints on the availability of factors. Consequently, non-CGE methods tend to
overestimate the impacts of a project or policy.
The Economic Significance of the Australian Logistics Industry 11Table 1 P
rojected macroeconomic impacts of change in Logistics industry factor productivity,
relative to the reference case
Real GDP Real income Employment
2014 A$m 2014 A$m FTE jobs
-1% Standard Tasman Global labour market –2,289 –1,918 –3,719
-1% Fixed labour supply –1,995 –1,631 0
+1% Fixed labour supply 1,957 1,600 0
+1% Standard Tasman Global labour market 2,246 1,882 3,639
Source: ACIL Allen
All else equal, it is projected that a 1 per cent change in factor productivity of the Logistics industry will change
Australian real GDP by $2 billion (Table 1). With a moderately flexible labour market (i.e. under the standard
Tasman Global labour market assumptions), it is projected that a 1 per cent change in factor productivity of
the Logistics industry will change Australian real GDP by $2.2 billion.
Real GDP is a measure of the economic output of the Australian economy. An alternative macroeconomic
measure is real income. Real income is a measure of the ability to purchase goods and services, adjusted for
inflation. A rise in real income indicates a rise in the capacity for current consumption, but also an increased
ability to accumulate wealth in the form of financial and other assets. In global CGE models such as Tasman
Global, the change in real income is equivalent to the change in consumer welfare using the equivalent variation
measure of welfare change resulting from exogenous shocks. Hence, it is valid to say that the projected change
in real income (from Tasman Global) is also the projected change in consumer welfare.
All else equal, it is projected that a 1 per cent change in factor productivity of the Logistics industry will change
Australian real income by:
• $1.6 billion if labour supply is fixed to the reference case levels
• $1.9 billion with a moderately flexible labour market (i.e. under the standard Tasman Global assumptions).
Table 2 provides a decomposition of the projected change in real GDP and real income. The factor productivity
improvement in the Logistics industry is projected to flow through to other industries resulting in an increase
in net exports. It also benefits the cost to consumers of imported goods which also increase. As shown, the
difference between real GDP and real income is a result of a fall in Australia’s terms of trade associated with
a depreciation of the real exchange rate. This is to be expected, as the cost reduction across the Australian
economy associated with the Logistics productivity improvement results in a decline in our cost of exports
which is what improves their competitiveness in the world market. Essentially a portion of the productivity
benefits accrue to foreign consumers of Australian goods and services.
12C O N S U L T I N G
Table 2 D
ecomposition of the projected change in Australian real GDP and real income under +1 per cent
factor productivity, relative to the reference case
Standard Tasman Global
Fixed labour supply labour market
ACIL ALLEN CONSULTING
A$m A$m
Table 2 Decomposition of the projected change in Australian real GDP and
Private consumption real income under +1 per cent factor
945 productivity, relative to the 1,081
reference case
Government consumption 168 supply
Fixed labour Standard Tasman Global234
labour market
Investment 538 617
A$m A$m
Net foreign trade Private consumption 307 945 1,081314
Government consumption 168 234
Real exports Investment 871 538 617956
Net foreign trade 307 314
Contribution of imports –565 –641
Real exports 871 956
Real GDP Contribution of imports 1,957 –565 –641
2,246
Real GDP 1,957 2,246
Terms of trade Terms of trade –353 –353 –361
–361
Net income transfers –4 –4
Net income transfers Real income
–4 1,600 1,882
–4
Source: ACIL Allen
Real income 1,600 1,882
Source: ACIL Allen Noting that the results are largely symmetric for a +1 per cent or a -1 per cent factor
productivity change the results presented in the rest of this section will just focus on the
Noting that the results are largely symmetric for a +1 per cent or a -1 per cent factor productivity change the
projected changes under a 1 per cent increase in the average factor productivity of the
results presented in the rest of this section will just focus on the projected changes under a 1 per cent increase
Logistics industry under the assumption that labour supply is fixed to the reference case
in the average factor productivity of the Logistics industry under the assumption that labour supply is fixed to the
levels.
reference case levels.
Figure 9 presents the projected change in real industry output by industry, while Figure 10
Figure 9 presents the projected change in real industry output by industry, while Figure 10 and Figure 11 present
and Figure 11 present the projected change in employment by occupation.
the projected change in employment by occupation.
9 Change
FigureFigure in real
9 Change output
in real by by
output broad industry,
broad industry,relative
relativeto
tothe
the reference case:- +1
reference case:- +1 per
percent
centscenario
scenario
0.30
0.25
0.20
0.15
0.10
0.05
%
Note:Note:
OtherOther
services excludeexclude
services the Logistics industry.industry.
the Logistics
Source: ACIL Allen
Source: ACIL Allen
The first thing to note from Figure 9 is that a rise in the productivity of the Logistics industry
has positive implications for all other industries of the Australian economy. Based on the
16
ECONOMIC SIGNIFICANCE OF THE AUSTRALIAN LOGISTICS INDUSTRY
The Economic Significance of the Australian Logistics Industry 13ACIL ALLEN CONSULTING
recalibrated database and model, the forestry industry benefits the most followed by
manufacturing and non-government services.
In analysing these results it is important to remember that this is reflecting the importance of
the cost of Logistics (or competition for people of certain occupations) on the current
production cost of other industries and the ability of these other industries to increase output
The first thing to note frombyFigure
passing
9 isonthat
anyacost
risesavings. It is not a complete
in the productivity measureindustry
of the Logistics of the importance of an
has positive
efficient or reliable Logistics service as it exists but of the benefit of changes in marginal
implications for all other industries of the Australian economy. Based on the recalibrated database and model,
the forestry industry benefits
cost.the most followed by manufacturing and non-government services.
In analysing these results Indeed
it is important to remember
it could be argued thatthat this is reflecting
a substantial the importance
part of Australia’s of the
economic costexists
activity of only
Logistics (or competition for people of certain occupations) on the current production cost of other industries
because of the ability to trade via the use of Logistics services; that is, they are a key part of
and the ability of these other industries to increase output by passing on any cost savings. It is not a complete
enabling trade and economic activity.
measure of the importance of an efficient or reliable Logistics service as it exists but of the benefit of changes
in marginal cost. As shown in Figure 10 and Figure 11, a factor productivity improvement in the Logistics
industry will result in a reduction of the number of people required to provide Logistics
Indeed it could be argued that a substantial part of Australia’s economic activity exists only because of the ability
services
to trade via the use of Logistics relativethat
services; to the
is,reference
they are acase
key and
parthence there will
of enabling be less
trade and people employed
economic in
activity.
related occupations related to driving, logistics operations and management. The
As shown in Figure 10 and Figure 11, a factor productivity improvement in the Logistics industry will result in
consequent reduction in the cost of Logistics will however stimulate demand for labour in
a reduction of the number of people required to provide Logistics services relative to the reference case and
other parts of the economy across a range of occupations including skilled technicians and
hence there will be less people employed in related occupations related to driving, logistics operations and
trades, retail and wholesale sales and a range of labouring occupations.
management. The consequent reduction in the cost of Logistics will however stimulate demand for labour in
other parts of the economyIn across
understanding
a rangethese results it is important
of occupations includingtoskilled
remember that these
technicians andare changes
trades, relative
retail and to
the of
wholesale sales and a range reference
labouringcase and underlying employment across all occupations are growing much
occupations.
fasteritthan
In understanding these results the changes
is important induced by that
to remember the factor
theseproductivity
are changes improvement. Thereference
relative to the number of
people employed
case and underlying employment across allinoccupations
the MachineryareOperators
growing&much
Drivers category
faster thanfortheexample,
changesisinduced
projected to
grow by 11,861The
by the factor productivity improvement. FTEnumber
jobs in the reference
of people case andinbythe
employed 11,385 FTE jobs
Machinery in the case
Operators with an
& Drivers
increase intoproductivity
category for example, is projected (implying
grow by 11,861 FTEajobs
change of –476
in the FTE jobs
reference caserelative
and byto11,385
the reference case).
FTE jobs in
the case with an increase in productivity (implying a change of –476 FTE jobs relative to the reference case).
10 Change
FigureFigure in employment
10 Change by by
in employment occupation
occupation(1-digit
(1-digit ANZSCO), FTEjobs:-
ANZSCO), FTE jobs:-
+1+1
perper cent
cent scenario
scenario
300
200
100
FTE jobs
-100
-200
-300
-400
-500
Source: ACIL Allen
Source: ACIL Allen
17
ECONOMIC SIGNIFICANCE OF THE AUSTRALIAN LOGISTICS INDUSTRY
14You can also read