Milton Keynes Transport Strategy Review - (Draft) September 2008
←
→
Page content transcription
If your browser does not render page correctly, please read the page content below
Milton Keynes

Transport Strategy Review

    September 2008

         (Draft)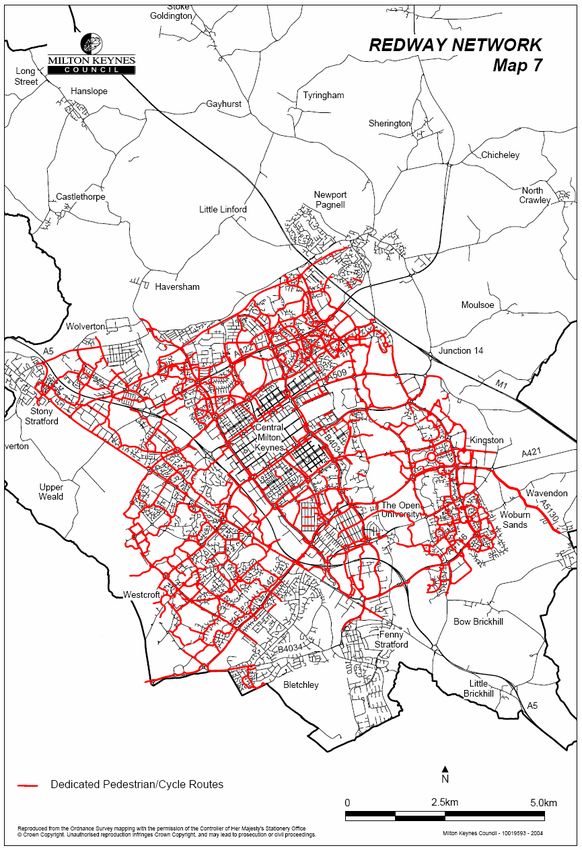
CONTENTS
1.     INTRODUCTION                                            1

1.1.    Study Context                                           1

1.2.    Engagement of Partners and Stakeholders                 2

1.3.    Linkages with Other Initiatives and Processes           3

1.4.    Implications of Growth and Visions for the Future       3

1.5.    Scope of Report                                         4

2.     TRANSPORT CHARACTERISTICS                               6

2.1.    Introduction                                            6

2.2.    Car Ownership                                           6

2.3.    Traffic Flow Patterns                                   8

2.4.    Journey to Work                                        13

2.5.    Bus Network                                            15

2.6.    Freight Vehicle Movements                              16

2.7.    Other Use of Transport Infrastructure                  16

3.     PREDICTING FUTURE TRANSPORT REQUIREMENTS                23

3.1.    Extent of Planned Growth                               23

3.2.    Multi-Modal Transport Model                            25

3.3.    Model Upgrading                                        26

4.     EXISTING TRANSPORT POLICIES AND STRATEGIES              28

4.1.    Transport Policy Framework                             28

4.2.    National Policy                                        29

4.3.    Regional Policy                                        31

4.4.    Milton Keynes & South Midlands Sub-Regional Strategy   32

4.5.    Local Transport Plan                                   33
4.6.    Other Local Strategic Documents                               36

5.     HIGHWAY NETWORK MANAGEMENT                                     37

5.1.    Guiding Principles                                            37

5.2.    Junction Types                                                38

5.3.    Provision for Bus Priority                                    39

5.4.    Special Cases                                                 39

5.5.    Constraints to the Provision of Additional Highway Capacity   40

5.6.    Ongoing Work Programme                                        41

5.7.    Future Works Programme                                        42

5.8.    External Road Network                                         45

6.     MANAGING TRANSPORT DEMAND                                      49

6.1.    Requirements and Objectives                                   49

6.2.    Assumptions and Conclusions                                   49

6.3.    Central Milton Keynes                                         52

6.4.    Implications for CMK Parking Provision                        54

6.5.    Critical Role of the Bus Network                              59

6.6.    Travel Planning                                               61

6.7.    Changes to Development Control Requirements                   64

6.8.    The Need for Monitoring                                       64

7.     CONCLUSIONS AND ACTIONS                                        67

7.1.    Introduction                                                  67

7.2.    Key Conclusions                                               67

7.3.    Work Streams                                                  69

7.4.    Summary                                                       71
1.       Introduction
1.1.     Study Context

1.1.1.   Milton Keynes Partnership (MKP) and Milton Keynes Council (MKC)
         have for the past two years been pursuing a programme of transport
         infrastructure improvements associated with the planned growth of
         Milton Keynes to 2016. However, while there is a broad
         understanding between the two key partners of the strategy underlying
         these actions and various documents have been put in place by Milton
         Keynes Council to guide actions in the short term (up to 2011), no
         formal overarching strategy document exists relating to the longer
         term.

1.1.2.   During the same period, there has also been intensive study of the
         options for Milton Keynes growth beyond 2016 as part of the work on
         the MK 2031 Long-Term Sustainable Growth Strategy. This has
         raised a number of additional transport strategy issues, which also
         need to be addressed. In particular, transportation was seen by the
         MK 2031 Growth Strategy Peer Group as an area where further work
         would be required to enable informed decisions to be made by the
         local authorities involved in accommodating growth beyond 2016.

1.1.3.   The debate around MK 2031 has indicated that there is a general lack
         of consensus in the community over the broad directions that transport
         strategy needs to take to accommodate growth in the longer term, and
         how the potentially difficult transport strategy issues involved are to be
         resolved. However, MKP, the Council and key partners, have
         endorsed the need for a strategy that can communicate simply and
         clearly to a wider audience key messages about these broad
         directions.

1.1.4.   Whilst the strategy and its associated action plan consider the short
         term (up to 2011), medium term (up to 2016), Regional Plan (2026)
         and longer term (up to 2031) planning horizons, the main focus is on
         the requirements of the longer-term situation, with a recommendation
         that continuous progress needs to be made to achieve these over the
         intervening period.

1.1.5.   A Brief for the work was endorsed by MKP and the Council, and other
         partners were briefed on the proposed scope and remit of the review
         of transport strategy in Milton Keynes, in September 2006. The
         overall aim is to build a consensus among partners on the way
         forward. The outcome – in the form of an integrated transport strategy

                                                                                 1
statement – will both support evidence to the South East Plan EIP and
provide a clear direction for any further work to be undertaken by
Milton Keynes Council and other key delivery partners. Ultimately, it
could help underpin the Council’s Local Development Framework,
including transport aspects of the Core Strategy, which will establish
policies that guide the future development of Milton Keynes. A further
report on the progress of the Review was made to the Partnership
Committee’s meeting in December 2006. This was part of a public
agenda.
1.1.6. The objective of this review has therefore been to inform and facilitate
agreement on a broad Milton Keynes transport strategy, provide
general consensus on a clear statement of the existing position
(based on the existing Local Transport Plan and other documents),
establish the directions that need to be pursued, and the timing, and
outline the requirements and responsibilities for specific follow-up
actions. This will then provide a clear framework for policy-making
and transport project implementation in the medium and longer term.
1.2. Engagement of Partners and Stakeholders
1.2.1. The Review has been undertaken by a consultant employed by MKP,
in consultation with key partner and stakeholder groups and under the
direction and guidance of the Joint Transport Delivery Team (JTDT) 1 ,
which has been responsible for overseeing and managing the Review.
This has involved inputs from:
• Milton Keynes Council officers – primarily those involved in
transport policy, bus service development, parking management,
highway management, and sustainable transport;
• the Highways Agency (in relation to impacts on motorways and
trunk roads, and related sustainability issues) – primarily through a
monthly HA Liaison Meeting;
• local bus operators – primarily through the regular Bus Day liaison
meetings organised by MKC;
• Representatives of other local transport authorities in the Milton
Keynes and South Midlands sub-region (Buckinghamshire County
Council, Bedfordshire County Council, Northamptonshire County
Council and Luton Borough Council); and
1
The Joint Transport Delivery Team is chaired by Milton Keynes Council’s Corporate Director
Environment, with membership representing MKC, MKP, the Highways Agency (HA) and
the Government Office for the South East (GOSE).
2• the Transport Partnership (part of the Local Strategic Partnership)
– primarily through its Executive group;
• representatives of other interested parties: SEERA, the Milton
Keynes Parks Trust, and the Economy and Learning Partnership.
1.2.2. Through these contacts the Review has been a catalyst for identifying
issues, challenging assumptions and developing common
understandings relating to the nature and extent of the required
transport strategy.
1.3. Linkages with Other Initiatives and Processes
1.3.1. In addition to closely liaising with the partners and stakeholder groups,
as outlined above, the consultant undertaking this Review has also
provided inputs to other initiatives and processes with transport strategy
implications. These include inputs and support to:
• The Local Development Framework process, in which Transport
Strategy has been identified as being relevant to all three key study
strands – Social, Economic and Environmental;
• Transport-related aspects of the post 2016 growth agenda and the
Partnership’s submission to the South East Plan EIP;
• The South East Regional Assembly (SEERA) regional transport
prioritisation process;
• MKC’s emerging Supplementary Planning Guidance on Transport
Planning.
1.3.2. The output of the study will form part of the evidence base for the new
Local Development Framework (LDF) and also for the South East
Regional Plan 2026. It will also assist key funding and delivery partners
– MKC, MKP, the Milton Keynes Economy and Learning Partnership
(MKELP) and the South East Regional Assembly (SEERA) – to
understand how and when future investment should be made.
1.4. Implications of Growth and Visions for the Future
1.4.1. Various ‘visions’ have been developed to underpin the future growth of
Milton Keynes. The Local Plan Vision talks about ‘high quality of life
for all’, ‘sustainable lifestyles’, ‘real choices for transport’, a ‘clean and
green environment’ and a ‘stronger role as a regional centre’.
Similarly, the MK2031 Vision, produced by Milton Keynes Partnership
to support the statutory planning process undertaken by Local
Authority partners, also talks about ‘changes in lifestyles necessary to
3ensure a sustainable future’, ‘living and working in a uniquely green
and landscape city’, and ‘the whole city linked together by a safe,
modern and efficient public transport system’.
1.4.2. More specific visions for transport were incorporated into the Council’s
Sustainable Integrated Transport Strategy (SITS), which was first
published in 1999 and has guided successive Local Transport Plans.
The SITS vision was to:
“open up Milton Keynes by making it a place where everyone can
afford to move around conveniently, where economic, social and
cultural life can flourish, whilst damage to our environment is
minimised.”
1.4.3. This was later expressed (in the Local Transport Plan) in terms of the
following guiding objectives:
• Enabling all people to move around conveniently and safely,
regardless of their circumstances, with those able to pay doing so.
• In developing planning policies, to actively seek to reduce the
number, length and need to make journeys.
• To encourage walking, cycling, and quality public transport whilst
reducing journeys by car and promoting a healthier lifestyle.
• To ensure that Milton Keynes’ economic prosperity is enhanced by
helping people to travel when and where they want, but in more
environmentally friendly ways.
1.4.4. These approaches have attracted considerable public support over
the past few years, and whatever transport strategy is eventually
adopted it should support, rather than undermine these core values.
This review – including its recommendations and follow-up actions –
has sought to follow this principle.
1.5. Scope of Report
1.5.1. Following this introductory chapter, the subsequent chapter (Chapter
2) sets out some of the key transport characteristics, which together
form the background of transport strategy in Milton Keynes. These
form the starting point for future forecasts, and also indicate the limits
of what might be possible.
41.5.2. Chapter 3 sets out the scale and direction of the growth that is
envisaged for Milton Keynes, and also outlines the procedures that
have been used to predict future transport patterns. These forecasts,
together with the baseline data, define the scale of what any transport
strategy for Milton Keynes needs to achieve.
1.5.3. Chapter 4 briefly reviews the existing policy framework for transport
provision in Milton Keynes and the surrounding area. It indicates that
much of the supporting transport policy, and many components of the
Milton Keynes transport strategy, already exist within key national,
regional, sub-regional and local documents.
1.5.4. Chapter 5 goes on to highlight issues in relation to the management of
the road network, the basis of ongoing projects is explained, and
issues relating to the limitations faced in expanding network capacity
are highlighted. It is clear that much is already being achieved in
relation to this aspect of transport strategy implementation through the
ongoing efforts of MKC and MKP officers and the work of the Joint
Transport Delivery Team (JTDT). There are also obvious issues still
to be addressed – most notably in the management of the surrounding
road network, and the role of some of the grid roads.
1.5.5. Chapter 6 deals with other aspects of the transport strategy that must
be developed to allow the establishment of a truly sustainable
transport system. This is the heart of the proposed transport strategy,
and involves the need for a significant behavioural and cultural change
over a protracted period of time. The chapter also provides an
updated analysis of parking requirements in Central Milton Keynes,
the way this might interact with overall transport policy objectives, and
the need for monitoring.
1.5.6. Finally, Chapter 7 summarises the conclusions of the review and sets
out an integrated framework for further transport strategy actions in
terms of six identifiable and inter-related work streams.
1.5.7. The report thus proposes a basis for a successful strategy: where
Milton Keynes is now, where it needs to get to (and by when), and
how it might get there. Within this relatively short strategy review,
however, it has not been possible to resolve all outstanding issues,
and there is obviously much more that will need to be worked on in
future years. In addition, many of the aspects explored are dealt with
on a global basis, rather than in the context of specific areas of the
city.
52. Transport Characteristics
2.1. Introduction
2.1.1. Transport affects almost every member of the community, almost
every day. For most people, therefore, the quality and convenience of
a city’s transport system is key to their quality of life. Furthermore, to
be effective, the transport system must respond to the needs of all
members of the community, not just the majority or selected
minorities. The transport system also has to provide an effective
environment for the business community, both in moving goods and in
providing a welcoming environment into which new employees can be
assimilated and customers and clients can be attracted.
2.1.2. This part of the report sets out some of the key transport
characteristics, which together form the background of transport
strategy in Milton Keynes. These concentrate for the moment on
‘existing’ conditions (or those that existed in 2001); subsequent
chapters of the report will outline how the planned growth of Milton
Keynes also needs to be taken into account.
2.2. Car Ownership
2.2.1. On average, car ownership in Milton Keynes is relatively high. In 2001
80.8% of households had access to at least one vehicle (compared to
80.6% in the South East region as a whole, and 73.2% nationally 2 ).
At the same time, the number of cars per household was around 1.26
(compared to 1.30 in the South East, and 1.11 nationally). However,
this also means that about 19% of households in Milton Keynes did
not have access to a car (or van) at all, and a further 45% of
households only had access to one car. The result is that a significant
number of people (about half the population) have to depend on other
family members or alternative forms of transport for their transport
needs.
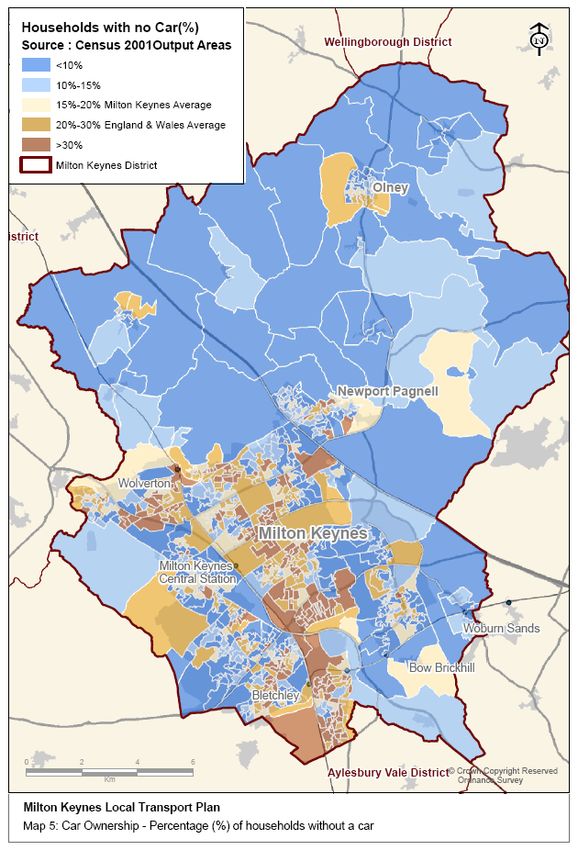
2.2.2. It is also worth noting that the availability of cars is not uniform across
the city. In some wards, such as Emerson Valley and Sherington
more than 90% of households have access to a car, whereas in other
wards, such as Woughton and Eaton Manor only about two-thirds of
households have cars available. For some individual estates, car
ownership is even lower – e.g. Netherfield (57%), Beanhill (60%) and
Coffee Hall (65%). The overall picture is illustrated in Figure 1.
2
‘Nationally’ in this context refers to England only
6Figure 1: Distribution of Car Ownership (2001 Census)
Source: Milton Keynes Local Transport Plan
72.3. Traffic Flow Patterns
2.3.1. Because of the grid pattern of the main road network in Milton Keynes,
traffic flow within the city is reasonably well distributed spatially.
However, there are heavy concentrations of traffic leading to and from
major gateways and to and from Central Milton Keynes (CMK),
especially involving journeys to and from work. This is already leading
to peak period congestion on radial routes connecting Milton Keynes
with the surrounding area – notably around M1 J13, in the M1
J14/Northfield area, along the A509/A422 corridor, and at the Old
Stratford and Fenny Stratford junctions on the A5.
2.3.2. Table 1 provides information about morning peak hour traffic flows
(generally, between 8am and 9am) at the main gateways to the city,
and Figure 2 illustrates the location of these ‘gateways’. This
illustrates the importance of the M1 Junction 14 gateway, as well as
the approaches from the A5 (North) and A422 corridors. It also
indicates that there is a greater flow of traffic into Milton Keynes in the
morning peak hour than outbound. Many of the roads concerned, or
the junctions that control them, are close to their maximum operating
capacity, and the future operation of these gateways to Milton Keynes,
and the surrounding road network, is taken up again in Chapter 5 of
this report.
2.3.3. Table 2 provides similar information for the roads around Central
Milton Keynes. Again, the implications of this traffic pattern for
management of the road network will be discussed later in this report.
2.3.4. The distribution of traffic flows throughout the working day is heavily
biased towards the peak travel periods. Two examples taken from
traffic surveys undertaken in 2006 illustrate this point most clearly.
Figure 3 relates to a point on H5/Portway just to the east of the A5
junction, and Figure 4 relates to a point on H6/Childs Way where it
crosses the Grand Union Canal. The large peaks in traffic flow that
occur at these times are significant because highway engineers
generally aim to ensure that the road network has sufficient capacity
to cater for these flows. Reducing the magnitude of the traffic flow at
these times – often amounting to no more than 2-3 hours a day –
would therefore have a very significant impact on the scale of
investment needed to provide new road infrastructure, particularly in
relation to junction improvements.
8Table 1: Traffic at MK Major Gateways, morning peak hour (2001)
Location Into MK Out of MK
A5 (North), at MK boundary 3,198 1,159
A422/Willen 2,759 1,465
A509, south of M1 J14 3,369 1,249
A421 (East), at MK boundary 1,069 706
A5 (South), south of Fenny 1,569 892
Stratford Roundabout
A4146/Stoke Hammond, west 1,224 576
of Fenny Stratford Roundabout
A421 (West), at MK boundary 1,383 792
Total 14,571 6,839
Notes: 1) Excludes traffic entering or leaving Milton Keynes on minor
routes
2) 2001 data has been quoted because this provides the most
complete dataset that is available; present day traffic flows
are likely to be in excess of these figures in the majority of
cases.
3) As a rough guide, the hourly capacity of a single-
carriageway road (of the type encountered at the MK
boundary) is of the order of 1,800 vehicles per hour in the
peak direction, and that of dual-carriageway roads is around
3,600 vehicles per hour, although junction capacities will
often be lower than this).
9Figure 2: Location of Gateway Sites (in Table 1)
10Table 2: Traffic at CMK Boundary, morning peak hour (2001)
Location (all inside CMK grid) Into CMK
Elder Gate (south) 153
V6 Grafton Street (south) 2,256
Witan Gate (south) 779
V7 Saxon Street (south) 1,024
Secklow Gate (south) 550
Avebury Boulevard (across H8 423
Marlborough St.)
Silbury Boulevard (across H8 566
Marlborough St.)
Secklow Gate (north) 642
V7 Saxon Street (north) 1,104
Witan Gate (north) 1,359
V6 Grafton Street (north) 2,232
Elder Gate (north) 110
Total 11,198
11Vehicles/hour Vehicles/hour
0
200
400
600
800
1000
1200
1400
1600
1800
0
500
1000
1500
2000
2500
0: 0: 3000
00 00
1: 1:
00 00
2: 2:
00 00
3: 3:
00 00
4: 4:
00 00
5: 5:
00 00
6: 6:
00 00
7: 7:
00 00
8: 8:
00 00
9: 9:
00 00
10 10
:0 :0
0 0
11 11
:0 :0
0 0
12 12
:0 :0
0 0
13 13
:0 :0
0 0
14 14
:0 :0
0 0
15 15
:0 :0
0 0
16 16
:0 :0
0 0
17 17
:0 :0
0 0
18 18
:0 :0
0 0
19 19
:0 :0
0 0
20 20
:0 :0
0 0
21 21
:0 :0
0 0
Figure 3: Traffic Flow on Portway (H5), east of A5 - weekdays
22 22
:0 :0
0 0
23 23
:0 :0
0 0
12
Figure 4: Traffic Flow on Childs Way (H6), west of Woolstone - weekdays
Weekday - In
Weekday - In
Weekday - Out
Weekday - Out2.4. Journey to Work
2.4.1. Because most of the travel movements that take place during peak
periods are related to travel to work (about 80% - the remainder are
largely related to journeys to and from school), it is relevant to
examine how these journeys are made up. From the 2001 Census
the following statistics can be obtained for residents of Milton Keynes
(Table 3):
Table 3: Mode Used for Journey to Work, MK residents (2001 Census)
Predominant Average Highest Lowest Car- Average
Mode Household Car-Owning Owning South East
Households Households England
Driving car or 67,986
van (62.9%) 68.5% 55.6% 59.4%
Passenger in 8,732
car or van (8.1%) 6.0% 9.8% 5.7%
Implied
vehicle 1.13 1.09 1.18 1.10
occupancy
Bus 5,118
(4.7%) 2.7% 6.6% 4.1%
Rail 4,060
(3.8%) 4.3% 3.6% 5.9%
Taxi 871
(0.8%) 0.4% 1.3% 0.4%
Walk 7,405
(6.9%) 4.6% 10.6% 9.9%
Cycle 3,265
(3.0%) 2.4% 3.8% 3.1%
Other (incl. 1,385
motorcycle) (1.2%) 1.3% 1.3% 1.6%
Working at or 9,253
from home (8.6%) 9.8% 7.4% 9.9%
132.4.2. The range of statistics for ‘highest car-owning’ and ‘lowest car-owning’
households is based on aggregates of Milton Keynes wards in each
category. The intention is to indicate trends depending on the general
level of car ownership. Unsurprisingly, the use of more sustainable
modes such as walking and cycling is somewhat higher in the lower car-
owning categories and the use of bus as a mode of travel to work is very
much higher.
2.4.3. In general, the statistics for Milton Keynes are not very different to South
East England as a whole, although this does not mean that Milton Keynes
cannot do better. In regional centres such as Reading and Southampton,
for example, about 12% of the resident employees travel to work by bus,
and in Oxford 16% travel to work by bus, 15% cycle to work and a further
15% walk (again, taken from the 2001 Census data).
2.4.4. Table 4 provides comparable statistics from the 2001 Census for
journeys to work by employees within Milton Keynes, with separate
information being given for all employees and employees within Central
Milton Keynes. This indicates a broadly similar pattern of travel to work,
although rail travel is somewhat less important for inbound work trips
than for outbound trips, and the proportion of bus use to Central Milton
Keynes is about twice the general level of such trips.
Table 4: Mode Used for Journey to Work, MK employees (2001 Census)
Predominant Mode All Milton Keynes Central Milton Keynes
Driving car or van 85,389 (68.7%) 18,718 (70.1%)
Passenger in car or van 9,689 (7.8%) 2,735 (10.2%)
Implied vehicle 1.11 1.15
occupancy
Bus 5,372 (4.3%) 2,315 (8.7%)
Rail 1,644 (1.3%) 575 (2.2%)
Taxi 869 (0.7%) 200 (0.7%)
Walk 7,412 (6.0%) 1,474 (5.5%)
Cycle 3,358 (2.7%) 469 (1.8%)
Other (incl. motorcycle) 1,347 (1.1%) 203 (0.8%)
Working at or from home 9,253 (7.4%) -
142.4.5. These basic statistics indicate the present pattern of peak period travel
within Milton Keynes. They are used later in this report, in conjunction
with other more recent information, as the basis for assessing how
travel patterns will need to change in future in order to accommodate
the population and economic growth that is planned for Milton Keynes.
2.5. Bus Network
2.5.1. Over 20 bus routes currently serve Milton Keynes, not including express
or long distance services. Most of these routes can be defined as ‘radial’
routes – that is the routes are between two points in Milton Keynes via the
centre. Only two routes do not provide links to the city centre. Over
recent years four quality bus initiative routes have been developed –
route numbers 4, 5, 8 and 23. On these routes, buses run to increased
frequencies (route 5 has a ten minute frequency between Bletchley and
CMK), together with low floor buses, raised stops and new shelters. On
the other routes, services are less frequent and passengers may need to
consult a timetable if not catching their regular bus.
2.5.2. The majority of local bus services are operated on a commercial basis.
However the Council supports some weekend and almost all evening
services.
2.5.3. There are a number of bus routes linking the rural districts with Central
Milton Keynes and the X5 Oxford to Cambridge regional bus service
also serves Central Milton Keynes, providing direct links to Buckingham
and Bedford. The X4 to Northampton and Peterborough provides
regional services on a north-south axis.
2.5.4. Bus patronage increased in each of the past five years, with an
increase from 6,374,000 in 2001/02 to 7,179,000 in 2005/06 (an 11 per
cent increase). This compares favourably with a general fall bus use in
England (outside of London) – see Figure 5. Although some of the
increase was related to Milton Keynes population growth,
improvements can also be linked to investment in new infrastructure
such as raised kerbs for easy access, new bus stops, bus lanes and
improvements to publicity (including developing web-based
information). During this same period, parking charges were
introduced in Central Milton Keynes, where parking had previously
been free. Increased ridership on contracted services also contributed
to the increase. For example, between 2002/03 and 2003/04, bus
patronage on contracted services increased from 344,000 to 655,000.
Nevertheless, the discussion that follows later in this report indicates
that there is still much to be achieved as the city continues to grow.
15Figure 5: Bus Passenger Journeys in MK (shown against
ridership in England)
2.6. Freight Vehicle Movements
2.6.1. The information available about the movement of goods vehicles into,
out of and within Milton Keynes is not comprehensive. However, the
Department for Transport monitors traffic flows at 28 sites on ‘principal’
roads in Milton Keynes and this provides a partial picture of the scale
and location of such movements. In general, the movement of large
goods vehicles is most obvious on the main roads (A421, A509, A422)
leading to the M1 at Junctions 13 and 14, where many of Milton Keynes’
distribution facilities are to be found. Heavy goods movements are also
found on the A421 leading to the M40 at Brackley via Buckingham and
Tingewick, and to a lesser extent on the A4146 (H10 and V11). Most of
these routes carry more than 1,000 heavy goods vehicles per day, with
such vehicles constituting between 5% and 15% of the total traffic flow.
However, traffic counts taken during peak periods indicate that the
proportion of heavy goods vehicles is usually somewhat less at these
times. The improvements that are planned along these critical goods
vehicle access routes are outlined later in this report.
2.7. Other Use of Transport Infrastructure
Walking and Cycling (Redways)
2.7.1. Milton Keynes has an extensive network of dedicated footways and
cycle routes, referred to as ’redways’. The present network is
illustrated in Figure 6. This is gradually being extended (and
integrated) into new development areas and the condition of the
existing facilities is gradually being improved.
16Figure 6: Milton Keynes Redway Network
172.7.2. Very little information is available about the use of this network and as
part of its Local Transport Plan targets MKC only monitors the number
of cycles parked in Central Milton Keynes. However, the 2001 Census
data quoted earlier indicates that the proportion of employees who cycle
to work, for example, is relatively low.
Rail Stations
2.7.3. Overall, rail travel does not feature very highly in the Milton Keynes
transport mix at the local level. In 2001, about 4,000 Milton Keynes
residents (3.8%) and just over 1,600 Milton Keynes employees (1.3%)
used rail for their journey to work. However, the location of Milton
Keynes’ stations on the West Coast Mainline (WCML) is an important
asset to the city, providing both residents and non-residents with
significantly improved transport opportunities.
2.7.4. In order to better understand the usage of each of the three Milton
Keynes stations, and particularly the way they are accessed by
passengers, a survey was carried out for Milton Keynes Partnership in
early June 2006. The results are indicated in Table 5. Overall, MK
Central is by far the dominant station, handling more that 5 times the
number of passengers at Bletchley and 12 times the number at
Wolverton. In all cases, a high proportion of passengers was observed
to arrive by car. The higher proportion at MK Central, and the higher
proportion of cars that are parked, reflects the more regional nature of
this station. Similarly, the higher proportion of walking (and cycling) at
Bletchley and Wolverton indicate their more local role. While MK
Central acts as a significant interchange for bus/rail transfers, such
transfers at Bletchley and Wolverton are insignificant – possibly
because they are not encouraged by the provision of definite bus/rail
interchange facilities.
2.7.5. The survey also showed that approximately 24% of departing
passengers travelled from outside Milton Keynes, compared to 15% at
Bletchley and 14% at Wolverton. This again emphasises the important
sub-regional role of MK Central station.
18Table 5: Use of MK Stations, departing passengers by mode of
arrival at station (June 2006, 6.30am - 6.30pm)
Predominant Mode MK Central Bletchley Wolverton
Car (parked) 2371 (46%) 287 (27%) 87 (21%)
Car (lift) 1000 (19%) 335 (32%) 107 (26%)
Bus 683 (13%) 43 (4%) 15 (4%)
Taxi 304 (6%) 30 (3%) 6 (1%)
Walk 473 (9%) 323 (31%) 156 (38%)
Cycle 364 (7%) 28 (3%) 40 (10%)
Other (incl. motorcycle) 13 (-) 0 (-) 0 (-)
Total 5208 (100%) 1046 (100%) 411 (100%)
CMK Parking
2.7.6. Central Milton Keynes (excluding Campbell Park) currently has around
25,000 parking spaces. However, the type of parking provided, the
charging regime, and the usage of the spaces varies across the City
Centre. Table 6 provides a summary of the available spaces, by sub-
area and type. MK Council undertakes regular checks of parking space
occupancy, and the results for September 2006 are also shown in the
table.
19Table 6: Distribution and Use of CMK Car Parks (September 2006)
Sub-Area Parking Type
Public Pay and Display Mult- Disabled Resident Season Car Other Total Private
Free storey Only Ticket / Share Public
Standard Premium Long Coach
Stay Park
Station Gateway – 887 704 54 499 572 61 372 18 3,167 1,248
blocks A1-A4 (38%) (42%) (37%) (84%) (81%) (39%) (99%) (67%) (61%) (58%)
Business District (N) – 987 2,408 599 116 135 186 4,431 962
blocks B1, B2, C1, C2 (95%) (99%) (39%) (64%) (76%) (35%) (85%) (69%)
Business District (S) – 359 2,239 268 44 36 2,946 1,637
blocks B3, B4, C3, C4 (99%) (83%) (64%) (59%) (61%) (83%) (49%)
Council Office – 1,237 667 534 41 164 90 2,733 179
blocks D1 and E1 (98%) (89%) (29%) (68%) (55%) (70%) (79%) (45%)
Retail District – 978 2,073 1,939 239 18 33 5,280 65
blocks D2, D3, E2, E3 (98%) (23%) (30%) (63%) (28%) (67%) (42%) (43%)
Saxon Court – 402 497 42 17 120 44 1,122 26
block D4 (98%) (97%) (100%) (65%) (67%) (68%) (93%) (8%)
Xscape – 26 404 785 44 1,259
block E4 (8%) (44%) (22%) (14%) (29%)
Total 4,876 6,919 4,355 499 2,511 562 419 390 356 51 20,938 4,117
(86%) (84%) (29%) (84%) (41%) (57%) (65%) (95%) (51%) (67%) (66%) (56%)
202.7.7. The total of 25,000 spaces is made up of some 4,100 private spaces,
1,750 special purpose spaces and 19,150 spaces available to the
general public. Of the latter, 14,250 are charged and 4,900 – over
one quarter – are free. (In the main business areas, the figures are
7,250 and 3,000, respectively). This generous provision of parking
spaces compared to other UK city centres of comparable size 3 has
undoubtedly contributed to the attractiveness of CMK as an
employment location but, as will be seen later in this report, has also
contributed to the relatively high car usage that characterises the city.
2.7.8. The usage of parking spaces is indicated in the table in terms of the
percentage of parking spaces in each sub-area that were occupied at
10am on the surveyed weekday. By this time, most of the free spaces
in the main employment areas are usually fully occupied, and space is
also becoming limited in the standard rate bays (highlighted in the
table). This means that visitors to CMK businesses during the late
morning and early afternoon may experience difficulty in finding a free
or standard rate parking space close to their destination, although
there will usually be premium rate spaces available as well as spaces
in the retail multi-storey car parks.
2.7.9. The place that CMK parking management might play in the overall
transport strategy, and the inter-relationship between parking
provision and management of the wider highway network, are
discussed in Chapter 6.
Coachway/Park and Ride
2.7.10. The Coachway facility adjacent to M1 J14 provides an interface point
between the local bus network and long distance coach services using
the M1. There are also interconnections with other east-west coach
services. Although the facility itself is currently in poor condition, the
Coachway operation is relatively well utilised – indeed the operator,
Stagecoach, has said that it is the third busiest coach interchange
point in the country.
3
Examples: Reading has around 7,000 publicly available spaces in the city centre, including
1,600 associated with the railway station. Parking charges are generally set to deter use by
employees; long-stay parking (up to 8 hours) is priced at £6 per day and the cheapest
available season ticket is £935 p.a. Northampton has a total of around 5,000 spaces in the
city centre, and long-stay charges range from £5 to £7 per day. The cheapest season ticket
is £1,140 p.a. Southampton has around 10,000 spaces, and long-stay charges are around
£7 per day. The cheapest season ticket is £1,650 p.a. In each case, the use of season
tickets is limited to selected car parks.
212.7.11. The associated Park and Ride facility serves two purposes: it provides
the opportunity for park and ride operations in the M1 corridor
(reportedly even in conjunction with Luton Airport) and it also provides
an opportunity to reduce car travel into Central Milton Keynes. In this
latter respect, although a bus service operates between the facility
and CMK 4 , use of the service is very low indeed 5 .
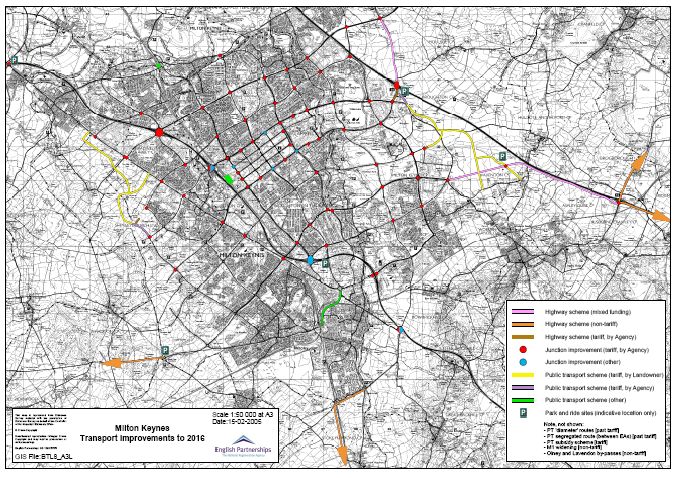
2.7.12. The ongoing M1 J14/Coachway project, funded by Community
Infrastructure Fund (CIF) and Sustainable Community Fund (SCF)
grants, will improve the infrastructure and related road access
associated with both of these facilities. In addition, English
Partnerships, as landowner of the site, has plans to upgrade the
Coachway buildings in association with the coach operators.
However, revenue funding is not yet in place to provide the type of
high quality, fast, frequent and dedicated bus service that is a feature
of successful park and ride sites. Efforts are therefore now required to
plan an effective Park and Ride service to CMK, and possibly also to a
similar facility at Denbigh Stadium. Previous experience with low
passenger numbers indicates that this will need to be priced
competitively in comparison with CMK parking charges, with the latter
being revised upwards as necessary to achieve the desired objective.
This issue is discussed further in Chapter 6.
4
Except for the Christmas period, this service is operated as part of an ordinary route, rather
than as a dedicated Park and Ride service.
5
The present Park and Ride site has 250 spaces but daily occupancy is generally less than 50
223. Predicting Future Transport Requirements
3.1. Extent of Planned Growth
3.1.1. The reported 2001 population of Milton Keynes of approximately
207,000 is expected to grow to around 340,000 by 2031. This will
result in an additional 68,600 households over and above the 83,359
recorded in 2001. At least 68,600 new jobs are also likely to be
created over this period 6 , in addition to the 115,000 that existed in
2001 7 . The resulting growth profile is illustrated in Figure 7.
Figure 7: Projected Milton Keynes Growth
3.1.2. At the same time, commercial floor space in CMK (excluding Campbell
Park) is set to expand by about 90% up to 2031 and retail floor space
is expected to increase by a similar amount over the same period.
The number of jobs that this expansion will generate cannot be
predicted accurately, since it will depend on many factors that could
change in the intervening period. However, it is anticipated that there
may be about 38,000 people working in CMK by 2016 and about
50,000 by 2031 (compared to about 25,000 at present).
6
Based on assumptions made in regional and sub-regional spatial plans, and adopted for
the latest MK2031 study; however, independent economic forecasts indicate that the actual
increase in the number of jobs could be significantly higher than this.
7
The number of jobs in Milton Keynes has continued to rise with a total of 122,250 being
recorded in October 2005 and 125,000 by the end of 2006.
233.1.3. The planned spatial distribution of the above development up to 2016
is reasonably well known – based on the currently adopted Local Plan
and likely options for the Strategic Reserve area. During this period
the main areas of expansion are located in the west (to the south-west
of Stony Stratford) and in the east (on land to the south of the M1
motorway, between Kingston and J14), plus smaller areas such as
Newton Leys. There will also be continued intensification of
development in Central Milton Keynes as well as infill and
regeneration in Bletchley and Wolverton.
3.1.4. The distribution beyond 2016 has been outlined in ‘A Strategy for
Growth to 2031’, June 2006. Local consultation on this document has
been completed and the strategy has recently been discussed in the
context of the emerging South East Plan. It suggests the following
overall phasing (subject to amendment by the South East Plan process
and subsequent local development documents (LDDs)) (Table 7):
Table 7: Scale and Phasing of Milton Keynes Growth
2001 2006 2011 2016 2021 2026 Total
- 2006 - 2011 - 2016 - 2021 - 2026 - 2031 2001
- 2031
Total Milton Keynes 7,900 15,000 11,000 11,000 11,500 12,200 68,600
Annual average 1,580 3,000 2,200 2,200 2,300 2,440 2,290
rate of housing
provision
Housing provided 1,000 1,100 1,500 3,000 4,000 4,500 15,100
within the existing
urban area (new or
regeneration)
Peripheral 6,900 13,900 9,500 8,000 7,500 7,700 53,500
(greenfield)
housing growth
3.1.5. The locations of the two proposed urban extensions are defined as
being:
• an area south-east of Milton Keynes broadly defined by land in
close proximity to Wavendon, Woburn Sands and Aspley Guise
(area approximately 385 hectares/951 acres); and
24• an area south-west of Milton Keynes broadly defined by land
surrounding the village of Newton Longville (area approximately
875 hectares/2,161 acres).
3.1.6. Within the city, urban regeneration is likely to be concentrated in
Wolverton, Bletchley and the older estates closer to Central Milton
Keynes (i.e. in the Saxon Street corridor).
3.2. Multi-Modal Transport Model
3.2.1. Such large-scale development will inevitably have a significant impact
on the Milton Keynes transport network, and any transport strategy will
need to be responsive to the consequences. In order to be able to
test the impact in a comprehensive, coordinated and objective way,
Milton Keynes Council and Milton Keynes Partnership, along with their
consultants, have jointly developed a multi-modal transport model
(referred to as the MKMMM) that can predict future traffic and
transport conditions up to 2031, for three separate times of day –
morning peak hour, evening peak hour and average inter-peak hour –
for a typical working day.
3.2.2. The model is based on data collected in 1999, updated to a ‘base
year’ in 2001. Initial checks carried out at the time of the model’s
development indicate that it is able to reproduce 2001 conditions to
standards set out by the Department for Transport. This effectively
validates the accuracy of the model.
3.2.3. Origins and destinations within the model are represented by 400
zones (or areas) both within and outside Milton Keynes. For future
years, each of the zones within Milton Keynes is allocated information
about the number of additional houses and jobs (over and above the
2001 situation) that are assumed to exist at the year being modelled;
outside Milton Keyes, a suitable growth factor is allocated to represent
anticipated development trends. The model is thus able to test any
number of spatial development variations.
3.2.4. For the base year, and for each forecast year, the model also contains
a description of the corresponding road network – including detailed
junction descriptions – and bus network. This enables the model to
predict the impact of improving road junctions or reconfiguring the
public transport network. In practice, only the main grid roads,
together with some other roads in Central Milton Keynes and the
‘expansion’ areas, are included in the network descriptions.
253.2.5. Other features of the model include the ability to predict responses to
increased car parking charges (in CMK), provision of Park and Ride
sites, provision of faster, more frequent bus services, and the
introduction of bus priority measures at selected locations.
3.2.6. During each model run, the number of people and vehicles travelling
between each of the model ‘zones’ is estimated, based on the given
land use characteristics, and each of these journeys is also allocated
between the highway and public transport network, depending on the
available services. This provides the model with its ‘multi-modal’
capability.
3.2.7. The model output consists of traffic flows and bus passenger flows on
each part of the transport network, together with estimates of the
resulting traffic delays and queues at each road junction.
3.2.8. The model has been used extensively to guide the development
control process – providing estimates of the traffic impact of various
developments and indicating the extent of the junction improvements
required. Because it is a strategic-level model, however, such
analysis usually needs to be supplemented by more detailed
measurements and calculations. The model has also been used to
test the impact of different spatial strategies, and transport options in
developing the 2031 Growth Strategy.
3.2.9. The use of the model to assess future transport scenarios in Milton
Keynes is referred to again in subsequent chapters of this report.
However, the overall increase in peak period travel predicted by the
model is of the order of 31% to 2016 and 57% to 2031, compared with
2001 levels.
3.3. Model Upgrading
3.3.1. The data on which the Milton Keynes multi-modal model is based was
collected between 1999 and 2001, and the base year for the model is
2001. Over a period of time, this evidence base will become
increasingly outdated, and this may undermine the credibility of its
outputs and conclusions. The inputs to the model will also change
over time as new information becomes available about planned
developments and more details are known about planned highway
improvements and public transport services.
263.3.2. The Joint Transport Delivery Team is currently considering how the
model could be upgraded to take into account these changes and to
ensure that it continues to provide useful outputs. One issue is that
the current model is not able to accurately reflect the impacts of Milton
Keynes growth on the surrounding road network. This will need to be
addressed by increasing the coverage of the model to provide more
detail about sub-regional transport linkages. This is clearly one of the
tasks that need to be included in any follow-up actions arising from
this transport strategy review.
274. Existing Transport Policies and Strategies
4.1. Transport Policy Framework
4.1.1. The Review consultant, in consultation with officers of the MKC
Transport Policy Group, has reviewed most of the documents or policy
statements relating to transport strategy in Milton Keynes. These
cover national, regional, sub-regional and local policies and strategies.
The way in which they are connected is illustrated in Figure 8.
Figure 8: Key Strategies and Policies
Source: Milton Keynes Local Transport Plan 2006-2011
284.2. National Policy
4.2.1. At the national level, Transport 2010: The Ten Year Plan (July 2000)
is the 10-year investment and action plan for implementing the
Integrated Transport White Paper – ‘A New Deal for Transport: Better
for Everyone’ (July 1998). Its key theme is the requirement for an
integrated approach to transport embracing all modes. The linkages
between transport, land use and other areas of policy planning are
recognised and the 10-Year Plan seeks to deliver sustainable
development as well as transport objectives. The more recent White
Paper, ‘The Future of Transport: A Network for 2030’ (July 2004)
seeks to build on progress since 2000 and extend this vision over the
next 30 years. A key emphasis of this plan is to deliver improvements
in design and technology to better manage traffic in the future, and
hence the environment.
4.2.2. Current policy focuses on integration as a central defining principle.
This includes:
• integration between different modes of transport – so that each
mode maximises its potential and users can transfer easily
between them;
• integration with the environment – such that environmental
impacts are minimised and an enhanced natural and built
environment promoted;
• integration with land use planning – at national, regional and local
level such that transport and land use planning interact to support
more sustainable travel choices and reduce the need to travel; and
• integration with policies on education, health and wealth creation –
in order to promote equity and social inclusion.
4.2.3. Central to this approach is a reduction in car-dependency and the
promotion of more sustainable forms of transport and travel behaviour.
These themes are also replicated in planning policy, in the form of
Planning Policy Statements (PPS) and Planning Policy Guidance
(PPG). Both PPS6 (Planning for Town Centres) and PPG13
(Transport) underline the importance to sustainable development of
managing travel demand and reducing the number of single
occupancy car journeys. PPG13, in particular also highlights the
importance of an integrated approach to transport and land use
planning in order to reduce the need for travel.
294.2.4. These themes are also strongly evident in the ‘Full Guidance on Local
Transport Plans’, published in December 2004. This document
focuses on delivering outcomes that reflect the shared priorities
between central and local government, which are:
• improving access to jobs and services, particularly for those most
in need, in ways that are sustainable, especially by improving
public transport;
• improving safety;
• reducing congestion; and
• improving air quality.
4.2.5. National transport policy is reflected in the guidance documents
produced by the Department for Transport (DfT) for the appraisal of
transport schemes and for undertaking multimodal studies 8 .
4.2.6. In July 2003, the Government published ‘Managing Our Roads’, a
discussion paper contributing to the overall review and roll forward of
the Government’s 10 Year Plan. While recognising the crucial
contribution of public transport, and policies to promote alternative
travel arrangements, the document focussed on the strategic issues
facing the road network. The accompanying 2003 Traffic
Management Bill places a network management duty on local
authorities to keep traffic flowing and to co-operate with other
authorities to the same end.
4.2.7. In July 2004, the Government reissued its Ten Year Plan, extended to
2014/2015. This set out its strategy for enhancing local travel through:
• improved traffic flow on local roads delivered though measures
such as congestion charging;
• more reliable buses enjoying more road space;
• demand responsive bus services that provide accessibility in areas
that cannot support conventional services;
• looking at ways to make services more accessible so that people
have a real choice about when and how they travel;
8
‘Guidance on the New Approach to Appraisal’, July 1998, and ‘Guidance on the
Methodology for Multi-Modal Studies’ (GOMMMS), 2000
30• promoting the use of school travel plans, workplace travel plans
and personalised journey planning to encourage people to
consider alternatives to using their cars; and
• creating a culture and improved quality of local environment so
that cycling and walking are seen as an attractive alternative to car
travel for short journeys, particularly for children.
4.3. Regional Policy
4.3.1. Regional Assemblies in all English Regions are in the process of
preparing Regional Spatial Strategies (RSS) and Regional Transport
Strategies (RTS). The RSS for the South East is set out in Regional
Planning Guidance for the South East (RPG9). This is an important
instrument in ensuring the delivery of the Government’s objectives set
out in the Ten Year Plan. RPG9 included a Regional Transport
Strategy which reiterated the themes of an integrated approach to
support sustainable development, improved public transport, cycle and
pedestrian facilities, demand management, and improved accessibility
to rural areas.
4.3.2. In July 2004, SEERA published its Regional Transport Strategy,
replacing the transport chapter in the current version of RPG9. The
RTS covers a 15-20 year period with a particular focus on immediate
five-year regional transport priorities. It sets out regional priorities for
transport investment and management, across all modes, to support the
regional strategy, including the role of trunk roads and local highway
authority roads of regional or sub-regional significance.
4.3.3. The strategy also provides advice on the approach to be taken in setting
standards for the provision of off-street car parking, and guidance on
the strategic context for demand management measures such as road-
user charging and levies on private non-residential car parking.
4.3.4. SEERA’s strategy recognises that achieving a more sustainable pattern
of development is dependent upon accepting that the capacity of the
transport system within the South East will be constrained by the level
of financial resources available and the need to achieve a better
balance between economic, environmental and social objectives. This
will also necessitate the better integration of increased investment
within the transport system and the more active management of the
capacity and use thereof.
314.3.5. One of the other fundamental elements of the strategy is the
requirement to rebalance the transport system in favour of non-car
modes. The strategy places a strong emphasis on the need to bring
forward measures that should, over time, achieve a significant change
in the overall demand patterns including a higher proportion of
journeys being undertaken on foot, by cycle or by public transport.
4.3.6. The RTS envisages a high-quality transport system to act as a catalyst
for continued economic growth, and the emerging transport strategy for
Milton Keynes must be consistent with these proposals.
4.3.7. A revision to the RSS – referred to as the South East Plan – was issued
in March 2006, and is currently undergoing an examination in public
(EIP).
4.4. Milton Keynes & South Midlands Sub-Regional Strategy
4.4.1. In addition to the transport policies for the Regional Assembly, there
are also modifications to the existing sub-regional strategies emerging
from Government Offices for the South East / East Midlands and
Eastern England. The Milton Keynes & South Midlands (MKSM) Sub-
Regional strategy was published in March 2005 and has amended the
existing Regional Spatial Strategies for the areas concerned.
4.4.2. This strategy anticipates that the increased demand for travel from the
growth areas will place further pressures on the existing transport
system and will highlight the inadequate provision of infrastructure for
key strategic movements. To overcome these pressures, the strategy
for the growth area, which is consistent with the priorities within the
existing Regional Transport Strategies, will require:
• encouraging a shift towards more sustainable modes of travel;
• taking advantage of major improvements to the capacity, quality
and accessibility of key public transport facilities;
• increasingly applying demand management approaches to
influence travel behaviour and protect the capacity of the strategic
highway network; and
• investing in highway improvements to ensure that strategically
important movements are carried efficiently.
324.4.3. The strategy recognises that, whilst the measurements outlined above
will encourage a switch away from road traffic, significant
infrastructure investment will be required across all modes, if the
growth targets are to be met. It also provides guidance for improving
sustainable transport in each of the main growth areas, by providing a
high-quality, comprehensive public transport system. Each system
should ‘connect homes and workplaces, town centres, schools and
other key attractors, and interchanges to improve access to the inter-
urban rail network’. In parallel with these improvements, the strategy
recommends that these systems should be ‘accompanied by
improvements in pedestrian and cycle facilities, together with
appropriate traffic management measures, in order to achieve a
significant modal shift away from car use’.
4.4.4. The strategy also recognises that measures to promote sustainable
movements will need to be incorporated from the outset where
sustainable urban extensions or other major developments are
planned. In particular, it is recommended that ‘strong public transport
connections to town centres and employment areas will need to be
provided’, coupled with ‘connections into existing footpath, cycleway
and bridlepath networks’.
4.5. Local Transport Plan
4.5.1. The Local Transport Plan (LTP) 2006-2011 is a statutory document,
which has been adopted by the Council and supported by MKP. It
covers a wide range of local transport strategy issues, including:
• Sustainable Integrated Transport Strategy (SITS)
• Accessibility Strategy
• Bus Strategy/Long Term Public Transport Vision
• Cycling Strategy/Cycling Action Plan
• Walking Strategy
• Power Two Wheeler Strategy
• Road Safety Strategy
• Traffic Management Plan
• Transport Asset Management Plan
• Parking Strategy
334.5.2. The majority of these policy and strategy documents have been built
up over the past five years or so – many by being formally adopted by
the Council – and they have now been incorporated into the LTP.
However, this does not mean that the individual strategies cannot be
developed further during the five-year Plan period; indeed, there are
already plans to update and amend some of the strategy components.
For example, the Review has spent some of its time commenting on
drafts of the revised Bus Strategy 9 .
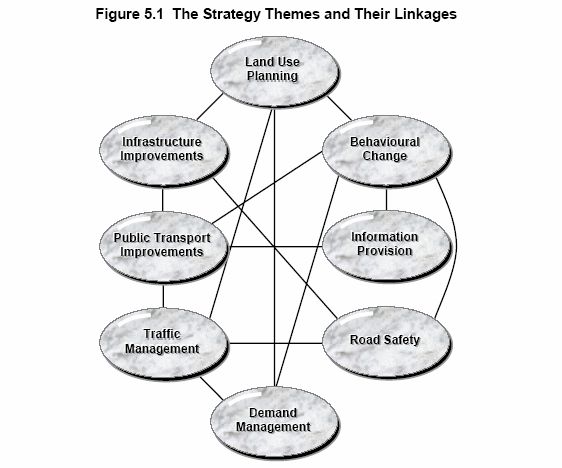
4.5.3. Furthermore, although the transport strategies are described
separately, the LTP acknowledges in broad terms that their themes
are linked, as indicated in Figure 9.
Figure 9: Strategy Themes and Linkages
Source: Milton Keynes Local Transport Plan 2006-2011
9
This is an important annex to the LTP that brings together all the previous policies and
strategies relating to improvements to bus services, including the Long Term Public
Transport Vision which was formally adopted by the Council in 2003. This latest Bus
Strategy is currently still in draft, but is expected to be released for consultation within the
next few months.
344.5.4. There is also an analysis – again in very broad terms – of the potential
contribution of the ‘strategy themes’ to the Plan’s objectives (Figure
10). The Plan concludes that all of these approaches will need to be
developed further if the desired objectives are to be achieved.
Figure 10: Potential Contribution of Strategy Themes to Objectives
Source: Milton Keynes Local Transport Plan 2006-2011
4.5.5. Another function of the Local Transport Plan is to set targets (or
‘indicators’) for the plan period. These are monitored and the results
are published annually in an Annual Progress Report. Further
discussion of these targets, and the results of recent monitoring, is
provided in Chapter 6 (Section 6.8)
4.5.6. The Local Transport Plan thus forms the basis of the Council’s current
transport strategy, and links to the associated national, regional and
sub-regional strategies, which it supports. As such, this Review has
used it as the starting point for its work, with a view to extending and
strengthening its conclusions and ensuring that its key policies are
communicated to all stakeholders, especially the public, in a simple
and easy to understand form.
35You can also read