Alternate Ridership Growth Strategy - TTC Riders
←
→
Page content transcription
If your browser does not render page correctly, please read the page content below
Alternate Ridership Growth Strategy
Table of Contents
INTRODUCTION ……………………………………………………………………………………….. 2
   Public Transit and Climate Change ……………………………………………………………… 3
      i. Greenhouse Gas (GHG) Emission Calculations ………………………………………… 3

PATH 1: GOOD SERVICE …………………………………………………………………………….. 5
   1.1 Surface Transit Priority ……………………………………………………………………….. 7
   1.2 More Frequent Service ……………………………………………………………………….. 9
       1.2.1 Bus Network …………………………………………………………………………….. 9
       1.2.2 Streetcar Network ………………………………………………………………………..12
       1.2.3 Subway System ………………………………………………………………………….13

PATH 2: FULLY ACCESSIBLE ……………………………………………………………………….16
   2.1 Free of Harassment & Descrimination ……………………………………………………….17
   2.2 Supportive Communications & Wayfinding ………………………………………………….18
   2.3 Adequate Physical Infrastructure ……………………………………………………………..18
   2.4 Reliable Wheel-Trans Service ……………………………………………………………….. 19
   2.5 A Fair PRESTO System ……………………………………………………………………….20
   2.6 Safe Transit Access ……………………………………………………………………………21

PATH 3: AFFORDABLE FOR ALL …………………………………………………………………..23
   3.1 Lower Fares …………………………………………………………………………………….24
  3.2 Fair Fare Integration ……………………………………………………………………………26

PATH 4: CITY-WIDE RAPID TRANSIT ………………………………………………………………29
   4.1 Public-Private Partnerships (P3's) ……………………………………………………………31
   4.2 Supporting Sustainable Communities……………………………………………………….. 31
   4.3 Bus Rapid Transit (BRT) Network …………………………………………………………… 32
   4.4 Light Rail Transit (LRT) Network ……………………………………………………………..32
   4.5 Subway Network ………………………………………………………………………………. 33

EQUITABLE REVENUE TOOLS ………………………………………………………………………35

                               1
Introduction
Good public transit is key to a connected and thriving city.1 Transit provides access to jobs and
services, connects people their community, reduces traffic congestion and mitigates climate change.

Despite rapid population growth and worsening traffic congestion in the Greater Toronto Area (GTA),
TTC ridership has stagnated since 2015, primarily due to poor service.2 We do not have the fast,
affordable and comfortable transit service that we need. Inadequate service, such as overcrowding,
long wait times, lengthy and regular delays and rising fares, has kept more Torontonians from choosing
the TTC to move around the city.

                                                                 The cause of poor service is no secret.
                                                                 The TTC has been chronically
                                                                 underfunded since the 1990s, when it
                                                                 lost stable operating funding from the
                                                                 Provincial Government. Under these
                                                                 conditions, the TTC has been forced to
                                                                 compromise service quality and
                                                                 accessibility for transit riders across
                                                                 the city and increase fares faster than
                                                                 inflation in an attempt to fill the funding
                                                                 gap.

                                                                 Figure 1: Transit subsidy comparison of major
                                                                                                    3
                                                                 North American cities (CodeRedTO).

The TTC has already outlined solutions necessary to address the ridership problem; its 2003 Ridership
Growth Strategy presented a fully-costed, comprehensive multi-year plan to increase ridership.
Although partial implementation of this strategy did lead to steady growth in ridership until 2010, rising
fares, aging infrastructure, and unreliable service have disincentivized people from choosing transit.
The TTC’s recent Ridership Growth Strategy for 2018-2022 falls short of presenting realistic and
genuine efforts to support ridership growth and consequently, lacks a bold plan or costing beyond the
first year.

In order to address this gap, TTCriders has prepared this alternative strategy to provide clear paths
towards fast, reliable and accessible TTC service that is affordable for everyone. These are proven
strategies for increasing ridership.4 Most are based on the TTC’s own recommendations made over the
past 20 years that never received funding to be fully implemented.

Better Transit Now call for:
   1) Good Service
   2) Fully Accessible
   3) Affordable for All
   4) Rapid Transit City-Wide

In recent months, questions have been raised about how bad our ridership problem is. With the
conversion of monthly passes to PRESTO, a faulty PRESTO fare system and supposedly rising rates

                                                    2
of fare evasion, it’s hard to get an accurate picture of TTC ridership. While ridership may not be
declining to the extent that has been reported by the TTC, it is clear that better, more affordable service
is a must to meet people’s needs and achieve the city’s climate goals as our neighbourhoods continue
to rapidly densify. Good transit is essential to building an equitable and sustainable city.

A fairly funded TTC budget is required to implement the measures outlined in this strategy. There are
many ways that the City of Toronto and Province of Ontario can raise more revenue and reallocate
funds to better serve Torontonians. The closing section of this document includes examples of new
revenue tools that can be introduced or enhanced to fund better service and lower fares.

Public Transit and Climate Change
The climate crisis is a threat in our own communities in Toronto and impacts other populations around
the world. We are already seeing the devastating impacts here, with larger and more regular storms,
extreme weather, flooding and more. While climate change effects everyone, it has a disproportionate
impact on working class, low-income and racialized communities and will fuel more conflict and
displacement worldwide. As major contributors to climate change, we must develop a reponse to this
crisis.

Increasing public transit ridership is a critical component of Toronto’s climate change mitigation goals.
Transportation contributes 38% of Toronto’s overall GHG emissions, 80% of which is due to passenger
vehicles.5
                                                                  Currently in Toronto, the majority of
                                                                  people travel to work by car (68%),
                                                                  while only 25% of people take public
                                                                  transit. Public transit is a low-carbon,
                                                                  sustainable transportation solution and
                                                                  it must be an affordable and reliable
                                                                  option to move around our city, so that
                                                                  more people move out of cars and
                                                                  onto transit.

                                                                  Figure 2: Transportation mode share for
                                                                                                 6
                                                                  commuters who work in Toronto.

i. Greenhouse Gas (GHG) Emission Calculations
Key strategies included in this report were used to demonstrate the ridership growth potential of
improving transit service and making it more affordable.

For every person that takes a 7.5km trip on transit instead of by car, 1kg7 of CO2 are not emitted into
the atmosphere. The GHG reduction has been estimated for each set of strategies to demonstrate why
good transit is essential to combating climate change.

If all the strategies in this booklet are implemented, the city could achieve a savings of 57,781 tons of
CO2 emissions per year, the equivalent of 13,532 homes’ energy use or the amount absorbed by 2.4
million trees per year.8 9

                                                    3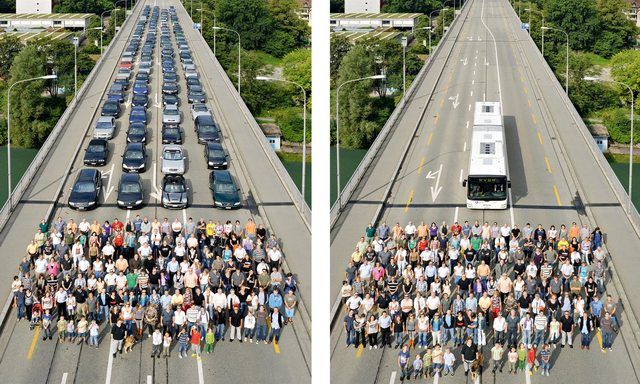
The GHG reduction has been estimated for a set of key strategies to grow ridership to demonstrate why
good transit is essential to combating climate change.

As the TTC transitions to an all-electric bus fleet, the potential to reduce GHG emissions will be even
greater by 2040.10
1
  Toronto Foundation. (2018). Toronto’s Vital Signs. Retrieved from https://torontofoundation.ca/wp-content/uploads/2018/01/TF-VS-web-
FINAL-4MB.pdf.
2
  City of Toronto Chief Executive Officer to TTC Board. (2018, January 25). Ridership Growth Strategy 2018-2022, Report for Action.
2
  City of Toronto Chief Executive Officer to TTC Board. (2018, January 25). Ridership Growth Strategy 2018-2022, Report for Action.
Retrieved from
https://www.ttc.ca/About_the_TTC/Commission_reports_and_information/Commission_meetings/2018/January_25/Reports/2_Ridership_Gro
wth_Strategy_2018-2022.pdf.
3
  CodeRedTO. (2018). Mixed Signals: Toronto Transit in a North American Context. Retrieved from https://coderedto.com/wp-
content/uploads/2018/11/CodeRedTO_MixedSignals.pdf
4
  Boisjoly, G., et al. (2018). Invest in the Ride: A 14 Year Longitudinal Analysis of the Determinants of Public Transport Ridership in 25 North
American Cities. Transport Research Part A: Policy and Practice, 116, 434-445. doi.org/10.1016/j.tra.2018.07.005.
5
  Toronto’s 2016 Greenhouse Gas Emissions Inventory. Retrieved from
https://www.toronto.ca/services-payments/water-environment/environmentally-friendly-city-initiatives/transformto/torontos-greenhouse-gas-
inventory/.
6
  Statistics Canada (2019 May). Results form the 2016 Census: Commuting within Canada’s largest cities. Retrieved from:
https://www150.statcan.gc.ca/n1/pub/75-006-x/2019001/article/00008-eng.htm
7
  Based on 1.12 average car passengers, 2017 mode share by subway, bus, and streetcar, and 2017 average km travelled by transit vehicles
per passenger, and emissions factors as listed in calculations spreadsheet at ttcriders.ca/bettertransitnow
8
  Natural Resources Canada. (2019 July) Greenhouse Gas Equivalencies Calculator. Retrieved from
http://oee.nrcan.gc.ca/corporate/statistics/neud/dpa/calculator/ghg-calculator.cfm#results
9
  Urban Forestry Network. Trees Improve our Air Quality. Retrieved from http://urbanforestrynetwork.org/benefits/air%20quality.htm
10
   TTC Green Initiatives. [webpage] Retrieved from https://www.ttc.ca/Riding_the_TTC/green_initiatives.jsp
                                                                       4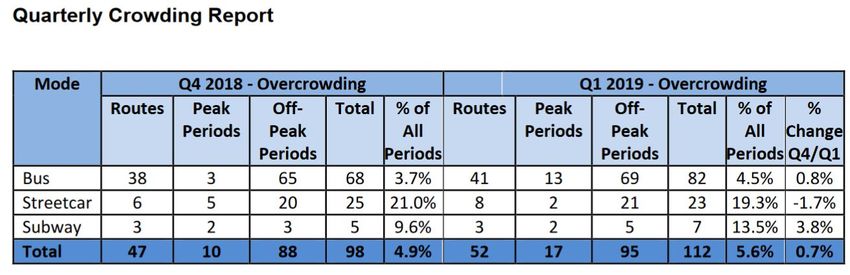
PATH 1: GOOD SERVICE

Good service means that transit is fast and reliable and that people can be
    confident in the TTC to get them where they need to go on time.

                                    5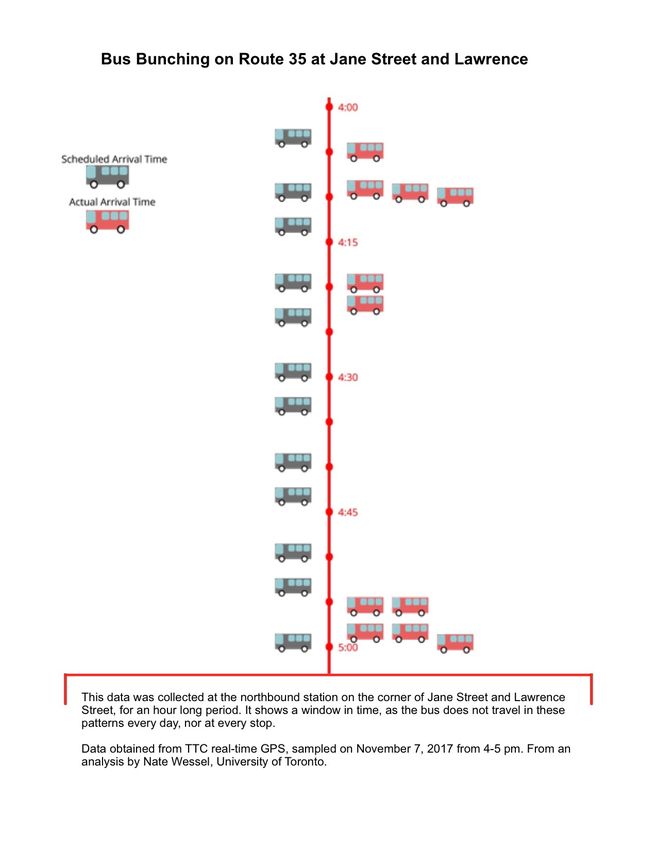
Improving TTC service requires more than simply increasing the number of buses, streetcars and
subways travelling on our network. It must also be accompanied by meaningful investments in
prioritizing surface transit vehicles on shared roadways as well as improving the accessibility and safety
of stations and vehicles. A full upgrade of the TTC’s subway technology is also needed to allow more
vehicles to run on our subway network.
11
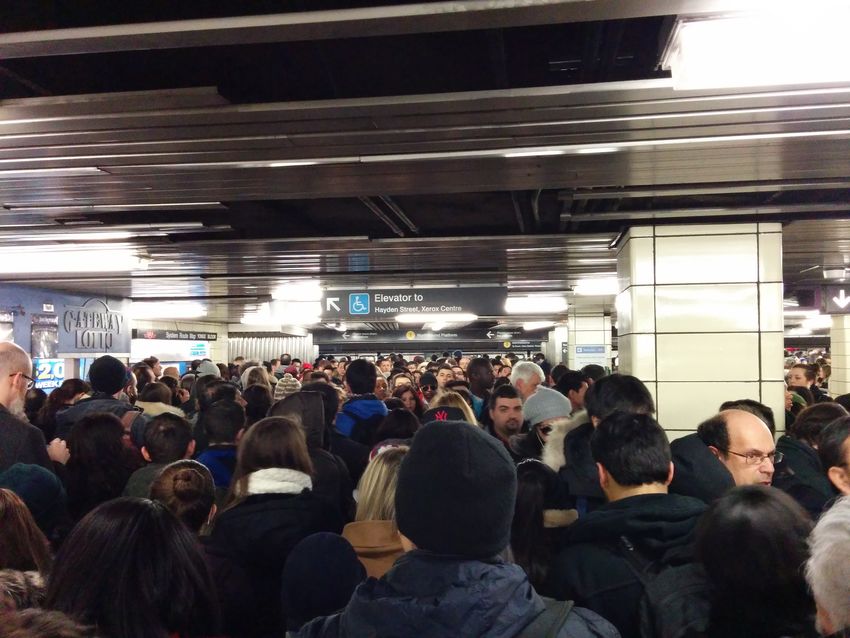
Figure 3: TTC Quarterly Crowding Report, March 2019.
In the first three months of 2019, 41 bus routes and eight streetcar routes exceeded the TTC’s
crowding standards at some point during weekday service.12 This overcrowding is not just happening
during rush hour, when additional vehicles are not available to increase service frequency, but also
during off-peak hours. This means that more service is possible, but there isn’t money to pay for it.
Delays and unreliable service are also a common
experience on the TTC. In 2018 there we 73,927 unique
delays on the bus network averaging approximately 28
minutes.13 Many cite bus bunching as inconvenient and
frustrating. Passengers can wait for up to 25 minutes and
then three buses come all at once. Often this is caused
by traffic congestion along the route, which slows down
buses. Overcrowding also causes delays because more
passengers means longer boarding times. While route
management and service schedules can play a role in
mitigating the bunching issue,14 traffic congestion and
overcrowding are at the root cause of chronic delays.
“I'm tired of this Keele bus. It's ridiculous. I've
waited up to an hour for this stupid bus and
then two come together, overcrowded. I'm sick
and tired. What am I paying TTC for? Please,
we need better service!”
-Tamika C., 41 Keele Rider
Figure 4: Real-time service on a fall day on the 35 Jane
15
bus.
Steady, incremental improvements to existing service are a proven way to build transit ridership. The
more service provided, the more people will take transit.16
6
“North American transit ridership decline cannot be
explained merely by gas price fluctuations or the
emergence of new mobility services—instead, it is
16
best explained by declining bus services…. Cities
must properly fund their public transit operations,
especially bus services, to ensure a steady increase
in ridership.”
- McGill University “Invest in the Ride” Study
17
Figure 5 (left): Real-time service on a fall day on the 41 Keele bus.
Measuring Service
Reported crowding delays are based on the way that the
TTC currently measures service. To measure delays, they
primarily look at departure/arrival times at the beginning
and end of each trip as well as the average load from all
vehicles on a route. Both fail to capture the everyday experience of riders, who might be on a crammed
bus driving one minute in front of an empty one. The TTC needs a better way to measure service levels
in order to properly identify and resolve service issues.
Figure 6: Space to move
people in cars and buses.
1.1 Surface Transit Priority
What we need:
§ Accelerate the development of a comprehensive and bold Transit Priority Plan that
adequately addresses the needs of high ridership surface routes.
§ Fully fund and implement the Transit Priority Plan.
§ Construct 3 approved queue-jump lanes on Lawrence Ave, Finch Ave., and Steeles Ave. by
the end of 2019.18
§ Initiate transit priority pilot projects for remaining 8 corridors identified as too narrow to
accommodate higher order transit in the 2003 RGS.19
7
§ Study and implement adequate transit priority on 20 busy bus routes and all streetcar
routes.
Despite having surface ridership that dwarfs all other transit agencies in the Greater Toronto Hamilton
Area (GTHA) combined, Toronto currently has less on-street, dedicated bus right-of-ways than
Newmarket.20 Toronto has only a single piece of dedicated bus infrastructure, the York University
Busway.
The City’s Official Plan identifies corridors in need of transit priority in a “Surface Transit Priority
Network” map, last updated in 2010.21 The only routes with significant progress made are on St. Clair
and King Street, two projects that led to enormous ridership growth of 13% and 16% respectively but
required significant public pressure and political will to be realized.22 23 A new version of this network is
included in the city’s Official Plan Review, and identifies even more corridors that need priority
measures.
Transit riders are waiting for a comprehensive transit priority plan for Toronto, and the current approach
is slow and piece-meal. This is evidenced by the fact that only three queue-jump lanes have been
approved by City Council over the past three years, with none built to date.
Transit priority aims to put transit first by allowing vehicles to bypass traffic. It is an essential strategy to
improve existing service. In addition, priority measures can be implemented far faster than most rail
projects, and can build the demand needed to justify future higher order transit development.
Transit vehicles are enormously more efficient than single-occupancy vehicles. The TTC estimates that
a single bus can replace 45 cars, an articulated bus 70 cars and a streetcar 95 cars.24 When transit
vehicles operate in mixed-use traffic, they are held up by congestion, which leads to inefficient service
due to delays, vehicle bunching and overcrowding.
Prioritizing transit improves the efficiency of service delivery. In 2018, the 504 King and 512 St Clair
Streetcar lines had the best “value for money” of all streetcar lines and are two of just four routes with
strong transit priority measures.25
Transit priority comes in many forms to suit the characteristics and needs of a given transit corridor,
including:26
§ transit signal priority or other signal timing
changes
§ high-occupancy vehicles lanes
§ partially or fully exclusive transit lanes
§ turn restrictions for non-transit vehicles
§ limiting or removing on-street parking during
part or all of the day
§ transit queue-jump lanes
27 28
Figure 7: Annual summary of ridership growth during King Street Pilot.
8
SUCCESS STORY – The King St. Pilot has successfully shown that giving transit vehicles priority to improve
reliability and speed of service is a cost-effective way to grow transit ridership on the TTC. The overall cost for
implementation was $3 million. During the year-long pilot, weekday ridership grew by over 16%, from 72,000 to
28
84,000 passengers daily.
Lessons from the King Street Pilot (& recommendations for future transit priority projects):
• Continue public engagement throughout the implementation of a new project
• Develop a robust communications strategy and be ready to combat fake information
• Keep accessibility in mind for temporary changes to route / stops
• Implement in good weather seasons if it is a major change to the road
• Plan events and activities in collaboration with local stakeholders to raise awareness of the
project and bring the local community together
• Ensure signage is clear and understandable for everyone
• Try pilots of different lengths to get quick information about the potential for a strategy
• Test bold variations of priority measures to demonstrate potential
• Design the transit priority measures to be intuitive for all road users
• Collect sound baseline data before implementing and measuring a new project
• Look at other cities for good examples
1.2 More Frequent Service
What we need:
§ 25% increase in daytime local and express surface service with:
o 10-minute or better service on all routes from 6AM to 1AM and,
o 20-minute or better service on all nighttime routes
§ Capital funding for the TTC to build two more bus storage facilities, beyond the McNicoll
garage.
§ Purchase 500 new buses and 60 new streetcars, to enable a 25% increase in service.
1.2.1 Bus Network
On an average day, TTC buses carry more than half of the TTC’s trips and move more people than
every other transit agency in the GTHA combined. Despite their enormous ridership, TTC buses are
chronically underfunded, with unreliable service, cramped conditions, virtually no priority measures, and
inadequate amenities. By contrast, suburban bus systems in the GTHA have seen major investments
for bus rapid transit systems with far lower ridership than the TTC.
The TTC’s bus fleet has barely increased in size over the past decade. While capacity has improved
with the introduction of articulated buses, only six additional buses are in scheduled service compared
to 2009.29
9As a result, service levels
have barely changed, and
some bus routes on the
TTC even have less
frequent service than they
did ten years ago. This
includes some extremely
busy corridors like
Lawrence East, Sheppard
East, and Dufferin.30
Figure 8: Comparison of 2017
average weekday bus ridership
in the GTHA by transit
31 32 33 34 35
agency.
SUCCESS STORY – Vancouver’s Service Increases: For its 10-Year Vision plan, Vancouver’s Translink
33
has provided nearly $2 billion for system maintenance and service increases since 2017. Phase One and
Two will see an 18% increase in bus service, including the introduction of 7 express bus routes. Translink’s
34 35
bus ridership increased by 8% from 2017 to 2018, while the TTC's bus ridership went up by just 1%.
Vancouver shows that the formula for ridership growth is simple: improve existing service and build new
transit infrastructure at the same time.
Express Service
What we need:
§ Implement route enhancements for 9 existing express routes identified in the 2018-2021
network plan.
§ Faster rollout of long term express bus network plan 2021-2026.
§ More expansive service on existing routes (all-day).
Many of the TTC’s express buses have attracted more riders than initially projected. Express bus
routes make trips faster for riders going long distances and increases the overall capacity of a route to
encourage more ridership
In 2017, the TTC published an Express Bus Network Study, which includes short and long term plans
to improve existing bus services and introduce new routes. While welcome, the plan is modest in
comparison with bus improvement plans in other cities.36
The plan was partially implemented early in the fall of 2018, in advance of the municipal election.
Unfortunately, it was largely a rebranding exercise of the existing express network, with minimal
improvements and only five new routes.37 On most routes, including Weston Road and Dufferin,
express service actually replaced some existing local service, adding little capacity to the route and
making service less frequent for riders taking local trips. Whereas a local bus was scheduled every 5
minutes at peak hours, it now comes every 8 minutes. Express buses shouls be used to supplement
existing service.
10The TTC Board also approved all-door boarding on Route 192-Airport Rocket (renumbered 900) in
2018 as a pilot project.38 This was to be the first step in rolling out all-door boarding across all “Tier 1”39
express routes. All-door boarding is an important step in speeding up express buses, as the TTC
estimates the time it takes customers to board a bus represents 20% of that route’s scheduled time on
the road.
Blue Night Network
What we need:
§ Increase half hour service to 20-minutes or better service.
§ Restore timed connections wherever possible and publish schedules for major stops.
§ Set standards to follow route schedules, waiting at major stops if running early to ensure the
service is reliable for riders.
The Blue Night Network provides overnight transit service every 30 minutes or less.40 Routes are
designed so that 95% of the population and employment is within a 15-minute walking distance of a
night bus route.41
Toronto has an increasingly high demand for nighttime travel. Shift work has steadily increased over
the past two decade.42 People working late-night, overnight or early morning shifts rely on nightime
service to access this employment.43 In addition, Toronto’s vibrant nightlife leaves restaurant and bar
workers and customers in need of travel on weekend nights.
The last major expansion of the overnight TTC service was in 2015 when 16 new or enhanced routes
were implemented with the goal of service every 30 minutes or better.44 The expanded service was
projected to attract 300,000 new customer trips in addition to the existing four million annual riders.45
Despite the improved service, the Blue Night Network is underutilized due to the long waits and transfer
times and is a barrier to employment for many who cannot afford the cost of owning a car.46 Instead,
rideshare services are currently filling a big portion of the nighttime travel need.47 Reliance on
ridesharing causes a host of problems, including a high cost for the rider, poor quality of employment
for drivers and and keep congestion in popular areas.
By investing in increased service frequency and a more integrated
network, the TTC could become a more viable option for all late
night travellers.
Bus Capacity Improvements
In addition to chronic underfunding of everyday operations, the
TTC’s bus service has been limited by the capacity of their bus fleet
and garage facilities. For years, storage capacity has been
dramatically lower than the demand for buses to run more frequent
service. This has led to very few service improvements in the past
decade during peak travel times, when demand for buses is
highest.48
Figure 9 (right): Bus capacity projections in TTC’s Proposed 2018-2027 Capital
49
Budget Plan.
11When the McNicoll garage opens in 2020, demand for bus service will already exceed additional
capacity.50 Unless plans are put in motion to acquire two new storage facilities service will continue to
be constrained by capacity rather than need. Alongside the purchase of new garages, the TTC needs
to purchase an estimated 500 new buses to meet this strategy’s call for a 25% increase in service.51
1.2.2 Streetcar Network
What we need:
§ Purchase 60 new streetcars beyond what is currently planned.
§ Operate routes 502 and 503 at all times of the day and on weekends.
§ Minimize short terms.
Unlike many other cities, where streetcars are only a tourist novelty, in Toronto they provide the vast
majority of surface transit service in the downtown core. In addition, five of the ten most heavily used
surface routes across the whole TTC system are streetcars. Overall, the network carries over 280,000
riders on an average weekday.52
Like much of the TTC’s bus network, streetcars suffer from overcrowding, unreliability and infrequent
service on the outer portions of some lines.53 All of this drives away potential ridership. Inadequate
service frequency, capacity and reliability is mainly due to two issues: a shortage of streetcar vehicles
resulting in replacement buses servicing many streetcar routes regularly and bad traffic congestion in
the downtown core.
Since so many streetcar routes serve newly densifying areas to the immediate east or west of
downtown, there is considerable latent demand.54 This was demonstrated by the steep increase in
ridership on the 504 King streetcar when service was improved through the King Street Pilot project.
Riders at the ends of long streetcar routes,
such as those waiting for a 501 Queen
streetcar in the Beach or a 506 Dundas
streetcar near High Park, often deal with
low frequency as vehicles are short turned
to service central sections of the route
during congested times. Additionally, routes
502 and 503 only operate during rush hour.
More service and transit priority measures,
like exclusive right-of-ways, are needed to
address issues experienced by streetcar
riders.
55
Figure 10: Breakdown of 15-year base capital investment requirements for the TTC.
12Streetcar Capacity Improvements
The TTC has a streetcar shortage. Presently, this is due to late deliveries from Bombardier, their
supplier, but the general shortage problem has existed for decades.56
More streetcars will need to be put into service in order to make increased frequency possible. The
ongoing replacement of the TTC’s older streetcar vehicles with new low-floor and accessible
Bombardier vehicles has not been on a one for one basis due to the higher capacity of the Bombardier
cars. The TTC needs to meaningfully invest in expanding capacity, not just replace aging vehicles. Like
bus garage capacity issues, the TTC does not have enough streetcar storage space to expand its fleet.
Additionslly, with transit priority measures improving service reliability and speed, demand would rapidly
surpass the added capacity if there isn’t a net increase in the fleet, above what is currently planned.
1.2.3 Subway System
What we need:
§ Full funding of the TTC’s base capital investment requirements.
§ Automatic Train Control (ATC) on Yonge-University and Bloor-Danforth.
§ ATC included in the base design of any new subway extensions.
§ Replacement of the T1-model subway car fleet for Bloor-Danforth line.
A lack of adequate funding for the TTC’s capital budget has resulted in delays to capacity and
technology improvements, leaving an aging system that has failed to keep up with demand. The TTC’s
15-Year Capital Investment Plan identifies 33.5 billion in funding needed to ensure the system is in a
state of good repair, maintain existing service and meet projected future ridership, 53% of this total is
needed for subway maintenance and upgrades.57
The plan identifies $13.5 billion in unfunded projects for subway maintenance and upgrades. These
include many major projects, like Line 1 and 2 Capacity Enhancements, Bloor-Yonge Capacity
Improvements, Subway Car Life Extension, and Bloor-Danforth ATC Resignalling.
The consequences of years of neglect due to underfunding are already felt by riders, who wait on
dangerously crowded subway platforms and have to watch two or three full subways pass by before
squeezing onto the fourth one. This will get worse once the system’s limits are reached by 2026.58
The modernization of TTC technology and the expansion of existing stations are needed to enable
more frequent service. These upgrades are complex, long-term projects that require large capital
investments.
Automatic Train Control
The TTC’s subway system is over 60 years old and much of it still operates using the original automatic
block signaling system, meaning that substantial buffers must be maintained between trains. The
installation of automatic train control, which will enable the TTC to reduce the buffer and increase train
frequency, is underway on the Yonge-University line, but there is no funding dedicated to upgrades for
the Bloor-Danforth line. While the line may not require more service today, this long and expensive
upgrade process will be needed soon.59
13Fleet Upgrades
The TTC’s subway train fleet for the Bloor-Danforth line (T1 trains) are not equipped with ATC
technology and will reach their end of life by 2026 without a pricey, and technically challenging
overhaul.60 While some efforts are being made to extend their life, new trains with ATC capacity must
be purchased in order for service to be improved. As ridership demand increases, more subway trains
and storage capacity are needed to increase the service’s frequency.
Station Capacity Improvements
Rush hour crowding in the TTC’s busiest subway stations already poses a real safety risk for
passengers, especially for young children, seniors, and people with disabilities.
As service improvements make room for more
riders, addressing this capacity issue will become
even more critical. For example, the Bloor-Yonge
station was not designed for the number of riders
transferring during peak hours. The TTC and City
are planning to renovate this station to expand
capacity, but they still lack certainty about full
funding for the project, with only 50% of the
projected costs allocated by federal funding from
the Public Transit Infrastructure Fund (PTIF).61 62
Figure 11: Bloor-Yonge platform crowding during a service disruption.
11
Munro, Steve. (2019, May 23). TTC Crowding Quarterly Report Details. [Web blog post]. Retrieved from
https://stevemunro.ca/2019/05/23/ttc-crowding-quarterly-report-details/.
12
Spurr, Ben. (2019, May 31). Nearly a third of TTC bus and streetcar routes experience overcrowding, report says. The Toronto Star.
Retrieved from https://www.thestar.com/news/gta/2019/05/31/nearly-a-third-of-ttc-bus-and-streetcar-routes-experience-overcrowding-report-
says.html.
13
Toronto Transit Commission. (2019 March 21) TTC Bus Delay Data. City of Toronto Open Data Portal [analyzed dataset] Retrieved from
https://portal0.cf.opendata.inter.sandbox-toronto.ca/dataset/ttc-bus-delay-data/
14
TTC Chief Customer Officer to TTC Board. (2019, June 12) Improvements to Surface Transit Schedules. Report for Action. Retrieved from
https://www.ttc.ca/About_the_TTC/Commission_reports_and_information/Commission_meetings/2019/June_12/Reports/17_Improvements_to
_Surface_Transit_Schedules.pdf.
15
Data from TTC real-time GPS, sampled on November 7, 2017 from 4-5 pm at northbound stop on Jane St. at Lawrence Ave. W. It shows a
window in time, as the bus does not travel in these patterns every day, nor at every stop. From an analysis by Nate Wessel, University of
Toronto.
16
Boisjoly, G., et al. (2018). Invest in the Ride: A 14 Year Longitudinal Analysis of the Determinants of Public Transport Ridership in 25 North
American Cities. Transport Research Part A: Policy and Practice, 116, 434-445. doi.org/10.1016/j.tra.2018.07.005.
17
Data from TTC real-time GPS, sampled on November 7, 2017 from 5:30-6:30 pm at northbound stop on Keele St at Lawrence Ave. W. It
shows a window in time, as the bus does not travel in these patterns every day, nor at every stop. From an analysis by Nate Wessel,
University of Toronto.
18
Funding from Federal Public Transit Infrastructure Fund (PTIF) must be spent by the end of 2019.
19
The TTC’s 2003 Ridership Growth Strategy identified 11 corridors that warranted transit priority, but were too narrow to accommodate
higher-order transit/right-of-ways. Only one of these corridors, on King St., is actually operating and is on a shorter route than originally
proposed.
20
The provincial government provided $260 million for York Region’s Viva Yellow BRT corridor in Newmarket. Viva Yellow carries
th
approximately 1,200 people a day, roughly the same as the TTC’s 125 busiest bus route.
21
Toronto City Planning Division. (2010, December). Toronto Official Plan: Surface Transit Priority Network - Map 5. Retrieved from
https://www.toronto.ca/wp-content/uploads/2017/11/97cd-cp-official-plan-Map-05_OP_Surface_Transit_AODA.pdf.
22
Bambach, Matthew and Murat Yskeur, Globe and Mail. How the St. Clair right-of-way changed the Avenue [Infographic]. Retrieved from:
https://transit.toronto.on.ca/images/stclair-infographi_1371741a.jpg
23
City Planning, Transportation Services, and TTC. (2019 April 2). The Future of King Street: Results of the Transit Pilot. [EX4.2 Report for
Action to Executive Committee] Retrieved from https://www.toronto.ca/legdocs/mmis/2019/ex/bgrd/backgroundfile-131188.pdf
24
Know Your TTC: Moving Towards a Better Tomorrow. Retrieved from
https://www.ttc.ca/Riding_the_TTC/Moving_Towards_a_Better_Tomorrow/index.jsp.
1425
Transportation Services, City Planning, and the TTC. (2019, April). The Future of King Street: Results of the Transit Pilot. Retrieved from
https://www.toronto.ca/legdocs/mmis/2019/ex/bgrd/backgroundfile-131188.pdf
26
Stewart, Ron and Roland Wong. (2013). Guidelines for Planning and Implementation fo Transit Priority Measures (TPM) in Urban Areas. IBI
Group. Retrieved from http://conf.tac-atc.ca/english/annualconference/tac2013/session10/stewart.pdf
27
City of Toronto & TTC. (2019). King Street Transit Pilot: Annual Summary. Retrieved from https://www.toronto.ca/wp-
content/uploads/2019/04/8fb5-TS_King-Street-Annual-Dashboard_Final.pdf.
28
Ibid.
29
Munro, Steve. (2018, August 14). Why Can’t I Get on My Bus [Web blog post]. Retrieved from https://stevemunro.ca/2018/08/14/why-cant-i-
get-on-my-bus-ii/. The TTC had 1,486 buses in scheduled service in 2009, which increased by only six buses to 1,492 in late 2017.
30
Ibid.
31
American Public Transportation Association. (2017) Public Transportation Ridership Report Third Quarter 2017. Retrieved from
https://www.apta.com/resources/statistics/Documents/Ridership/2017-Q3-Ridership-APTA.pdf.
32
Mississauga City Business Plan & Budget. (2018). Retrieved from http://www.mississauga.ca/portal/cityhall/budget-transit. (2017 data).
33
Translink (2019). The 10-Year Vision for Metro Vancouver Transportation. [web page]. Retrieved from https://tenyearvision.translink.ca/
34
Translink (2018) 2018 Transit Service Performance Review. Retreived from https://www.translink.ca/-
/media/Documents/plans_and_projects/managing_the_transit_network/2018-TSPR/2018-Transit-Service-Performance-
Review.pdf?la=en&hash=0A0388E9606F37209443E060FC7044AC0A46E0BC
35
Toronto Transit Commission (2019 May). TTC Ridership Analysis [Dataset]. City of Toronto Open Data Catalogue. Retrieved from
https://portal0.cf.opendata.inter.sandbox-toronto.ca/dataset/ttc-ridership-analysis/
36
TTC Express Bus Network Plan calls for 38 new articulated buses, and a small number of traffic priority measures: 80 transit priority signals
and three bus queue jumps at busy intersections.
37
Munro, Steve. (2019 January 17). Express Buses: Real Change or Photo Ops? [webpage]. Retrieved from
https://stevemunro.ca/2019/01/17/express-buses-real-change-or-photo-ops/
38
Toronto Transit Commission CFO. (2017 June 15). Express Bus Network Study. [Report for Action to TTCBoard]
https://www.ttc.ca/About_the_TTC/Commission_reports_and_information/Commission_meetings/2017/June_15/Reports/6_Express_Bus_Net
work_Study_combined.pdf
39
Tier 1 routes are those express routes that operate all-day.
40
The Blue Night Network operates from approximately 1:30 a.m. and 5:30 a.m Monday-Saturday and until 8:00 a.m. on Sundays.
41
TTC Service Standards and Decision Rules for Planning Transit Service. (2017). Retrieved from
https://www.ttc.ca/PDF/Transit_Planning/TTC_Service_Standards.pdf.; Pagliaro, Jennifer. (2015, May24). New, expanded bus routes to
provide ‘reliable’ overnight, weekend service. The Toronto Star. Retrieved from
https://www.thestar.com/news/city_hall/2015/05/24/new-expanded-bus-routes-to-provide-reliable-overnight-weekend-service.html.
42
UBC School of Population and Public Health. Shift Work and Injuries. Retrieved from http://pwhs.ubc.ca/research/determinants-of-work-
injury-and-illness/shift-work-and-injuries/.
43
The Martin Prosperity Institute. (2012 August). Blue Night Insight. Retrieved from http://martinprosperity.org/wp-
content/uploads/2012/08/Blue-Night-Insight_v02.pdf
44
Toronto Transit Commission. (2015 August 28). TTC service changes starting Sept. 6 August 28, 2015. [webpage]
https://www.ttc.ca/News/2015/August/082815NR.jsp
45
Toronto Transit Commission CEO. (2015 May 27) Improvements to Overnight Blue Night Service Network.
http://ttc.ca/About_the_TTC/Commission_reports_and_information/Commission_meetings/2015/May_27/Reports/Improvements_to_Overnight
_Blue_Night_Service_Network_BR%201729.pdf
46
The Jane-Finch TSNS Task Force. (2017). Community Response to the Toronto Strong Neighbourhoods Strategy 2020: What
Neighbourhood Improvement Looks Like From the Perspective of the Residents of Jane-Finch. Retrieved from
https://city.apps01.yorku.ca/wp-content/uploads/2017/10/TSNS-Research-Report-August-12-2015.pdf.
47
Murphy Colin. (2018, January 25). What Can Transit Agencies Learn from TNCs’ Late-Night Popularity? [Web Blog Post]. Shared Use
Mobility Center.
Retrieved from https://sharedusemobilitycenter.org/research/what-can-transit-agencies-learn-from-tncs-late-night-popularity/.; Uber. Where to
Drive: Toronto. Retrieved from https://www.uber.com/en-CA/drive/toronto/where-to-drive/.
48
Munro, Steve. (2018, August 14). Why Can’t I Get on My Bus [Web blog post]. Retrieved from https://stevemunro.ca/2018/08/14/why-cant-i-
get-on-my-bus-ii/.
49
City of Toronto Chief Capital Officer to TTC Board. (2018, July 10). New TTC Bus Storage and Maintenance Facility, Report for Action with
Confidential Information. Retrieved from
https://ttc.ca/About_the_TTC/Commission_reports_and_information/Commission_meetings/2018/July_27/Reports/4_New_TTC_Bus_Storage
_and_Maintenance_Facility.pdf.
50
2018 Operating Budget Note. Toronto Transit Commission: Options to Address Bus Overcrowding, Bus Availability & Garage Storage
Capacity. Retrieved from https://www.toronto.ca/legdocs/mmis/2018/bu/bgrd/backgroundfile-110782.pdf.
51
The bus network accounts for about 60% of the total TTC operating budget. 60% x 25% x $1.8 billion is approximately $270 million per year.
52
City of Toronto Open Data. (2018). TTC Ridership - All Day Weekday for Surface Routes. Retrieved from
https://portal0.cf.opendata.inter.sandbox-toronto.ca/dataset/ttc-ridership-all-day-weekday-for-surface-routes.
53
Short turning means when a vehicle trip ends earlier than the planned terminus and passengers must disembark to wait for the next one.
54
Munro, Steve. (2018, June 7). Will Toronto Get More New Streetcars [Web blog post]. Retrieved from https://stevemunro.ca/2018/06/07/will-
toronto-get-more-new-streetcars/.
55
Photo by Natural RX, Wiki Media Creative Commons.
56
Munro, Steve. (2018, February 3). Crowding on the TTC [Web blog post]. Retrieved from https://stevemunro.ca/2018/02/03/crowding-on-
the-ttc/.
57
TTC Chief Financial Officer to TTC Board. (2019, January 24). TTC 15-Year Capital Investment Plan & 2019-2028 Capital Budget and Plan.
Report for Action. Retrieved from
https://www.ttc.ca/About_the_TTC/Commission_reports_and_information/Commission_meetings/2019/January_24/Reports/10_TTC_15_Year
_CIP_2019_2028_Capital_Budget.pdf.
58
TTC Chief Capital Officer to TTC Board. (2019, April 11). Line 1 Capacity Requirements - Status Update and Preliminary Implementation
Strategy. Report for Action. Retrieved from
15http://ttc.ca/About_the_TTC/Commission_reports_and_information/Commission_meetings/2019/April_11/Reports/18_Line_1_Capacity_Requir
ement_and_Preliminary_Implementatio.pdf
59
Toronto Transit Commission CCO. (2019 April 11). Automatic Train Control Re-Baselining and Transit Systems Engineering Review.
[Report for action to TTC Board] Retrieved from
https://www.ttc.ca/About_the_TTC/Commission_reports_and_information/Commission_meetings/2019/April_11/Reports/17_Automatic_Train_
Control_Re-Baselining_and_Transit_Systems.pdf
60
Munro, Steve. (2019 March 18). TTC 2019 Fleet and Capacity Plans Part I: Subway (Updated). [webpage] Retrieved from
https://stevemunro.ca/2019/03/18/ttc-2019-fleet-capacity-plans-part-i-subway/
61
Toronto Transit Commission CFO. (2019 January 24). TTC 15-Year Capital Investment Plan& 2019-2028 Capital Budget & Plan. [report for
action to TTC Board]. Retrieved from
https://www.ttc.ca/About_the_TTC/Commission_reports_and_information/Commission_meetings/2019/January_24/Reports/10_TTC_15_Year
_CIP_2019_2028_Capital_Budget.pdf
62
City of Toronto Manager. (2019 April 16). Supplementary Report - Toronto's Transit Expansion Program - Update and Next Steps Retrieved
from https://www.toronto.ca/legdocs/mmis/2019/cc/bgrd/backgroundfile-132117.pdf
16PATH 2: FULLY ACCESSIBLE
Accessible transit means that every passenger can ride the TTC
with dignity and respect.
17Public transit should provide an environment that feels safe and comfortable, is harassment-free and
supports rider agency. The TTC must also be practically accessible for seniors, disabled people, youth,
and people with language barriers. This includes proper signage, adequate communication as well as
physical access.
On top of the accessibility issues with existing stations, advocates are finding that new stations are
difficult for people with disabilities to navigate and access.63 There is no excuse for newly designed
stations or upgrades to have these issues.
Accessibility must be a key priority in the design and maintenance of our transit network if the TTC
wants to uphold its ridership and provide a viable mobility option to everyone.
2.1 Free of Harassment & Descrimination
What we need:
§ An end to racial profiling and targeting of racialized and poor communities by police and
TTC enforcement officers.
§ Proper training, oversight and appropriate punitive action when TTC inspectors or TTC
enforcement officers engage in harassment or use of force.
§ Destroy any data collected on people who were not charged with an offence through unjust
carding practices and don’t re-employ this approach.
§ Lower fares to ensure no one is punished for inability to pay.
Our public transit system must be free of harassment and profiling for riders and workers if the TTC
wants to offer a safe mobility option. While people across income levels, gender, age, and race don’t
pay their fares, marginalized people are targeted by fare inspectors due to racism, ableism,
transphobia, classism and other forms of discrimination.
This means that youth, people with disabilities, racialized groups, especially Black and Indigenous
people, and homeless people can feel unsafe riding the TTC.
Early 2019, the Star reported that the TTC has been carding people for the last 20 years, and data
collected was being kept and used without riders’ knowledge. The data showed that Black riders were
disproportionately impacted (19.3%) compared to their percentage of the population (8.9%).64 The
practice has since been scrapped, but the data highlights the underlying discrimination that is occurring
on the TTC.
The Auditor General and TTC frame fare evasion as a problem that needs to be solved by increasing
the level of policing and expensive fines of up to $425.65 This ignores the fact that transit is a public
service and the cost is unaffordable for many. As a society, we must strive to make transit affordable for
everyone, rather than investing in increased punitive action.
182.2 Supportive Communications & Wayfinding
What we need:
§ Increased amount of universal signage, especially for people with disabilities and those who
have English language barriers.
§ Adequate in-train and on-platform communications for people who are deaf and blind.
§ Support for people with disabilities during service disruptions, emergencies and when
elevators are out of service.
There are many ways in which wayfinding in and around subway stations is not adequate. Signage in
TTC stations can often be confusing for finding elevators or just simply getting around. Braille is
minimal and sometimes incorrect and elevator control panels are not accessible by widely accepted
standards.66 67
During emergencies or when service is disrupted or changed, people with disabilities get left behind.
Communication for Deaf and Blind people is inadequate, if provided at all, and does not make travelling
on the conventional system feel safe. If an elevator is out of service, the user is obliged to figure out
where and how to get to the next accessible station to find an elevator that functions properly. During
the King Street Pilot, we heard from a Blind
"Accessibility is still an afterthought on the TTC transit riders who had a lot of trouble with the
and it means that it's not safe for me to take the temporary move of streetcar stops.
subway. During a service disruption, screens on
the subway say to listen to the audio message. But Better signage, adequate communications,
I'm deaf, so that's not going to work for me!" and support during service disruptions needs
-A deaf and disabled TTCriders member to be prioritized in order to promote a sense
of safety on the TTC.
2.3 Adequate Physical Infrastructure
What we need:
§ On schedule completion and full funding of subway elevator upgrades by 2025.
§ Alternative parallel bus service on Yonge-University and Bloor-Danforth.
§ Eliminating platform gaps at every subway station.
§ Platform-edge doors in all TTC stations.
Physical access is critical in making transit accessible to people who use mobility devices and parents
traveling with their children in strollers. Several facets to this must be explored, including subway
elevator access, platform safety, and alternative routes.
The TTC’s Easier Access III program aims to make all 75 TTC stations on the subway system
physically accessible by 2025.68 While they have made progress towards this goal, some construction
projects have been mired with delays and there are still 27 to be completed.69 Recent provincial funding
cuts, which amount to $1.1 billion over the next 10 years, also put this program at risk.
Nineteen track-level deaths occurred in 2017 alone on the TTC subway tracks.70 These deaths are
preventable with the installation of platform-edge barriers.71 These barriers are an important strategy to
19save lives, improve real and perceived safety for transit riders, and provide real reductions to service
delays due to garbage on the tracks.72
There are also times when people cannot access underground subway service safely for many
reasons, including elevator breakdowns or overcrowding. Parallel bus service running the full length of
the Yonge-University and Bloor-Danforth subway lines could provide a much-needed alternate route. It
would also serve to alleviate some crowding on the subway by giving people who want to travel short
distances an alternative route.
The gap between platforms and trains can also be too large and vary from station to station. In other
words, you may be able to get on a train at a particular station, but not able to disembark at your
destination. The TTC has committed to addressing this issue as part of the Easier Access III program to
make all stations accessible by 2025.73
2.4 Reliable Wheel-Trans Service
What we need:
§ Allow people to choose the service that makes them feel safe, comfortable and dignified for
their TTC trips.
§ Notify customers: if a vehicle is more than 10 minutes late, 5 minutes before arrival, and
upon arrival.
Wheel-Trans is in the process of introducing a “family of services” approach, which the TTC states will
improve the efficiency of its services.74 Despite being framed as an improvement to the service, its true
goal is to push people with disabilities to use the mainstream system by dropping off/picking up people
only at the nearest accessible station during a trip. As subway stations become accessible and low-
floor vehicles are deployed on the entire streetcar network, the TTC is looking to divert customers to the
conventional system.
While this approach may work well for some people with disabilities, it will also further marginalize
individuals with significant challenges and put the lives of the City’s most vulnerable transit users in
serious peril.
“When I go anywhere in the city, three things have to happen:
1. Map out my route – careful to highlight any washrooms, barriers
and elevators;
2. Contact the person I am meeting;
3. Ask myself “What if I can’t make it?”
In this day and age I shouldn’t have to go through these steps but
as any person in a chair knows – you’re essentially on your own.”
- Franklyn McFadden, TTCriders member and Wheel-Trans user
20The current Wheel-Trans service also needs
“When I get a call back from the Wheel-Trans improvement. Using Wheel-Trans is a time
phone line I can’t always pick up the phone fast
consuming process. Passengers are often kept
enough. This means that I have to call back and
waiting for over an hour when vehicles are late,
wait again. It’s very frustrating, as it means I
need to wait right by the phone for up to two with no update or indication of when it can be
hours just to make sure I can pick up the phone expected. In addition, it's not uncommon for a
when I have a question about my account or driver to leave when they don’t see a
booking.” passenger, even if they’re waiting patiently
- Gillian Sumi, TTCriders member and Wheel-Trans around the corner or inside the nearest
user. building. The Wheel-Trans phone lines also
have very long wait times. The expanded accessibility measures on the TTC’s conventional system are
necessary, but should not reduce the ability for people to choose the option that feels safe, comfortable,
and dignified.
2.5 A Fair PRESTO System
What we need:
§ Bulk discounts that are available to individuals "Whatever they replace [tokens
and organization for 3 or more PRESTO tickets. with] it has to make sense and it
§ PRESTO tickets that are widely available still has to be accessible to those of
across Toronto (a minimum of 421 resellers). us who are on very low incomes
and don’t have access (to the TTC)
§ No expiry dates on tickets.
otherwise.”
§ Free PRESTO cards with a minimum load of a
- Sharon Anderson, community worker
single fare.
With the elimination of tokens and tickets, the number of locations to buy a fare will be drastically
reduced from 1,100 locations today to 125 as of August 1st 2019. This is due to an exclusive contract
between Metrolinx and Shoppers Drug Mart. This situation is absolutely unacceptable and violates a
basic principle of the AODA.75 Based on the TTC’s own analysis, 421 resellers of fare media are
needed to ensure adequate accessibility.76
In order for transit riders to purchase tickets or
“Previously mom and pop shops and grocery
stores were selling TTC fares and [the PRESTO
load their cards without Internet or a credit
ticket plan] cuts it down considerably. Imagine a card, they will be forced to travel longer
senior having to walk 20 minutes with a walker distances to reach the nearest Shoppers or
because they don’t have a bus fare. It’s quite Loblaws and may need to traverse large
dangerous.” parking lots that can be dangerous for people
- Vincent Puhakka, a resident of Scarborough with mobility issues.
Metrolinx has set the bulk ticket minimum to 400 per purchase (over $1,200) and has not made public
what process organizations and groups will use to access them. New single-use tickets will also have
expiry dates, at 90 days for tickets purchased by individuals and 1-year for bulk purchases.77 Expiry
dates will only act as a barrier for people on low incomes, community service agencies, and local
groups that provide tickets to make their programs accessible to everyone.
21You can also read