The High-Resolution Carbon Geography of Perú - A Collaborative Report of the Carnegie Airborne Observatory and the Ministry of Environment of Perú
←
→
Page content transcription
If your browser does not render page correctly, please read the page content below
The High-Resolution
Carbon Geography of Perú

           A Collaborative Report of the
           Carnegie Airborne Observatory and
           the Ministry of Environment of Perú
Contributors
    Gregory P. Asner1, David E. Knapp1, Roberta E. Martin1, Raul Tupayachi1,
 Christopher B. Anderson1, Joseph Mascaro1, Felipe Sinca1, K. Dana Chadwick1,
Sinan Sousan1, Mark Higgins1, William Farfan2, Miles R. Silman2, William Augusto
              Llactayo León3, Adrian Fernando Neyra Palomino3

       Department of Global Ecology and the Carnegie Airborne Observatory,
       1

               Carnegie Institution for Science, Stanford, CA USA

   Department of Biology, Wake Forest University, Winston-Salem, NC USA
   2

   3
       Dirección General de Ordenamiento Territorial, Ministerio del Ambiente,
                              San Isidro, Lima, Perú

                                        =

This project was made possible through a collaboration between the Peruvian
       Ministry of Environment and the Carnegie Institution for Science.

This conservation, land-use and climate change project was supported by the
 John D. and Catherine T. MacArthur Foundation, Gordon and Betty Moore
            Foundation, and the Carnegie Institution for Science.

  The Carnegie Airborne Observatory is made possible through the support
 of the Avatar Alliance Foundation, Grantham Foundation for the Protection
of the Environment, John D. and Catherine T. MacArthur Foundation, Gordon
   and Betty Moore Foundation, W. M. Keck Foundation, Margaret A. Cargill
     Foundation, Mary Anne Nyburg Baker and G. Leonard Baker Jr., and
                             William R. Hearst III.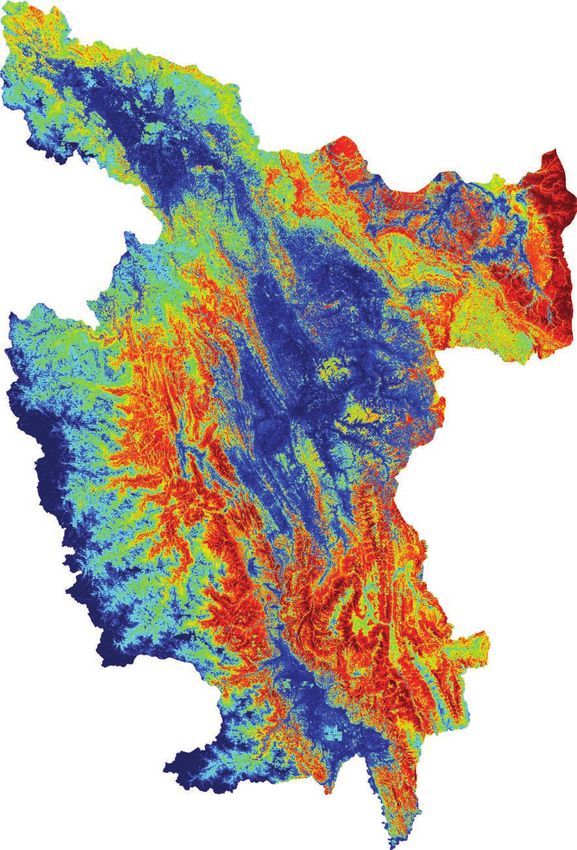
The High-Resolution
Carbon Geography of Perú
         A Collaborative Report of the
Carnegie Airborne Observatory and the
      Ministry of Environment of Perú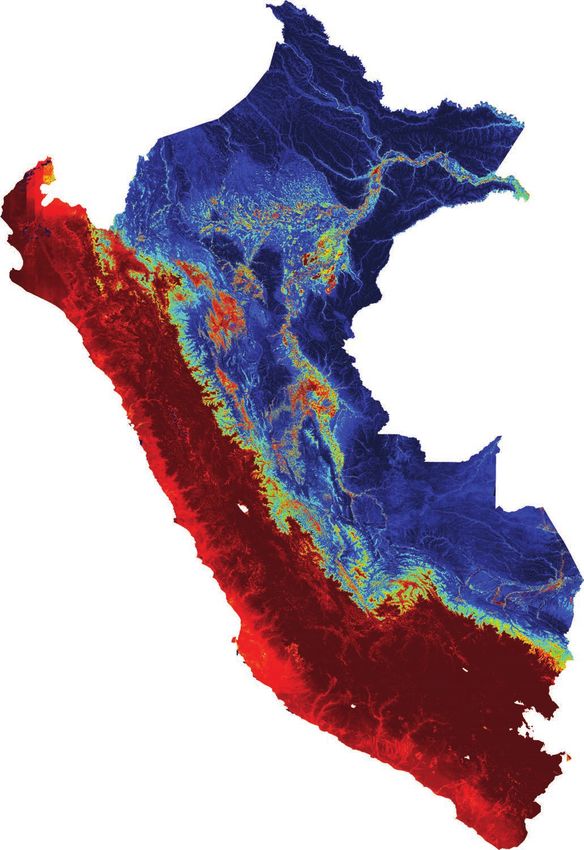
Table of Contents

                                                  Summary       5

                                               Introduction    9

                                      Results and Discussion   13

                                               Conclusions     37

                                     Technical Methodology     39

                                                  Appendix     53

                                          Acknowledgments      59

                                                 References    61

                                                                    The Carnegie Airborne Observatory
                                                                    (CAO) was critical to the first-ever
                                                                    mapping of the more than 128 million
                                                                    hectares that comprise the country
                                                                    of Perú. With its all-weather, inter-
                                                                    continental capability, combined with its
                                                                    unique laser and hyperspectral sensors
                                                                    and airborne computing platform, the
                                                                    CAO provided 3-D imaging of Peruvian
                                                                    ecosystems ranging from lowland
                                                                    Amazonian rainforests to high-altitude
                                                                    Andean tundra.

THE HIGH-RESOLUTION CARBON GEOGRAPHY OF PERÚ                                                                3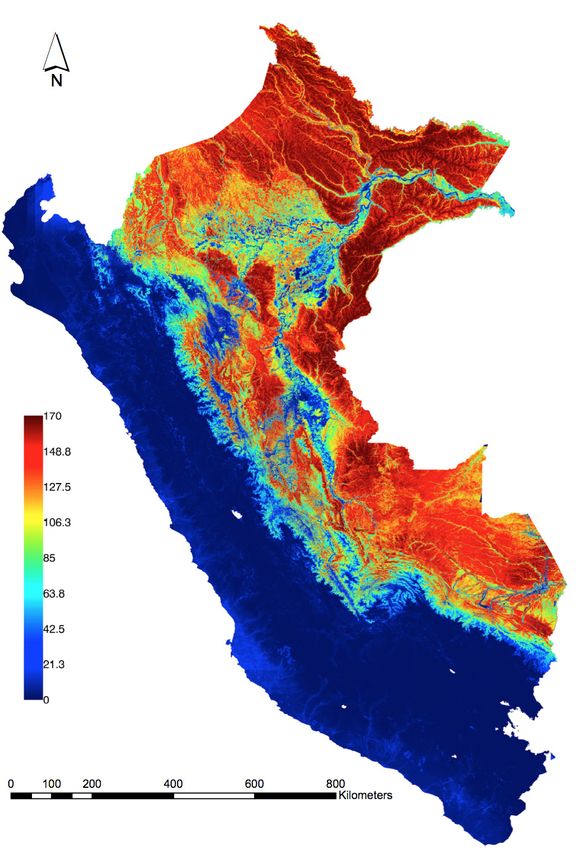
Summary

Background

V
        egetation is one of the most spatially and temporally dynamic reservoirs
        of carbon in the world. The amount of carbon stored in vegetation above
        ground in woody biomass is particularly variable, and is subject to rapid
change via land uses that remove vegetation cover, causing carbon emissions.
Reducing carbon emissions from deforestation and forest degradation, as well as
from other non-forested ecosystems, is therefore a priority in both national and
international strategies to conserve ecosystems and to reduce carbon dioxide
build-up in the atmosphere.

Perú harbors an enormous range of ecological conditions, from hot and humid
lowland Amazonian forests to high-altitude Andean ecosystems and desert
conditions on the Pacific coast. The diversity of environments in Perú greatly
challenges efforts to measure, map and monitor carbon stocks throughout the
country.

Purpose
We report the first high-resolution geographic study of aboveground carbon
stocks throughout the more than 128 million hectares that comprise the country
of Perú. This report communicates the development of our methodology and
an extensive validation of the resulting high-resolution carbon map of Perú. It
also provides the first quantitative analysis of the basic environmental factors
determining the carbon geography of Peruvian ecosystems, political regions, and
protected areas.

Methodology
To create a map of aboveground carbon density (ACD) at one-hectare resolution,
we integrated airborne Light Detection and Ranging (LiDAR) technology, a new
field plot inventory network, freely available satellite imagery, and geostatistical
scaling techniques. Following initial establishment and operationalization of the
described methodology, the approach can be readily updated over time to provide
a long-term monitoring capability with reported uncertainties for every hectare
within Perú.

THE HIGH-RESOLUTION CARBON GEOGRAPHY OF PERÚ                                                 5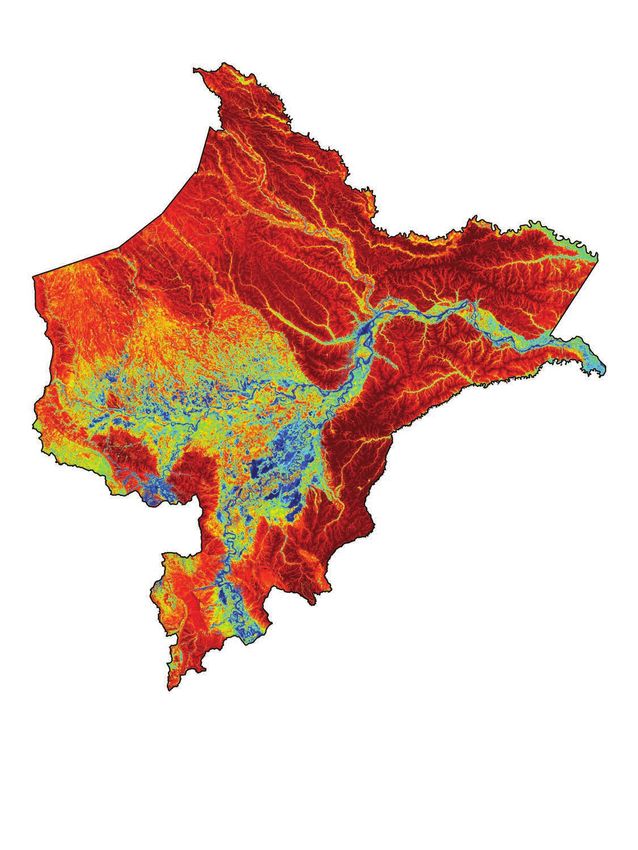
Performance
    Based on an initial environmental stratification of the region, and using the
    Carnegie Airborne Observatory LiDAR, we sampled 6.7 million hectares of
    ecosystems distributed in Perú at a resolution of 1.1 meter. To scale these
    airborne LiDAR samples to the national level, we developed a geostatistical
    modeling approach based on the well-known Random Forest Machine
    Learning (RFML) algorithm, which we used with a suite of environmental
    maps of Perú derived from satellite imagery. The RFML nationwide mapping
    of vegetation canopy height — a key input to mapping of aboveground
    carbon density — was validated in 536,874 additional hectares of direct
    LiDAR measurements distributed throughout the country. This showed that
    vegetation canopy height could be mapped with a precision of 78% and an
    error (RMSE) of 3.5 meters at the national level.

    We calibrated the mapped canopy height estimates to field-based estimates
    of aboveground carbon density (ACD; units of Mg C ha-1 or metric tons
    of C per hectare) across a wide range of vegetation types and land-use
    conditions. Our field inventory network is comprised of 272 permanent field
    plots distributed in lowland, submontane and montane ecosystems. Extensive
    validation procedures show that remotely sensed measurements of vegetation
    canopy height can be used to estimate the carbon stocks of laboriously hand-
    measured field plots with an average 11.6% uncertainty. This uncertainty is less
    than the uncertainty of field-based estimates of carbon stocks.

    Findings
    The resulting map of aboveground carbon density in Perú reveals a very wide
    range of ecosystem-level carbon density values, from less than 5 Mg C ha-1 in
    ultra-dry desert systems on the western, leeward side of the Andes, to more
    than 150 Mg C ha-1 in the northeastern, humid lowland Amazonian forests. The
    total estimated aboveground carbon stock of Perú is 6.9223 Pg (billion metric
    tons).

    The median carbon density for all Peruvian forests is 99.3 Mg C ha-1, and the
    maximum-recorded density is 167.6 Mg C ha-1. More than 50% of all Peruvian
    forests harbor aboveground carbon densities of more than 100 Mg C ha-1,
    but only 10% of these exceed 125 Mg C ha-1. The vast majority of these high-
    biomass forests are located in the lowland and submontane regions of the
    Amazon, usually below 1000 m elevation.

    Aboveground carbon densities and total carbon stocks varied enormously by
    Peruvian Regional jurisdiction. Loreto contains 53% of Perú’s aboveground
    carbon stock, owing to the large size of this Region and its particularly high
    carbon densities (98.8 ± 29.4 Mg C ha-1). The second and third largest Regional
    stocks are found in Ucayali and Madre de Dios, respectively. Combined these
    two Regions contain 26% of the total Peruvian carbon stock. Other Regions
    with large stocks include San Martin, Amazonas, Cusco, Junín, Huánuco,
    Pasco and Puno, although together they comprise just 18.5% of the total
    aboveground carbon stock of the country.

    Other highlights include: (i) The highest carbon stocks of 128 ± 14 Mg C
    ha-1 are found to the North of the Napo and Amazon rivers, and along the
    Northeast Peruvian border with the Brazilian state of Amazonas. (ii) In the

6                                 THE HIGH-RESOLUTION CARBON GEOGRAPHY OF PERÚ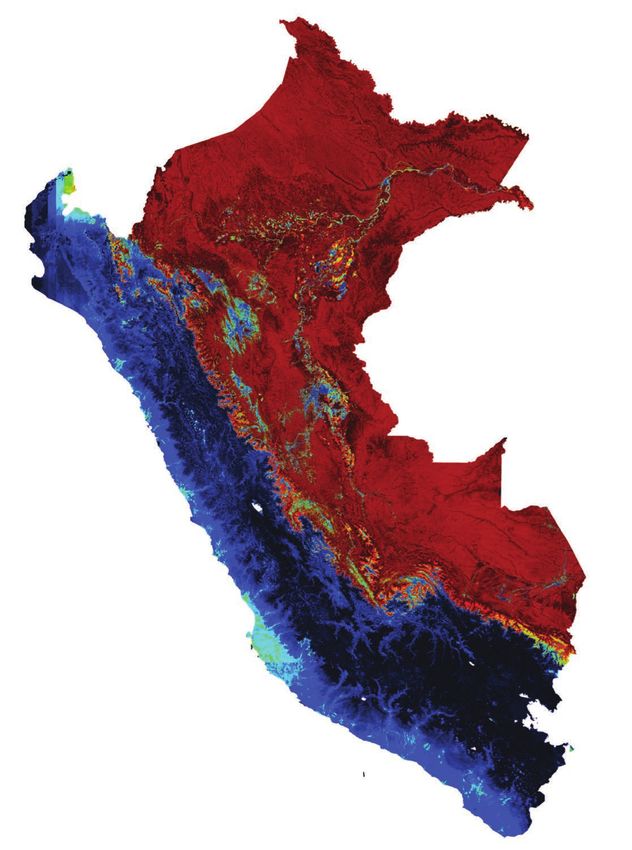
Northern lowlands, the Pacaya-Samiria swampland harbors suppressed and
highly variable aboveground carbon stocks in the range of 54 ± 28 Mg C ha-1.
(iii) The cities of Tarapoto and Pucallpa are centers of low forest carbon stocks
resulting from past deforestation, with Pucallpa being the region of maximum
loss throughout the Peruvian Amazonian lowlands. (iv) Additional losses are
clearly visible for Iquitos in Loreto, and especially for Puerto Maldonado in
Madre de Dios. The latter is closely associated with very large areas of near-
zero carbon storage caused by gold mining. (v) The lowlands of southern Perú
harbor lower carbon stocks associated with extensive areas of bamboo. (vi) On
the Pacific coast of Perú, carbon densities are primarily in the 1-8 Mg C ha-1
range, with local peaks of 22-52 Mg C ha-1 in intensively managed woodland
plantations.

We assessed the aboveground carbon density and total carbon stocks of 174
protected areas throughout Perú. A total of 1.816 Pg (billion metric tons) of
carbon are stored in aboveground vegetation within these protected areas,
or about 26% of the total estimated aboveground carbon stocks found within
Perú. This leaves up to 74% of aboveground carbon stocks outside of these
protected areas. The largest carbon stocks are found in the fifteen largest
forest reserves, including the Alto Purus, Manu, Cordillera Azul and Bahuaja
Sonene national parks, Pacaya Samiria and Pucacuro national reserves, and
the Alto Nanay-Pintuyacu Chambira, Ampiyacu Apayacu, Sierra del Divisor,
Yaguas and Santiago Comaina reserves. These protected areas alone comprise
85% of the total aboveground carbon stores among the 174 protected areas
that we assessed. Within humid Amazonian and Andean forests, the size of
each protected area is highly correlated with its total carbon stock, with each
hectare of protection adding an average 95.1 Mg (metric tons) of carbon to the
biosphere.

Conclusions
Using a strategic and cost-effective combination of airborne LiDAR sampling,
tactically placed field calibration plots, freely available satellite data, and a
new geostatistical modeling approach, we have shown that a high-resolution
geography of aboveground carbon stocks can be revealed for a large and
environmentally complex country such as Perú. This new carbon geography
also includes spatially explicit maps of uncertainty, which is essential in
decision-making for conservation, management and policy development
efforts associated with ecosystems and societal use of lands.

Our effort focused on the mean and uncertainty of aboveground carbon
stocks in every hectare of Perú, thereby providing a new basis for all
stakeholders, large and small, to participate in improving the use and
conservation of ecosystems. The detailed validation presented at multiple
steps throughout the study demonstrates that aboveground carbon stocks can
be estimated and mapped with a degree of uncertainty that is indistinguishable
from laborious hand-measured, field-based estimates. Moreover, the approach
presented here is spatially continuous, and thus less prone to error caused by
environmental and human-driven variation in carbon stocks. Updates to the
carbon map, as well as spatially explicit changes in carbon stocks, will be far
easier to implement going forward based on the methodology and base data
layers presented in this report.

THE HIGH-RESOLUTION CARBON GEOGRAPHY OF PERÚ                                        7
Introduction

T
        he international community has championed forest carbon sequestration
        and emission reductions as a strategy to mitigate climate change1. In
        combination, deforestation and forest degradation account for up to 15%
of global carbon dioxide emissions to the atmosphere2. Yet the geography of
forest carbon stocks remains poorly known, which leads to great uncertainty in
creating spatially explicit estimates of forest carbon emissions over time3. Large
emission uncertainties, in turn, result in financial discounts placed on forest
carbon, which then decrease its investment power to combat climate change 4,5.
This ultimately limits forest carbon sequestration projects to volunteer markets
or demonstration activities, mostly implemented at the project or local scale.
Future compliance or market-based carbon sequestration agreements will hinge
upon accurate, high-resolution monitoring at large geographic scales relevant to
a nested set of stakeholders ranging from individual landowners, to jurisdictional
agencies, and national governments. The critical resolution for carbon monitoring
is the hectare (= 2.5 acres), which is the world’s most common unit of land tenure,
ownership and regulatory policy6. Thus to achieve full accounting the geography
of carbon stocks must be known for every hectare in a country.

Beyond the policy-driven need for high-resolution mapping and monitoring
of forest carbon stocks, the geography of terrestrial carbon storage is central
to our understanding of numerous ecological patterns and processes ranging
from habitat and biodiversity distributions, to global carbon cycling and climate-
biosphere interactions. Natural tropical forests, for example, store a majority of
their aboveground carbon (which is 48% of dry biomass) in large, interlocking tree
canopies that also provide critical habitat for many thousands of avian, mammalian
and invertebrate species7. In contrast, low carbon stocks in natural tropical forests
are often indicative of climatic and hydrological limitations to productivity, as well
as disturbance-driven mortality of forest canopies8,9. By mapping aboveground
carbon stocks at high resolution, critically important processes that determine
ecological dynamics and habitat conditions are uniquely revealed.

Numerous factors limit our current understanding of the world’s carbon
geography. First, the distribution of carbon stocks is highly uneven across the land
surface, owing to the complex and interactive effects of abiotic (e.g., climate, soils,
geology, topography, hydrology) and biotic (e.g., community composition, human
activities) processes10-12. Field sampling techniques alone, such as with inventory
plots, cannot capture the spatial variability of carbon stocks over large regions,
and any resulting carbon emission estimates based on field plot data are highly
vulnerable to large errors. Second, no current satellite systems provide plot-like

THE HIGH-RESOLUTION CARBON GEOGRAPHY OF PERÚ                                                         9
sampling measurements with sufficient detail to support robust estimates of
Figure 1 (opposite page) aboveground carbon stocks at high spatial resolution. As a result, global or
Overview of the methodology used pan-tropical carbon maps derived from satellites currently may not agree well
to map vegetation carbon stocks
with one another13, and they may not agree with current sparse distributions
throughout the country of Perú: (A)
A pre-stratification step combines of field inventory plots14. Third, whether sampled with field or remote sensing
geological, soil, community floristic techniques, the acquired metrics of vegetation structure (e.g., tree height,
composition, elevation, and forest cover diameter) require allometric equations to estimate aboveground carbon
maps to forecast the potential range stocks15. This process is prone to systematic bias, particularly with respect
of environmental conditions to be
to floristic controls on carbon stocks, such as crown architecture and wood
encountered during airborne surveys.
density16.
(B) The country is gridded into 100 x
100 km sampling cells, and airborne We present the first high-resolution geographic study of aboveground carbon
Light Detection and Ranging (LiDAR) is
stocks for the country of Perú. Covering a total area of more than 128 million
used to massively sample each grid cell.
Over-sampling is achieved by ensuring ha, Perú harbors enormous environmental and biological gradients, from
that large areas are covered for each the warm lowlands of the Amazonian forest in the east, to the cold montane
potential set of environmental conditions ecosystems of the Andes. The forested portion of the country covers
estimated during pre-stratification. approximately 68 million ha, making it a core focus of this study. To create a
(C) A diverse array of satellite data
map of aboveground carbon stocks at one-hectare resolution, we integrated
is compiled to provide continuous
geographic information on vegetation
and applied a combination of airborne Light Detection and Ranging (LiDAR)
cover, topographic variables, and technology, freely available satellite imagery, distributed field calibration plots,
climate. (D) The satellite and LiDAR data and geostatistical scaling techniques (Figure 1). The methodology, which is
are processed through a geostatistical explained to detail in the Technical Methodology section of this report, is
modeling approach, and combined with scalable to any geography and is readily updateable over time. Following the
calibrations of LiDAR to field-estimated
development and extensive validation of the resulting high-resolution carbon
carbon stocks, to map aboveground
carbon stocks at one-hectare resolution, map of Perú, we quantify for the first time the relative importance of the
along with spatially explicit uncertainty environmental factors that fundamentally determine the carbon geography of
maps. western Amazonian and Andean ecosystems.
10 THE HIGH-RESOLUTION CARBON GEOGRAPHY OF PERÚSatellite & GPS Data Airborne LiDAR B.
A.
Pre-stratification
C.
D.
Modeling and Field Plots
Environmental Mapping
Carbon Stocks Uncertainty
THE HIGH-RESOLUTION CARBON GEOGRAPHY OF PERÚ 11Results and Discussion
Carbon Geography of Perú
T
he high-resolution aboveground carbon stock map of Perú is shown in
Figure 2 (see fold-out). The map reveals a global range of ecosystem-
level carbon density values, from less than 5 Mg C ha-1 in ultra-dry desert
systems on the western, leeward side of the Andes, to more than 150 Mg C
ha-1 in the northeastern, humid lowland Amazonian forests. The total estimated
aboveground carbon stock of Perú is 6.9223 Pg or billion metric tons.
From North to South, the following major features are revealed in this map, as
annotated in Appendix Figure S1:
1. The highest carbon stocks of 128 + 14 Mg C ha-1 are found to the North of the
Napo and Amazon rivers, and along the Northeast Peruvian border with the
Brazilian state of Amazonas.
2. In the Northern lowlands, carbon stocks are 10-15% higher on the lower-
fertility Nauta geologic formations (110 Mg C ha-1) compared to their
neighboring Pebas geologic formations (95 Mg C ha-1; see GeoEcoElevation
map in the Technical Methodology section).
3. In the Northern lowlands, the Pacaya-Samiria swampland harbors sharply
suppressed and highly variable aboveground carbon stocks in the range of 54 +
28 Mg C ha-1.
4. The transition from the Northern lowland carbon stocks to those found at
treeline in the Andes is gradual in comparison to that of the Southern lowlands.
5. The cities of Tarapoto and Pucallpa are centers of lost forest carbon stocks
resulting from deforestation, with Pucallpa being the region of maximum loss
throughout the Peruvian Amazonian lowlands. Additional losses are clearly
visible for Iquitos in Loreto, and especially for Puerto Maldonado in Madre de
Dios. The latter is closely associated with very large areas of near-zero carbon
storage caused by gold mining17.
6. The lowlands of southern Perú harbor lower carbon stocks associated with
extensive areas of bamboo (90 + 8 Mg C ha-1).
7. Throughout the upper portion of the Fitzcarrald Arch geologic formation,
aboveground carbon stocks vary from high values (101 + 12 Mg C ha-1) in local
valleys to low values (42 + 10 Mg C ha-1) in crest topographic positions.
THE HIGH-RESOLUTION CARBON GEOGRAPHY OF PERÚ 13´
Figure 2
Estimated aboveground carbon stocks
at one-hectare spatial resolution for the
country of Perú.
>150
Aboveground Carbon Density
100
Mg C ha-1
50
0
0 100 200 400 600 800
Kilometers
Aboveground Carbon Density
Mg C Ha-1
0 50 100 >1508. On the Pacific coast of Perú, carbon stocks increase to a maximum of 8 + 2
Mg C ha-1 in the Ica Region south of Lima. Other coastal communities have
carbon densities in the 1-8 Mg C ha-1 range, with local peaks of 22-52 Mg C
ha-1 in orchards and other intensively managed woodland plantations.
Zoom images of many of these findings can also be found in Appendix Figures
S2-S3.
Map Uncertainty
We mapped the uncertainty in our estimates of aboveground carbon density
by combining errors from two important sources (Figure 3, Appendix Figure
S4). The first is the uncertainty in the relationship between airborne LiDAR-
based and field-estimated aboveground carbon density (ACD) (Figure 25; see
Methods). Our validation process indicated that the mean error of LiDAR-
based estimates of ACD is 11.6%. The second source of error is associated
with the modeling of the LiDAR canopy height throughout Perú. To determine
this error, we set aside 536,874 ha throughout the country that were directly
measured with airborne LiDAR, but were not used in building the models for
national-scale mapping (see Technical Methodology), and we used these pixels
to calculate the root mean squared error (RMSE) between LiDAR-based ACD
and RFML-based ACD. These RMSE results were compiled into ten bins across
the range of predicted ACD. A polynomial was fit to these data (Appendix
Figure S5), and was used to determine the uncertainty as a function of mean
estimated ACD. These two sources of error were combined as the square root
of the sum of the two squared errors, and the geospatial uncertainties were
applied to the countrywide map (Figure 3, Appendix Figure S4).
In lowland Amazonian forests, our estimated geospatial uncertainty ranges
from 5-15% in the highest biomass forests to 20-25% in lower-biomass swamp
and floodplain forest (Figure 3). These percentage uncertainties equate to
absolute errors of up to about 30-40 Mg C ha-1 (Appendix Figure S4). In
deforested zones of the Amazonian lowlands, geospatial uncertainty increases
to about 50-60% of the per-hectare carbon stocks, or about 1-15 Mg C ha-1.
Near the Andean treeline, uncertainties increase further to approximately 35-
45% on any given hectare, or about 8-25 Mg C ha-1. On the dry leeward side
of the Andes, geospatial uncertainty rapidly increases to 60-80%, owing to the
fact that we only lightly sampled these types of environments with the LiDAR.
Importantly, these large relative uncertainties, when applied to the extremely
low aboveground carbon stocks of these dry ecosystems, results in absolute
errors of less than 4 Mg C ha-1.
Field-based Map Validation
Validation using 57 one-hectare field plots indicated high precision and
accuracy (slope = 1.01; R2 = 0.73) of the map of aboveground carbon stocks
(Figure 4). Our national map over-estimated plot-based carbon stock
estimates by approximately 10 Mg C ha-1. Given the inherent uncertainty of
15-30% in field-estimated carbon stocks at one-hectare resolution for forests18
and shrublands19, we considered our bias to be acceptable.
14 THE HIGH-RESOLUTION CARBON GEOGRAPHY OF PERÚFigure 3
Estimated percentage uncertainty
in aboveground carbon stocks
at one-hectare resolution for the
N
country of Perú.
>80%
(Percentage of mean aboveground carbon density in Figure 2)
60
Estimated Relative Uncertainty
40
20Figure 4
Validation of nationally mapped
estimates of aboveground carbon
density (ACD) versus field plot inventory
estimates of ACD for sites across
Northern, Central and Southern Perú.
National-scale Variation in Forest Carbon Stocks
Among all Peruvian forests and woodlands nationwide, we found a highly
skewed (γ = -0.831) distribution of aboveground carbon stocks (Figure 5).
The median carbon density for all Peruvian forests is 99.3 Mg C ha-1, and the
maximum-recorded density is 167.6 Mg C ha-1. More than 50% of all Peruvian
forests harbor aboveground carbon densities of more than 100 Mg C ha-1,
but only 10% of these exceed 125 Mg C ha-1. The vast majority of these high-
biomass forests are located in the lowland and submontane regions of the
Amazon, usually below 500 m elevation.
Figure 5
Distribution of aboveground carbon
density at one-hectare resolution for
forests throughout the country of Perú.
Environmental Controls on Carbon Stocks
Analysis of the environmental variables used in the national mapping
methodology revealed that the fractional cover of photosynthetic vegetation
(PV) is the most important geographic factor predicting aboveground carbon
stocks throughout Perú (Figure 6). Fractional PV is a quantitative metric derived
from Landsat satellite imagery, and it is known to be highly sensitive to the
percentage cover of woody canopy plants20-22. As a result, fractional PV cover
16 THE HIGH-RESOLUTION CARBON GEOGRAPHY OF PERÚFigure 6
Relative importance of satellite-derived
environmental variables in the prediction
and mapping of aboveground carbon
density (ACD) throughout Perú. Key:
(i) Fractional PV is the percent green
canopy cover in each hectare; (ii)
Elevation is the height of the land in
meters above sea level; (iii) Fractional
NPV is the percent non-photosynthetic
vegetation or dried, exposed vegetation
in each hectare — a strong proxy for
ecological disturbance; (iv) REM is
the relative elevation model depicting
local height of the land above nearest
water body such as a stream or lake; (v)
Fractional Bare is the percent exposed
bare surfaces in each hectare — another
proxy for ecological disturbance; (vi)
Slope is the tilt of the land surface; (vii)
is often spatially correlated with aboveground carbon stocks in a wide range Insolation is the average amount of
of ecosystems, from arid shrublands to humid tropical forests23-31. As such, solar energy striking the land surface at
four points in the year (Sept, Mar, Dec,
it accounted for 26% (+ 9%) of the carbon stocks mapped with the airborne
June); (viii) Cloud cover is the fraction
LiDAR throughout Perú.
of the year that each hectare is cover in
Second to fractional PV cover, changes in elevation also had a large effect clouds, thereby reducing energy input for
vegetation growth.
(18% + 6%) on mapped carbon stocks (Figure 6). Furthermore, after removing
un-forested and/or deforested areas from the analysis, we found that the
relationship between elevation and carbon stocks was even clearer (Figure
7). Independent of floristic composition, precipitation, micro-environment,
or other factors, average aboveground carbon density decreases by about
2.3% per meter of elevation gain. However, there is enormous variation within
each elevation zone, with the maximum variation occurring in the lowlands
and sub-montane ecosystems below about 1500 meters a.s.l. Moreover, the
lowlands are about equally likely to harbor very low or high carbon densities
(Figure 7, less than 400 m a.s.l.). Areas of suppressed carbon storage in the
lowlands are due to hydrological conditions such as anoxia (swamp-like
conditions) and changes in soil fertility associated with underlying geologic
substrate27. In the sub-montane region of 900-1600 m a.s.l., carbon stocks
remain highly variable and show high-spots particularly in the 1200-1300
Figure 7
Changes in aboveground carbon density
(ACD) with elevation throughout the
forested portions of Perú. Each data
point represents one hectare.
THE HIGH-RESOLUTION CARBON GEOGRAPHY OF PERÚ 17m elevation zone. At treeline, which varies from about 3700-4200 m a.s.l.,
depending upon local conditions and past land use, carbon stocks average 11
Mg C ha-1 (Figure 7). Even at these high altitudes, it is possible to find forests
with carbon stocks as high as 30 Mg C ha-1.
At the national scale, other critically important determinants of aboveground
carbon stocks include the fractional cover of non-photosynthetic vegetation
(NPV), relative elevation (REM) above nearest water body, and fractional cover
of bare surfaces (Figure 6). Together, these three factors account for about
32% of the variation in aboveground carbon stocks throughout Perú. Fractional
NPV and bare substrate cover are well-known metrics of forest disturbance
including natural processes such as landslides, blow-downs, and gap
dynamics32, 33, as well as human-driven disturbance such as selective logging,
fire, and other processes that thin vegetation canopies without complete
removal of them25,34-39. REM is a proxy for both water access by plants and
water-related disturbance via flooding.
Compared to the top five factors predicting carbon stocks in Perú, the
remaining satellite-based variables each accounted for about 3-5% of the total
variation throughout the country (Figure 6). These included topographic slope
and aspect, solar insolation throughout the year, and cloudiness. However,
combined, these factors did account for about 30% of the mapped variation,
and thus we consider them all to be important in creating the high-resolution
aboveground carbon map for Perú (Figure 2).
Carbon by Regional Government
Aboveground carbon densities and total carbon stocks varied enormously
by Peruvian Regional government, which were formerly called Departments
(Table 1). Loreto contains 53% of Perú’s aboveground carbon stock, owing
to the large size of this Region and its particularly high carbon densities (98.8
+ 29.4 Mg C ha-1). The second and third largest Regional stocks are found in
Ucayali and Madre de Dios, respectively. Together these two Regions contain
26% of the total Peruvian carbon stock. Other Regions with large stocks
include San Martin, Amazonas, Cusco, Junín, Huánuco, Pasco and Puno,
although together they comprise just 18.5% of the total aboveground carbon
stock of the country.
We present higher-resolution maps of the top ten Regional governments in
Figures 8-17. Many of the natural and human-mediated patterns in carbon
stocks can be readily viewed in these maps, with additional findings as follows:
1. In lowland Regions such as Loreto, Ucayali and Madre de Dios (Figures
8-10), topographic incisions associated with small river and stream activity
harbor carbon stocks that are 30-50% lower than their non-incision or non-
riparian counterparts.
2. Large active floodplains associated with the Amazon (Figure 8), Ucayali
(Figure 8-9), and Madre de Dios and Las Piedras rivers (Figure 10) contain
50-80% lower carbon stocks than neighboring terra firme forests.
3. Regions containing extensive swaths of submontane Andean ecosystems
such as San Martin, Amazonas, Junín and Pasco (Figures 11-12, 14, 16) are
prone to high variance in carbon stocks due to a combination of natural
and human-mediated factors. These include natural landslides on slopes
18 THE HIGH-RESOLUTION CARBON GEOGRAPHY OF PERÚexceeding 38 degrees, mesoclimatic effects associated with topographic
aspect (local leeward conditions), and extensive deforestation and forest
degradation.
4. Decreases in carbon stocks at higher elevations of 2500 to 4000 m a.s.l. are
particularly apparent in the Regions of San Martin, Junín, Huánuco, Pasco and
Puno (Figures 11, 14-17). The elevational-rate of forest carbon decrease is
discussed earlier in the report.
Mean Carbon SD of Carbon Proportion
Area Density Density Total Carbon of Perú Table 1
Region (ha) (Mg C ha-1) (Mg C ha-1) Stock (Tg C) (%) Mean and standard deviation of
Amazonas 3,930,390 61.9 38.7 242.9 3.51 aboveground carbon density, and total
aboveground carbon stock, for each
Ancash 3,595,941 2.3 2.6 8.1 0.12
Peruvian Region. The proportion of
Apurimac 2,111,640 1.0 2.1 2.2 0.03 carbon stocks in each Region relative
Arequipa 6,325,762 2.2 2.6 14.2 0.21 to the total carbon stock of Peru is also
given. SD = standard deviation. Tg =
Ayacucho 4,349,951 4.7 13.8 20.4 0.29
Teragram = one million metric tons.
Cajamarca 3,304,619 9.2 17.0 30.5 0.44
Callao 14,167 6.4 2.8 0.1 0.01
Cusco 7,207,883 32.2 38.8 231.7 3.35
Huancavelica 2,206,335 1.8 4.2 3.9 0.06
Huánuco 3,720,347 35.2 37.5 130.6 1.89
Ica 2,108,125 7.7 4.2 16.1 0.23
Junín 4,399,697 33.4 37.5 146.4 2.11
La Libertad 2,529,588 4.0 8.2 10.0 0.14
Lambayeque 1,434,306 3.1 2.6 4.4 0.06
Lima 3,499,260 3.3 3.0 11.6 0.17
Loreto 37,511,259 98.8 29.4 3685.1 53.24
Madre de Dios 8,504,866 96.4 23.0 819.2 11.83
Moquegua 1,580,513 2.7 3.2 4.3 0.06
Pasco 2,411,598 51.2 42.5 123.3 1.78
Piura 3,605,927 3.3 4.6 11.7 0.17
Puno 6,796,462 15.6 32.3 106.0 1.53
San Martin 5,096,436 59.8 37.8 303.8 4.39
Tacna 1,608,229 2.9 2.6 4.7 0.07
Tumbes 469,182 10.3 7.0 4.3 0.06
Ucayali 10,533,060 93.7 31.1 986.8 14.26
THE HIGH-RESOLUTION CARBON GEOGRAPHY OF PERÚ 19Loreto
Figure 8
Aboveground carbon density of the
N Peruvian Region of Loreto.
>150
Aboveground Carbon Density
100
Mg C ha-1
50
Total Aboveground Carbon Stock: 3685.1 Tg C
Mean Carbon Density: 98.8 Mg C ha-1
Variation in Carbon Density: 29.4 Mg C ha-1
Kilometers
0 0 62.5 125 250 375 500
20 THE HIGH-RESOLUTION CARBON GEOGRAPHY OF PERÚUcayali
Figure 9
Aboveground carbon density of the
N Peruvian Region of Ucayali.
>150
Aboveground Carbon Density
100
Mg C ha-1
50
0
Total Aboveground Carbon Stock: 986.8 Tg C
Mean Carbon Density: 93.7 Mg C ha-1
Variation in Carbon Density: 31.1 Mg C ha-1
Kilometers
0 62.5 125 250 375 500
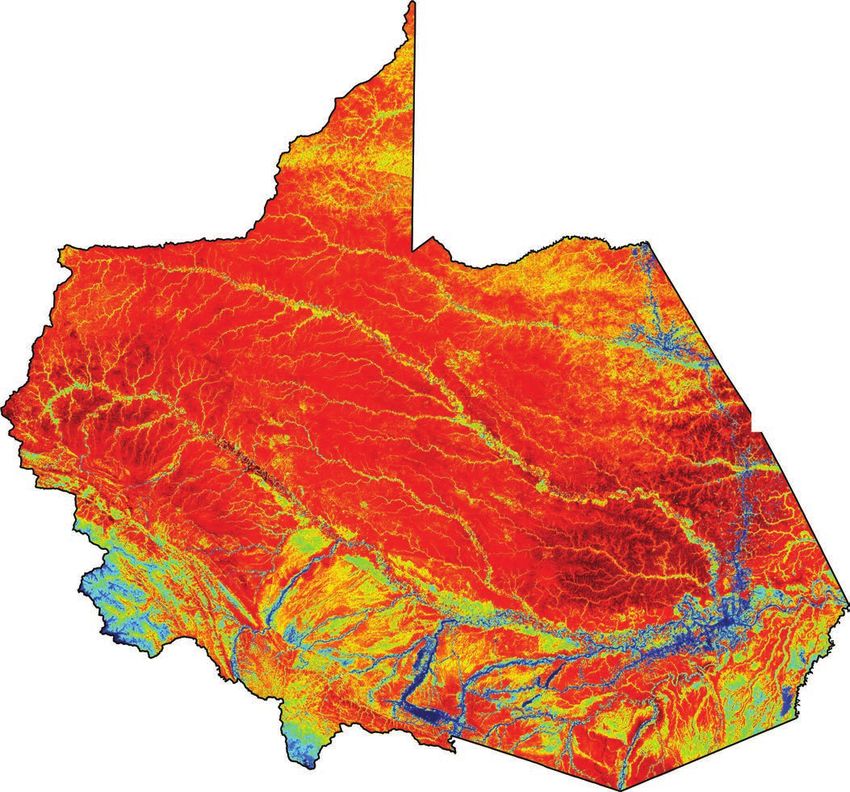
THE HIGH-RESOLUTION CARBON GEOGRAPHY OF PERÚ 21Madre de Dios
Figure 10
Aboveground carbon density of the
N Peruvian Region of Madre de Dios.
>150
Aboveground Carbon Density
100
Mg C ha-1
50
Total Aboveground Carbon Stock: 819.2 Tg C
Mean Carbon Density: 96.4 Mg C ha-1
Variation in Carbon Density: 23.0 Mg C ha-1
Kilometers
0 37.5 75 150 225 300
0
22 THE HIGH-RESOLUTION CARBON GEOGRAPHY OF PERÚSan Martin
Figure 11
Aboveground carbon density of the
N Peruvian Region of San Martin.
>150
Aboveground Carbon Density
100
Mg C ha-1
50
0
Total Aboveground Carbon Stock: 303.8 Tg C
Mean Carbon Density: 59.8 Mg C ha-1
Variation in Carbon Density: 37.8 Mg C ha-1
Kilometers
0 25 50 100 150 200
THE HIGH-RESOLUTION CARBON GEOGRAPHY OF PERÚ 23Amazonas
Figure 12
Aboveground carbon density of the
N Peruvian Region of Amazonas.
>150
Aboveground Carbon Density
Mg C ha-1 100
50
0
Total Aboveground Carbon Stock: 242.9 Tg C
Mean Carbon Density: 61.9 Mg C ha-1
Variation in Carbon Density: 38.7 Mg C ha-1
Kilometers
0 37.5 75 150 225 300
24 THE HIGH-RESOLUTION CARBON GEOGRAPHY OF PERÚCusco
Figure 13
Aboveground carbon density of the
N Peruvian Region of Cusco.
>150
Aboveground Carbon Density
100
Mg C ha-1
50
0
Total Aboveground Carbon Stock: 231.7 Tg C
Mean Carbon Density: 32.2 Mg C ha-1
Variation in Carbon Density: 38.8 Mg C ha-1
Kilometers
0 37.5 75 150 225 300
THE HIGH-RESOLUTION CARBON GEOGRAPHY OF PERÚ 25Junín
Figure 14
Aboveground carbon density of the
N Peruvian Region of Junín.
>150
Aboveground Carbon Density
100
Mg C ha-1
50
Total Aboveground Carbon Stock: 146.4 Tg C
Mean Carbon Density: 33.4 Mg C ha-1
0
Variation in Carbon Density: 37.5 Mg C ha-1
Kilometers
0 35 70 140 210 280
26 THE HIGH-RESOLUTION CARBON GEOGRAPHY OF PERÚHuánuco
Figure 15
Aboveground carbon density of the
N Peruvian Region of Huánuco.
>150
Aboveground Carbon Density
100
Mg C ha-1
50
Total Aboveground Carbon Stock: 130.6 Tg C
Mean Carbon Density: 35.2 Mg C ha-1
0
Variation in Carbon Density: 37.5 Mg C ha-1
Kilometers
0 35 70 140 210 280
THE HIGH-RESOLUTION CARBON GEOGRAPHY OF PERÚ 27Pasco
Figure 16
Aboveground carbon density of the
N Peruvian Region of Pasco.
Aboveground Carbon Density >150
100
Mg C ha-1
50
Total Aboveground Carbon Stock: 123.3 Tg C
Mean Carbon Density: 51.2 Mg C ha-1
Variation in Carbon Density: 42.5 Mg C ha-1
Kilometers
0 25 50 100 150 200 0
28 THE HIGH-RESOLUTION CARBON GEOGRAPHY OF PERÚPuno
N
Figure 17
Aboveground carbon density of the
Peruvian Region of Puno.
>150
Aboveground Carbon Density
100
Mg C ha-1
50
0
Total Aboveground Carbon Stock: 106.0 Tg C
Mean Carbon Density: 15.6 Mg C ha-1
Variation in Carbon Density: 32.3 Mg C ha-1
Kilometers
0 37.5 75 150 225 300
THE HIGH-RESOLUTION CARBON GEOGRAPHY OF PERÚ 29Carbon in Protected Areas
We assessed the aboveground carbon density and total carbon stocks of 174
protected areas within Perú (Table 2, on page 30). A total of 1.816 Pg (billion
metric tons) of carbon are stored in vegetation within these protected areas,
or about 26% of the total estimated aboveground carbon stocks found within
Perú. This leaves up to 74% of aboveground carbon stocks outside of these
protected areas.
The largest stocks are found in the ten largest forest reserves, including the
Alto Purus, Manu, Cordillera Azul and Bahuaja Sonene national parks, Pacaya
Samiria and Pucacuro national reserves, and the Alto Nanay-Pintuyacu
Chambira, Ampiyacu Apayacu, Sierra del Divisor, Yaguas and Santiago
Comaina reserves. These protected areas alone comprise 85% of the total
aboveground carbon stores among the 174 protected areas assessed. Within
humid Amazonian and Andean forests, the size of each protected area is
highly correlated with its total aboveground carbon stock (R2 = 0.93; Figure
18), with each hectare of protection adding an average 95.1 Mg or metric tons
of carbon aboveground to the biosphere, and more to belowground carbon
stocks (not estimated here).
In terms of carbon stocks per unit area protected, reserves such as Ampiyacu
Apayacu, Alto Nanay-Pintayacu Chambira, and Sierra del Divisor contain the
highest carbon densities of 119.2 + 17.5 Mg C ha-1 (Table 2). Other notable
protected areas with high carbon densities include Alto Purus (103.7), Purus
(99.0), Santiago Comaina (96.3), Yanesha (94.4), Manu (94.1), Allpahuayo
Mishana (93.2), Cordillera Azul (92.0), and Tambopata (89.3). Given the
protected area status of these reserves, differences in carbon density are most
likely driven by the environmental factors previously discussed, including
elevation, canopy structure and natural disturbance regimes, and climate.
Figure 18
Relationship between the size of
protected areas in Perú and their total
carbon stored above ground.
30 Figure 19
THE HIGH-RESOLUTION CARBON GEOGRAPHY OF PERÚMean Carbon SD of Carbon
Area Density Density Total Carbon Table 2
Name Type* (ha) (Mg C ha-1) (Mg C ha-1) Stock (Tg C) Mean and standard deviation of
A.B. del Canal Nuevo aboveground carbon density, and total
Imperial 4 17 13.7 3.6 < 0.001 aboveground carbon stock, for protected
Abra Málaga 8 1032 18.5 16.5 0.019 areas in Perú. SD = standard deviation.
Tg = Teragram = one million metric tons.
Abra Málaga
Thastayoc - Royal
Cinclodes 8 74 0.8 0.7 < 0.001
Abra Patricia-Alto
Nieva 8 1423 57.0 8.3 0.081
Airo Pai 3 247884 119.3 15.2 29.547
Albúfera de Medio
Mundo 8 685 6.1 2.4 0.003
Allpahuayo Mishana 2 58084 93.4 25.3 5.424
Alto Mayo 4 177740 57.9 24.1 10.009
Alto Nanay-
Pintuyacu Chambira 8 954646 118.7 11.6 113.361
Alto Purus 1 2514790 103.7 11.4 260.091
Amarakaeri 3 403828 84.2 20.1 33.975
Amazon Natural Park 8 64 82.0 25.3 0.005
Amazon Shelter 8 12 38.0 14.6 < 0.001
Ampay 5 3847 4.5 5.6 0.017
Ampiyacu Apayacu 8 434182 122.2 10.6 53.037
Ancón 7 2186 11.3 5.7 < 0.001
Angostura-Faical 8 8868 16.1 2.8 0.143
Ashaninka 3 184462 66.6 27.3 12.271
Bahuaja 8 6 65.2 42.6 < 0.001
Bahuaja Sonene 1 1102040 88.4 25.6 97.372
Berlin 8 61 40.9 9.0 0.002
Boa Wadack Dari 8 23 76.5 14.5 0.002
Bosque Benjamín I 8 28 98.1 17.4 0.003
Bosque Benjamín II 8 29 108.0 14.1 0.003
Bosque Benjamín III 8 24 69.5 18.9 0.002
Bosque de Palmeras
de la Comunidad
Campe 8 5925 4.1 1.7 0.024
Bosque de Pómac 6 10919 31.7 17.3 0.346
Bosque de Puya
Raymondi -
Titankayocc 8 6265 0.6 1.0 0.004
Bosque de Zarate 7 546 3.0 1.6 0.002
Bosque Huacrupe-La
Calera 8 7327 2.4 0.6 0.017
Bosque Moyan-
Palacio 8 8527 2.5 1.2 0.021
Bosque Nublado 8 3372 48.6 14.1 0.164
Bosque Seco
Amotape 8 125 4.5 0.4 0.001
Bosques de Neblina y
Paramos de Samanga 8 2906 12.0 12.4 0.035
THE HIGH-RESOLUTION CARBON GEOGRAPHY OF PERÚ 31Mean Carbon SD of Carbon
Table 2 (cont.) Area Density Density Total Carbon
Mean and standard deviation of Name Type* (ha) (Mg C ha-1) (Mg C ha-1) Stock (Tg C)
aboveground carbon density, and total Bosques Nublados de
aboveground carbon stock, for protected Udima Sector Centro 8 73 3.4 2.2 < 0.001
areas in Perú. SD = standard deviation. Bosques Nublados de
Tg = Teragram = one million metric tons. Udima Sector Norte 8 2273 2.4 1.2 0.005
Bosques Nublados de
Udima Sector Sur 8 9889 10.2 7.9 0.100
Bosques Secos Salitral
- Huarmaca Sector
Sur 8 3703 2.3 1.3 0.009
Bosques Secos Salitral
- Huarmaca Sector
Norte 8 25319 1.9 0.6 0.049
Calipuy 2 64099 1.8 1.6 0.112
Calipuy 5 4499 1.2 0.9 0.005
Camino Verde
Baltimore 8 20 109.9 13.2 0.002
Canoncillo 8 1506 4.6 1.3 0.007
Cerros de Amotape 1 152933 12.6 6.6 1.921
Chacamarca 6 2436 0.4 1.4 0.001
Chancaybaños 7 2659 4.3 2.1 0.012
Chaparri 8 40524 2.1 1.0 0.086
Chayu Naín 3 23620 57.5 21.1 1.303
Checca 8 563 0.1 0.0 < 0.001
Choquechaca 8 2071 1.8 2.5 0.004
Choquequirao 8 103803 7.7 10.9 0.789
Comunal Tamshiyacu
Tahuayo 8 420071 117.0 17.7 49.154
Copallín 8 11566 32.0 16.7 0.370
Cordillera Azul 1 1353380 92.0 21.8 124.463
Cordillera de Colán 5 39232 53.7 21.6 2.105
Cordillera Escalera 8 150568 77.8 21.3 11.709
Cordillera Huayhuash 7 67570 2.9 2.5 0.197
Cutervo 1 8231 28.2 16.8 0.232
De la Pampa de
Ayacucho 6 298 1.4 2.9 < 0.001
El Angolo 8 65979 2.2 1.9 0.144
El Gato 8 44 76.3 16.3 0.003
El Sira 3 616380 83.9 29.0 51.700
Gotas de Agua I 8 3 2.3 0.3 < 0.001
Gotas de Agua II 8 9 2.4 0.5 < 0.001
Güeppí-Sekime 1 203676 112.4 15.1 22.875
Habana Rural Inn 8 29 56.0 15.1 0.002
Hatun Queuña -
Quishuarani Ccollana 8 232 0.6 0.5 < 0.001
Herman Dantas 8 49 112.6 17.9 0.006
Hierba Buena -
Allpayacu 8 2282 34.9 14.2 0.080
32 THE HIGH-RESOLUTION CARBON GEOGRAPHY OF PERÚMean Carbon SD of Carbon
Area Density Density Total Carbon
Name Type* (ha) (Mg C ha-1) (Mg C ha-1) Stock (Tg C)
Huamanmarca-
Ochuro-Tumpullo 8 15680 0.3 0.4 0.005
Huascarán 1 339991 2.7 3.4 0.848
Huaylla Belén -
Colcamar 8 6341 20.5 18.9 0.130
Huayllapa 8 21043 2.9 2.3 0.060
Huayllay 5 6737 0.4 0.4 0.003
Huaytapallana 8 22384 3.0 4.5 0.067
Huimeki 3 141258 112.5 16.5 15.888
Huiquilla 8 1139 23.1 15.7 0.026
Humedales de Puerto
Viejo 7 276 5.8 2.2 0.002
Humedales de
Ventanilla 8 283 7.5 3.4 0.002
Ichigkat Muja-
Cordillera del Cóndor 1 88506 81.5 16.4 7.111
Illescas 7 37886 0.4 0.2 0.016
Imiria 8 135655 33.9 24.5 4.603
Inotawa-1 8 57 104.4 25.7 0.006
Inotawa-2 8 16 106.9 23.4 0.002
Japu - Bosque
Ukumari Llaqta 8 18762 34.8 23.9 0.645
Jirishanca 8 12085 2.4 2.2 0.029
Junín 2 52561 5.2 7.2 0.134
Juningue 8 37 38.4 16.7 0.001
La Huerta del
Chaparri 8 50 1.3 0.8 < 0.001
La Pampa del Burro 8 2781 53.8 11.0 0.150
Lachay 2 5131 7.0 2.2 0.036
Laguna de
Huacachina 7 2457 10.3 1.0 0.025
Lagunas de Mejía 5 726 10.2 5.2 0.007
Laquipampa 8 8371 2.0 1.5 0.017
Larga Vista I 8 20 58.2 15.2 0.001
Larga Vista II 8 25 52.4 19.7 0.001
Las Panguanas 2 8 1 122.5 0.0 < 0.001
Las Panguanas 3 8 7 118.2 4.1 0.001
Las Panguanas 4 8 5 119.2 4.0 0.001
Llamac 8 6707 2.1 2.1 0.014
Lomas de Ancon 7 10959 4.8 1.6 0.052
Lomas de Atiquipa 8 19046 5.6 2.5 0.107
Los Chilchos 8 45987 46.6 18.0 2.141
Los Pantanos de Villa 8 256 9.2 3.7 0.002
Machiguenga 3 218926 80.3 26.6 17.549
Machupicchu 6 37300 10.7 13.0 0.396
Manglares de Tumbes 5 3004 14.1 4.3 0.041
THE HIGH-RESOLUTION CARBON GEOGRAPHY OF PERÚ 33Mean Carbon SD of Carbon
Table 2 (cont.) Area Density Density Total Carbon
Mean and standard deviation of Name Type* (ha) (Mg C ha-1) (Mg C ha-1) Stock (Tg C)
aboveground carbon density, and total Mantanay 8 361 2.5 3.4 0.001
aboveground carbon stock, for protected
Manu 1 1698530 94.1 26.1 159.718
areas in Perú. SD = standard deviation.
Tg = Teragram = one million metric tons. Matsés 2 420596 118.8 19.2 49.978
Megantoni 5 215854 60.8 27.7 13.116
Microcuenca de Paria 8 767 3.2 2.4 0.002
Milpuj - La Heredad 8 16 2.1 0.6 < 0.001
Nor Yauyos-Cochas 8 221252 1.4 2.2 0.302
Nuevo Amanecer 8 30 116.8 20.8 0.004
Otishi 1 305979 50.8 22.9 15.391
Pacaya Samiria 2 2170220 72.9 29.2 158.286
Pacllon 8 14793 2.2 2.0 0.033
Pagaibamba 4 2038 11.5 7.1 0.023
Pampa Galeras
Barbara D’ Achille 2 8008 0.2 0.1 0.002
Pampa Hermosa 5 11541 40.7 19.0 0.469
Pampacorral 8 764 0.4 1.0 < 0.001
Panguana 8 132 82.9 21.2 0.011
Paracas 2 335432 12.5 3.5 1.389
Paraíso Natural Iwirati 8 101 93.7 13.7 0.009
Pillco Grande-
Bosque de Pumataki 8 275 6.8 7.6 0.002
Pta Salinas,Isla
Huampanú,Isla
Mazorca 2 13686 2.6 1.1 < 0.001
Pucacuro 2 637916 114.1 11.2 72.758
Pucunucho 8 22 25.2 9.2 0.001
Pui Pui 4 54509 9.6 16.1 0.508
Punta Atico 2 3451 12.2 6.3 0.001
Punta Coles 2 3389 10.3 5.9 0.002
Punta Colorado 2 2190 6.4 0.4 < 0.001
Punta Culebras 2 2932 4.7 1.3 < 0.001
Punta Hornillos 2 2772 13.0 4.8 0.001
Punta La Chira 2 2448 8.5 3.1 < 0.001
Punta La Litera 2 2043 8.8 0.8 0.001
Punta Lomas 2 2398 16.3 2.3 < 0.001
Puquio Santa Rosa 4 68 8.1 3.0 0.001
Purus 3 202659 99.0 11.1 20.050
Qosqoccahuarina 8 1824 0.5 0.9 0.001
Refugio K’erenda
Homet 8 35 51.5 15.6 0.002
Reserva Paisajistica
Cerro Khapia 7 18487 0.3 0.2 0.005
Río Abiseo 1 272428 46.7 33.5 12.640
Río Nieva 7 36344 62.8 15.7 2.281
Sagrada Familia 8 126 67.6 20.3 0.009
34 THE HIGH-RESOLUTION CARBON GEOGRAPHY OF PERÚMean Carbon SD of Carbon
Area Density Density Total Carbon
Name Type* (ha) (Mg C ha-1) (Mg C ha-1) Stock (Tg C)
Salinas y Aguada
Blanca 2 369768 0.6 1.3 0.209
San Antonio 8 352 2.6 5.7 0.001
San Fernando 2 154718 6.4 2.6 0.713
San Juan Bautista 8 25 52.5 33.4 0.001
San Marcos 8 991 13.5 15.2 0.013
San Matias San Carlos 4 149321 88.3 27.9 13.180
Santiago Comaina 7 398488 104.8 15.4 41.720
Sele Tecse-Lares Ayllu 8 974 0.4 0.4 < 0.001
Selva Botanica 8 171 115.1 22.4 0.020
Selva Virgen 8 25 80.4 19.1 0.002
Sierra del Divisor 7 1478180 116.2 15.5 171.671
Sub Cuenca del
Cotahuasi 8 490550 0.9 1.5 0.450
Sunchubamba 8 61097 2.4 2.8 0.145
Tabaconas Namballe 5 32267 26.0 20.3 0.837
Tambo Ilusion 8 14 27.1 22.9 < 0.001
Tambopata 2 280234 89.4 20.2 25.046
Taypipiña 8 659 0.1 0.0 < 0.001
Tilacancha 8 6804 3.8 7.0 0.026
Tingo María 1 4776 75.0 20.6 0.358
Titicaca 2 36192 0.8 1.7 0.001
Tumbes 2 19422 20.7 5.2 0.402
Tuntanain 3 94994 97.5 16.3 9.261
Tutusima 8 5 35.3 8.2 < 0.001
Uchumiri 8 10250 0.3 0.4 0.003
Vilacota Maure 8 125175 0.9 1.8 0.110
Yaguas 7 871383 117.6 14.8 102.448
Yanachaga-Chemillén 1 113611 57.5 27.0 6.359
Yanesha 3 33398 92.3 27.4 3.081
*Protected area type:
1. National Park
2. National Reserve
3. Communal Reserve
4. Protected Forest
5. National Sanctuary
6. Historical Sanctuary
7. Reserve Zone
8. Other
THE HIGH-RESOLUTION CARBON GEOGRAPHY OF PERÚ 35Conclusions
U
sing a strategic and cost-effective combination of airborne LiDAR
sampling, tactically placed field calibration plots, freely available satellite
data, and a new geostatistical modeling approach, we have shown that
a high-resolution geography of aboveground carbon stocks can be derived for
a large and environmentally complex country such as Perú. This new carbon
geography also includes spatially explicit maps of uncertainty, which is essential in
decision-making for conservation, management and policy development efforts
associated with ecosystems and societal use of lands. Our effort focused on the
mean and uncertainty of aboveground carbon stocks in every hectare of Perú,
thereby providing a new basis for all stakeholders, large and small, to participate
in improving the use and conservation of ecosystems. Our detailed validation
work at multiple steps within the process demonstrates that aboveground
carbon stocks can be estimated and mapped with a degree of uncertainty that is
indistinguishable from laborious hand-measured, field-based estimates. Moreover,
the approach presented here is spatially continuous, and is thus far less prone
to uncertainty caused by environmental and human-driven variation in carbon
stocks.
Our approach is now established for the country of Perú. Updates to the carbon
map, as well as spatially explicit changes in carbon stocks, will be far easier to
implement going forward. First, carbon emissions from deforestation, forest
degradation and other losses from non-forested ecosystems can be monitored
against this high-resolution carbon map over time. This can be done at low
cost using free Landsat imagery and with operational forest cover monitoring
software such as CLASlite22, 40. Second, any new field plot inventory data can be
ingested into the LiDAR-to-carbon stock calibration to improve it over time for all
types of ecosystems. This can be done on an opportunistic basis, such as when
new ecosystems are considered for more detailed calibration, or as new forest
programs are implemented in the future. Finally, the LiDAR component can be
updated with cost-effective airborne sampling missions, and likely with far smaller
data volume than we used in our effort to geostatistically over-sample the country
of Perú. An estimate of the geographic coverage of future airborne LIDAR data
needed to update the map is between 300,000 and 500,000 hectares, which
can be accomplished in just a few weeks of flight operations with standard LiDAR
equipment and processing software. Critically, any loss or gain of uncertainty in
the carbon map can be monitored with incoming LiDAR data, allowing for a fine-
tuning of the amount of LiDAR sampling required to minimize errors to their low
current levels reported here.
THE HIGH-RESOLUTION CARBON GEOGRAPHY OF PERÚ 37Technical Methodology
Study Region
T
he study covers the country of Perú. The vast majority of the aboveground
carbon is found in humid forests stretching from the Andean treeline
to the lowland Amazonian forests as far as the Ecuadorian, Colombian,
Brazilian and Bolivian borders. A much smaller amount of dry tropical forest is
said to exist primarily in the northern portion of the country, and those areas
were fully incorporated in the study. The study also includes less understood
regions including Andean tundra (Páramos) and high-altitude grasslands, as well as
woodlands and shrublands in the inter-Andean corridor.
General Approach
Our general mapping approach is based on the original high-resolution method
presented by Asner41, with a series of improvements developed through testing
and analysis in a wide variety of countries and ecosystems27,29-31,42. The approach
combines readily available satellite and geographic information system (GIS)
datasets at one-hectare or finer resolution, with airborne LiDAR and field plot
calibration data, in a modeling framework to develop maps of aboveground
carbon density (ACD; units of Mg C ha-1 = metric tons C ha-1) with spatially-explicit
uncertainty estimates (Figure 1).
The core technology is airborne LiDAR, which yields highly detailed measurements
of forest canopy height and vertical canopy profile (Box 1) that predictably scale
with variation in aboveground carbon stocks. Recent studies of a wide range of
vegetation types worldwide demonstrate that airborne LiDAR can be used to
estimate ACD at one-hectare resolution with a precision and accuracy matching
estimates based on field measurements alone43. When properly calibrated,
airborne LiDAR-based and field plot-based estimates of forest carbon stocks
approach just 10% absolute disagreement at one-hectare spatial resolution, across
a wide range of vegetation types including tropical forests44, 45. This offset of
around 10% is lower than the typical errors incurred in field plot-based estimates
of tropical forest carbon stocks at one-hectare resolution46. This suggests that
airborne LiDAR can be used to extend field-plot networks to far larger spatial
scales. Critically, airborne LiDAR-estimated stocks of aboveground carbon can be
generated over hundreds of thousands of hectares per day — a task that cannot be
accomplished with field plots.
A second key aspect of the approach to derive high-resolution carbon maps relies
on machine learning algorithms to scale airborne LiDAR samples up to full regional
THE HIGH-RESOLUTION CARBON GEOGRAPHY OF PERÚ 39Figure B1 What is LiDAR?
Example of airborne LiDAR data
collected over lowland Amazonia by the
Light Detection and Ranging (LiDAR) instruments emit short-duration laser
Carnegie Airborne Observatory. Laser pulses that illuminate a target and measure its location in three dimensions (x, y
pulses are sent and returned to a LiDAR and z). Because the time elapsed from when the laser pulse is emitted to when
sensor on board an aircraft, scanning it is received is known, as well as the exact position of the sensor in the aircraft
from side to side as the plane moves (including the roll, pitch, and yaw), the distance to the object can be calculated
forward in the air, creating a 2-D spatial
and the vertical distribution of the surface measured (Figure B1). Airborne
coverage. Each near-infrared wavelength
laser beam penetrates the canopy, LiDAR sensors emit near-infrared laser light, typically between 900 and 1100
returning light along its pathway to the nanometers. In this wavelength range, vegetation foliage is partly transmissive,
ground. This interaction is digitized by
the LiDAR receiver, and is used to map
vegetation height (top image), underlying
terrain (bottom image), and the layering
of the vegetation in between (not shown
but see Figure B2).
Figure B2
Cross-sectional view of vegetation
structure collected by the Carnegie
Airborne Observatory LiDAR. Different
aspects of the three-dimensional
vegetation structure are measured with
LiDAR: (A) canopy height, (B) vertical
layering or profile, and (C) underlying
topography.
Figure B1
allowing the laser light to pass through the canopy to the ground (Figure B2).
With each interaction of this laser light with the canopy elements, such as
foliage, some of the light is returned to the sensor, allowing for measurement
of the vertical distribution of the canopy tissues. The resolution at which the
Figure B2
returned laser information is collected depends upon the distance between the
sensor and the target. The closer the sensor is to the object, the greater the
density of measurements, and the higher the resolution of the LiDAR results.
However, the closer the distance, the smaller the area covered by the laser
footprint. Although aspects of LiDAR data collection and analysis are expensive,
it becomes highly cost-effective over large areas as compared to field surveys,
and it is becoming increasingly available in many regions. Furthermore, because
of certain fixed costs, the cost of LiDAR per hectare decreases with the area
covered during a survey campaign.
40 THE HIGH-RESOLUTION CARBON GEOGRAPHY OF PERÚor country-wide coverage maps. For decades, stratification and sampling of forests based on a priori environmental information, such as elevation or forest type, has served as the method to extrapolate carbon stock estimates from field inventory plots47. However, stratification-based methods can yield artificial boundaries in the resulting carbon maps, particularly when applied across highly diverse environmental conditions27. In response to this problem, Baccini et al.2 employed a Random Forest Machine Learning (RFML) algorithm to model the relationship between LiDAR-based forest carbon samples and a portfolio of spatially extensive satellite data sets. RFML fits multiple environmental datasets (predictors) to estimates of vegetation structure or biomass (response), as described later. In doing so, a direct scaling of LiDAR samples to full-coverage maps can be derived without artificial boundaries between ecosystems that often occur using traditional stratification approaches. Recently, Mascaro et al.48 showed that scaling LiDAR-based carbon samples up to a regional level was 60% more accurate with RFML compared to traditional stratification approaches. In addition, Baccini and Asner49 demonstrated that RFML methods can be quickly and cost-effectively updated with new carbon data over time, allowing for dynamic long-term monitoring. Another attractive characteristic of RFML is its ability to provide quantitative information on the environmental variables most predictive of current carbon distributions42, 48. LiDAR Flight Planning We used airborne LiDAR to massively sample plant canopy structure throughout the portions of Perú containing woody vegetation. The final map of aboveground carbon density (ACD) relied on an airborne LiDAR sampling approach that supplies data to the RFML upscaling methodology (described below). This required a focus of many aircraft flights on forested ecosystems, but it also included extensive portions of grassland, shrubland, savanna, and open woodland ecosystems. We approached this challenge by over-sampling the land surface using a preliminary stratification of the country as a flight- planning guide. The stratification was based on geologic substrate, soils, topography and large known shifts in community composition. We created this flight-planning map by fusing a variety of previously published and new spatial data sources described here. We started with a base map called the Geological Map of Perú, provided at 1:1,000,000 scale by INGEMMET50. In the time since the publication of this map, field and mapping studies of geology, soil and vegetation patterns in western Amazonia have advanced, and these new data both support and inform the INGEMMET map. These data include a new estimate of lowland geomorphic surfaces derived from extensive Landsat satellite and field sampling of plants and soils. We also used maps of topography from the NASA Shuttle Radar Topography Mission (SRTM), ecological systems from NatureServe.org, and other spatial datasets to extend and enhance detail to the INGEMMET map. We also incorporated information from more recent field inventories of plants and soils for portions of Perú. Integration of these datasets was carried out in ten summary steps: 1. A geological study of the Nanay river drainage indicated that it is distinct from the surrounding, cation-rich Pebas geologic formation, and is more appropriately grouped with the cation-poor Nauta formation51. This THE HIGH-RESOLUTION CARBON GEOGRAPHY OF PERÚ 41
You can also read