Finding the Gap: Neuromorphic Motion Vision in Cluttered Environments
←
→
Page content transcription
If your browser does not render page correctly, please read the page content below
Finding the Gap: Neuromorphic Motion Vision in
                                         Cluttered Environments
                                         Thorben Schoepe1,2,3* , Ella Janotte4 , Moritz B. Milde5 , Olivier J.N. Bertrand6 , Martin
                                         Egelhaaf6 , and Elisabetta Chicca1,2,3
                                         1 Faculty of Technology and Cognitive Interaction Technology Center of Excellence (CITEC), Bielefeld University,
                                         Germany.
                                         2 Bio-Inspired Circuits and Systems (BICS) Lab. Zernike Institute for Advanced Materials (Zernike Inst Adv Mat),

                                         University of Groningen, Netherlands.
                                         3 CogniGron (Groningen Cognitive Systems and Materials Center), University of Groningen, Netherlands.
arXiv:2102.08417v1 [cs.NE] 16 Feb 2021

                                         4 Event Driven Perception for Robotics, Italian Institute of Technology, iCub facility, Genoa, Italy.
                                         5 International Centre for Neuromorphic Systems, MARCS Institute, Western Sydney University, Penrith, Australia.
                                         6 Neurobiology, Faculty of Biology, Bielefeld University, Bielefeld, Germany.
                                         * t.schoepe@rug.nl

                                         ABSTRACT

                                         Many animals meander in environments and avoid collisions. How the underlying neuronal machinery can yield robust
                                         behaviour in a variety of environments remains unclear. In the fly brain, motion-sensitive neurons indicate the presence of
                                         nearby objects and directional cues are integrated within an area known as the central complex. Such neuronal machinery,
                                         in contrast with the traditional stream-based approach to signal processing, uses an event-based approach, with events
                                         occurring when changes are sensed by the animal. Contrary to classical von Neumann computing architectures, event-based
                                         neuromorphic hardware is designed to process information asynchronously and in a distributed manner. Inspired by the fly
                                         brain, we model, for the first time, a neuromorphic closed-loop system mimicking essential behaviours observed in flying
                                         insects, such as meandering in clutter and crossing of gaps, both of which are also highly relevant for autonomous vehicles.
                                         We implemented our system both in software and on neuromorphic hardware. While moving through an environment, our
                                         agent perceives changes in its surroundings and uses this information for collision avoidance. The agent’s manoeuvres result
                                         from a closed action-perception loop implementing probabilistic decision-making processes. This loop-closure is thought to
                                         have driven the development of neural circuitry in biological agents since the Cambrian explosion. In the fundamental quest to
                                         understand neural computation in artificial agents, we come closer to understanding and modelling biological intelligence by
                                         closing the loop also in neuromorphic systems. As a closed-loop system, our system deepens our understanding of processing
                                         in neural networks and their computations in both biological and artificial systems. With these investigations, we aim to set the
                                         foundations for neuromorphic intelligence in the future, moving towards leveraging the full potential of neuromorphic systems.

                                         1 Introduction
                                         While navigating through the environment, our proprioception informs us about our posture, our eyes look for a familiar
                                         direction or goal, and our ears watch-out for dangers. The brain deals with multiple data-streams in a continuous and parallel
                                         manner. Autonomous vehicles requiring to safely manoeuvre in their environment also have to deal with such high-dimensional
                                         data-streams which are conventionally acquired and analysed at a fixed sampling frequency. A fixed sampling frequency limits
                                         the temporal resolution of data-processing and the amount of data which can be processed. To address these limitations, two
                                         approaches can be combined. First, data-streams can be sparsified by sending only information when an observed quantity
                                         changes, i.e. when it is required. Second, the data-stream can be processed in a parallel and asynchronous fashion. This calls for
                                         an alternative approach to sensing and computing which, much like the brain, acquires and processes information completely
                                         asynchronously and in a distributed network of computing elements, e.g. neurons and synapses. To fully demonstrate the
                                         advantages of this approach we use the example of autonomous navigation as it is well studied and algorithmically understood
                                         in a variety of environments be they water1 , ground2 , air3 , or space4 . In the last decades, part of the engineering community
                                         has sought inspiration from animals2, 5, 6 . For example, flying insects such as bees and flies share the same requirements as
                                         light-weight flying vehicles manoeuvring in various habitats from almost object-free terrains7 to overly cluttered forests8 via
                                         human-made landscapes. They need to avoid collisions to prevent damaging their wings9 and they accomplish this task by
                                         using limited neuronal resources (less than 1M10 and 100k11 neurons for honeybees and fruit-flies respectively). At the core of
                                         this machinery is a well-described subset of neurons responding to the apparent motion of surrounding objects12, 13 . While the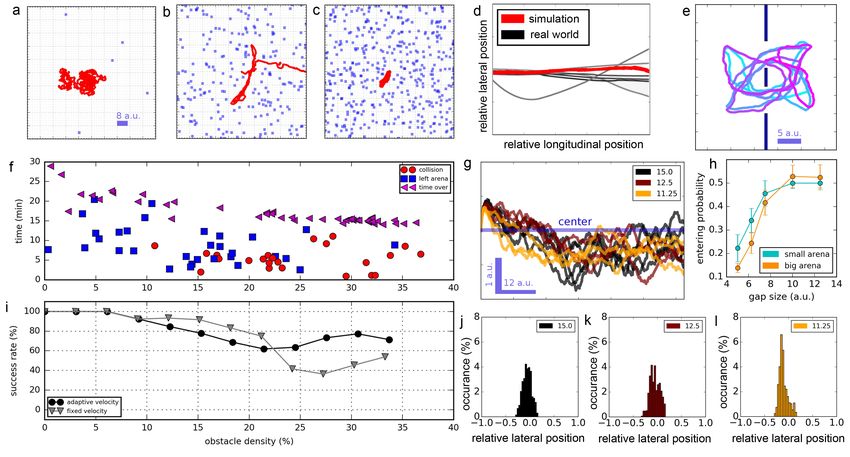
animal translates in its environment, the responses of such neurons provide estimates to the time-to-contact to nearby objects by
approximating the apparent motion of the objects on the retina (i.e. the optic flow14 ). These neurons are thought to steer the
animal away from obstacles15–18 or toward gaps19–21 resulting in a collision-free path.
    The collision avoidance machinery in insects is thought to be driven by a large array of motion-sensitive neurons, distributed
in an omnidirectional visual field. These neurons operate asynchronously. Hence, biology has found an asynchronous and
distributed solution to the problem of collision avoidance. We seek to emulate such a solution in bio-inspired neuromorphic
hardware which has the advantage of being low-volume and low-power. More importantly, it also requires an asynchronous and
parallel information processing implementation yielding a better understanding of neural computation.
    To date, most of the mimics of the collision avoidance machinery rely on traditional cameras from which every pixel at
every time point (i.e. at a fixed sampling frequency) needs to be processed6, 15, 16, 22–24 . The processing occurs even when
nothing is changing in the agent’s surroundings. This constant processing leads to a dense stream of data and consequently a
high energy consumption. To reduce this, an efficient means of communication can be employed, such as action potentials
observed in biological neural circuits. Action potentials or spikes enable to transmit information only when necessary, i.e.
event-driven. In an analogous way, event-based cameras send events asynchronously only when a change in luminance over
time is observed25–29 . This sampling scheme is referred to as Lebesgue sampling30 . Contrary to frame-based cameras, which
employ Riemann sampling30 , bandwidth and power demands are significantly reduced (see Section Event-Based Cameras in
Gazebo for more details).
    Open-loop collision avoidance based on optic-flow can use event-streams31–39 (for more detailed comparison of mentioned
approaches refer to39 ) and an insect-inspired motion pathway has been suggested for collision avoidance39 . Closed-loop
collision avoidance behaviour have been demonstrated previously using fully conventional sensory-processing (frame-based
sensor and CPUs/GPUs) approaches23, 24 (for extensive review please refer to40, 41 ). These insect-inspired approaches reduce
the computational demands for collision avoidance by reducing the bandwidth of the visual input. This reduction is achieved by
collapsing the visual field into a left and right components. Later processing only needs to compare left versus right signals.
These approaches, however, are hardwired processing of visual features. The hard-coded features may not be relevant in other
environments. Mixed-system (event-based camera and conventional processing) approaches36, 42 , on the other hand, do not
reduce the visual input by separating left-right signal pathways, but utilise event-based cameras which only transmit changes.
In contrast to biological systems, they do not, however, leverage the advantages of event-based processing until the actuation
of the motors. Finally, fully neuromorphic (event-based camera and parallel, asynchronous processing) approaches43, 44 rely
on spike-based information processing from sensing to actuation of motors. To date, these approaches rely on hardwired,
deterministic decision making processing. The hard-coded decisions, i.e. creating a reflex-like machine, may lead to sub-optimal
decisions when multiple directions to avoid collisions are viable. Here, we aim for the first time at closing the action-perception
loop40, 41, 45 , while explicitly extracting insect-inspired visual features, making active decisions, and using neuromorphic
spike-based computation from sensing to actuation.             Inspired by the collision avoidance algorithm proposed for flies and
bees, we developed a spiking neural network (SNN)1 that profits from the parsimony of event-based cameras and is compatible
with state-of-the-art digital and mixed-signal neuromorphic processing systems. The response of the visual motion pathway of
our network resembles the activity of motion-sensitive neurons in the visual system of flies. We ran closed-loop experiments
with an autonomous agent in a variety of conditions to assess the collision avoidance and gap finding capabilities of our network.
These conditions were chosen from the biological evidence for collision avoidance obtained for flying insects (empty box46 ,
corridors47–50 , gap crossing8, 20, 21 , and cluttered environments9 ). Our agent, utilising its underlying neural network, manages to
stay away from walls in a box, centres in corridors, crosses gaps and meanders in cluttered environments. Therefore, it may
find applications for autonomous vehicles. Besides, it may serve as a theoretical playground to understand biological systems
by using neuromorphic principles replicating an entire action-perception loop.

2 Results
The SNN model proposed in this work consists of two main components, namely a retinotopical map of insect-inspired motion
detectors, i.e. spiking Elementary Motion Detectors (sEMDs)39 , and an inverse soft Winner-Take-All (WTA) network (see
Figure 1d and Methods Figure 4). The former extracts optic flow (OF) which, during a translation, is anti-proportionally related
to the agent’s relative distance to objects in the environment. The latter searches for a region of low apparent motion, hence an
obstacle free direction (see Figure 1a-c). After the detection of such a path in the environment the agent executes a turn towards
the new movement course. We characterised the network in two steps. First we evaluated the sEMD’s response and discussed
similarities to its biological counterpart, i.e. T4/T5 neurons, which are thought to be at the core of elementary motion processing
in fruit flies51, 52 . Second, to further prove the real-world applicability of sEMD based gap finding in an SNN, we performed
closed-loop experiments. We simulated an agent seeing the world through an event-based camera in the Neurorobotics physical
   1 Spiking   Neural Network: Massively parallel network consisting of populations of spike-based artificial neurons and synapses.

                                                                                                                                      2/26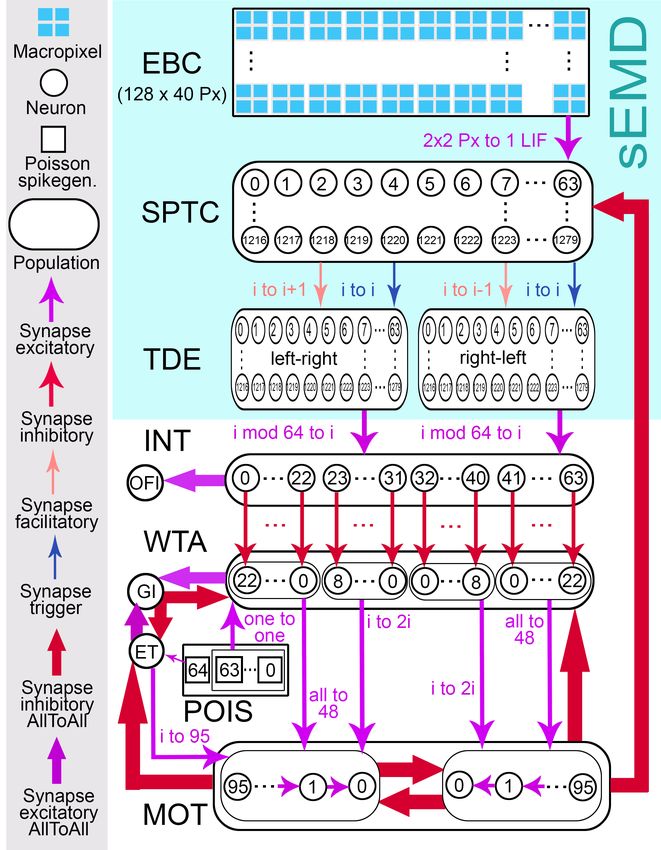
simulation platform53 . The camera output was processed by the SNN resulting in a steering command. We selected a set of
parameters that yield the agent to keep at least a mean clearance of ~6 a.u.2 to objects in a box and to enter corridors only with
a width greater than 10 a.u. (see Appendix section The Motion-Vision Network). We tested the performance of this simulated
agent with these parameters in all reported experimental conditions hereafter. These experimental conditions were inspired by
previous experiments with flying insects.

2.1 Spiking Elementary Motion Detector
The sEMD represents an event-driven adaptation for neuromorphic sensory-processing systems of the well established
correlation-based elementary motion detector54 . To evaluate the response of the sEMD in the Nest simulator55 , we compared
the normalised velocity tuning curves of its ON-Pathway (with recorded event-based camera’s input) to the corresponding
normalised tuning curve of Drosophila’s T4 and T5 neurons56 . Both velocity tuning curves are determined in response to
square-wave gratings with 100 % contrast and a wavelength of 20° moving at a range of constant velocities (with temporal
frequencies from 0.1 Hz to 10 Hz). The sEMD preferred direction exhibits a bell-shaped velocity tuning curve (see Figure 1
e), which has the maximum response (mean population activity) at 5 Hz. The null direction response is much lower than the
preferred direction.
    The sEMD model, which is composed of an event-based camera, a Spatio-Temporal Correlation (SPTC) population and the
Time Difference Encoder (TDE) (see Figure 4), exhibits a drop in its output response when the temporal frequency exceeds 5 Hz.
This drop is, however, not anticipated from the TDE’s response (see Figure 3). We would expect the response to saturate at high
temporal frequencies since the TDE produces interspike intervals and firing rates proportional to the time difference between
the two inputs of the TDE. The drop in response being rather a consequence of the motion detector model itself, we suggest it
to be a consequence of the spatio-temporal band-pass filtering installed by the SPTC layer. While low temporal frequencies
lead to unambiguous spatio-temporally correlated and causal SPTC spikes from adjacent neurons, high temporal frequencies
lead to anti-correlated and non-causal spikes. Thus, the TDE can no longer (spatially) match the spikes unambiguously, which
results in a bell-shaped velocity tuning curve of the preferred direction response.
    A similar bell-shaped velocity tuning curve can be observed in Drosophila’s T4 cells12, 51, 56 . While Drosophila’s velocity
tuning curves peak at 3 Hz in a drug induced flying state, the sEMD’s preferred direction velocity tuning curve peaks at 5 Hz.
This suggests that based on the reported parameter set of the sEMD, it is tuned to higher relative velocities. The model performs
in a robust way for a wide range of illuminations (from 5 lux to 5000 lux) and relative contrasts (50 % response reached at
approximately 35 % relative contrast), as shown in Figure A.2. The sEMD approximates the elementary motion processing in
the fly brain. This processing is part of the input to the flight control and collision avoidance machinery, hence it can be used as
an input for determining a collision-free path.

2.2 Agent’s Behaviour
The robot’s collision avoidance performance was evaluated in an experiment with the agent moving through environments
with varying obstacle density. To further understand the mechanisms underlying the robot’s movement performance two more
experiments were designed. The agent’s gap crossing behaviour and tunnel centering behaviour were investigated. These
behaviour were analysed in insects in a plane, therefore little is known about the effect of flying altitude in most behaviour. We
limited our agent to a 2D motion due to this limited understanding.

2.2.1 Densely Cluttered Environments
We evaluated the agent’s collision avoidance performance in an arena with an obstacle density3 between 0 and 38 %(0.05
objects per square a.u.). The simulation stops either when the robot collides with an obstacle4 , when it leaves the arena,
or when the simulation real-world-time of six hours is over (see Figure 2f). At low obstacle densities (< 5%) there exist
several collision-free paths. The robot exhibits a random walk as the decision making inverse WTA neuron population is
receiving background spiking activity sampled from a Poisson process (see Figure 2a,f). In the absence of OF input the
Poisson distributed background spikes dominates the inverse WTA output which results in a probabilistic decision process. The
decisions made by the network become less probabilistic with increasing obstacle density since the robot starts to follow the
locally low object-density paths forming in the environment (see Figure 2b,f). At obstacle densities higher than 20 % most
of the gaps in the environment are smaller than the robot’s minimum mean obstacle clearance5 of 7 a.u. (see Figure A.5 left)
so that the agent stays close to its start location (see Figure A.5 right and Figure 2c,f). In this range the robot starts to crash
into obstacles reaching a minimum success rate of around 60 % at 22 % obstacle density. For higher obstacle densities the
success rate increases again (see Figure 2i). A collision of the robot is generally caused by the robot’s too long reaction time in
  2 A.u.: Arbitrary unit, distance divided by robot size, see section Closed-loop simulation in environments
  3 Obstacle density: Percentage of total area covered with objects.
  4 Collision: Simulated robot’s outline overlaps with area occupied by object
  5 Obstacle clearance: Robot’s distance to the center of the closest object.

                                                                                                                              3/26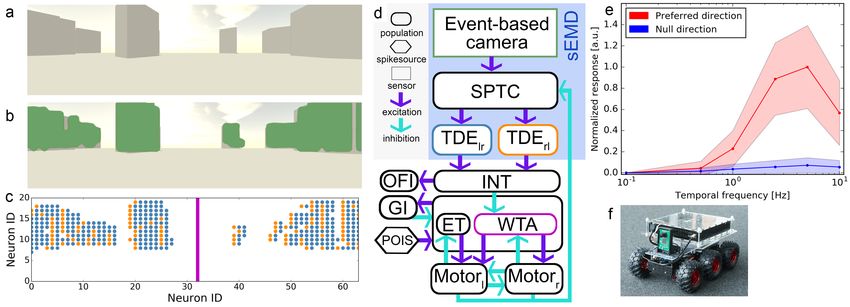
Figure 1. (a-c) Network response in a cluttered environment, (d) collision avoidance network, (e) normalised sEMD mean
response to a square wave grating and (f) robot used in real-world experiment. a) Cluttered neurorobotics platform environment.
The obstacle walls are covered with vertical square-wave-gratings only visible for the event-based camera b) Green areas:
simulated event-based camera events directly extracted from the Neurorobotics visual front-end while the agent is slowly
moving through the scene in a). c) Bright blue and orange dots: Time Difference Encoder (TDE) left-right and right-left spike
response to the scene in a) binned over ~0.5 seconds of simulation time, pink stripe: inverse WTA spike which indicates an
obstacle free direction. This spike activates the agent’s next turning movement (saccade) by exciting one of the two motor
populations in d). The location of the winning neuron defines the direction and duration of the upcoming turn. d) Collision
avoidance network with spiking Elementary Motion Detectors (sEMDs) which consist of an event-based camera, a
Spatio-Temporal Correlation (SPTC) population and two Time Difference Encoder (TDE) populations. Event-based camera
(sensory input), SPTC population (noise filter and downsampling), TDE populations (time-to-travel translation to spike rate
and Inter-Spike-Interval (ISI)), Integrator (INT) population (reduces 2D retinotopical map to 1D), inverse
Winner-Take-All (WTA) population (detects minimum of OF, hence obstacle free direction), Escape Turn (ET) population
(triggers turn when inverse WTA can not find direction), Motor (MOT) populations (control turn direction and duration), Optic
Flow Integrator (OFI) population (modulates robot velocity), Poisson Spike Generators (POIS) (drive decision process with
Poisson spike process) and Global Inhibition (GI) population (suppresses loosing neurons in inverse WTA population and ET
population). e) Normalised preferred direction and null direction mean response of two Nest sEMD populations to a square
wave grating moving in one cardinal direction with a wavelength of 20° and 100 % relative contrast recorded with an
event-based camera at 5000 lx illumination. The standard deviation was calculated on the response of the sEMD population. f)
Robot used for real-world experiment in Figure 2d. An embedded event-based camera serves as input to a SpiNN-5 board
which drives the motor controllers through an Odroid mini-computer.

an environment with low mean obstacle clearance, hence with high obstacle density (see Figure A.5). Since the robot only
senses visual stimuli in a 140 degrees horizontal visual field, symmetrically centered around its direction of motion, there is a
blind-spot behind the agent. After a strong turn the simulated robot might be confronted with a previously not seen object
and directly crash into it. Nevertheless, the agent shows a very robust gap centering behaviour in a large range of different
environments with obstacle densities between 0 and 38 %. The robot’s mean success rate amounts to 81 %.
    While local OF is instrumental in finding gaps, global OF provides information about the clutteredness of the environment.
Flies and bees decrease their flying speed when the clutteredness of the environment increases48, 49 . Our agent regulates its
speed based on the global OF and, consequently, moves slower in denser regions of the environment (see Figure A.7). To
examine the effect of the velocity dependency, we ran a second experiment with the robot moving with constant velocity (see
Figure 2i and Figure A.6). With velocity control collisions were encountered only in few runs, however, for obstacle densities
higher than 24 percent the number of collisions significantly increased when the velocity was kept constant.

2.2.2 Gaps
When presented with a choice between two gaps of different size bees prefer to pass the larger gap8, 57 . This behaviour decreases
the insect’s collision probability significantly. While bees might choose the gap in a complex decision process21 our agent’s
preference underlies a simple probabilistic integration mechanism. The simulated robot’s upcoming movement direction is
determined by an inverse WTA spike occurring in an obstacle-free direction as shown in Figure 1a-c. When confronted with a

                                                                                                                             4/26
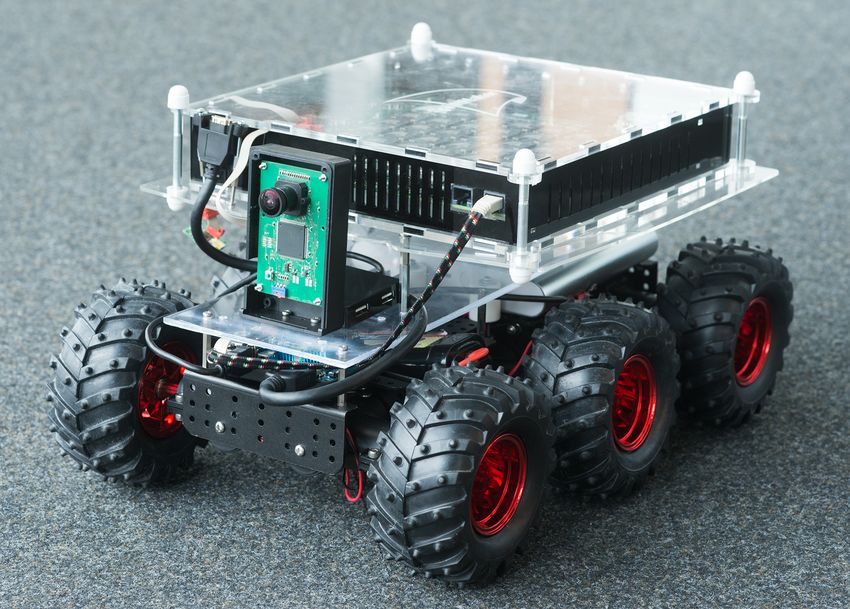
Figure 2. Agent’s behaviour in different environments. a-c) Trajectories recorded in arenas with increasing obstacle densities.
d) Comparison of real-world centering behaviour (red) to Neurorobotics Platform behaviour (black) in a corridor with
normalised corridor width and an absolute corridor length of approximately one meter. e) Simulated robot’s trajectory in the
gap crossing experiment in a large arena. Colour represents time (t0 : light blue, tend : magenta). f) Simulated robot’s
performance in different environments as shown in a-c with modulated velocity. Simulation time at which the simulated robot
leaves the arena, collides or the time is over. g) Trajectories in tunnels with a tunnel width of 15, 12.5 and 11.25 a.u.. h) Gap
crossing probability in dependency of the gap width for a large and a small arena. i) Simulated robot’s performance in cluttered
environments as shown in a-c with modulated velocity (black, calculated from data in f) and fixed velocity (grey). Agent’s
success rate, hence number of runs without collisions. j-l) Agent’s variance from tunnel center for different tunnels.

small and a large gap the probability of an inverse WTA spike appearing in the greater gap is higher. Hence, we assume that the
robot automatically follows pathways with a larger gap size. To evaluate this assumption we observed the robot’s gap crossing
in an arena with two alternative gaps (see Figure 2e). The robot can decide to cross any of the two gaps or stay in one half of the
arena. There is a competition between staying in the open-space and crossing a gap. The larger the gap size is, the more likely
the robot will cross a gap. We investigated the probability to cross gaps by having two gaps, one with a fixed gap size (10 times
the agent width), the other with a gap size between 5 a.u and 13 a.u. We calculated the gap entering probability by comparing
the number of passes through both gaps. As expected the entering probability increases with gap size until a width of 10 a.u.
(see Figure 2h). For a larger gap width the entering probability does not change significantly. However, for smaller gap sizes
the probability of a spike pointing towards open space in the inverse WTA becomes significantly higher. Therefore, the robot
prefers to pass through gaps of larger size. Besides the gap width the arena size changes the passing probability. In a smaller
arena the simulated robot stays closer to the gap entry which increases the relative gap size sensed by the agent. Therefore,
a larger part of the vehicle’s visual field is occupied by the gap entry which increases the probability of a spike occurring in
the gap area. In a smaller arena we observed that the robot’s gap entering probability is higher for gaps smaller then 10 a.u.
than in a big arena (see Figure 2h). A decrease in arena size can be compared to an increase in obstacle density since both
parameters reduce the robot’s obstacle mean clearance (see Figure A.5, left). Therefore, the agent tends to enter gaps of smaller
size in densely cluttered environments. This automatic scaling mechanism keeps the agent’s collision probability very low in
sparsely cluttered environments by staying away from small gaps. In environments with high obstacle density the robot still
keeps its mobility by passing through smaller gaps. Finally, when the obstacle density exceeds 20 %, most gaps fall below the
gap entering threshold so that the robot can not leave the arena anymore (see Figure A.5, right and Figure 2c,f).

                                                                                                                             5/26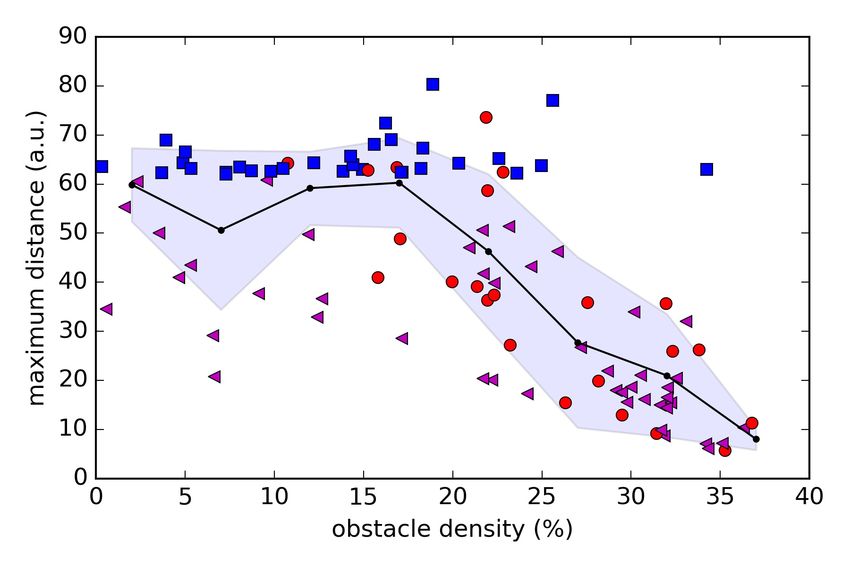
2.2.3 Corridors
One common experiment to characterise an agent’s motion vision response is to observe its centering behaviour in a tunnel
equipped with vertical stripes on the walls. The simple geometry of the environment enables the observer to directly relate
the received visual input with the agent’s actions. In bees and flies an increase in flight velocity proportionally to the tunnel
width has been observed17, 48, 49 . In very narrow tunnels insects show a pronounced centering behaviour which declines with
increasing tunnel width. We evaluated the robot’s performance in three tunnels with different tunnel widths. Similar to the
biological role model the robot’s velocity stands in a positive linear relationship with the tunnel width. The measured velocity
in a.u. per second is ~0.79, ~0.75 and ~0.72 for a tunnel width of 15, 12.5 and 11.25 a.u. respectively. Furthermore, the
robot always stays in the center of the tunnel, especially in very narrow tunnels (see Figure 2g). The deviation from the tunnel
center is proportional to the tunnel width (for the simulated robot, see Figure 2j–l, physical robot see 2d). Therefore, similar to
observations in blowflies, the robot’s lateral position in the tunnel changes linearly with the tunnel width49 .

3 Discussion
Autonomous agents need to successfully avoid obstacles in a variety of different environments, be they human made or of
natural origin. Our investigations present a closed-loop proof of concept of how obstacle avoidance could be performed in a
parsimonious, asynchronous and fully distributed fashion. While most results reported here are based on computer simulations,
the implementation on digital or mixed-signal neuromorphic hardware of each building block of the simulated SNN have been
demonstrated for event-based cameras26 , the sEMD39, 58 (see Figure A.2), artificial neurons59 and synapses60 , as well as the
inverse WTA61 . We demonstrated for the first time a simulation of a neuromorphic system that takes informed decisions while
moving in its environment by closing the action-perception loop. We emulated this system on neuromorphic sensory-processing
hardware carried by a physical robot (see Figure 1f, 2d, A.8 and A.9), tested it in a corridor centering experiment, and obtained
similar results to the simulation. These real-world experiments suggest that the underlying computational primitives lead to
robust decision making in operational real-time. Due to the physical simulation with the engine Gazebo that capture the physics
of the movements and our real-world proof of implementation, our simulations are likely to translate to real-world situations.
While producing relatively simple, yet crucial decisions, the proposed model represents a critical milestone towards enabling
parallel, asynchronous and purely event-driven neuromorphic systems.
    Our proposed SNN architecture comprises of ~300k synapses and ~4k neurons which yields a low-power, lightweight
and robust neural algorithm. When implemented on mixed-signal neuromorphic processing hardware, e.g.62–64 , the payload
required to perform on-board processing will be drastically reduced. This reduction stems from the low volume and lower
power requirements of neuromorphic hardware. In addition such hardware implementation would ensure operational real-time
decision making capabilities. The features outlined above are quite desirable in the context of highly constrained autonomous
systems such as drones or other unmanned vehicles.
    We investigated the performance of the sEMDs, the apparent motion encoders in our SNN, in detail. The sEMDs show a
similar velocity response curve to motion-sensitive neurons (e.g. T4 and T5 neurons in the fruitfly’s brain12, 18 ) when presented
with a grating of 20° spatial frequency and temporal frequencies between 0.1 and 10 Hz. Due to the logarithmic illumination
sensitivity of the event-based cameras the motion vision apparatus is very robust against absolute brightness levels in the range
of 5 up to 5000 lux. The sEMD model shows a much higher sensitivity regarding contrast changes than its biological role
model. Current research suggest that Drosophila’s optical lobe performs contrast normalisation through inhibitory recurrent
feedback to evoke a contrast independent response52 . In a next step we will implement contrast normalisation in our motion
vision network to improve its performance in natural environments.
    Besides the similarities in neural response, the agent showed many similarities to flying insects in its behaviour in spatially
constrained environments. It meandered in cluttered terrain (Section Densely Cluttered Environments), modulated its speed as
a function of object proximity (Section Corridors), selected wider gaps (Section Gaps), centered in tunnels (Section Corridors),
while using an active gaze strategy known as saccadic flight control (Section Collision Avoidance Network)17, 48, 49, 57, 65 . The
agent moved collision-free through cluttered environments with an obstacle density between 0 and 38 % with a mean success
rate of 81 %6 . We further examined the simulated robot’s performance to understand the essential behavioural components
which led to a low collision rate. The most significant ingredient in that regard was the implementation of an OF strength
dependent locomotion velocity. This insect inspired control mechanism improved the collision avoidance performance of
the agent from a mean success rate of 76 % to 81 % (Compare Figure 2i and Figure A.6). We propose that this velocity
adaptation mechanism could be regulated in insects by a simple feedback control loop. This loop changes the agent’s velocity
anti-proportionally to the global OF integrated by a subset of neurons (For further explanations see Section Collision Avoidance
Network).
   6 Several
           closed-loop, insect-inspired approaches have been demonstrated40, 41 , however, due to a missing unifying benchmark and evaluation metric, to
compare insect-inspired collision avoidance algorithms, we cannot provide a quantitative comparison

                                                                                                                                                  6/26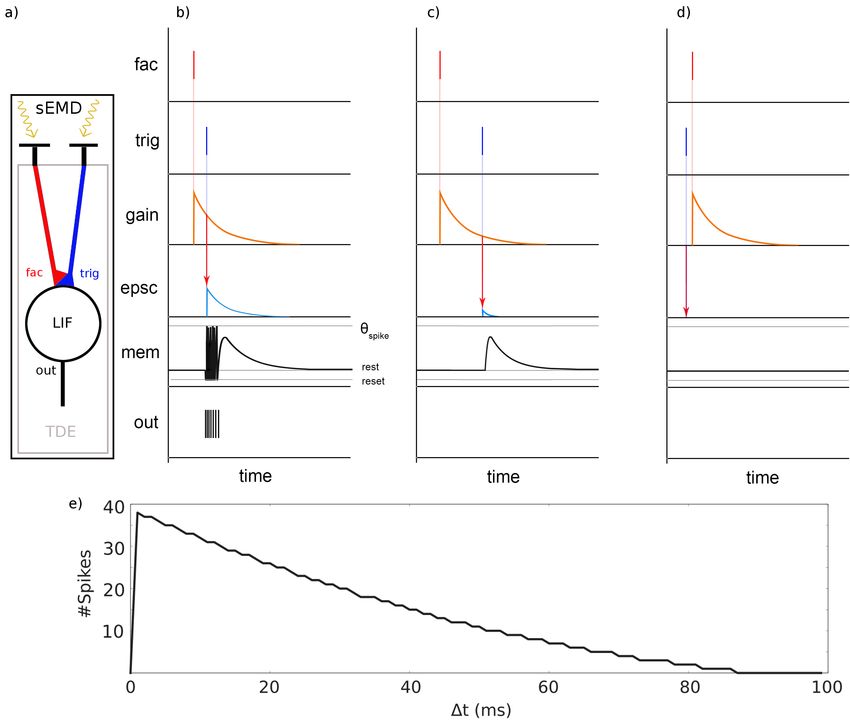
An OF-dependent control of locomotion velocity is only one of at least three mechanisms which decreased the agent’s rate of
collision. When moving in environments of high obstacle density the simulated robot follows locally low obstacle density paths.
We suggest that a probabilistic decision process in the network model automatically keeps the agent’s collision probability low
by following these pathways. We further investigated this path choice mechanism in a second experiment. Here, the agent
had to cross two gaps of different size. The dependence of the agent’ probability to cross the gap resembled that of bees57 .
Similar to insects the agent preferred gaps of larger size. Bees cross gaps with a gap-size as small as 1.5 times their wingspan21 .
In contrast our agent crossed gaps of 5 times its body width. This discrepancy in performance may be due to the absence of
a goal. A goal can be understood as providing an incentive to cross a gap despite a risk of collision. Indeed in behavioural
experiments, bees had to cross the gap to return to their home. Combining different directions, such as a collision-free path and
a goal, require an integration of the two signal representations. Such networks have been proposed for navigating insects66 .
Integration of similar streams of information have been demonstrated to work in neuromorphic systems58, 67, 68 , however, we
envision that a dynamic competition between collision avoidance and goal reaching neural representations could allow our
robot to cross gaps 1.5 times its width.
    The findings reported here indicate an alternative point of view how flies and bees could use motion-vision input to move
through the environment, not by collision avoidance but by gap finding. As also stated by Baird and Dacke8 , flies and bees
might not actively avoid obstacles but fly towards open space, i.e. gaps. Looking at our network, we suggest that WTA alike
structures in flying insect brains might integrate different sensory inhibitory and excitatory inputs with previously acquired
knowledge to take navigational decisions. One could think of the central complex as such a structure which has been described
recently in several insect species69 .
    The third mechanism is the agent’s centering behaviour. By staying in the middle of a tunnel with similar patterns on both
walls the simulated robot minimises its risk of colliding with a wall. The agent’s deviation from the tunnel center changes
approximately linearly with the tunnel width. These results show a very strong resemblance with experimental data from
blowflies (see Figure 2j–l)49 . So far centering behaviour was suggested to result from balancing the OF on both eyes. Centering
in a tunnel can be seen as crossing elongated gaps. Our agent is also able to cross gaps. Two hypothesis have been suggested to
cross gaps in flying insects, using the OF contrast20 and the brightness8 . Our results suggest that collision avoidance could
be mediated by identifying minimum optic flow to center in tunnel, cross gaps, or meander in cluttered environment. This
strategy has so far not been investigated in flying insects. The main hypothesis to control flight in clutter is to balance either an
average or the maximum OF on both eyes17 . Further behavioural experiments are required to disentangle between the different
strategies and their potential interaction. Building on the work of8 , the different hypothesis could be placed into conflict by
creating a point-symmetric OF around the gap center (leading to centering), a brightest point away from the gap center, and a
minimum OF away from the center (e.g. by using an OF amplitude following a Mexican hat function of the radius from the
geometric center).
    Our model shares several similarities with the neural correlate of visually-guided behaviour in insects, including motion-
sensitive neurons18 , an integration of direction70 , efference copy to motion-sensitive neurons71 , and neurons controlling
the saccade amplitude65 . Our agent was able to adopt an active gaze strategy thanks to a saccadic suppression mechanism
(due to an inhibitory efference copy from the motor neurons to the inverse WTA and motion-sensitive neurons). When the
inverse WTA layer did not "find" a collision-free path (i.e. a solution to the gap finding task), an alternative response (here a
U-turn) was triggered thanks to global inhibitory neurons and excitatory-inhibitory networks (GI-WTA-ET, for more details see
Section Collision Avoidance Network). The neuronal correlate of such a switch, to our knowledge, has not been described in
flying insects. Our model, thus, serves as a working hypothesis for such a neuronal correlate. Furthermore, by varying the
connection between sEMD-inverse WTA, we could allow the agent to cross smaller gaps. We hypothesise that differences in
clearance or centering behaviour observed between insect species8, 20 could be due to different wiring or modulation between
motion-sensitivity neurons and direction selection layer, likely located in the central complex.
    In this study we demonstrated a system-level analysis of a distributed, parallel and asynchronous neural algorithm to
enable neuromorphic hardware to perform insect-inspired collision avoidance. To perform a wide variety of biological-relevant
behaviour the network comprised approximately 4k neurons and 300k synapses. The agent guided by the algorithm robustly
avoided collision in a variety of situations and environments, from centering in a tunnel to crossing densely cluttered terrain and
even gap finding, solved by flying insects. These behaviour were accomplished with a single set of parameters, which have not
been optimised for any of those. From the investigation of the agent and its underlying behaviour, we hypothesise that insects
control their flight by identifying regions of low apparent motion, and that excitatory-inhibitory neural structures drive switches
between different behaviours. With these investigations we hope to advance our understanding of closed-loop artificial neural
computation and start to bridge the gap between biological intelligence and its neuromorphic aspiration.

                                                                                                                               7/26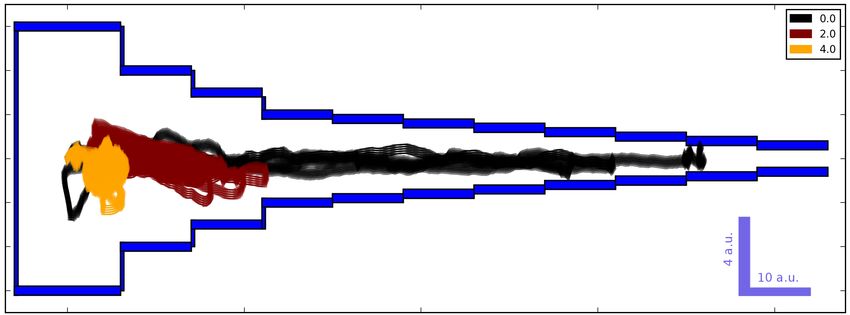
4 Methods
Most experiments in this article were conducted in simulation using either the Nest spiking neural network (SNN) simulator55
or the Neurorobotics Platform environment53 . A corridor centering experiment was conducted in a real-world corridor centering
experiment using a robotic platform equipped with the embedded Dynamic Vision Sensor7 as visual input and a SpiNN-563
board for SNN simulation in computational real-time. Sensory data for the sEMD characterisation were recorded with an
event-based camera in a real world environment. The hardware, software, SNN models and methodologies used in this article
are explained in the following.

4.1 Spiking Neural Networks
In contrast to conventional processing as postulated by von Neumann72 which is characterised by synchronous and inherently
sequential processing, neural networks, whether rate-based or spike-based, feature parallel and distributed processing. Artificial
neural networks, the rate-based counterpart of SNNs, perform synchronous and clock-driven processing, SNNs, additionally,
feature an asynchronous and event-driven processing style. SNNs represent a promising alternative to conventional von Neu-
mann processing and hence computing which potentially feature low-latency, low-power, distributed and parallel computation.
Neuromorphic hardware present a solution to the aforementioned limitations of conventional von Neumann architectures
including parallel, distributed processing73 in the absence of a central clock74, 75 , as well as co-localisation of memory and
computation76, 77 . Moreover, neuromorphic processors benefit from the underlying algorithm to be implemented in a SNN.
Emulating a SNN on a neuromorphic processor (especially a mixed-signal one) enables the network to operate in continuous
time8 as time represents itself74 . SNNs consist of massively parallel connected networks of artificial synapses and spiking
neurons78 . SNNs, as any processing algorithm, aim to structure and represent incoming information (e.g. measurements) in a
stable, robust and compressed manner (e.g. memory). Measurements sampled at fixed time intervals have the disadvantage
that collected data is highly redundant and prone to aliasing if the signal of interest varies faster than half the sampling
frequency. Event-driven approaches to sampling alleviate these limitations. As incoming measurements shouldn’t be sampled
at fixed temporal intervals, they need to be taken based on fixed or relative amplitude changes to take full advantage of the
time-continuous nature of SNNs and neuromorphic hardware. Such measurements can be obtained from different sensory
domains (e.g. touch79 , smell80 , auditory81, 82 and vision83, 84 ), with vision being the most studied and well understood sensory
pathway (but see85 for a critical review) both in the brain and its artificial aspiration. While images taken with conventional
cameras can be converted to spike trains which are proportional to the pixel intensity9 , event-based cameras directly sample
only relative changes of log intensity and transmit events. A variety of event-based cameras have been proposed in the last
two decades25, 26, 84 that all feature an asynchronous, parallel sampling scheme10 in which changes are reported at the time of
occurrence in complete time-continuous manner. The output of event-based cameras is hence ideally suited to be processed by
an SNN implemented on a neuromorphic processor. We collected real-world data using the DVS128 event-based camera26
to characterise the sEMD response (see Figure 1e). The event-based camera comprises 128×128 independently operating
pixels which respond to relative changes in log-intensity, i.e. in temporal contrast. When the change in light intensity exceeds
an adaptive threshold the corresponding pixel produces an event. The address and polarity of the pixel are communicated
through an Asynchronous Event Representation bus83 . Light increments lead to ON-events, whereas light decrements lead
to OFF-events. The sensor reaches a dynamic range of more than 120 dB and is highly invariant to the absolute level of
illumination due to the logarithmic nature of the switched-capacitor differencing circuit26, 84 .

4.2 Spiking Elementary Motion Detector
In 2018 we proposed a new insect-inspired building block for motion vision in the framework of SNNs designed to operate on
the out event-stream of event-based cameras, the sEMD39 . The sEMD is inspired by the computation of apparent motion, i.e.
optic flow (OF), in flying insects. In contrast to its correlation-based role model the sEMD is spike-based. It translates the
time-to-travel of a spatio-temporally correlated pair of events into direction dependent, output burst of spikes. While the sEMD
provides OF estimates with higher precision when the entire burst is considered (rate-code), the interspike interval distribution
(temporal-code) within the burst provides low-latency estimates. The sEMD consists of two building blocks, a retina to extract
visual information from the environment, and the TDE which translates the temporal difference into output spikes (see Figure
3a). When the sEMD receives an input spike at its facilitatory pathway an exponentially decreasing gain variable is generated.
   7 The embedded Dynamic Vision Sensor follows the same operational principles of event-based cameras as described in Section Event-Based Cameras in

Gazebo but features a much more compact design
   8 A time-continuous mode of operation, in contrast to a time-varying one, is characterised by the absence of a fixed sampling frequency
   9 To perform this conversion one can use a different encoding schemes including rank-order code86 , timing-code87 ,88 or Poisson rate-code.
  10 Level sampling means that a given time-continuous signal is sampled when the level changes by fixed (relative) amount ε, whereas time sampling, i.e.

Nyquist-Shannon sampling, means that the signal is sampled when the time has changed by fixed amount ε

                                                                                                                                                   8/26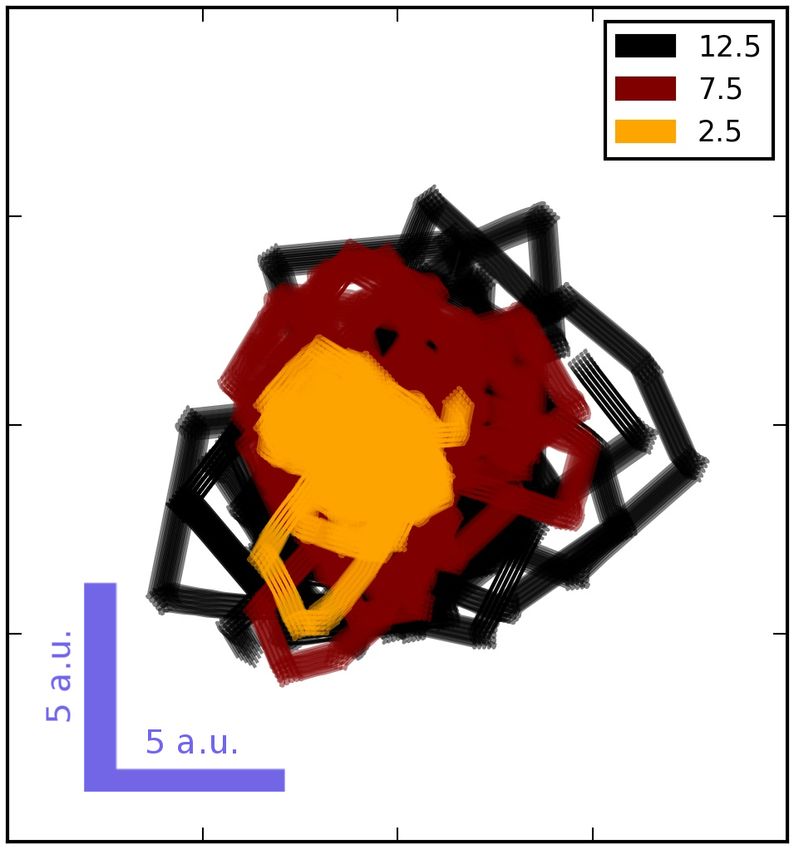
The magnitude of the synaptic gain variable during the arrival of a spike at the trigger synapse defines the amplitude of the
excitatory post-synaptic current generated. This current integrates onto the sEMD’s membrane potential which generates a
short burst of output spikes. Therefore, the number of output spikes encodes direction sensitive and anti-proportionally the
stimulus’ time-to-travel (see Figure 3e) between two adjacent input pixels. We implemented and evaluated the motion detector
model in various software applications (Brian2, Nengo, Nest), in neuromorphic digital hardware (SpiNNaker, Loihi) and also
as analog CMOS circuit39, 58 .

Figure 3. Spiking Elementary Motion Detector model adapted from89 . a) sEMD model consisting of visual input and TDE
unit. Two adjacent retina inputs are connected to the facilitatory synapse (fac) and the trigger synapse (trig). The fac synapse
controls the gain of the trig synapse postsynaptic current (epsc) which integrates onto the Leaky Integrate and Fire (LIF)
neuron’s membrane potential which produces output spikes (out). b) model behaviour for small positive ∆t. c) behaviour for
large positive ∆t. d) behaviour for negative ∆t. e) number of output spikes over ∆t.

4.3 Collision Avoidance Network
The collision avoidance network (see Figure 4) extracts a collision-free direction from its sEMD outputs and translates this
spatial information into a steering command towards open space. The first layer, the event-based camera, generates an event
when a relative change in log-illumination, i.e. temporal contrast, is perceived by a pixel. A macropixel consists of 2 x 2
event-based camera pixels. Each macropixel projects onto a single current-based exponential LIF neuron (hereafter referred to
as LIF for sake of clarity) in the Spatio-Temporal Correlation (SPTC) layer (in Nest the neuron model used throughout this study
is called iaf_psc_exp). Each single SPTC neuron emits a spike only when more than 50% of the pixels within a macropixel
elicit an event within a rolling window of 20 ms. Therefore, the SPTC population removes uncorrelated events, which can be
interpreted as noise. Additionally, it decreases the network resolution from 128 times 40 pixels to 64 times 20 neurons. The
next layer extracts OF information from the filtered visual stimulus. It consists of two TDE populations sensitive to the two
horizontal cardinal directions respectively. Each TDE receives facilitatory input from its adjacent SPTC neuron and trigger input
from its corresponding SPTC neuron. The facilitatory input might arise either from the left (left-right population) or from the
right (right-left population). The TDE output encodes the OF as number of spikes in a two-dimensional retinotopical map. Since
the agent moves on the ground it only estimates the amount of horizontal OF. Hence, the subsequent INT population integrates
the spikes of each TDE column in a single LIF neuron. This layer encodes the OF in a one-dimensional retinotopical map. The
subsequent population, an inverse soft Winner-Take-All (WTA) determines the agent’s movement direction, a minimum of OF
in the one-dimensional retinotopical map. Since OF encodes the relative distance to objects during a translational movement
this direction represents an object-free pathway, hence the inverse Winner-Take-All (WTA) is inverted by sending feed-forward
inhibition into the neural population. A population of POIS injects Poisson distributed background spikes which ensures a
neuron within the inverse WTA to win at any moment in time even in the absence of OF. In the absence of INT input the
inverse WTA neuron with the strongest POIS input wins and suppresses through the GI neuron the activity of all others. Local
lateral connections in the inverse WTA population strengthen the winning neuron due to excitatory feedback (For the sake of
clarity recurrent excitation is not shown in Figure 4).

                                                                                                                            9/26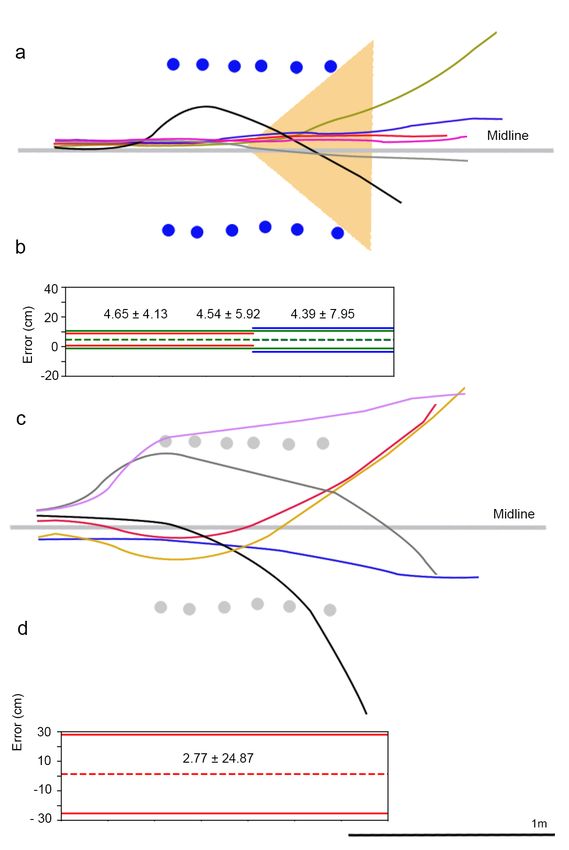
Because of the consistently changing nature of the
POIS spike trains the winner changes frequently and the
agent executes a random walk (see Figure 2a). When the
agent approaches an object the position of the obstacle
is indicated by a number of spikes in the INT popula-
tion. These spikes strongly inhibit the inverse WTA at the
corresponding position and its closest neighbours so that
this inverse WTA direction cannot win. Therefore, the
active neurons in the inverse WTA always represent an
obstacle-free direction. In case no object-free direction
has been found for ~700 milliseconds since the start of
an intersaccade the ET neuron emits a spike. This neu-
ron is only weakly excited by the POIS population and
connected to the GI neuron similarly to the inverse WTA
population. Only when the ET has not been inhibited
for a long time, hence the inverse WTA was not able
to generate a spike due to strong over all inhibition, the
ET neuron wins. The final layer called MOT population
translates the inverse WTA population and ET neuron ac-
tivity into a turn direction and duration using pulse-width
modulation to control the motors. The left turn MOT
population becomes activated by inverse WTA neurons
on the left side and the right turn population by inverse
WTA neurons on the right side. Since the turning velocity
is always constant the angle of rotation is defined by the
duration of the turn. This duration of the excitation wave
in the MOT population relates proportionally to the dis-
tance of the inverse WTA neuron from the center of the
horizontal visual field. The duration saturates for neuron     Figure 4. Collision avoidance network. The macropixels (2x2
distances higher than nine. Since a left turn and a right      pixels) of the Event-Based Camera (EBC) project onto single
turn are exclusive events, strong inhibition between the       neurons of the Spatio-Temporal Correlation (SPTC) population
two MOT populations assures to disambiguate the MOT            removing uncorrelated noise. Two adjacent SPTC neurons are
layer outputs. In case the ET neuron emits a spike the         connected to one Time Difference Encoder (TDE) in the left-right
excitation wave passes through most neurons of the left        sub-population and the right-left sub-population respectively.
MOT population. Hence, the turning duration is slightly        Trigger and facilitator connection are opposite in the two
higher than for any turn induced by the inverse WTA            populations. The Integrator (INT) population reduces the two
population. The agent turns completely away from the           dimensional retinotopical map to a one-dimensional map by
faced scene since no collision free path was found in that     integrating the spikes of each TDE column onto a single LIF
direction. During the execution of a turn the gap finding      neuron. The inverse Winner-Take-All (WTA) population and
network receives mainly rotational OF. This type of ap-        Escape Turn (ET) population become excited by Poisson spike
parent motion does not contain any depth information and       sources. The winner-take-all mechanism is driven by recurrent
therefore no new movement direction should be chosen           suppression through the Global Inhibition (GI) neuron. The two
during or shortly after a turn. Because of that the MOT        Motor (MOT) populations are activated by a spike in the inverse
layer strongly inhibits the inverse WTA and SPTC popu-         WTA population. The id of the spiking inverse WTA neuron
lations as well as the ET neuron. After a turn has finished    defines which MOT becomes activated and for how long. When
and none of the MOT populations is spiking anymore the         the ET neuron spikes the left MOT population becomes activated
agent moves purely translatory. The movement speed             for the maximal time duration. When the MOT population is
during this phase vints is defined in equation 1 where f¯OFI   inactive the robot moves straight foward collecting apparent
is the mean firing rate of the OFI population. During          motion information. When one MOT population is active the
this movement phase, called intersaccade, the agent inte-      robot turns. All-to-all inhibition between the MOT
grates translational OF information in its INT population.     sub-populations guarantees the dis-ambiguity of the steering
The inverse WTA population slowly depolarizes from its         commands. Inhibition from the MOT to the SPTC population
strongly inhibited state and releases a spike indicating the   suppresses rotational OF input which contains no relative depth
new movement direction. This spike triggers the next sac-      information. Inhibition from MOT to inverse WTA hinders the
cadic turn of the robot while the id of the winning neuron     network from taking any new decision during a turn.

                                                                                                                         10/26
defines the direction and duration of the movement.
m
vints ( ) = 1 − f¯OFI × 0.001 (1)
s
4.4 Neurorobotics Platform
To perform our behavioural experiments we decided to simulate the entire system, from visual input to actions, using the
Neurorobotics Platform. This platform combines simulated SNNs with physical realistic robot models in a simulated 3D
environment53 . The platform consists of three main parts, the world simulator Gazebo, the SNN simulator Nest and the Transfer
Function Manager Brain Interface and Body Integrator (BIBI). The BIBI middleware consists of a set of transfer functions
which enables the communication between Gazebo and NEST via Robot Operating System (ROS)90 and PyNN adapters.
The Closed Loop Engine (CLE) synchronizes the two simulators Gazebo and Nest and controls the data exchange through
transfer functions. The simulation front-end virtual coach is useful to control the whole simulation procedure through a single
python script. Furthermore, the State Machines Manager of the SMACH framework can be used to write State Machines which
manipulate the robot or world environment during the experiment.
4.5 Real World Robot
The robot receives visual input from the embedded Dynamic Vision Sensor with a 60 degrees lens. The event-based camera
sends its events to a SpiNN-5 board which simulates a simplified version of the collision avoidance network decribed in the
section Collision Avoidance Network. The robot’s visual field consists of 128x128 pixels which project onto 32x32 SPTCs.
The robot computes ON-event and OFF-events in two separate pathways from the retina until the sEMDs. The INT layer
integrates the spikes of the ON- and OFF-pathway in a single population. The network does not contain any OFI neuron and
the agent moves with a constant velocity of around 0.5 m/s. There are also no MOT populations and no ET population. The
inhibition from the MOT population to the SPTC population is replaced by inhibition from inverse WTA to SPTC. The motor
control is regulated on an Odroid mini-computer. The computer receives inverse WTA spikes from the SpiNN-3 board via
Ethernet and translates these spikes into a motor command which is then send via USB to the motor controller. This causes a
long delay between perception and action. The motor controller drives the six-wheeled robot in a differential manner.
4.6 Event-Based Cameras in Gazebo
Kaiser et al. 201691 developed a Neurorobotics Platform implementation of an event-based camera based on the world simulator
Gazebo. This model samples the environment with a fixed update rate and produces an event when the brightness change
between old and new frame exceeds a threshold. We used this camera model in our closed-loop simulations as visual input
to the collision avoidance network. Even though Gazebo produces an event-stream from regularly sampled synchronous
frame-difference, our sEMD characterisation and open-loop experiments (see Section sEMD characterisation and39 ) confirmed
the working principle of the motion detector model with real-world event-based camera data. We could further demonstrate the
real-world fully-neuromorphic applicability in closed-loop of most parts of the simulated agent including the apparent motion
computation by the sEMDs and the saccadic suppression92 . We set the resolution of the Gazebo event-based camera model to
128 times 40 pixels. The reduction of the vertical resolution from 128 to 40 pixels was done to speed up the simulation time
and to make the model fit onto a SpiNN-3 board63 . To further accelerate the simulation we limited the number of events per
update-cycle to 1000 and set the refresh rate to 200 Hz. Therefore, the sEMD can only detect time differences with a resolution
of 5 ms. We decided for a large horizontal visual angle of 140 degrees so that the robot does not crash into unforeseen objects
after a strong turn. At the same time the uniform distribution of 128 pixels over a 140 degrees horizontal visual field leads to an
inter-pixel angle of approximately 1.1 degrees. This visual acuity lies in a biologically plausible range of inter-ommatidial
angles measured in Diptera and Hymneoptera which varies between 0.4 and 5.8 degrees93 .
4.7 Driving Agent
We designed a four-wheeled simulated robot Gazebo model. The robot’s dimensions are 20 × 20 × 10 cm and it is equipped
with an event-based camera (see Section Event-Based Cameras in Gazebo) and the husky differential motor controller plugin.
The BIBI53 connects the robot with the collision avoidance network implemented in NEST (see Section Collision Avoidance
Network). The connections consist of one transfer function from the vision sensor to the SPTC population and another one from
the MOT population to the differential motor controller as well as two Poisson input spike sources. The first transfer function
sends visual input events. The second transfer function controls the agent’s insect-inspired movement pattern. During inactivity
of the MOT populations the robot drives purely translatory with a maximum speed of 2.5 a.u/s. The movement velocity changes
anti-proportionally to the environment’s obstacle density as explained in the section Densely Cluttered Environments. When
one of the two MOT populations spikes the robot fixes its forward velocity to 0.38 a.u/s and turns either to the left or to the
11/26right with an angular velocity of 4 ◦ /s. The two Poisson spike source populations send spikes with a medium spike rate of 100
Hz to the inverse, soft WTA population and the ET neuron (For more details see Table 5 and Table 4).
4.8 sEMD characterisation
For the sEMD characterisation we stimulated an event-based camera with a 79° lens (see Section Event-Based Cameras in
Gazebo) using square-wave gratings with a wavelength of 20° and various constant velocities (from 0.1 to 10 Hz). These
recordings were performed in a controlled environment containing an event-based camera, an LED light ring and a moving
screen which projects exchangeable stimuli (see Figure A.1). The controllable light ring illuminates the screen. The camera’s
lens is positioned in the light ring’s centre to ensure a homogeneous illumination of the pattern. The screen itself is moved by
an Arduino controlled motor. During recordings, the box can be closed and thus be isolated from interfering light sources. The
contrast refers to absolute grey-scale values printed on white paper to form the screen. However, given the printed contrast we
calculated the Michelson contrast as follows:
Imax − Imin Imax − Imax (1 −C printed ) C printed
= = (2)
Imax + Imin Imax + Imax (1 −C printed ) 2 −C printed
To show the model’s robustness to a wide range of environments, we varied the following three parameters in the recordings:
The illumination, the grating velocity and the grating’s contrast (see Table 1). Each possible parameter combination was
recorded three times, with a recording duration of four seconds, to allow statistical evaluation of the results. The event-based
camera was biased for slow velocities.
The model (see Figure 4 the first three populations) was simulated in Nest with the connections and neuron parameters
defined in Table 5 and Table 4 respectively. The network was simulated for four seconds, receiving the events as emitted by the
event-based camera as spike-source array input. To define a response to the various stimuli, from the simulation results, the
mean population activity of the preferred direction and null direction population were calculated (see Figure 1e). For the closest
comparability to the biologically imposed environment parameters, we chose to compare and discuss the sEMD’s velocity
tuning curve for a grating contrast of 100 % and an illumination of 5000 lux.
4.9 Closed-loop simulation in environments
Five different environments were designed to evaluate the agent’s performance, a cluttered environment with randomly
distributed obstacles sizing 1 × 1 m, an environment with two arenas connected by two gaps of variable size, a tunnel with
varying width, an empty box environment and a narrowing tunnel. No obstacles were placed in a radius of two meters around
the agent’s start point so that the system can reach a stable state of activity before confronted with the first object. At obstacle
densities higher than 35 percent the agent stays at its start point since no obstacle free direction can be detected anymore.
Therefore, we limited the tested obstacle density range to 0 up to 38 percent. All obstacles placed in the environment including
walls were covered with vertical black-and-white square-wave-gratings.
A state-machine was written within the Neurorobotics Platform environment to automatise the experiments. The state-machine
consists of eight states as shown in Figure 5
Figure 5. State machine to create the cluttered environment and check the agent’s collision avoidance performance.
Additionally, a virtual coach script was composed which starts and stops the single runs in a for-loop. After creating
the simulation environment the virtual coach script starts the simulation for 10 seconds so that the state machine becomes
12/26You can also read