Mercury in Europe's environment - A priority for European and global action - European Environment Agency
←
→
Page content transcription
If your browser does not render page correctly, please read the page content below
1977-8449

                                           EEA Report No 11/2018

18

     Mercury in Europe’s environment
               A priority for European and global action

                                                                   1
Cover design: Formato Verde
    Layout: Formato Verde

    Legal notice
    The contents of this publication do not necessarily reflect the official opinions of
    the European Commission or other institutions of the European Union. Neither
    the European Environment Agency nor any person or company acting on behalf
    of the Agency is responsible for the use that may be made of the information
    contained in this report.

    Copyright notice
    © EEA, Copenhagen, 2018
    Reproduction is authorised, provided the source is acknowledged, save where
    otherwise stated.

    Luxembourg: Publications Office of the European Union, 2018

    ISBN: 978-92-9213-984-1
    ISSN: 1977-8449
    doi: 10.2800/558803

    Environmental production
    This publication is printed according to high environmental standards.

    Printed by Rosendahls-Schultz Grafisk
    — Environmental Management Certificate: DS/EN ISO 14001: 2004
    — Quality Certificate: DS/EN ISO 9001: 2008
    — EMAS Registration. Licence no. DK – 000235
    — Ecolabelling with the Nordic Swan, licence no. 541-457
    — FSC Certificate – licence code FSC C0688122

    Paper
    Cocoon Offset — 100 gsm.
    Cocoon Offset — 250 gsm.

    Printed in Denmark

    You can reach us

    On the EEA website: www.eea.europa.eu
    On Facebook: www.facebook.com/European.Environment.Agency
    On Twitter: @EUenvironment
    Order your free copy at the EU Bookshop: www.bookshop.europa.eu

2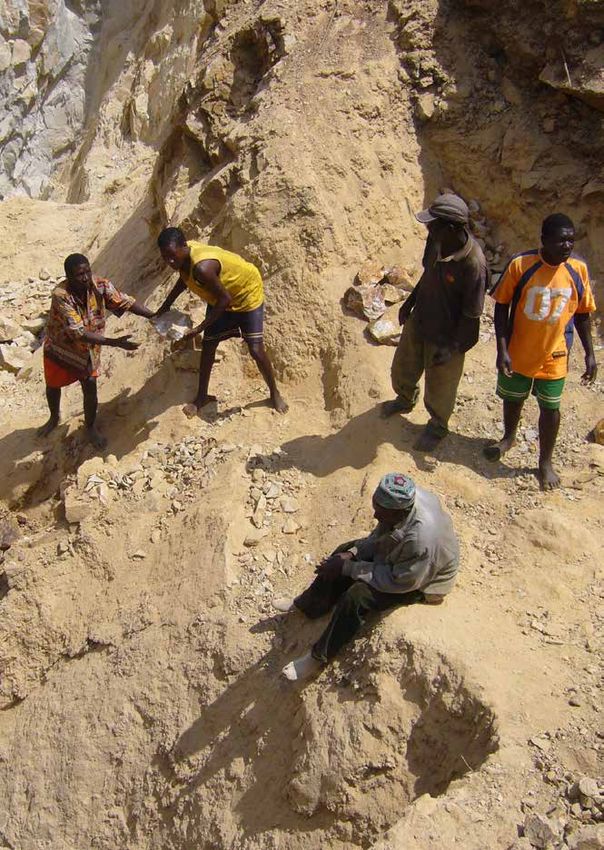
Contents
Acknowledgements 5
Summary 7
About mercury 9
What is mercury? 9
The fate of mercury in the environment 9
The environmental behaviour and impacts of mercury 17
Mercury’s behaviour in the environment 17
Human exposure and diet 24
The behaviour and impacts of mercury in the
human body 29
Production and use of mercury 33
Where does mercury come from? 33
The current global uses of mercury 36
Current uses of mercury in the EU 41
The outlook for EU and global mercury use 42
Mercury emissions — Trends and outlook 45
The main potential sources of mercury emissions 45
Current global mercury emissions to air 47
The outlook for global mercury emissions to air 49
Current European mercury emissions to air 50
The outlook for European mercury emissions to air 53
Mercury in water — Current European and
global status 53
Mercury in water — The European and
global outlooks 56
What is being done in Europe and globally? 59
Global actions — The Minamata Convention
on Mercury 59
EU actions 61
Local actions — What can I do? 62
References 67
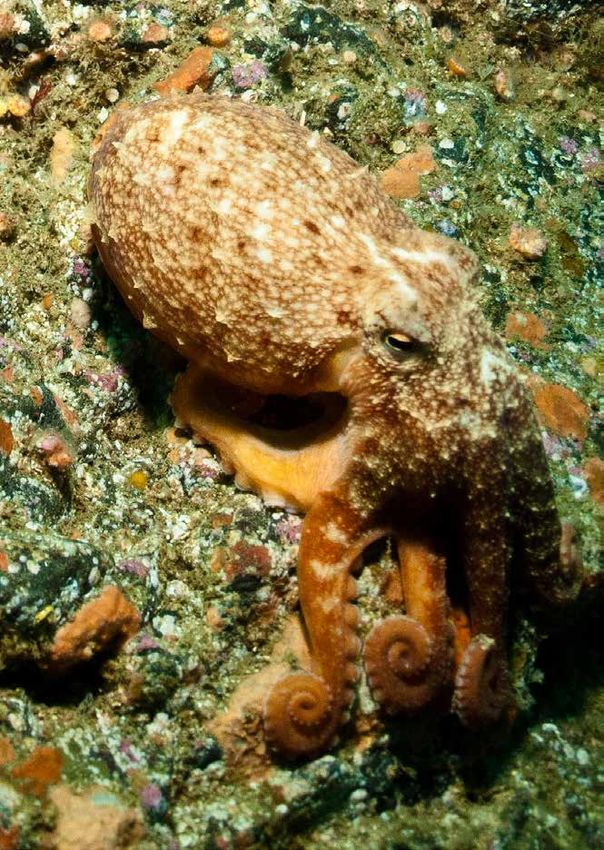
© Tavo Romann/ Wikimedia Commons 3
4 © Tamas Parkanyi, ImaginAIR /EEA

Acknowledgements

The original technical report underpinning     •   Per Kalvig, Geological Survey of
this publication was commissioned by               Denmark and Greenland
the EEA and prepared by a consortium           •   Niels Fold, Copenhagen University
of Trinomics and TNO consultants:              •   Jesper Bosse Jønsson, COWI Tanzania
Jeroen Kuenen, Carlijn Hendriks, Antoon        •   Line Evald Kirk, University of
Visschedijk (TNO); Tycho Smit, Jurgen              Southern Denmark
Vermeulen (Trinomics).                         •   Greet Schoeters, VITO
                                               •   Sofie Nørager, Directorate-General for
The EEA project manager and author of this         Research and Innovation
report was Ian Marnane.                        •   Nicola Pirrone, CNR — Institute of
                                                   Atmospheric Pollution Research
The following people are thanked for their     •   staff from the EEA and from
input during the preparation of this report:       the European Commission
                                                   (Directorate‑General for Environment)
•   Phillipe Grandjean, Harvard School         •   national experts who provided feedback
    of Public Health and University of             on the draft report circulated through
    Southern Denmark                               Eionet — the European Environment
•   Petra Hagström, Swedish Environmental          Information and Observation Network.
    Protection Agency

                                                                                            5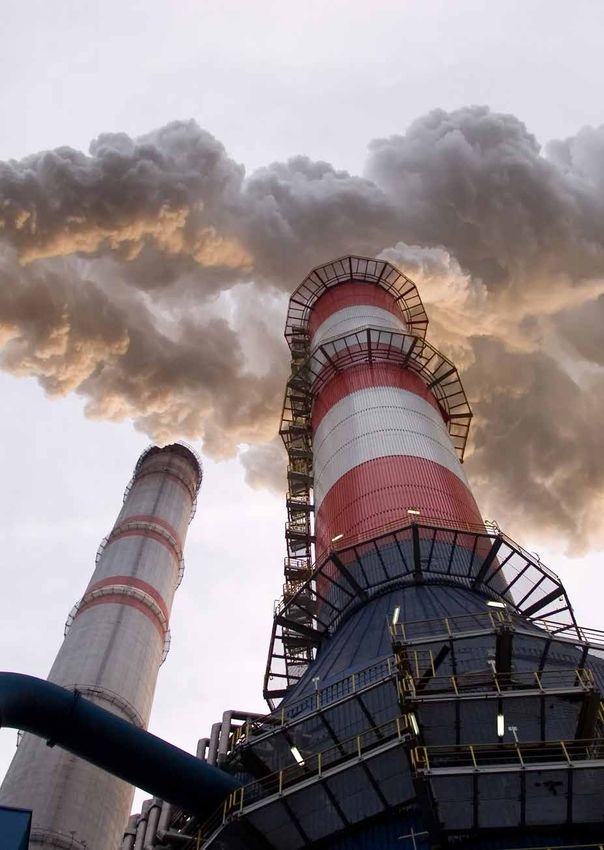
6 © Hari Subash, Picture2050 /EEA

Summary

Mercury presents a significant risk to both the global environment and human health. While
mercury has been mined and used by humans for thousands of years, only in more recent
decades have the risks it poses been fully understood. Mercury’s properties mean that
once it is released into the environment it can remain in circulation for thousands of years.
Furthermore, once in the air it can travel long distances, meaning that emissions have a
global impact. This movement is known as the ‘global mercury cycle’. Over hundreds of years,
the quantities of mercury in this cycle have increased as a result of activities such as gold
mining, fossil fuel burning and industry.

Mercury in rivers, lakes and oceans presents       a consistent, global approach to reducing
the biggest risk, as this is converted into a      use, releases and impacts of mercury. Nearly
particularly toxic form called methylmercury,      130 parties have now signed the Convention.
which is easily absorbed by animals and            However, even with immediate global actions,
moves up the food chain until it reaches           it will take a very long time for mercury in the
humans. This is the main way in which              environment to decline to pre-industrial levels.
humans are exposed to mercury.
                                                   European legislation on mercury is already
Historically, Europe’s mercury use and             more stringent than the requirements of the
emissions have been high. However, recent          Convention, and will contribute to minimising
decades have seen measures taken to                the impacts of mercury. Individual actions can
minimise these through, for example, limiting      also be taken to minimise personal exposure
or banning the use of mercury and imposing         and to support European legislation, for
limits on emissions. Unfortunately, on a           example, being aware of national food safety
global scale emissions have been increasing        advice on fish consumption, and responsibly
from activities such as coal burning and gold      managing mercury containing wastes such as
mining. These emissions have an impact on          lamps and batteries.
the European environment because of the
global nature of mercury pollution: around         This EEA report aims to increase
50 % of the anthropogenic mercury deposited        understanding and knowledge of global
annually in Europe originates from outside         mercury pollution among both policymakers
Europe, with 30 % originating from Asia alone.     and the general public. The report provides
                                                   background information and context, before
Concerted international action is required to      setting out the current status of global
address mercury pollution. The Minamata            and European mercury pollution and the
Convention on Mercury is intended to bring         challenges that remain in addressing this
about some of the necessary changes through        global issue.

                                                                                                      7
8 © Wikimedia Commons
About mercury

Although mercury is a useful raw material, it is also highly toxic to both humans and the
wider environment. The various human uses of mercury have resulted in large quantities
being released into the environment. Once mercury is released it can circulate in the
environment for up to 3 000 years in a process known as the ‘global mercury cycle’.

What is mercury?                                     widely used today. It is this anthropogenic
                                                     (i.e. originating in human activity) use of
Mercury is a naturally occurring element that        mercury that has resulted in the global release
is present in the Earth’s crust. It is the only      of large amounts into the air, into oceans and
metal that is liquid at room temperature and,        onto land. Once mercury is freely available in
because of this, it is also known as ‘quicksilver’   this manner, it presents a significant risk to
and by the Latin term hydrargyrum, which             human health and the environment.
means ‘water silver’. In the periodic table it is
represented by the symbol Hg.                        While the risks associated with localised,
                                                     personal mercury exposure have been
When people think of mercury, they tend              known or suspected for a very long time, it
to think of its pure, elemental, silver liquid       is only in the last 60 years that the global
form. However, in nature it is rarely present        significance and scale of mercury pollution
in this form and is more generally found in          caused by humans has been understood.
compounds such as cinnabar, a red mineral            This has come about as scientists have
that also contains sulphur. Cinnabar was             learned more about how mercury behaves
commonly used as a pigment (vermillion)              in our environment, unearthing the
and is the main ore that is mined, even              damaging legacy created by centuries of
today, to produce elemental mercury. These           man-made emissions. It is estimated that,
naturally occurring forms do not present             over the past 500 years, human activity
a significant environmental risk, as the             has resulted in the release of between
mercury content is not freely distributed or         1 and 3 million tonnes of mercury into the
mobile in the environment.                           environment (Streets et al., 2017).

The fate of mercury in the                           Scientists now understand that mercury
environment                                          circulates in the environment for as long as
                                                     3 000 years (Selin, 2009) and that it moves
Mercury’s unique properties make it highly           through water, air and land continuously,
versatile; over millennia it has been used           following what is known as the global
for many different purposes, and it is still         mercury cycle. For example, it may initially

                                                                                                       9
be released into air and then deposited in        The global cycling of mercury effectively
     water. Eventually it will be ‘re-released’ from   means that, even if anthropogenic sources
     the water into the air and then travel long       stopped today, it would take many centuries
     distances before being re-deposited onto          for mercury levels in the environment to
     land or in water, where the cycle starts again.   reduce significantly.

      Types of mercury

      To understand the environmental flows of mercury, and the processes involved, it is
      important to know that mercury is found in the environment in three main forms, which
      are not equally harmful.

      •   Organic mercury. The most potentially harmful form of mercury is the highly toxic
          methylmercury, the most common organic form in the environment. It is found mainly
          in inland waters and the marine environment, where mercury entering the water
          is converted to methylmercury by bacterial action. Living organisms such as ocean
          plankton can easily absorb methylmercury, removing it from the aquatic system, but
          unfortunately this introduces it into the food web, where it can find its way into food
          consumed by humans and animals.
      •   Elemental mercury. This is mercury in its pure form, which is commonly used in
          human activities. If it is not contained, mercury slowly evaporates into the air, forming
          a vapour. It can remain in the atmosphere for around one and a half years and it can
          travel long distances. Elemental mercury can eventually react in the atmosphere to
          form inorganic mercury, which is then typically deposited on land or in water.
      •   Inorganic mercury. Inorganic mercury compounds are formed when mercury
          combines with inorganic elements, examples being mercury sulphide (HgS) and
          mercury oxide (HgO). Most of these are coloured powders or crystals. They tend to
          stay in the atmosphere for a shorter time than elemental mercury because they are
          more soluble in rainwater and more reactive.

10
© Cimon Linington, NATURE@work /EEA 11
The global mercury cycle

                                                   Anthropogenic                                  Anthropogenic
                                                    and natural                                    and natural
                                                      evasion                                        evasion

       Anthropogenic
         emissions

                                                  Local and      Global                     Global
                                                   regional    terrestrial                 marine
                                                  deposition   deposition                 deposition

              Erosion/
              Flooding

12   Note: Evasion refers to the process of re-emission of gaseous mercury from surfaces such as soil and water.
Volcano
Forest fire
Waste water discharge
1314 © Francesco Gola, Picture2050 /EEA
Mercury in Sweden

In the early 1950s, Swedish scientists noted that the population of seed-eating birds had
decreased, with very high levels of mercury found in the bodies of those that had died.
In the early 1960s, predatory birds and fish were also found to have very high levels of
mercury in their systems. Several factors contributed to this contamination, including local
pollution sources such as paper manufacturing and agricultural activities (e.g. treating
seeds with mercury-based dressings to prevent seed-borne diseases in crops), in addition
to the impact of mercury from Europe and globally (Egan, 2012).

Sweden has since taken a series of innovative steps to address mercury pollution, including
developing a national strategy to reduce emissions and effectively banning mercury in
products and services such as dentistry (Naturvardsverket, 2013).

The latest river monitoring in Sweden indicates that more than 23 000 water bodies are still
affected by mercury pollution (EEA, 2018) and fish in thousands of rivers and lakes have
mercury levels that necessitate issuing health advisory guidelines for fishermen and consumers.

Unfortunately, reduced emissions in Sweden have been offset by increased emissions
globally. Most of the mercury now having an impact on Sweden comes from outside
Europe (88 %), with only 1 % estimated to be generated in the country (EMEP, 2016).

Sweden is not unique in being affected in this way, as mercury is a problem in every
country in the world. However, it has been at the forefront of identifying, promoting and
managing this issue.

 Origin of mercury deposited in Sweden in 2014

                                          1%3%
                                        8%

                                                                    88 %

              Global (Non-EU)      Rest of Europe        Sweden   Natural sources and resuspended

 Source: Provided by Swedish EPA, based on EMEP, 2016.                                              15
16 © Kieran Boyce
The environmental behaviour
and impacts of mercury

Mercury released into the environment results in the exposure of animals, humans and the
wider environment. Methylmercury in water is the key concern, as this accumulates in, and
harms, marine life. Mercury in marine life subsequently results in human exposure through
consuming seafood, the primary means of exposure for people in Europe. In humans,
mercury has an impact on the nervous system and presents a particular and significant risk
to the neurological development of babies in the womb, as well as young children.

Mercury’s behaviour in the                       future it will re-enter the ocean (or be deposited
environment                                      on land). As mercury’s removal from water is
                                                 much slower than that from the atmosphere,
The atmosphere is the main ‘vehicle’ by          reductions in atmospheric emissions will not be
which mercury is transported around the          reflected in concentrations in oceans for many
globe and deposited on land and in water.        years (UNEP, 2013).
Mercury in the atmosphere and in soil does
not pose a significant direct risk to human      It is estimated that up to 350 000 tonnes
or animal health. The water environment is       of mercury is stored in oceans worldwide,
more important because it acts as a longer       around 60 times more than the total amount
term store of mercury and, more significantly,   stored in the atmosphere (Sunderland
mercury in the aquatic environment is            and Mason, 2007). About two thirds of the
converted into methylmercury.                    mercury in oceans is the result of releases
                                                 from human activities (Lamborg et al., 2013).
The lifetime of mercury in the upper ocean is
estimated to be 30 years, while in the deeper    Mercury deposited on land can also enter
ocean it will remain for centuries. This means   the food web, an example being the
that mercury released from human activities      consumption of rice or rice products grown
hundreds of years ago is still in the oceans     in mercury‑contaminated soils. Because rice
now. Mercury present in shallower waters is      tends to be grown in water, methylmercury
eventually released from the ocean back into     can form in this environment and be
the atmosphere, where at some point in the       absorbed by the rice (Rothenberg et al., 2014).

                                                                                                      17
Impacts of mercury on wildlife
Mercury can have a wide range of negative health effects on many animals. Toxic effects
include reduced fertility, impaired development of embryos, changes in behaviour and
negative effects on blood chemistry (NJ DEP, 2002). The extent of mercury’s impact on
animals is still poorly understood, as studies have tended to focus on human impacts.
However, more recent studies indicate that doses well below lethal levels can still
have substantial effects on animal health. One study showed that higher mercury
concentrations are associated with reduced breeding frequency in black-legged kittiwakes
(an Arctic bird species) in Svalbard, Norway (Tartu et al., 2013). This is probably because
mercury affects the levels of reproductive hormones in these birds. In fish, mercury in
the aquatic system has been found to negatively affect hatching times and the survival
rates of offspring (Bridges et al., 2016). Another study showed that in the Great Lakes
region of the United States, the population of bald eagles (a fish-eating species) is at risk
of mercury‑related brain damage (Rutkiewicz et al., 2011).
The impact of mercury on the health and well-being of animals appears to be equal to,
if not greater than, the impact on that of humans.
In aquatic ecosystems, methylmercury process called bioaccumulation. Mercury
tends to accumulate in organisms to much concentrations usually increase when
higher concentrations than those in the moving up the food web, as predatory
surrounding environment. Zooplankton animals eat prey that have already
(microscopic animals eaten by fish) accumulated mercury in their bodies. This
often contain many hundred times more process of ‘biomagnification’ within the food
methylmercury than the water in which web is well understood and it occurs with
they live. As the process of mercury a variety of pollutants, including mercury.
excretion is usually slower than the process There is also evidence that biomagnification
of uptake, mercury tends to accumulate can be more significant in colder waters
in organisms during their lifetime in a (Lavoie et al., 2013).
18The highest mercury concentrations
have been found in toothed whales,
sharks, swordfish and tuna. Limits on the
mercury content of fish for consumption
are defined to protect human health.
The maximum safe mercury content
specified is 0.5 milligrams per kilogram
for most fish species, and 1 milligram
per kilogram for some predatory species
such as tuna and swordfish (EU, 2006).
In addition, European and national food
safety authorities provide advice on fish
consumption with a view to minimising
mercury intake.
The position of a species in the food
web, for example whether it is a
predator such as a bluefin tuna or a
lower‑end species such as a sardine, is
not the only determinant of the mercury
concentrations in aquatic organisms.
Regional differences in concentrations
are also found. In Europe, the highest
concentrations tend to be found in
fish caught in the Mediterranean Sea
(Višnjevec et al., 2014). This seems to
be related to the fact that conditions in
the Mediterranean are favourable to the
generation of methylmercury (Cossa and
Coquery, 2005).
© Kieran Boyce 19Bioaccumulation of mercury within species and
biomagnification in the food web
Mercury
Build-up along an animal’s lifetime
Bioaccumulation
Biomagnification
Build-up through the food web
20© Marilena Stamouli, NATURE@work /EEA 21
Mercury concentration range in fish caught
     in the western Mediterranean

       EU limit for most fish species for                        EU limit for some predatory fish species
       human consumption 0.5 mg/kg                              for human consumption 1 mg/kg

                       0.05 0.1
     Anchovy             0.057
                       0.05 0.15
     Picarel                  0.064
                       0.05 0.05
     Sardine            0.05
                       0.05                              0.79
     Black
     seabream                   0.19
                       0.05                                      1
     Red
     porgy                           0.31
                       0.05                                             1.2
     Common
     sole                                   0.45
                       0.05                  0.53
     Comber                          0.3
                                                 0.57                                                                      3
     Dusky
     grouper                                                                                 1.6
                       0.05                      0.58
     Red
     scorpionfish                   0.22
                              0.17                                                                 1.8
     Conger                                       0.56
                       0.05                                                   1.3
     John Dory                        0.33
                       0.05                                      0.99
     European
     hake                            0.3
                          0.12                                                                                                 3.1
     Angler
     fish                                                 0.74

                 0.0                       0.5                  1.0                   1.5                 2.0            3.0

                                                                                                         mg/kg wet body weight

        Mercury concentration in fish - Mean (mg/kg wet body weight)

     Mercury concentration in fish - Bottom                                          Mercury concentration in fish - Top
     of range (mg/kg wet body weight)                                               of range (mg/kg wet body weight)

22   Source: Llull et al., 2017.
     Note: For the fish species presented above, the higher European limit of 1 mg/kg applies only to angler fish.
Evidence of mercury impacts on water quality
The EU Water Framework Directive (WFD) requires EU Member States to take action to
ensure that water bodies achieve good chemical and ecological status. Specific criteria
are used to define what constitutes ‘good status’ and countries are required to assess
compliance in water bodies.
The most recent data, provided as part of the second river basin management plan
reporting, indicate that nearly 46 000 surface water bodies in the EU (out of a total of
approximately 111 000) exceed the mercury concentration set to protect fish-eating birds
and mammals. In some countries, mercury levels measured in biota cause failures in almost
all surface water bodies (Austria, Belgium, Germany, Luxembourg, Slovenia and Sweden).
Different interpretations of mercury compliance assessments across Member States
influence the substantial variations in compliance rates between countries, this is further
explained in a recent EEA assessment report on European waters (EEA, 2018a).
Impact of mercury on European water quality
Percentage of surface water
bodies in each country failing
to meet good chemical status
under the WFD because
of mercury
0
0.5
1
6.7
17
50
95
97
100
No data
Outside coverage
0 500 1000 1500 km
Source: EEA, 2018b. Note: Map results based on WISE-SoW database including data from 22 Member States (EU-28 23
except Croatia, Denmark, Greece, Ireland, Lithuania and Slovenia).Will climate change affect levels of mercury in the environment?
The general consensus within the scientific community is that the consequences
of climate change will increase the risk presented by mercury to our environment
(Krabbenhoft and Sunderland, 2013). Flooding will result in erosion of soils and release
of mercury into the environment, while increased rainfall will cause greater deposition of
mercury from the atmosphere.
The thawing of frozen soil (permafrost) is also an important future source of mercury
emissions. Permafrost stores large amounts of mercury, which may be released if the
permafrost thaws over the next century (Schuster et al., 2018).
Other anticipated climate change impacts, such as more forest fires, will result in mercury’s
release into the atmosphere (as wood contains small amounts of mercury that are
released during burning). Most importantly, evidence suggests that climate change effects,
specifically increases in ocean temperatures, may result in increased mercury levels in
marine animals (Dijkstra et al., 2013).
Human exposure and diet do absorb mercury from inhaled air
very efficiently, but the typical mercury
The most significant route of human concentration in outdoor air is too low to be
exposure to mercury is diet. The highest harmful to our health.
blood mercury concentrations are found
in people who consume a lot of fish, such Other potential minor pathways of exposure
as those living near the coast and in Arctic include mercury-based dental fillings, as
communities who traditionally have higher well as mercury released from (broken)
fish intakes. People ingest more mercury mercury-containing products; however, the
when consuming predatory fish than when risks are not generally considered to be as
consuming smaller (younger) specimens significant as those from diet. Thimerosal, a
or species that are lower in the food web. mercury-containing organic compound, was
However, although eating fish can lead to historically used as a preservative in several
health problems from mercury exposure, human vaccines, but its use in Europe is
it also provides many health benefits. now very limited, and studies have shown
Most countries have therefore developed in any case, that thimerosal in vaccines was
appropriate dietary advice for maintaining not harmful (European Centre for Disease
a balanced diet and gaining the health Prevention and Control, 2018).
benefits associated with seafood.
Apart from the general exposure pathways
Mercury exposure from other, non‑dietary mentioned above, local communities living
routes is very small. Low levels of mercury near mercury-polluted sites such as former
are present in ambient air. Our bodies mercury mines may face some additional
24health risks. So far, however, the health
effects of local mercury pollution on these
communities seem to be relatively limited.
A study investigating the effects in Idrija
(Slovenia), where mercury has been mined
for more than 500 years, found that the
exposure of school-aged children in that
area was no higher than that of children
from other rural or urban areas (Kobal et
al., 2017). However, it has been shown that
foodstuffs produced in Idrija do contain
increased mercury concentrations. This is
especially the case for fish, mushrooms and
chicory (Miklavčič et al., 2013).
© Basotxerri/ Wikimedia Commons 25Monitoring human mercury levels — The DEMOCOPHES study
DEMOCOPHES was a Europe-wide, EU-funded human biomonitoring study carried out
between 2010 and 2012. The aim was to demonstrate and refine a common approach
to completing biomonitoring studies across Europe so that data would be comparable
between countries.
Human biomonitoring is an approach used for assessing the levels of contaminants in
the human body. As part of the study, the mercury levels of children and their mothers
in 17 countries were assessed by analysing hair samples, a common way to assess
mercury exposure.
The mercury levels of the participating mothers in the 17 countries indicate that women
in countries with a higher average fish intake have higher levels in their bodies. Spanish
and Portuguese mothers had by far the highest levels, typically five to seven times above
the average. Interestingly, the results indicated that other countries with high levels of
fish consumption (e.g. Cyprus) have lower mercury levels, as people there tend to eat
less predatory fish.
This work is being further developed through the European Human Biomonitoring
Initiative (HBM4EU; www.hbm4eu.eu). This type of information on exposure levels will
assist in developing strategies for minimising mercury exposure while maximising the
benefits of eating seafood.
26DEMOCOPHES study — Mercury levels in hair of mothers as
a percentage of the Europe-wide average
Hungary 18 %
Romania 45 %
Germany 49 %
Slovakia 60 %
Poland 61 %
United
Kingdom 70 %
Switzerland 70 %
Czech
Republic 71 %
Ireland 74 %
Average 100 %
Sweden 115 %
Slovenia 116 %
Belgium 167 %
Luxembourg 176 %
Denmark 178 %
Cyprus 210 %
Portugal 545 %
Spain 667 %
0 100 200 300 400 500 600 700 800
% of average for all participants
Source: Based on data from the DEMOCOPHES study, Den Hond et al., 2015. 27Dietary advice to pregnant women in Denmark
A high mercury intake by women during pregnancy can have negative impacts on children’s
development. A study carried out in Denmark (Kirk et al., 2017) attempted to find out if
giving pregnant women proactive, focused and balanced dietary advice could help to lower
their mercury intake without having an impact on their overall consumption of fish.
The women completed a questionnaire on their dietary habits, including fish intake, and
an initial sample of their hair was taken for mercury analysis. At the same time, they were
provided with balanced dietary information that highlighted the benefits of fish but also
explained how exposure to mercury could be reduced through their choice of seafood,
in particular by avoiding eating large predatory fish.
Based on the initial hair sample, 22 % of the women had mercury levels above the safe
limit recommended by experts. A follow-up sample taken after 3 months showed that this
figure had reduced to 8 % and that the average mercury level across all participants was
significantly lower. The overall fish consumption levels remained the same, indicating that
the changes in mercury levels were due to changing the types of fish eaten.
A separate study (Bellanger et al., 2013) estimated that, every year throughout Europe,
nearly 1.9 million babies are born with mercury levels above the recommended safe limit.
This is approximately one third of all births, although countries with higher levels of fish
consumption (e.g. Greece, Portugal, and Spain) had proportionately more babies born with
mercury levels above the limit.
The potential impact on children’s brain development is considered to be lifelong and can
result in a significant reduction in Intelligence Quotient (IQ). The authors estimated the
annual economic cost of this damage to be at least EUR 9 billion.
Together, these two studies clearly show that there are very significant health, social
and economic benefits of providing proactive public information on managing dietary
exposure to mercury.
28The behaviour and impacts of
mercury in the human body
As with all toxic substances, mercury’s
effects are dose related; they depend on the
amount consumed and how much our body
absorbs. Different forms of mercury stay in
our tissues for different lengths of time and
some parts of our body tend to accumulate
it more easily. Methylmercury is absorbed
easily by our bodies and remains there the
longest (Miklavčič et al., 2013).
Mercury affects mainly the brain/nervous
system, the kidneys and, when inhaled,
the lungs. Importantly, methylmercury
crosses the blood-placenta barrier
10 times more efficiently than other forms
of mercury and, as a result, presents a
significant risk to developing embryos
(Young‑Seoub et al., 2012). Mercury
exposure in the womb or in infancy affects
the development of the brain and nervous
system. High levels of exposure can result
in symptoms such as vision and hearing
problems, impaired motor skills, delays
in language development and memory/
attention deficits (Bose-O’Reilly et al., 2010;
Grandjean and Herz, 2011). Breastfeeding
women should also follow relevant dietary
advice on fish consumption, as mercury
levels in the body have an impact on levels in
breast milk (Grandjean et al., 1994).
Recent studies have also shown that,
in older adults, mercury exposure can
increase the risk of cardiovascular disease
(Karagas et al., 2012) and blood pressure
problems (Genchi et al., 2017).
© Vasiliki Konstantelia, Environment & Me /EEA 29Mercury’s human uptake potential and relevant impacts
Uptake Impacts
Brain
• Acute: tremors, tingling and
burning sensations, hypersensitivity
Inhalation and memory loss
• Chronic: fatigue, weakness,
• 80 % of elemental mercury is taken up insomnia, psychological disorders
and impairment of vision/hearing
• 95 % of methylmercury is taken up
Ingestion Cardiovascular system
• Chronic: cardiovascular disease,
• < 0.01 % of elemental mercury
blood pressure problems
is taken up
• 95 % of methylmercury
is taken up
Lungs
• 2-38 % of inorganic mercury
is taken up • Acute: lung damage
• Chronic: bronchitis,
pulmonary fibrosis
Kidneys
• Acute: excessive urination and
presence of proteins in urine
• Chronic: kidney damage,
e.g. nephritic syndrome
30 Source: Bernhoft, 2012; Karagas et al., 2012; Park and Zheng, 2012; Genchi et al., 2017.© Dimitris Poursanidis, Environment & Me /EEA 31
32 © By Zwager/Wikimedia Commons
Production and use of mercury

The trends in producing and using mercury in anthropogenic activities differ significantly
between Europe and other regions. Asia is now by far the biggest regional user of
mercury. The EU’s use is continuing to decline, now accounting for only 5 % globally.
Global use is likely to continue to be environmentally significant in the medium term;
however, there are some signs of future reductions in key global regions.

Where does mercury come from?                           After the 1970s, mine output reduced
                                                        significantly, although it has increased slightly in
Mercury ores have been mined for                        recent years and some mines have reopened.
thousands of years on a relatively small                Currently, mercury is mined in only four
scale, but this increased significantly in the          countries, namely China, Indonesia, Kyrgyzstan
16th century, when mercury was used to                  and Mexico (Selin et al., 2018). Essentially, the
process silver ores. The use of mercury                 main commercial mercury production and
rose further in the mid-1800s with the                  trading hubs have moved to areas of greatest
commencement of large-scale gold mining                 demand, as other regions such as North
and the industrial revolution in Europe.                America and Europe have placed restrictions
Mine production of mercury peaked in                    on trading, producing and using mercury. This
the early 1970s, and, before that, in the               increase in output is concerning, and is primarily
1940s as a result of the Second World War,              fuelled by increasing demand for mercury in
during which mercury was used in military               certain activities, including small scale gold
equipment such as explosives.                           mining and vinyl chloride production.

         Origin of mercury deposited in Sweden in 2014
Global mine production of mercury from 1900 to 2016
Mine output (tonnes)
12 000

10 000

 8 000

 6 000

 4 000

2 000

    0
     00

     05

     10

     15

     20

     25

     30

     35

     40

     45

     50

     55

     60

     65

     70

     75

     80

     85

     90

     95

     00

     05

     10

     15
   19

   19

   19

   19

   19

   19

   19

   19

   19

   19

   19

   19

   19

   19

   19

   19

   19

   19

   19

   19

   20

   20

   20

   20

Source: Provided
Source: USGS, 2018.
                 by Swedish EPA, based on EMEP, 2016.                                                          33
A brief history of mercury use
Mercury has fascinated humans since ancient times, when it was hailed as having a
multitude of mystical properties, including medicinal powers. Mercury-based health
treatments, developed in the early days of formal medicine, included consuming
mercury‑containing medicines and having external treatments such as mercury ‘vapour
baths’. Mercury vapour treatment was recommended to cure syphilis and various
skin conditions, as well as for internal discomfort, including pains during pregnancy
(Swiderski, 2008). Mercury-based treatments were often claimed to have miraculous
effects, but much less attention was given to their sometimes fatal consequences. The
potential side effects of consuming mercury (nausea, strange behaviour, tremors) were in
some cases looked upon as proof that the ‘medicine’ was driving out the patient’s illness
(Swiderski, 2008).
Mercury was commonly used in alchemy, an early form of chemistry that attempted to
purify or transform certain materials. This included preparing life-giving potions (elixirs)
and transforming base metals into gold.
Mercury was also used in industrial activities, one of the earliest being silver and gold
mining, where it was used to separate precious metals from other materials. Over
2 000 years ago, the Romans imported large quantities of mercury from the Iberian
Peninsula into Italy to process gold ores (Lacerda and Salomons, 1998). In more modern
times, mercury was extensively used during the California Gold Rush (which started in
1848). Millions of kilograms of mercury were released into the Californian environment,
the impacts of which are still evident today (Alpers et al., 2005).
The Industrial Revolution resulted in mercury being used in many industrial processes,
including in the production of chemicals such as chlorine. Chlorine is produced globally in
very large quantities and is used to make everyday materials such as plastics, disinfectants,
medicines and paints, as well as in important processes such as the disinfection of drinking
water. In addition, mercury was (and, to some extent, still is) used in consumer products
such as thermometers and electrical equipment.
34Source: Parker et al., 1874. 35
The current global uses
     of mercury

     Mercury is mostly used as a raw material in
     a range of industrial processes. Estimates
     for 2015 (UN Environment, 2017a)
     indicated that 4 716 tonnes of mercury
     were consumed. Comparing this with the
     estimates for 2005 and 2010 suggests
     that consumption rose from 2005 to 2015,
     mainly from use in small-scale gold mining
     and vinyl chloride manufacturing. Note
     that estimates of use from different years
     must be compared with caution, as the
     methodologies used to estimate emissions
     are refined over time.

     Globally, small-scale gold mining
     (37 %) and vinyl chloride production
     (26 %) are the main uses of mercury
     (UN Environment, 2017a) (vinyl chloride is
     used to manufacture PVC (polyvinyl chloride)
     plastics). Mercury is also used in the
     production of chlorine‑based chemicals and
     in everyday products such as dental fillings,
     batteries and light bulbs.

     The increase in mercury use in vinyl chloride
     production is due mainly to demand from
     some developing countries for products
     such as plastic window frames. The
     countries producing this (primarily China)
     tend to use a process that relies on mercury,
     whereas other producers (e.g. in Europe)
     now use mercury-free technologies. Current
     indications are that China is taking action to
     address this (UN Environment, 2017a).

36                                                    © Patricia Verburg, Environment & Me /EEA
Mercury consumption by region and activity, 2015
Tonnes of mercury
North America European Union Commonwealth of Independent States
(28) and other European countries
8 85 24 51
93
140
38 25 39 56
Central America and North Africa Middle East
the Caribbean
19 11 38
16 9 22
28 14 20 47
South America Sub-Saharan Africa South Asia
1 32 4
22
366
96
59 131
680
East and
35 southeast Asia
25
55
645
Australia, New Zealand
and Oceania
18 4
1 223
424
Small-scale gold mining 114
Vinyl chloride and chlorine manufacture
Batteries, lamps and electrical devices
Other (incl. dental)
Source: UN Environment, 2017a. 3738 © Jesper Bosse Jønsson
Replacing mercury in small-scale gold mining

Artisanal and small-scale gold mining (ASGM) relates to individuals or small groups of
people mining gold relatively simply and at low cost. Basic methods are used to refine
and extract gold from the mined ore. The process is commonly carried out in Asia, Africa
and Central and South America. A significant number of people are involved, as gold is
still very valuable and they see the potential to provide for their families through this
largely unregulated, low-cost activity. At least 100 million people depend on ASGM for their
livelihood (AMAP and UNEP, 2008).

Mercury is used to separate the gold from other materials in the mined ores. The
mercury amalgamates with the gold; then, by heating this gold/mercury mixture, the
mercury evaporates and the gold is left behind. Practically all of this mercury is released
into the environment.

The Geological Survey of Denmark and Greenland (GEUS) and the University of
Copenhagen have carried out various studies on the technical, socio-economic and cultural
aspects of small-scale gold mining. One of these projects examined the potential of an
alternative, mercury-free process for extracting gold from ores (Appel and Na-Oy, 2014).
This separation process uses borax (also known as sodium borate).

The method is relatively simple and does not require specialist equipment or expertise.
It also takes approximately the same amount of time as the mercury method.
Experiments carried out using this method indicate that higher yields of gold are generated
than when using mercury.

Although this method has been applied to some extent in the Philippines, it has yet to
find widespread favour in other countries. Borax can also have health and environmental
impacts and needs to be managed properly; however, when used efficiently it appears to
present a viable and safer alternative.

                                                                                               39
40 © Jesper Bosse Jønsson
Current uses of mercury in the EU                products (known as the chlor-alkali
                                                 industry, 85 tonnes consumed) and
From a European perspective, significant         in dental applications (56 tonnes
efforts have been made to stop using             consumed). However, the use
mercury in industrial activities as well as in   of mercury in industrial chlorine
consumer products. Mercury is no longer          production in the EU was banned at
used in small-scale gold mining (apart from      the end of 2017 and hence dental
in French Guiana, part of France), while         applications are now the single biggest
mercury in vinyl chloride manufacturing is       user of mercury in Europe. Overall, EU
limited to one plant in Slovakia, which must     use of mercury, estimated at 249 tonnes
cease using it by 2022.                          in 2015 (UN Environment, 2017a),
                                                 accounts for 5 % of the global amount.
EU data for 2015 (UN Environment, 2017a)         This compares with 2 407 tonnes in East
show that mercury was mainly used in             and Southeast Asia in the same year
the industrial manufacture of chlorine           (UN Environment, 2017a).

 The current status of mercury use in European dentistry

 Mercury-containing fillings have been used to fill cavities in human teeth since the 1800s
 because they are relatively cheap and very hardwearing. These fillings are approximately
 50 % mercury (COWI, 2008). With around 75 % of the 500 million EU inhabitants having
 fillings, it is estimated that 1 500 tonnes of mercury is held in human bodies, which
 presents a potential exposure route through, for example, the process of cremation.

 The main alternative to mercury fillings is composite fillings, which are already widely
 used in many European countries. In Denmark, Norway and Sweden, mercury in dentistry
 has effectively been banned. Finland, Hungary, the Netherlands and Switzerland have
 implemented measures that have reduced the use of mercury in dental restorations
 to very low levels. The main factor limiting the use of composite fillings is their higher
 cost. In lower income countries, the use of mercury continues and may even increase as
 healthcare systems improve.

                                                                                              41
The outlook for EU and global
mercury use
The global use of mercury has been increasing
over the last 10 years, mostly because of
small-scale gold mining and vinyl chloride
production. The estimate for 2015, at
4 716 tonnes (UN Environment, 2017a), is 38 %
higher than that for 2005, at 3 415 tonnes
(UNEP, 2006); however, these figures should
be compared with some caution, as calculation
methods have improved over time. The
global estimate in 2015 is also approximately
twice the mine production output for that
year, indicating that the supply from existing
mercury stocks is bridging the gap between
output from mining and current demand.
An analysis of the main drivers of current
use, namely vinyl chloride production
and small-scale gold mining, provides an
indication of future trends:
• Vinyl chloride. China is the biggest
user of mercury in vinyl chloride
production, with around one third
of the global output. The amount
of mercury China consumed in this
process in 2014 was estimated at
1 216 tonnes (UN Environment, 2017a).
As China is a signatory to the global
Minamata Convention on Mercury
(which seeks to reduce the impacts of
mercury), it must work towards a target
of reducing mercury use by 50 % per
unit production in 2020 (compared
with 2010 figures). Efforts are being
made in China to replace the existing
process with a less harmful alternative
(Peplow, 2017). While progress is being
made, it remains to be seen whether
the Minamata Convention targets will be
achieved by 2020.
42 © Dennis Hill/Creative Commons• Small-scale mining. Millions of mercury use in Europe (see p.59, What is
small‑scale miners work in unregulated being done in Europe and globally?) will result
environments around the world. in this decreasing to around 50 tonnes by
Although many projects have been 2021 (European Commission, 2017).
implemented to reduce mercury
consumption (UNIDO, 2013), estimates of Dentistry will be by far the biggest single user
mercury use continue to rise. This activity by 2021, with other activities having relatively
looks set to be the main global consumer low demand. Recent European legislation
of mercury until alternative methods prevents the use of mercury-based fillings in
are readily accepted and applied in ‘baby’ teeth, in children under 15 years old
these communities. This is likely to be and in pregnant or breastfeeding women.
very difficult and will require a thorough Furthermore, these regulations require every
understanding of local socio‑economic EU Member State to publish a plan, by 2019,
and cultural factors (Spiegel, 2009). that outlines its proposed measures to phase
out such fillings. The European Commission
Use patterns in Europe are quite different is then required to report on the feasibility of
from the global scenario. The ban on implementing a complete EU-wide ban in the
mercury in the manufacture of chlorine long term, and preferably by 2030. Overall,
products means that consumption will drop the trends in Europe are downward; however,
below 200 tonnes per annum from 2018. there appears no prospect of a zero-mercury
The policies put in place to further control economy in Europe in the medium term.
Estimates of mercury consumption in the EU for 2007, 2015, 2021
Tonnes
250
200
150
100
50
0
Industry Dentistry Lamps and batteries Other
2007 2015 2021
Sources: based on data from ICF International, 2015 (2007 data); UN Environment, 2017a (2015 data);
and European Commission, 2017 (2021 projections). 4344 © Victor Troyanov, Environment & Me /EEA
Mercury emissions — Trends
and outlook

The biggest mercury users do not necessarily result in the largest environmental
emissions. In Europe, the largest sources of emissions are actually coal combustion
and industrial activities, while, globally, small-scale gold mining is also significant.
EU emissions are expected to decrease further over the coming years. Non-EU sources
dominate current and future global emissions of mercury, although there are some
prospects for reducing global emissions in the medium term.

The main potential sources of                     Mercury-releasing anthropogenic activities
mercury emissions                                 can be split into two types:

Mercury can be divided into primary emissions     •    Activities that intentionally use mercury,
and re-emissions (or re-mobilisation). Primary         as described in the previous section
emissions refer to the first time mercury is           of this report (e.g. vinyl chloride
released into the environment directly from            production).
either natural sources (such as volcanoes)        •    Other activities, which do not
or anthropogenic sources. Re-emissions and             intentionally use mercury, but
re-mobilisation, on the other hand, refer to           nonetheless result in its release into the
mercury re-entering air or water after its             environment, generally because it is an
earlier removal. For example, mercury in the           impurity in a raw material. The prime
air is deposited in the ocean and then after           example is the combustion of solid
a period of time the mercury in the ocean is           fuels such as coal, lignite and wood,
re‑emitted to the atmosphere and, therefore,           during which the mercury in the fuel
is not emitted from a ‘primary’ source such as         is released. These are referred to as
an industrial activity.                                unintentional releases.

Overall, natural sources account for about
10 % of annual mercury emissions to
atmosphere worldwide, while anthropogenic
activities account for about 30 %
(UNEP, 2013). The remainder, approximately
60 %, is re-emissions, that is, mercury
that was previously released into the
environment, mainly from human activities.

                                                                                                    45
Main global potential sources of mercury emissions
Natural sources
Volcanoes Erosion Natural fires
Man-made sources - intentional uses
Industrial processes Batteries Lamps Gold mining Dentistry
(e.g. vinyl chloride
manufacture)
Man-made sources - unintentional releases
Burning solid fuel Metal Cement Oil refining Waste management
(coal, peat, wood) processing production (landfill/incineration)
46Current global mercury and non-ferrous metal production, which
emissions to air each account for about 10 % (AMAP
and UNEP, 2013). None of these three
Global air emissions are important as they sources specifically uses mercury as
result in impacts within Europe and vice part of the process; however, emissions
versa. Mercury emissions from outside occur because mercury is present in the
Europe contribute about 50 % of the raw materials/fuels, and hence these are
anthropogenic mercury deposited annually examples of ‘unintentional’ releases.
within Europe, with nearly 30 % of the
mercury deposited in Europe originating in While emissions to air from power
Asia (AMAP and UNEP, 2015). generation and industry are significant,
small-scale gold mining is, in fact, the
Globally, coal combustion accounts for single biggest source, accounting for more
around one quarter of emissions to air; than one third of global releases (AMAP
other main industrial sources are cement and UNEP, 2013).
Global mercury releases to air in 2010, by main source
7%
5%
5% 24 %
9%
37 %
13 %
Coal combustion Cement production Metal production Small-scale gold mining
Large-scale gold production Waste from mercury containing products Other
Source: AMAP and UNEP, 2013. 47Most estimates of global mercury to ongoing economic development, with
emissions indicate global releases to the associated industrialisation (e.g. increased
atmosphere of around 2 000-2 500 tonnes outputs of metals and vinyl chloride) and
per year (AMAP and UNEP, 2008, 2013; higher demands for energy, principally via
Pirrone et al., 2010). Whereas in recent years coal burning. Small-scale gold mining also
emissions in Europe and North America have contributes to the increased emissions
been decreasing, those in Asia, Africa and in Asia, while it is the dominant source of
South America have been increasing. The emissions in South America and Africa.
increased emissions from Asia are linked
Global mercury emissions to air in 2010, by region,
distinguishing between small-scale gold
mining and other sources
Tonnes
800
700
600
500
400
300
200
100
0
a
a
a
ia
EU
a
s
t S lth e &
on
i
ric
ic
ic
As
As
ta of
er
er
Af
gi
en ea op
s
st
h
Am
Am
te
re
ut
an
ea
nd nw ur
er
So
pe o r E
h
th
r
th
ha
ut
th
or
ou
de m e
So
O
Sa
In om Oth
N
/S
b-
st
Su
Ea
C
Small-scale gold mining Other sources
48 Source: AMAP and UNEP, 2013.The outlook for global mercury
emissions to air
Many experts have estimated future
atmospheric mercury emissions, and,
in summary, most do not anticipate a
short‑term reduction (e.g. Sunderland and
Selin, 2013; Gworek et al., 2016). Emissions
are, at best, estimated to stabilise around
current levels, with mercury continuing to
be introduced into the environment.
However, one significant area of uncertainty
in these assessments is the potential impacts
of the Minamata Convention on Mercury
(see p.59, What is being done in Europe and
globally?). The Convention obliges all parties
to apply the concepts of best available
techniques and best environmental practices
to control and reduce mercury emissions.
The discussion of future projections below
should be considered in this context, as
implementing the Convention is expected to
moderate emissions, with the potential for
a reduction if the parties to the Convention
are ambitious in applying the requirements.
An examination of each of the three
main global sources of anthropogenic air
emissions suggests that there is some
limited evidence of potential future
reductions, perhaps in some cases as a
result of the Minamata Convention:
• Electricity generation using solid fuels.
The global use of coal for power is not
forecast to decrease between now
and 2040 and it may even increase if
expected policy measures (to meet the
Paris Agreement climate change targets)
are not introduced (International Energy
© Ahmet Hukic, ImaginAIR /EEA 49Agency, 2017). The forecast reductions regions such as Asia will increase
in coal demand between 2016 and 2040 (Rafaj et al., 2013). However, more
in regions such as the United States recent evidence shows that countries
(- 16 %) and Europe (- 47 %) will be offset such as China are implementing
by significant growth in coal demand in measures to reduce the mercury used
countries such as India (+ 114 %) and in activities such as vinyl chloride
other Asian countries (International production (UN Environment, 2017a).
Energy Agency, 2017). Global energy
demand between 2016 and 2040 is Current European mercury
predicted to grow by approximately emissions to air
30 %, which is the equivalent of adding
another ‘India + China’ to today’s In 2010, European emissions to the
global demand (International Energy atmosphere accounted for about 4.5 %
Agency, 2017). Therefore, the current of global releases, with two main sectors
prospects for reduced air emissions dominating, namely electricity generation
from power generation do not appear to and industrial activities (e.g. iron and steel
be positive unless substantial changes production, non-ferrous metal production,
are made to the proposed fuels and/ cement/minerals and the chemical industry).
or the technologies used to generate
power in these countries. Because of ongoing efforts to reduce
• Mercury use in small-scale gold mining. mercury in certain activities (e.g. industrial
It is already very difficult to estimate chemicals), coupled with more stringent
current emissions from small-scale limits on industrial emissions, European
gold mining and even more difficult mercury emissions to air have decreased
to predict future releases. However, consistently over the last 30 years and
at present there are no indications of in 2016 they were 71 % lower than in
a widespread move away from using 1990. Emissions now are mainly from
mercury, and the emissions from this unintentional releases such as fuel
activity are projected to increase combustion and processing of metals.
(Rafaj et al., 2013) unless more concrete
actions are taken in the relevant
countries to restrict or ban the use of
mercury.
• Industrial emissions. Increased
economic growth also brings about
increased industrial activity such
as cement production, chemical
manufacturing and vinyl chloride
manufacturing. Some assessments
indicate that mercury emissions from
50© Balázs Bálint, Environment & Me /EEA 51
Trend in EU mercury emissions to air, 1990-2016
Tonnes
200
150
100
50
0
90
91
92
93
94
95
96
97
98
99
00
01
02
03
04
05
06
07
08
09
10
11
12
13
14
15
16
19
19
19
19
19
19
19
19
19
19
20
20
20
20
20
20
20
20
20
20
20
20
20
20
20
20
20
Energy production and distribution Industrial processes and product use/energy use in industry
Transport Other
Main countries contributing to energy Main countries contributing to industrial
production and distribution emissions processes and product use/energy use in
(% of EU total) industry emissions (% of EU total)
5% 4%
5%
28 % 31 % 21 %
8%
15 %
24 % 7%
26 % 7% 11 %
8%
Czech Republic France Germany Italy
Other Poland Spain United Kingdom
52 Source: EEA, 2018c.The outlook for European mercury emissions is forecast from
mercury emissions to air solid fuel combustion in Europe due to
reducing the use of coal for generating
In the coming years, European mercury power. This is because these fuels are
emissions will decline further due to stricter a key contributor to greenhouse gas
legislation such as the Industrial Emissions emissions; however, this reduction will
Directive (IED; 2010/75/EU). The IED requires also lower mercury emissions. Current
industries to take action to reduce emissions estimates indicate that, by 2050, the use
of a range of pollutants, including mercury. of solid fuels in power generation will
Technical requirements to minimise have declined by about 70 % compared
emissions are now set for all large industrial with 2015 (European Commission,
sources, such as cement manufacturing and 2016), thereby significantly reducing
metal production, and will result in lower mercury emissions to the atmosphere.
mercury emissions from these activities over
the coming years. Mercury in water — Current
European and global status
Power generation using solid fuels will be
the main source of mercury emissions to Research on direct mercury releases to
air in Europe for the foreseeable future. water is not as developed as research
However, a number of factors will lead to on emissions to the atmosphere. There
a reduction over both the short and the are, therefore, limited data available on
medium term: emissions to water (AMAP and UNEP, 2013).
• As a result of the IED, within the next A first attempt to estimate global mercury
3 years large power plants will be emissions to freshwaters was completed
required to meet strict emission limits, in the Global Mercury Assessment 2013
which will result in a reduction between (AMAP and UNEP, 2013). Because of a lack
now and 2021. These plants may have to of data, the assessment was able to provide
install additional equipment to remove estimates for only a limited number of
mercury in combustion gases so that activities, concluding that emissions were
it is not released into the atmosphere. around 185 tonnes, but with a possible
Estimates are that by 2021 mercury range of anywhere between 42 and
emissions from power generation will 582 tonnes.
reduce to below 9 tonnes per annum,
compared with 15.5 tonnes in 2013 A refined estimate of anthropogenic
(Ricardo Energy and Environment, 2017). emissions to water will be included in the
Emissions in 2021 could be as low as 2.5 next AMAP and UNEP Global Mercury
tonnes if all EU Member States apply the Assessment report, due to be published in
most ambitious limits (Ricardo Energy late 2018. This will include a more detailed
and Environment, 2017). provisional assessment of water emissions
• Over the next 30 years a reduction in for 2015 and an assessment of more sectors,
53You can also read