Pneumolysin Is Responsible for Differential Gene Expression and Modifications in the Epigenetic Landscape of Primary Monocyte Derived Macrophages ...
←
→
Page content transcription
If your browser does not render page correctly, please read the page content below
ORIGINAL RESEARCH
                                                                                                                                                   published: 11 May 2021
                                                                                                                                          doi: 10.3389/fimmu.2021.573266

                                           Pneumolysin Is Responsible for
                                           Differential Gene Expression and
                                           Modifications in the Epigenetic
                                           Landscape of Primary Monocyte
                                           Derived Macrophages
                                           Joby Cole 1,2,3,4, Adrienn Angyal 1, Richard D. Emes 5,6, Tim John Mitchell 7,
                                           Mark J. Dickman 4 and David H. Dockrell 8*
                                           1 Department of Infection, Immunity and Cardiovascular Diseases, University of Sheffield, Sheffield, United Kingdom,
                                           2 Sheffield Teaching Hospitals NHS FT, Sheffield, United Kingdom, 3 The Florey Institute, University of Sheffield, Sheffield,
                                           United Kingdom, 4 Department of Chemical and Biological Engineering, University of Sheffield, Sheffield, United Kingdom,
                                           5 Advanced Data Analysis Centre, University of Nottingham, Nottingham, United Kingdom, 6 School of Veterinary Medicine

                                           and Science University of Nottingham, Nottingham, United Kingdom, 7 Institute of Microbiology and Infection, University of
                         Edited by:        Birmingham, Edinburgh, United Kingdom, 8 MRC Centre for Inflammation Research, University of Edinburgh, Edinburgh, United Kingdom
                        Amy Rasley,
 United States Department of Energy
                (DOE), United States       Epigenetic modifications regulate gene expression in the host response to a diverse range
                       Reviewed by:        of pathogens. The extent and consequences of epigenetic modification during
                          Dane Parker,
                                           macrophage responses to Streptococcus pneumoniae, and the role of pneumolysin, a
  The State University of New Jersey,
                         United States     key Streptococcus pneumoniae virulence factor, in influencing these responses, are
                          Birgit Strobl,   currently unknown. To investigate this, we infected human monocyte derived
     University of Veterinary Medicine
                       Vienna, Austria     macrophages (MDMs) with Streptococcus pneumoniae and addressed whether
                 *Correspondence:          pneumolysin altered the epigenetic landscape and the associated acute macrophage
                    David H. Dockrell      transcriptional response using a combined transcriptomic and proteomic approach.
             David.Dockrell@ed.ac.uk
                                           Transcriptomic analysis identified 503 genes that were differentially expressed in a
                   Specialty section:
                                           pneumolysin-dependent manner in these samples. Pathway analysis highlighted the
         This article was submitted to     involvement of transcriptional responses to core innate responses to pneumococci
               Microbial Immunology,
                                           including modules associated with metabolic pathways activated in response to
               a section of the journal
              Frontiers in Immunology      infection, oxidative stress responses and NFkB, NOD-like receptor and TNF signalling
            Received: 16 June 2020         pathways. Quantitative proteomic analysis confirmed pneumolysin-regulated protein
            Accepted: 16 April 2021        expression, early after bacterial challenge, in representative transcriptional modules
            Published: 11 May 2021
                                           associated with innate immune responses. In parallel, quantitative mass spectrometry
                            Citation:
         Cole J, Angyal A, Emes RD,
                                           identified global changes in the relative abundance of histone post translational
        Mitchell TJ, Dickman MJ and        modifications (PTMs) upon pneumococcal challenge. We identified an increase in the
   Dockrell DH (2021) Pneumolysin Is
                                           relative abundance of H3K4me1, H4K16ac and a decrease in H3K9me2 and H3K79me2
    Responsible for Differential Gene
  Expression and Modifications in the       in a PLY-dependent fashion. We confirmed that pneumolysin blunted early transcriptional
    Epigenetic Landscape of Primary        responses involving TNF-a and IL-6 expression. Vorinostat, a histone deacetylase
    Monocyte Derived Macrophages.
         Front. Immunol. 12:573266.
                                           inhibitor, similarly downregulated TNF-a production, reprising the pattern observed with
   doi: 10.3389/fimmu.2021.573266          pneumolysin. In conclusion, widespread changes in the macrophage transcriptional

Frontiers in Immunology | www.frontiersin.org                                        1                                             May 2021 | Volume 12 | Article 573266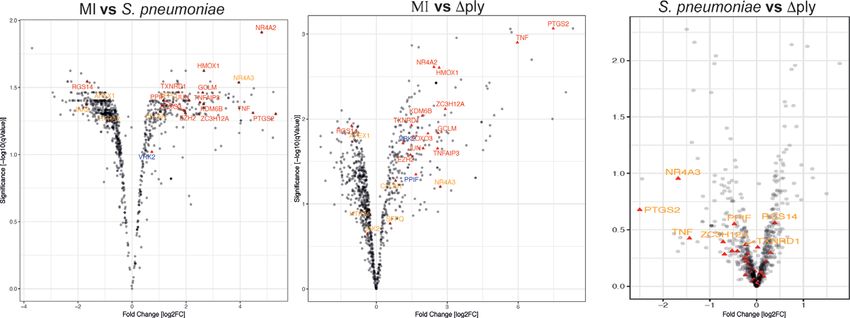
Cole et al.                                                                                             Epigenomic Study of Pneumolysin in Macrophages

                                          response are regulated by pneumolysin and are associated with global changes in histone
                                          PTMs. Modulating histone PTMs can reverse pneumolysin-associated transcriptional
                                          changes influencing innate immune responses, suggesting that epigenetic modification
                                          by pneumolysin plays a role in dampening the innate responses to pneumococci.
                                          Keywords: histone post translational modifications, Streptococcus pneumoniae, pneumolysin, tumour necrosis
                                          factor, monocyte derived macrophages

INTRODUCTION                                                                   number of different bacterial components (22). Experiments
                                                                               using both Legionella pneumophila (19), and Listeria
Pneumolysin (ply) is one of the key virulence factors of S.                    monocytogenes (17) have shown that bacterial interaction
pneumoniae (the pneumococcus), the leading cause of                            with the THP-1 monocytic cell line also modifies histone
community-acquired pneumonia (1) and is present in the                         PTMs. Furthermore, H. pylori has been shown to alter both
majority of clinical isolates causing invasive pneumococcal                    the host epigenome and transcriptome (23). In the case of
disease (IPD) (2, 3). Pneumolysin is a cholesterol-dependent                   Listeria monocytogenes, Listeriolysin O, a pore-forming
cytolysin and part of a family of toxins expressed in Gram-                    cytolysin similar to ply, is secreted causing dephosphorylation
positive bacteria (4). It is a 53 kDa protein that contains four               at serine 10 of histone H3 and reduction in the levels of
domains (5). One mechanism of action is through pore                           acetylated H4 in THP-1 cells. In HeLa cells these changes
formation (6) but increasingly it is recognized to mediate                     altered the transcriptional profile, which was associated with
additional actions independent of the ability to form pores (7).               a decrease in IL-6 and other genes involved in innate immune
   In murine models of bacteraemia ply sufficient mutants are                   responses (18). More recently, Streptococcus pneumoniae via
associated with increased lethality compared to ply deficient                   the action of ply was shown to dephosphorylate serine 10 on
mutants, linking the toxin to virulence (8). Furthermore, the                  Histone H3 mediated by host cell phosphatase PP1 (24). which
transmission of S. pneumoniae between hosts has been linked to                 in turn led to efficient infection of epithelial cells. Furthermore,
the presence of inflammation in the nasopharynx and                             S. pneumoniae has been shown to lead to chromatin
pneumolysin has been shown to promote inflammation,                             remodelling in an epithelial cell model in a KDM6B
increase transmission and foster the survival ex vivo of S.                    dependent manner (25). This supports the hypothesis that
pneumoniae (9). It has been also suggested that pneumolysin                    bacteria alter the epigenetic profile of the host cell as a
facilitates blood stream invasion by S. pneumoniae (3). This                   strategy for immune subversion, limiting the inflammatory
highlights its importance as a key virulence factor of S.                      response to increase their survival.
pneumoniae due to its role in the transmission of S.                               The consequences of epigenetic changes during acute
pneumoniae between hosts, in the progression from                              bacterial infections are, however, not fully understood. The aim
nasopharyngeal colonisation to invasive pneumococcal disease,                  of this study was to investigate the consequences and mechanism
the stimulation of inflammation and its cytotoxic effects (1).                  underpinning the ability of pneumolysin to modulate
   Pneumolysin has been shown to alter a variety of immune                     translational responses to S. pneumoniae using primary human
responses. For example it has been demonstrated to both activate               macrophages. We found that pneumolysin modulates a broad
the classical complement pathway (10) as well as play a role in                range of immune transcriptional responses in macrophages and
complement evasion (11). Pneumolysin has been associated with                  differential protein expression analysis also confirmed changes in
stimulation of NRLP3 and potentially other inflammasome                         key transcriptional modules. Moreover, we identified global
components (12, 13). In human monocytes it is associated                       changes in the abundance of histone PTMs in MDMs in a
with production of tumour necrosis factor alpha (TNF-a) and                    pneumolysin dependent manner. We illustrate that one key
interleukin (IL-)1b (14). Pneumolysin has been shown to be                     pneumolysin-regulated immune response, early TNF-a
responsible for the differential expression of multiple genes in               production is also altered by chemical manipulation of
undifferentiated THP-1 cells, a monocytic cell line (15), but its              histone PTMs.
impact on gene expression in primary macrophages has not been
established in detail. More recently, pneumolysin has been
shown to bind the mannose receptor C type 1 in mouse                           MATERIALS AND METHODS
alveolar macrophages leading to diminished pro-inflammatory
cytokine release and enhanced bacterial survival (16).                         Bacterial Strains
   The subversion of the host immune system is one of the key                  Streptococcus pneumoniae serotype 2 strain D39, the isogenic
components of bacterial pathogenesis. Microorganisms can                       pneumolysin-deficient mutant D39-Dply (Dply), which has a
highjack host gene expression to their benefit (17–19).                         single amino acid substitution in the pneumolysin sequence
Epigenetic mechanisms such as histone post-translational                       generating a STOP codon and the reconstituted mutant ply-
modifications (PTMs) have been shown to regulate gene                           D39-Dply, which expresses ply under an erythromycin promoter,
transcription (20, 21). Moreover, they can be modulated by a                   were kindly obtained from Prof T. Mitchell (University of

Frontiers in Immunology | www.frontiersin.org                              2                                    May 2021 | Volume 12 | Article 573266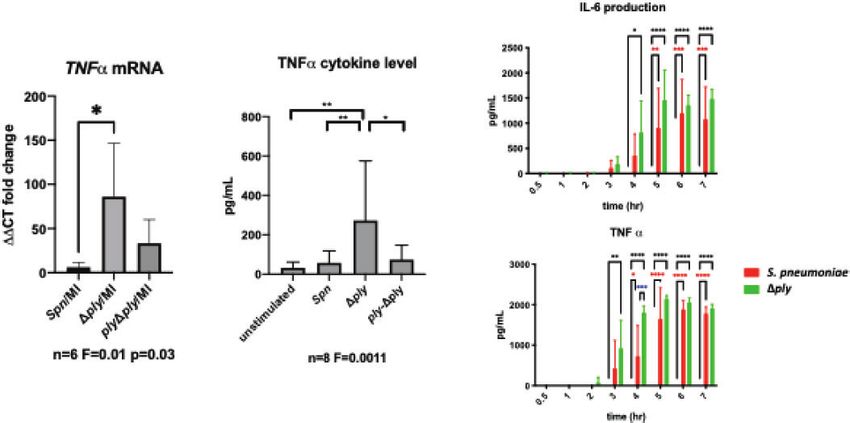
Cole et al.                                                                                       Epigenomic Study of Pneumolysin in Macrophages

Birmingham). These were cultured and characterized as                     and the data analysed in GraphPad Prism version 7.0c.
previously described (7). Strains were grown in brain heart               (GraphPad Software).
infusion broth and 20% FCS to mid exponential phase (with or
without 1mg/mL erythromycin).                                             RNA Extraction
                                                                          After 3 h of bacterial challenge, cells were washed and lysed in
MDM Infection                                                             600 mL Tri Reagent ® (Sigma) for 15 mins at room temperature
Whole blood was obtained from healthy volunteers. Ethical                 before storing at -80 C. Ribonucleic acid (RNA) extraction was
appr oval was g ranted by South Sheffi eld Reg ional                       performed following the manufacturers guidelines for Direct-
Ethics committee (07/Q2305/7). Peripheral blood mononuclear               Zol™ RNA miniPrep (Zymo). Briefly, samples in Tri Reagent®
cells were separated by differential centrifugation using a Ficoll-       were centrifuged at 12 000g for 1 min, then the supernatant was
Paque gradient and differentiated into monocyte derived                   transferred to a fresh 1.5 mL tube, 100% ethanol was added in a
macrophages (MDM) for 14 d as previously described in 24                  1:1 ratio and well mixed. This was then transferred to the Zymo-
well plates (Corning) (26). Bacteria were washed in PBS and re-           spin™ column, centrifuged for 1 min, then washed using 400 mL
suspended in RPMI 1640 supplemented with 10% pooled human                 Direct-Zol™ RNA pre-wash, centrifuged again at 12 000g for
immune serum (from previously vaccinated volunteers                       1 min, then washed in 700 mL RNA wash buffer and again
with demonstrable antibody levels to serotype 2 pneumococci)              centrifuged at 12 000g for 1 min. Finally the RNA was eluted out
(27). MDM were challenged with either opsonised                           in 50µl DNase/RNase free water.
S. pneumoniae, Dply or PBS, at a MOI of 10, rested on ice for
1 h and incubated at 37°C in 5% CO2 for a further 3 h (28). For           Microarray mRNA Expression Analysis
certain experiments cells were treated with 3 mM vorinostat               Affymetrix chip micro-array (Human Genome U133 plus
(SAHA, Sigma) or 0.5% DMSO (vehicle control) for 30 min prior             2.0 array, Santa Clara, CA) analysis of samples from three
to bacterial challenge and vorinostat reintroduced after                  individuals was undertaken to characterise gene expression
bacterial challenge.                                                      as previously described (29). Briefly, CEL files were analysed
                                                                          using R version 3.4.0. CEL files were read using Simpleaffy version
S. pneumoniae Internalisation Assay                                       2.52.0 (30); background intensity correction, median correction
MDM were challenged with opsonized S. pneumoniae for 3 h                  and quantile probeset normalisation was performed using robust
then washed three times in PBS, incubated for 30 min in RPMI              multi-array average expression with the help of probe sequence
media (Lonza) with 40 units/mL of benzylpenicillin (Sigma) and            (GCRMA), using AffyPLM version 1.52.1 (31). The quality
20 mg/mL gentamicin (Sanofi). The cells were then washed three             control matrix was generated using Simpleaffy and AffyPLM.
times in PBS and incubated in 250 mL of 2% saponin (Sigma) for            Principal component analysis was performed in R. The probes
12 min at 37°C in 5% CO2, then 750 mL of PBS was added,                   whose intensity was within the lowest 20th centile were removed,
followed by vigorous pipetting. The number of internalised                using Dplyr version 0.7.1. Differential gene expression was
viable bacteria were measured by counting the number of                   calculated using Limma version 3.32.2.
colony forming units on Colombia blood agar (CBA) after
24 h incubation at 37°C in 5% CO2 contained in these lysates              Pathway Analysis
measured in triplicate.                                                   Pathway analysis was performed from the differentially-
                                                                          expressed gene lists generated. Hypergeometric tests were
Cytokine Measurements                                                     calculated in R, using GO.db version 3.4.1 to search the Gene
Supernatants were obtained from MDM challenged with bacteria              Ontology (GO) database (32) for molecular function, cellular
and were analysed as per the manufacturers protocol using either          component, and biological process, using a p value cut off of 0.01
Tumour necrosis factor alpha (TNF-a (Ready-set-go! ™ ,                    and a minimum of 3 genes. In addition, canonical pathway
eBioscience)) or interleukin 6 (IL-6kit (Ready-set-go! ™ ,                analysis was performed using XGR (1.1.5) (33) using all of the
eBioscience)). Briefly, 96 well ELISA plates were coated with              differentially expressed probes identified by ANOVA calculated
100 mL of 1x capture antibody overnight at 4°C, washed, and               in Limma as the test background.
blocked in 200 mL assay diluent for 1 h at room temperature.
After a wash, the supernatants were then added as were the                Real Time Quantitative Polymerase Chain
standards (recombinant human TNF-a or recombinant human                   Reaction (RT-qPCR)
IL-6) and incubated for 2 h at room temperature. The wells were           The abundance of TNFa mRNA in bacterial exposed and mock-
then washed and the detection antibody (biotin-conjugated anti-           infected MDM was measured using qPCR. To perform cDNA
human TNF-a or anti-human IL-6) was added. After washing                  synthesis a high-capacity cDNA reverse transcription kit
100 mL avidin-horse radish peroxidase (HRP) was added to                  (Applied Biosystems) was used to make complementary DNA
each well for 30 min at room temperature. Plates were then                for qPCR assay as per manufacturer’s protocol. The DNA
washed, prior to adding 100uL tetramethylbenzidine substrate              products were quantified on QuantStudio5 (Abi) using GoTaq
solution for 15 min at room temperature. The reaction was                 qPCR master mix (Promega). The reactions were prepared as per
stopped by adding 2M sulphuric acid, the plate was then read at           manufacturer’s protocol.
450 nm using a Multiskan® EX plate reader (Thermo Scientific),                Fold change was calculated using Delta Delta Ct values.

Frontiers in Immunology | www.frontiersin.org                         3                                   May 2021 | Volume 12 | Article 573266
Cole et al. Epigenomic Study of Pneumolysin in Macrophages
Primers used: The samples were then dried down in Speedvac (Eppendorf).
The peptides were re-suspended in 0.1%TFA and 3% ACN and
TNFa: Forward 5' CTCTTCTGCCTGCTGCACT loaded into and run on Ultimate 3000 RSLC nano flow liquid
TG 3' chromatography system with a PepMap300 C18 trapping
Reverse 5' ATGGGCTACAGGCTTGTCAC column (Thermo Fisher), coupled to Q-Exactive HF Orbitrap
TC 3' mass spectrometer (Thermo Fisher). Peptides were eluted onto a
GAPDH: Forward 5' TGCACCACCAACTGCTTA 50 cm x 75 mm Easy-spray PepMap C18 column with a flow rate
GC 3' of 300 nL/min as previously described (35). Peptides were eluted
using a gradient of 3% to 35% solvent B over 75 min. Solvents
Reverse 5' GGCATGGACTGTGGTCATG
were composed of 0.1% formic acid (FA) and either 3%
AG 3'
acetonitrile (ACN) (Solvent A) or 80% ACN (Solvent B). The
Actin: Forward 5' CCTTTGCCGATCCGCCG 3' loading solvent was 0.1% TFA and 3% ACN. Data acquisition
Reverse 5' GATATCATCATCCATGGTGAG was performed in full scan positive mode, scanning 375 to
CTGG 3' 1500m/z, with an MS1 resolution of 120 000, and AGC target
PTGS2 Forward 5’ CGGTGAAACTCTGGCTAGG of 1x10⁶. The top 10 most intense ions from MS1 scan were
GA 3' selected for Collision induced dissociation. MS2 resolution was
Reverse 5' GCAAACCGTAGATGCTCAGG of 30 000 with AGC target of 1x10⁵ and maximum fill time of 60
GA 3' ms, with an isolation window of 2 m/z and scan range of 200-
C-JUN Forward 5' CCTTGAAAGCTCAGAACTCGG 2000 m/z and normalised collision energy of 27.
AG 3'
MaxQuant Data Analysis
Reverse 5' TGCTGCGTTAGCATGAGTTG
The raw data from the MS were analysed in MaxQuant (version
GC 3'
1.5.6.5). The database search engine Andromeda was used to
IL1RN Forward 5’ ATGGAGGGAAGATGTGCCTG search the spectra against the UniProt database. The search
TC 3' settings were as follows: trypsin/P digestion, with up to 2
Reverse 5' GTCCTGCTTTCTGTTCTCGC missed cleavages, fixed modification was carbamidomethyl (C),
TC 3' variable modifications were oxidation (M) and acetylation
NR4A2 Forward 5’ AAACTGCCCAGTGGACAAGC (Protein N-term), Label Free Quantification (LFQ) was
GT 3' performed with a minimum number of neighbours of 3 and
Reverse 5' GCTCTTCGGTTTCGAGGGCA average number of neighbour of 6. Peptide tolerance was set at
AA 3' 4.5 ppm and minimum peptide length was set at 7, amino acid
maximum peptide mass was set at 4600 Da and Protein FDR was
set at 0.01. Downstream analysis was performed in R version
Quantitative Proteomics 3.4.0. The protein identification files were read in, results
Protein lysates were digested with trypsin in conjunction with matching to a reverse sequence database and or those
the Filter aided separation protocol (FASP) (34). Briefly, cells matching to a contaminant database were removed as were
were lysed in 150 µL of 4% Sodium dodecyl sulphate (Sigma), those with less than 2 unique peptides. The label-free
100 mM Tris HCl (Sigma) pH 7.6, 0.1 M Dithiothreitol (Sigma) intensities were then median-corrected for each sample and
and quantified using a BioRad DC assay as per the log2 transformed. Differential protein expression was
manufacturer’s protocol. 100 µg of protein lysates were mixed calculated using Limma version 3.32.2. a repeated measures
with 200 µL of 8 M urea dissolved in triethylammonium ANOVA to enable comparison to the microarray analysis (36).
bicarbonate (TEAB) and added to the filter mounted in 11.5
mL low-bind Eppendorf. The tubes were centrifuged at 14 000 g Histone Extraction
for 30 min, the flow through discarded and further two 200 µL Histone extraction was performed as previously described (37).
washes in 8M urea were performed. Then 100 µL 0.5 M Briefly, MDMs were washed in PBS and scrapped in ice cold PBS
iodoacetic acid was added for 20 min at room temperature and with 1x protease inhibitors (Roche Complete EDTA free), before
then centrifuged at 14 000 g for 30 min. The flow-through was being pelleted at 900g for 10 min. Cell pellets were lysed in
discarded. The membrane was washed three times with 100 µL of hypotonic lysis solution then re-suspended in 400 µL 0.2 M
8 M urea, followed by three washes 100 mM TEAB. The lysates H2SO4. The histones were precipitated out by adding 132uL of
were trypsin digested overnight at 37°C. The digested proteins 6.1N TCA to the supernatant and washed in acetone then
were eluted in 120 µL 100mM TEAB. The samples were then resuspended in 100 mL of water (HPLC grade). Samples then
desalted using Hypersep Hypercarb™ (ThermoScientific) tips underwent chemical derivatisation as previously described (38).
following the manufacturer’s protocol. Briefly, tips were primed 10 mL of 100 mM ammonium bicarbonate pH 8 and 4 ml of
with elution solution (60% Acetonitrile 0.1% TFA) then washed ammonium hydroxide was added to 10 mg of histone sample.
in 0.1% TFA. The sample was then re-suspended on the tip by Then 10 mL of propionic anhydride in isopropanol (1:3 ratio) was
pipetting up and down 50 times. The tip was cleaned in 0.1% added and 100% ammonium hydroxide used to keep the pH >8.0.
TFA, eluted 60% ACN 0.1% TFA and then 90% ACN 0.1% TFA. The sample was incubated at 37°C for 15 min. Then it was
Frontiers in Immunology | www.frontiersin.org 4 May 2021 | Volume 12 | Article 573266Cole et al. Epigenomic Study of Pneumolysin in Macrophages
dried down in a vacuum centrifuge (Concentrator plus, Technologies). After equilibration, the cartridge containing
Eppendorf) and the process repeated. The samples were re- the oxygen sensor, measuring the oxygen consumption rate
suspended in 40 mL of 100 mM ammonium bicarbonate and (OCR) and the cartridge containing the proton sensor,
then tryptically digested overnight. The digestion was stopped by measuring the extracellular acidification rate (ECAR) kinetics
addition of glacial acetic acid and freezing at -80°C for 5 min. were run before and after injecting oligomycin, FCCP and
Finally, the samples were dried down before undergoing a further rotenone plus antimycin A, respectively. Data were normalized
two rounds of proprionylation. Hypersep™ Hypercarb™ tip by total protein.
were used to desalt the samples of the chemical derivatisation
residues following the manufacturer’s protocol for Hypersep ™ DCFDA Assay
Hypercarb ™ (ThermoScientific) (28). For the measurement of reactive oxygen species (ROS) MDMs
were washed with PBS three times and incubated in fresh media
Quantitative MS Analysis of Histone PTMs with the addition of 20 mM 2′,7′-Dichlorofluorescin diacetate
The histone samples were re‐suspended in 0.1% trifluoroacetic (DCFDA, Sigma) for 30min at 37 °C with 5% CO2 then washed
acid (TFA) and were analysed on an Ultimate 3000 online nano‐ three times in PBS before being challenged with opsonised
LC system with a PepMap300 C18 trapping column Streptococcus pneumoniae at an MOI of 10 for 3 hours. The
(ThermoFisher Scientific), coupled to a Q Exactive HF cells were then washed 3 times in PBS and resuspended in 500 mL
Orbitrap (ThermoFisher Scientific). Peptides were eluted onto prior to analysis. Samples were run on an 4 colour
a 50 cm × 75 mm Easy‐spray PepMap C18 analytical column at FACSCalibur™ (BD Biosciences) using CellQuest Pro version.
35°C. Peptides were eluted at a flow rate of 300 nL/min using a 10 000 gated events were counted and Forward (FSC) and Side
gradient of 3% to 25% over 55 min then 25% to 60% until 81 min. scatter (SCC) were used to define populations. Data analysis was
Solvents were composed of 0.1% formic acid (FA) and either 3% performed in FlowJo™ software (version 10.1r5).
acetonitrile (ACN) (solvent A) or 80% ACN (solvent B). The
loading solvent was 0.1% TFA and 3% ACN run in Data Statistical Analysis
independent acquisition as previously described (35). The Statistical analysis was performed using either R for the
PTM identification and relative abundance was performed in microarray and proteomic analysis, or for all other
Skyline and Epiprofile 2.0 also as previously described (35). experiments in Prism version 7.0c (Graphpad). Data is
presented as standard deviation (SD) or standard error of the
Western Blot Analysis mean (SEM). For all experiments a minimum of 3 biological
Whole cell lysates were obtained using Laemmli buffer. Samples replicates was used. Comparison between two paired groups
were separated by SDS-PAGE (12%) and blotted onto poly- employed a paired t-test, for comparison of 3 or more conditions
vinylidene difluoride (PVDF) membranes (Bio-Rad a one-way analysis of variance (ANOVA) with Tukey’s post-test
Laboratories). Blots were incubated overnight at 4°C with was performed. For comparison of multiple observations in more
antibodies against Actin (Rabbit polyclonal, Sigma-Aldrich) or than two groups a two-way ANOVA with Tukey’s multiple
PTGS2 (Rabbit polyclonal, Cell Signalling). Protein detection comparison post-test was performed.
was carried out with horseradish peroxidase (HRP)-conjugated
secondary antibodies, goat anti-rabbit IgG (Dako, P0448, 1:2500)
and ECL substrate (GE Healthcare). Bands were quantified using RESULTS
Image J 1.32 software (v1.8, NIH). The intensity ratio of PTGS2
and actin, were calculated and normalised to the Mock Pneumolysin Shapes the Macrophage
infected samples. Transcriptome in Response to
Pneumococci
Metabolic Measurements Transcriptional responses to Gram-positive bacteria occur rapidly
The metabolic measurements were performed as previously and are well developed after three hours of bacterial challenge
described (39). Briefly, 14 day old MDM were re-seeded in (15, 18). Therefore, we initially analysed transcriptional changes
XF24 cell plates (Agilent Technologies) at 150,000 MDMs/well. in monocyte-derived macrophages (MDMs) three hours after
Cultures were then challenged with bacteria or mock-infected bacterial challenge with either wild-type or a pneumolysin
were washed twice with XF medium supplemented with 4.5 g/L deficient (Dply) strain. We confirmed that intracellular viability
D-glucose, 2.0 mM L-glutamine, 1.0 mM sodium-pyruvate, 100 of pneumococci was equivalent at this time between wild-type
U/L penicillin and 100 mg/mL streptomycin at pH 7.4 (adjusted and Dply strains (Supplemental Figure S1), thereby excluding
with 1.0 M NaOH). Next 630 mL modified XF medium was potential confounding by different levels of vita-pathogen-
added to each well and incubated for 1 h at 37·C without CO2. associated molecular pattern (40).
70 mL oligomycin A (15 mM), 77 mL FCCP (20 mM) and 85 mL We identified 1872 probe-sets that were differentially
rotenone (10 mM) plus antimycin A (10 mM) (Sigma-Aldrich) expressed in response to bacterial challenge with either strain
were added to the cartridge injection ports A, B and C, (F valueCole et al. Epigenomic Study of Pneumolysin in Macrophages
Volcano plots in Figure 1. The analysis identified 503 probe-sets, Pathway Analysis of Differentially
which are differentially expressed in a pneumolysin-dependent Expressed Genes
manner, 506 in an independent manner and 234 only in the Gene Ontology (GO) pathway analysis demonstrated that the
absence of pneumolysin (summarised Supplemental Figure S2 top ten enriched terms in the MDMs challenged with S.
and Figure 2). Of the 503 probe-sets differentially expressed in a pneumoniae were predominantly related to cell metabolism
pneumolysin dependent manner 131 were upregulated and 372 (Supplemental Figure S3 and Supplemental Table S3). As we
down regulated. The 10 upregulated probes with the highest fold have previously identified changes in the oxidative stress
changes included fatty acid binding protein 4 (FABP4) involved response in alveolar macrophages in response to challenge with
in cytokine production, and two members of the TNF receptor Streptococcus pneumoniae (29) we were also interested in the fact
superfamily (TNFRSF 9 and 4) involved in the host immune that there were a number of terms relating to cellular responses
response, and interleukin 1 receptor antagonist (IL1RN) involved to “stress” [17 in the S. pneumoniae challenge and 15 in the Dply
in signal transduction (Supplemental Table S2). The 234 genes mutant (Supplemental Table S3)] and in particular to oxidative
only differentially expressed in the absence of pneumolysin stress responses. The differentially expressed genes belonging
include 96 downregulated probe-sets and 138 upregulated to the GO term for oxidative stress response were highlighted
ones. Of the downregulated probes with the 10 highest fold for each strain (Figure 1 and Supplemental Table S4).
changes four related to DNA binding, LYL1, basic helix-loop- These results highlighted that the differentially expressed genes
helix family member (LYL1), MIS18 binding protein 1 were predominantly upregulated. Moreover, the TNF, heme
(MIS18BP1), ZFP36 ring finger protein like 2 (ZFP36L2) and oxygenase 1 (HMOX1) and prostaglandin-endoperoxide
nuclear factor of activated T cells 1 (NFATC1). Of the synthase 2 (PTGS2) genes were strongly upregulated. In order
upregulated probes with the highest fold change there were to validate the results of the microarray experiment we measured
several probes involved in inflammatory responses, cytokine the levels of mRNA for TNF, C-JUN, IL1RN, PTGS2 and NR4A2
and chemokine signalling such as C-X-C motif chemokine by qPCR in separate biological replicate (Figure 3). This
ligand (CXCL) -1, and 3, as well as interleukin 1 beta and demonstrated that pneumolysin not only blunted the TNF
alpha (Supplemental Table S2). Finally, 506 probe-sets were response but also PTGS2 expression. Furthermore, we show
differentially expressed in response to either strain. The probes that following challenge with S. pneumoniae MDM generate
coding for TNF, prostaglandin- endoperoxide synthase 2 reactive oxygen species and leads to alterations in oxidative
(PTGS2) and nuclear receptor subfamily 4 group A member 3 metabolism (Supplemental Figure S4).
(NR4A3) as well as the CXCL8 probe were amongst the 10 In addition to performing Gene ontology analysis we also
upregulated probes with the highest fold change. The analysed the differentially expressed genes using eXploring
downregulated probes included several members of the Genomic Relations (XGR), which performs hypergeometric
GTPase IMAP family (GIMAP1 and 6). enrichment analysis with background correction using the
To provide further insight into the transcriptional responses expression of monocyte derived macrophage cells to give a
in MDMs following bacterial challenge we undertook pathway more cell type specific analysis. Canonical pathway analysis
analysis of the differentially expressed genes. was performed for genes whose expression was upregulated by
A B C
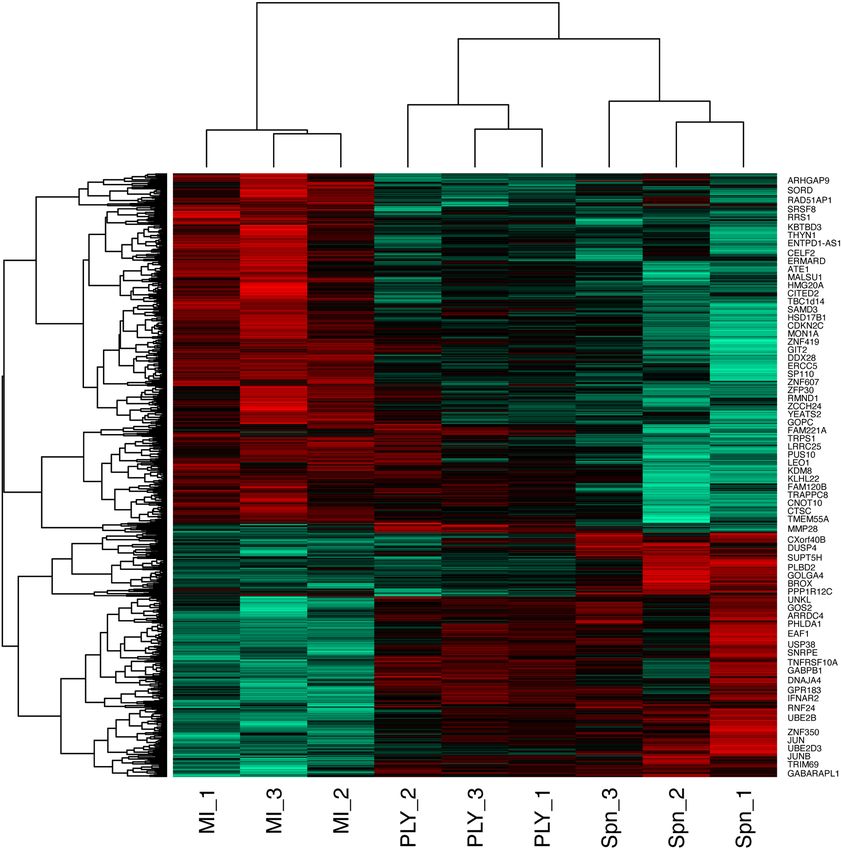
FIGURE 1 | Oxidative stress response pathway terms significantly upregulated. Monocyte derived macrophages (MDMs) were challenged with either S.
pneumoniae, the isogenic pneumolysin negative mutant (Dply) or mock infected with phosphate buffered saline (MI) in biological replicates of three. After 3 h
incubation the gene expression was measured using Affymetrix arrays. (A) volcano plots comparing log2 (fold change) to log10 p value for MI vs S. pneumoniae
challenged MDMs. (B) volcano plots comparing log2 (fold change) to log10 p value for MI vs Dply challenged MDMs. (C) volcano plots comparing log2 (fold change)
to log10 p value for S. pneumoniae vs Dply challenged MDMs. The highlighted genes belong to the Oxidative stress response Gene Ontology term and are
significantly expressed (q valueCole et al. Epigenomic Study of Pneumolysin in Macrophages FIGURE 2 | Heatmap of the differentially expressed probes following MDM challenge. Monocyte derived macrophages (MDMs) were challenged with either S. pneumoniae, the isogenic pneumolysin negative mutant (Dply) or mock-infected with phosphate buffered saline (MI) in biological replicates of three. At 3 h the gene expression was measured using Affymetrix arrays. This heatmap represents genes found to be differentially expressed (one-way ANOVA, with F p value
Cole et al.                                                                                                                           Epigenomic Study of Pneumolysin in Macrophages

Dply, further studies were performed to examine the effects of S.                                  transcripts and proteins is generally poor, we observed that
pneumoniae on the proteome of MDMs.                                                                both the transcript and the protein abundance for the vacuolar
    Label free quantitative mass spectrometry was used to identify                                 protein sorting 13 C protein (VPS13C), which is associated with
differentially expressed proteins following challenge with S.                                      mitochondrial function, were differentially expressed.
pneumoniae or Dply. We identified 1807 proteins in samples                                             We were able to measure the relative abundance of PTGS2
challenged with S. pneumoniae and 1862 in those challenged                                         by Western blotting to confirm that these prostaglandin
with Dply. On average we identified 1812 proteins in each of the                                    pathways were upregulated by challenge with S. pneumoniae
12 samples from 4 biological replicates that we analysed. Of                                       and Dply (Figure 3). Furthermore, there was significantly more
these, we identified 30 that were differentially expressed between                                  PTGS2 in response to challenge with Dply, suggesting that
the three conditions with an F statistic value of less than 0.05                                   pneumolysin was responsible for blunting of the inflammatory
(summarised in Table 1). The results show that 16 proteins                                         response as was observed with the transcriptomic analysis
are differentially expressed in response to infections with S                                      (Figure 3).
pneumoniae, and 22 in response to Dply. Of the differentially                                         Eight proteins were differentially expressed in a pneumolysin-
expressed proteins common to both bacterial challenges                                             dependent manner, these included serine/threonine protein
were Prostaglandin G/H synthase 1 (PTGS1), which is                                                kinase, oxidative stress response 1 protein (OXSR1) and
involved with PTGS2 in the production of inflammatory                                               ubiquitin domain-containing protein 1/2 (UBTD2), and 9 were
prostaglandins, and Galectin 3-binding protein, which is                                           common to both bacterial strains, including Galectin 3 binding
involved in initiating signalling cascades. In addition the                                        protein which is involved in the host immune responses (41) and
proteins Phosphoglucomutase-1 glucose which participates in                                        the 26S proteasome non-ATPase regulatory subunit 5 (PSMD5).
breakdown of glucose and Complex III assembly factor LYRM7                                         Several of the differentially expressed proteins identified such as
which is a mitochondrial chaperone were both differentially                                        PSMD5, UBTD2 and Ubiquitin conjugation factor E4 A
expressed highlighting the importance of metabolism in                                             (UBE4A) are involved in protein turnover involving a number
response to infection as illustrated by the microarray pathway                                     of pathways known to be important in the regulation of host
analysis results. In addition, although the concordance between                                    immune responses (42).

TABLE 1 | Differentially expressed proteins at 6 h following challenge with S pneumoniae or Dply.

                                                                                                                                  MI vs S pneumoniae                         MI vs Dply

protein name                                                                                  Gene name                          logFC            adj.P.Val           logFC          adj.P.Val
Prostaglandin G/H synthase 1                                                                  PTGS1                               -2.83           6.42E-03             -1.67         2.60E-02
Serine/threonine-protein kinase OSR1                                                          OXSR1                               -2.36           3.82E-04             -1.03         5.59E-02
Probable global transcription activator SNF2L2/Transcription activator BRG1                   SMARCA2/SMARCA 4                    -3.69           3.85E-04             -0.60         4.99E-01
Galectin-3-binding protein                                                                    LGALS3BP                            -2.36           1.26E-03             -1.94         2.96E-03
Ubiquitin domain-containing protein 1/2                                                       UBTD2                                2.84           2.48E-03             0.68          2.95E-01
Phosphoglucomutase-1                                                                          PGM1                                -2.19           1.42E-02             -2.69         8.14E-04
Vacuolar protein sorting-associated protein 13C                                               VPS13C                              -1.83           6.42E-03             -2.06         1.04E-03
Unconventional myosin-Ixb                                                                     MYOB9B                              -1.27           4.09E-02             -2.05         1.13E-02
Probable ATP-dependent RNA helicase DDX46                                                     DDX46                                1.69           6.42E-03             0.65          2.15E-01
Probable 28S rRNA (cytosine (4447)-C (5))-methyltransferase                                   NOP2                                 1.62           6.42E-03             0.06          9.32E-01
Coiled-coil domain-containing protein 22                                                      CCDC22                               2.54           1.23E-02             0.99          1.92E-01
Sorting nexin-8                                                                               SNX8                                 1.63           2.47E-02             -1.22         3.36E-02
Complex III assembly factor LYRM7                                                             LYRM7                                1.66           1.28E-02             1.47          9.57E-03
Motile sperm domain-containing protein 2                                                      MOSPD2                              -1.29           1.57E-02             -0.04         9.32E-01
Spectrin beta chain, non-erythrocytic 1                                                       SPTBN1                               2.52           6.42E-03             2.02          4.05E-03
6-phosphogluconolactonase                                                                     PGLS                                -1.18           2.47E-02             -0.06         9.32E-01
26S proteasome non-ATPase regulatory subunit 5                                                PSMD5                                2.76           6.14E-05             1.90          1.66E-03
Ubiquitin conjugation factor E4 A                                                             UBE4A                               -1.69           8.34E-02             3.92          7.72E-04
N(G),N(G)-dimethylarginine dimethylaminohydrolase 2                                           DDAH2                               -1.48           5.88E-02             -2.13         1.09E-03
Threonine–tRNA ligase, cytoplasmic                                                            TARS                                -1.42           6.93E-02             -2.12         9.57E-03
Haloacid dehalogenase-like hydrolase domain-containing 5                                      HDHD5                               -0.87           2.62E-01             -2.79         1.09E-03
Protein canopy homolog 2                                                                      CNPY2                               -0.88           8.56E-02             0.67          1.92E-01
Mitochondrial carrier homolog 1                                                               MTCH1                               -0.87           1.08E-01             -2.88         3.75E-04
eIF-2-alpha kinase activator GCN1                                                             GCN1                                -0.74           1.91E-01             -1.79         1.66E-03
Deoxyribonuclease-2-alpha                                                                     DNASE2                              -0.65           1.18E-01             0.09          9.00E-01
2’-deoxynucleoside 5’-phosphate N-hydrolase 1                                                 DNPH1                               -0.25           7.52E-01             -2.74         1.09E-03
Piezo-type mechanosensitive ion channel component 1                                           PIEZO1                               0.23           7.61E-01             -2.36         1.04E-03
Nuclear pore complex protein Nup155                                                           NUP155                               0.39           6.29E-01             2.01          3.27E-03
40S ribosomal protein S15a                                                                    RPS15A                               0.46           2.68E-01             1.09          1.20E-02
Methylmalonic aciduria type A protein, mitochondrial                                          MMAA                                 0.71           2.13E-01             1.94          1.66E-03

Proteins in bold and black are differentially expressed in response to challenge with both strains of bacteria, in red are highlighted the proteins only differentially expressed in response to
challenge with Dply and in blue are those that are only differentially expressed in response to challenge with Streptococcus pneumoniae.

Frontiers in Immunology | www.frontiersin.org                                                  8                                                 May 2021 | Volume 12 | Article 573266
Cole et al. Epigenomic Study of Pneumolysin in Macrophages
A B E
C D F
G
FIGURE 3 | Pneumolysin leads to repression TNF and PTGS2 production. Monocyte derived macrophages (MDMs) were challenged with either S. pneumoniae, the
isogenic pneumolysin negative mutant (Dply), or mock-infected with phosphate buffered saline (MI). After 3 h incubation RNA was extracted from MDMs and RT-
qPCR performed to measure the abundance of (A) TNF, (B) PTGS2, (C) C-JUN, (D) IL1RN and (G) NR4A2 mRNA. The Bar chart represents the DDCT fold change
for each bacterial challenge demonstrating significantly higher abundance of TNF, PTGS2, C-JUN and IL1RN mRNA following challenge with Dply. (G) There was no
significant difference in the abundance of NR4A2 mRNA in response to either bacterial challenge. (E) A representative western blot after probing with anti-PTGS2
antibody is shown, with actin used as a loading control. The blot is representative of four independent experiments. (F) Densitometry was performed to estimate the
PTGS2/actin and normalised to mock infected sample. The bar charts represent mean and Standard Deviation, n= 10 for panel (A, B). n=6 for panel (C) and n=7 for
panel (D, G); *p < 0.05, **p < 0.01.
Pneumolysin Is Responsible for Changes pneumoniae, we sought next to establish if ply also influenced
in the Relative Abundance of Histone epigenetic changes in response to S. pneumoniae. Quantitative
Post-Translational Modifications mass spectrometry was used to identify changes in the global
Having defined a pneumolysin-dependent alteration of the abundance of histone PTMs following challenge with
macrophage transcriptome and proteome in response to S. S. pneumoniae or Dply. Focussing on the most abundant
Frontiers in Immunology | www.frontiersin.org 9 May 2021 | Volume 12 | Article 573266Cole et al. Epigenomic Study of Pneumolysin in Macrophages
PTMs, methylation and acetylation, on histones H3 and H4, in epigenetic modifications could alter key ply-associated immune
MDMs in response to bacterial challenge we identified 94 responses. As a proof of concept, we pre-treated MDMs with the
different peptide proteoforms and 18 were found to change in histone deacetylase inhibitor (HDACi) vorinostat (SAHA) or
response to bacterial challenge (Figure 4). A subset of these vehicle control (DMSO) following challenge with Streptococcus
changes were ply-dependent, since they were significantly altered pneumoniae or Dply mutant and quantified TNFa release (Figure
in S. pneumoniae in comparison to the Dply mutant 6). As previously shown, challenge with the Dply mutant strain
(Supplemental Table S8). These included significant increases resulted in significantly increased TNFa levels as compared to the
in the relative abundance of H3K4me1 and H3.3K36me2 parental strain, but this level was significantly decreased in the Dply
following challenge with S. pneumoniae in comparison to Dply. mutant challenged cells by pre-treatment with vorinostat. This
In addition, we observed decreases in the relative abundance of suggests that the epigenetic modifications we observed as being
H3K9me2, H3K27me2 and H3K79me2 in a pneumolysin- induced by ply exposure could have functional consequences to
dependent manner compared to both mock infected (MI; blue) immune responses, as illustrated for TNF.
and Dply (Figure 4). Moreover, there was a pneumococcal
associated ply-independent increase in the level of H3K27me2
K36me2 and a reciprocal drop in H3K27me3K36me1. We noted
an increase in the relative abundance of H3.3K36me2 in a ply
DISCUSSION
dependent manner and an increase in the relative abundance Using a range of systems level approaches we have demonstrated
of H3K23ac and an increase in H3.3K27me2K36me1 with a that pneumolysin exerts a strong influence over the host response to
reciprocal drop in H3.3K27me2K36me2 in response to both S. pneumoniae at the transcriptomic, proteomic and epigenetic level.
bacterial challenges. We have shown that 503 probes were differentially expressed in
Further analysis of histone H4 showed a significant increase pneumolysin-dependent manner in association with global
in the abundance of acetylation on K16 (H4K16ac) in response modifications in histone PTMs. These changes are associated with
to infection with either strain (Figure 4). In addition, there was widespread changes in macrophage metabolism, oxidative stress
also a decrease in the dimethylated form of K20 (H4K20me2) responses and cytokine signalling and result in differential
and a reciprocal increase in the monomethylated form expression of key immune proteins, including TNF-a and IL-6.
(H4K20me1) in a pneumolysin-dependent manner. Crucially we show that use of a HDAC inhibitor to modify the
epigenome is sufficient to reprise the reduction in TNF identified as
Pneumolysin Blunts Inflammatory occurring in response to pneumolysin.
Signalling During Early Infection Our results on the transcriptional response of macrophages to
In order to establish the consequences of these changes to the pneumolysin are consistent with previous transcriptomic analysis in
transcriptome and epigenome, we next selected one prominent undifferentiated THP-1 cells that showed 142 genes to be
immune signature regulated by pneumolysin, TNF-a expression, differentially expressed in a ply dependent manner and 40 to be
and established this as a key component of the early immune ply independent (15). Our study in primary cells, identifies many
response to S. pneumoniae (43). Using qRT-PCR we measured more genes differentially regulated enabling more in-depth analysis
the abundance of TNFa mRNA in infected MDMs. There was a of changes at a pathway level. A number of differentially expressed
significant increase in the TNFa mRNA level following infection genes are involved in the immune response such as TNF and
with the ply deficient mutant but not the parent strain or the HMOX1. Pathway analysis of the differentially expressed probes
reconstituted mutant (Figure 5A). Next, we measured the highlighted the importance of metabolic pathways in response to
amount of secreted of TNFa in MDM supernatants following infection, and in particular the role for oxidative stress responses.
3 h of bacterial challenge (Figure 5B). We found that TNFa The host’s oxidative stress responses have been highlighted as
levels were significantly higher following challenge with the Dply playing a key role in the host response to S pneumoniae in lung
mutant suggesting that ply initially blunts TNF-a expression. epithelial cells (44). Importantly, this module is upregulated in
Finally, we measured the concentration of TNFa and IL-6 alveolar macrophages (AM) and plays a key role in preserving
over time using ELISA assays to determine if this initial anti- responses such as phagocytosis which may otherwise be altered by
inflammatory effect was maintained (Figure 5C). The results dysregulated oxidative stress in AM and MDM (7, 45).
showed that the difference seen in the release of TNF-a, was only Furthermore, nuclear factor erythroid 2 (NRF2) plays a pivotal
observed at an early time window, 3-5 h after exposure to role in the protection against lung injury (46), reduces lung
bacteria. In addition there was a similar trend observed with inflammation after intratracheal instillation of LPS and decreases
the inflammatory cytokine IL-6. This suggests that the anti- mortality in systemic models of inflammation (47). Crucially,
inflammatory effect of pneumolysin only plays a role over a NRF2-regulated pathways are amenable to therapeutic
defined time period. manipulation as evidenced by improved AM phagocytosis in
patients with chronic obstructive pulmonary disease following ex
Histone Deacetylase Inhibitors Reduce vivo treatment with NRF2 agonists and also in a mouse model of
TNFa Cytokines in Response to Infection cigarette smoke associated impairment of bacterial clearance in the
Having previously demonstrated that pneumolysin both modifies lung (48). The XGR pathway analysis following bacterial challenge
macrophage transcriptome and epigenome we next tested if further highlighted NFkB, NOD-like receptor and TNF signalling as
Frontiers in Immunology | www.frontiersin.org 10 May 2021 | Volume 12 | Article 573266Cole et al. Epigenomic Study of Pneumolysin in Macrophages
A C
B D
E F
G H
FIGURE 4 | Continued
Frontiers in Immunology | www.frontiersin.org 11 May 2021 | Volume 12 | Article 573266Cole et al. Epigenomic Study of Pneumolysin in Macrophages
FIGURE 4 | Pneumolysin is responsible for changes in relative abundance of PTMs on histone H3 and H4. Monocyte derived macrophages (MDMs) were
challenged with either S. pneumoniae, the isogenic pneumolysin negative mutant (Dply) or mock infected with phosphate buffered saline (MI) in biological replicates of
three. After 3 h incubation the histones were extracted and analysed by mass spectrometry and the relative abundance of each post translational modification (PTM)
was measured for each peptide. The bar plots represent the relative abundance of each PTM quantified, blue represents the abundance in MI MDMs, green
following challenge with S. pneumoniae and in red to Dply. (A) Peptide TKQTAR shows an increase in the level of H3K4me1. (B) Peptide KSTGGKAPR shows a
decrease in the level of H3K9me2 in a pneumolysin-dependent manner. (C) Peptide KQLATKAAR shows a relative increase in the level of H3K23ac in response to
both bacterial challenges. (D) Peptide KSAPATGGVKKPHR shows a decrease in H3K27me2 following challenge with S. pneumoniae compared to MI, an increase in
the level of H3K27me2K36me2 and a reciprocal drop in H3K27me3K36me1 in response to Dply challenge compared to MI. (E) Peptide EIAQDFKTDLR shows an
increase in the relative abundance of H3K79me2 following challenge with Dply. (F) Peptide KSAPSTGGVKKPHR of H3.3 shows an increase in H3.3K36me2 and in
H3.3K27me2K36me1 with a reciprocal drop in H3.3K27me2K36me2. (One-way ANOVA, *p < 0.05, **p < 0.01, ***p < 0.001, error bars represent mean and
standard deviation). (G) Peptide GKGGKGLGKGGAKR shows a relative increase in the level of H4K16ac following challenge with S. pneumoniae in comparison to
the Dply. (H) Peptide KVLR shows a decrease in the level of H4K20me2 in a pneumolysin-dependent manner compared and a reciprocal increase in the
H4K20me1. Conversely for the MDM challenged with Dply there was a rise in H4K20me2 and a fall in the level of H4K20me1. (n=3. One way ANOVA, *p < 0.05,
**p < 0.01, ***p < 0.001, ****p < 0.0001).
C
A B
FIGURE 5 | Pneumolysin leads to blunted TNFa release by repressing mRNA production. Monocyte derived macrophages (MDMs) were challenged with either S.
pneumoniae, the isogenic pneumolysin negative mutant (Dply), the isogenic pneumolysin negative mutant with reconstituted pneumolysin (ply-Dply). or mock-infected
with phosphate buffered saline (MI). (A) After 3 h incubation RNA was extracted from MDMs and RT-qPCR performed to measure the abundance of TNFa mRNA.
The Bar chart represents the DCT fold change for each bacterial challenge demonstrating significantly higher abundance of TNFa mRNA following challenge with
Dply. (n= 6 One-way ANOVA F statistic =0.01 and p valueCole et al. Epigenomic Study of Pneumolysin in Macrophages
regulation of the oxidative response and cellular metabolism in
response to infection may allow the development of more targeted
approach to immunomodulation.
The functional consequences of the net changes to
transcriptional responses involving inflammatory cell signalling
and regulation of protein expression were examined focusing on
TNF-a as an exemplar early response cytokine that plays a key role
against S. pneumoniae (43). We selected this cytokine since ply
induced a significant temporal reduction in production of TNF-a,
in conjunction with decreased production of IL-6. Our
demonstration that pneumolysin inhibits the early production
of TNF-a is consistent with the findings others have reported
in dendritic cells and murine AM (16). We were able to
demonstrate that changes in the epigenetic landscape are
sufficient to reverse the maximal induction of TNF-a production
observed following challenge with the ply-deficient mutant. These
experiments, using a HDACi, suggest that blunting of TNF-a
release by MDM following challenge with a pneumococcal strain
expressing ply could be mediated through epigenetic mechanisms.
This is important since early response cytokine generation is critical
to the outcome of infection in S. pneumoniae and any modulation
through reshaping the epigenetic landscape would be anticipated to
have major consequences to the outcome of infection. Of note, the
HDAC inhibitor Cambinol has been shown to inhibit TNF and IL-6
FIGURE 6 | The HDAC inhibitor Vorinostat suppresses TNFa levels to similar secretion in bone marrow-derived macrophages stimulated with
levels as pneumolysin. Monocyte derived macrophages (MDMs) were LPS and was associated with greater survival in a murine lethal
challenged with either S. pneumoniae, the isogenic pneumolysin negative endotoxemia model and in response to Klebsiella pneumoniae
mutant (Dply) or mock infected with phosphate buffered saline (MI) in the challenge (51). In this case the therapeutic intervention was
presence of 3 mM vorinostat (SAHA) or vehicle control (0.5% DMSO). The Bar
chart and standard deviation represents the levels of TNFa in the
thought to limit excessive cytokine responses whereas in the case
supernatants demonstrating that suppression of TNFa can be mimicked by of ply we would suggest it may limit early cytokine responses
SAHA to similar levels as in the presence of ply. (n=8 **p < 0.007 *p < 0.05). required to enhance early pathogen control. This emphasizes that in
line with other aspects of host modulation through epigenetic
manipulation would require careful calibration.
based approaches. Interestingly several of these modifications are In summary our findings using a range of systems levels
associated with activating or repressing gene transcription. approaches show that pneumolysin modifies the early host
Although some histone PTMs are well characterised in a number response of macrophages to S. pneumoniae through
of systems, their exact function in the context of infections is yet to modification of inflammatory responses, resistance to oxidative
be fully described. It is likely to vary between cell types. stress and metabolic responses. We observe that these
Furthermore, individual PTMs will not act in isolation but rather transcriptional responses and the differential protein expression
be part of a combinatorial code fine tuning responses to are associated with global changes in histone PTMs. We show
environmental stressors, such as to bacterial infection and at later alteration of the epigenetic landscape has functional consequences
time points after exposure to consequences such as DNA damage. to key immune responses such as TNF-a production and suggest
Nevertheless, in light of the changes observed in response to that ply exerts these effects through epigenetic modulation and
challenge with S. pneumoniae (e.g. increases in H3K4me1, regulation of histone acetylation status. Our results also hint at a
H3K23ac or H4K16ac and decreases in H3K9me2 or H3K79me2) potential route by which these early host responses can be altered
it is possible that these changes represent the removal of repressive to improve responses to infection through the use of agents that
marks and the increase in marks associated with active gene modulate the enzymes that induce the signature pathogen-
transcription allowing fine tuning of the innate immune host mediated epigenetic marks that adversely impact host responses.
response to bacteria to occur. This highlights the important role
played by PTMs in the response to infection and therefore offer the
potential for the novel use of therapeutic approaches involving
immunomodulation of host responses. However, our current study DATA AVAILABILITY STATEMENT
does not establish a direct connection between the histone PTMs
and the functional consequences identified. Future work to identify The datasets presented in this study can be found in online
these such as Chromatin Immunoprecipitation and sequencing will repositories. The data presented in the study are deposited
enable the integration of histone PTMs changes at the gene level and in the ArrayExpress repository, accession number E-MTAB-9055:
in combination with further work to explore the epigenetic https://www.ebi.ac.uk/arrayexpress/experiments/E-MTAB-9055/.
Frontiers in Immunology | www.frontiersin.org 13 May 2021 | Volume 12 | Article 573266Cole et al. Epigenomic Study of Pneumolysin in Macrophages
(MDMs) were challenged with either S. pneumoniae, the isogenic pneumolysin
ETHICS STATEMENT negative mutant (Dply) or the isogenic pneumolysin negative mutant with
reconstituted pneumolysin (ply-Dply). At 3 h the number of viable intracellular
The studies involving human participants were reviewed and
bacteria was determined. The results are expressed as mean and log10 of cfu/mL
approved by South Sheffield Regional Ethics committee (07/ and represented as bar chart with standard deviation. (n=3, one way ANOVA
Q2305/7). The patients/participants provided their written p=0.99)
informed consent to participate in this study.
Supplementary Figure 2 | Venn Diagram representing the overlap in differentially
expressed genes.
AUTHOR CONTRIBUTIONS Supplementary Figure 3 | Gene ontology biological processes enriched terms
show stress responses and metabolism are over-represented. Monocyte derived
JC: conceptualization, funding acquisition, investigation, writing macrophages (MDMs) were challenged with either S. pneumoniae, the isogenic
pneumolysin negative mutant (Dply) or mock-infected with phosphate buffered
original draft, and review and editing. AA: investigation and
saline (MI) in biological replicates of three. At 3 h the gene expression was measured
review and editing. RE: formal analysis and review and editing. using Affymetrix arrays. The bubble plot shows the top ten enriched Gene Ontology
TM: investigation and review and editing. MD: funding (GO) biological processes terms in both the pneumolysin mutant and the parental
acquisition, conceptualization, supervision, and writing strain analysis. The bubble size and colour correspond to the number of genes that
and editing. DD: conceptualization, funding acquisition, have mapped to the GO term. The bubbles are plotted along the x axis according to
the –log10 p value for the enrichment.
supervision, and writing and editing. All authors contributed
to the article and approved the submitted version. Supplementary Figure 4 | Metabolic profile of MDMs following S. pneumoniae
challenge. MDMs were challenged with S. pneumoniae or mock-infected with
phosphate buffered saline (MI) in four biological replicates for 3 hours. The
extracellular acidification rate (ECAR) and mitochondrial oxygen consumption
FUNDING rate (OCR) was measured by the Seahorse X24 extracellular flux analyser.
(A) representative plots for the OCR kinetic data (B) basal OCR, (C) maximum
JC was supported by The Wellcome Trust who funded this respiration capacity, (D) DCFDA Reactive Oxygen Species measured by flow
work (WT104437/Z/14/Z). DD was supported by MRC cross cytometry. Data are shown as mean ± SD, n=4. Paired t test, *pCole et al. Epigenomic Study of Pneumolysin in Macrophages
Permeabilization and Executes Apoptosis by Distinct Mechanisms Without 26. Collini PJ, Bewley MA, Mohasin M, Marriott HM, Miller RF, Geretti A-M,
Membrane Pore Formation. mBio (2014) 5(5):e01710–4. doi: 10.1128/ et al. Hiv Gp120 in the Lungs of Antiretroviral Therapy–Treated Individuals
mBio.01710-14 Impairs Alveolar Macrophage Responses to Pneumococci. Am J Respir Crit
8. Benton KA, Everson MP, Briles DE. A Pneumolysin-Negative Mutant of Care Med (2018) 197(12):1604–15. doi: 10.1164/rccm.201708-1755OC
Streptococcus Pneumoniae Causes Chronic Bacteremia Rather Than Acute 27. Gordon SB, Irving GRB, Lawson RA, Lee ME, Read RC. Intracellular
Sepsis in Mice. Infect Immun (1995) 63(2):448–55. doi: 10.1128/IAI.63.2.448- Trafficking and Killing of Streptococcus Pneumoniae by Human Alveolar
455.1995 Macrophages are Influenced by Opsonins. Infect Immun (2000) 68(4):2286–
9. Zafar MA, Wang Y, Hamaguchi S, Weiser JN. Host-to-Host Transmission 93. doi: 10.1128/IAI.68.4.2286-2293.2000
of Streptococcus Pneumoniae is Driven by Its Inflammatory Toxin, 28. Minshull TC, Cole J, Dockrell DH, Read RC, Dickman MJ. Analysis of
Pneumolysin. Cell Host Microbe (2017) 21(1):73–83. doi: 10.1016/j.chom. Histone Post Translational Modifications in Primary Monocyte Derived
2016.12.005 Macrophages Using Reverse Phase×Reverse Phase Chromatography in
10. Paton JC, Rowan-Kelly B, Ferrante A. Activation of Human Complement by Conjunction With Porous Graphitic Carbon Stationary Phase. J Chromatogr A
the Pneumococcal Toxin Pneumolysin. Infect Immun (1984) 43(3):1085–7. (2016) 1453:43–53. doi: 10.1016/j.chroma.2016.05.025
doi: 10.1128/IAI.43.3.1085-1087.1984 29. Bewley MA, Budd RC, Ryan E, Cole J, Collini P, Marshall J, et al. Opsonic
11. Quin LR, Moore QC, McDaniel LS. Pneumolysin, Pspa, and Pspc Contribute Phagocytosis in Chronic Obstructive Pulmonary Disease is Enhanced by Nrf2
to Pneumococcal Evasion of Early Innate Immune Responses During Agonists. Am J Respir Crit Care Med (2018) 198(6):739–50. doi: 10.1164/
Bacteremia in Mice. Infect Immun (2007) 75(4):2067–70. doi: 10.1128/ rccm.201705-0903OC
IAI.01727-06 30. Wilson CL, Miller CJ. Simpleaffy: A Bioconductor Package for Affymetrix
12. McNeela EA, Burke Á , Neill DR, Baxter C, Fernandes VE, Ferreira D, et al. Quality Control and Data Analysis. Bioinforma Oxf Engl (2005) 21(18):3683–
Pneumolysin Activates the NLRP3 Inflammasome and Promotes 5. doi: 10.1093/bioinformatics/bti605
Proinflammatory Cytokines Independently of TLR4. PloS Pathog (2010) 6 31. Bolstad BM, Collin F, Brettschneider J, Simpson K, Cope L, Irizarry RA, et al.
(11):e1001191. doi: 10.1371/journal.ppat.1001191 Quality Assessment of Affymetrix Genechip Data. In: R Gentleman, VJ Carey,
13. Fang R, Tsuchiya K, Kawamura I, Shen Y, Hara H, Sakai S, et al. Critical Roles W Huber, RA Irizarry, S Dudoit, editors. Bioinformatics and Computational
of ASC Inflammasomes in Caspase-1 Activation and Host Innate Resistance Biology Solutions Using R and Bioconductor. New York, NY: Springer (2005).
to Streptococcus Pneumoniae Infection. J Immunol Baltim Md 1950 (2011) p. 33–47. Available at: 10.1007/0-387-29362-0_3
187(9):4890–9. doi: 10.4049/jimmunol.1100381 32. Ashburner M, Ball CA, Blake JA, Botstein D, Butler H, Cherry JM, et al. Gene
14. Houldsworth S, Andrew PW, Mitchell TJ. Pneumolysin Stimulates Ontology: Tool for the Unification of Biology. Nat Genet (2000) 25(1):25–9.
Production of Tumor Necrosis Factor Alpha and Interleukin-1 Beta by doi: 10.1038/75556
Human Mononuclear Phagocytes. Infect Immun (1994) 62(4):1501–3. doi: 33. Fang H, Knezevic B, Burnham KL, Knight JC. XGR Software for Enhanced
10.1128/IAI.62.4.1501-1503.1994 Interpretation of Genomic Summary Data, Illustrated by Application to
15. Rogers PD, Thornton J, Barker KS, McDaniel DO, Sacks GS, Swiatlo E, et al. Immunological Traits. Genome Med (2016) 8(1):129. doi: 10.1186/s13073-
Pneumolysin-Dependent and -Independent Gene Expression Identified by 016-0384-y
Cdna Microarray Analysis of THP-1 Human Mononuclear Cells Stimulated 34. Wiś niewski JR, Zougman A, Nagaraj N, Mann M. Universal Sample
by Streptococcus Pneumoniae. Infect Immun (2003) 71(4):2087–94. doi: Preparation Method for Proteome Analysis. Nat Methods (2009) 6(5):359–
10.1128/IAI.71.4.2087-2094.2003 62. doi: 10.1038/nmeth.1322
16. Subramanian K, Neill DR, Malak HA, Spelmink L, Khandaker S, Marchiori 35. Cole J, Hanson EJ, James DC, Dockrell DH, Dickman MJ. Comparison of
GDL, et al. Pneumolysin Binds to the Mannose Receptor C Type 1 (MRC-1) Data-Acquisition Methods for the Identification and Quantification of
Leading to Anti-Inflammatory Responses and Enhanced Pneumococcal Histone Post-Translational Modifications on a Q Exactive HF Hybrid
Survival. Nat Microbiol (2019) 4(1):62. doi: 10.1038/s41564-018-0280-x Quadrupole Orbitrap Mass Spectrometer. Rapid Commun Mass Spectrom
17. Eskandarian HA, Impens F, Nahori M-A, Soubigou G, Coppé e J-Y, Cossart P, (2019) 33(10):897–906. doi: 10.1002/rcm.8401
et al. A Role for SIRT2-Dependent Histone H3K18 Deacetylation in Bacterial 36. Goeminne LJE, Gevaert K, Clement L. Peptide-Level Robust Ridge Regression
Infection. Science (2013) 341(6145):1238858. doi: 10.1126/science.1238858 Improves Estimation, Sensitivity, and Specificity in Data-Dependent
18. Hamon MA, Batsché E, Ré gnault B, Tham TN, Seveau S, Muchardt C, et al. Quantitative Label-Free Shotgun Proteomics. Mol Cell Proteomics (2016) 15
Histone Modifications Induced by a Family of Bacterial Toxins. Proc Natl (2):657–68. doi: 10.1074/mcp.M115.055897
Acad Sci U S A (2007) 104(33):13467–72. doi: 10.1073/pnas.0702729104 37. Shechter D, Dormann HL, Allis CD, Hake SB. Extraction, Purification and
19. Rolando M, Sanulli S, Rusniok C, Gomez-Valero L, Bertholet C, Sahr T, Analysis of Histones. Nat Protoc (2007) 2(6):1445–57. doi: 10.1038/
et al. Legionella Pneumophila Effector Roma Uniquely Modifies Host nprot.2007.202
Chromatin to Repress Gene Expression and Promote Intracellular Bacterial 38. Garcia BA, Mollah S, Ueberheide BM, Busby SA, Muratore TL, Shabanowitz J,
Replication. Cell Host Microbe (2013) 13(4):395–405. doi: 10.1016/ et al. Chemical Derivatization of Histones for Facilitated Analysis by Mass
j.chom.2013.03.004 Spectrometry. Nat Protoc (2007) 2(4):933–8. doi: 10.1038/nprot.2007.106
20. Berger SL. The Complex Language of Chromatin Regulation During 39. Bewley MA, Preston JA, Mohasin M, Marriott HM, Budd RC, Swales J, et al.
Transcription. Nature (2007) 447(7143):407–12. doi: 10.1038/nature05915 Impaired Mitochondrial Microbicidal Responses in Chronic Obstructive
21. Jenuwein T, Allis CD. Translating the Histone Code. Science (2001) 293 Pulmonary Disease Macrophages. Am J Respir Crit Care Med (2017) 196
(5532):1074–80. doi: 10.1126/science.1063127 (7):845–55. doi: 10.1164/rccm.201608-1714OC
22. Cole J, Morris P, Dickman MJ, Dockrell DH. The Therapeutic Potential of 40. Sander LE, Davis MJ, Boekschoten MV, Amsen D, Dascher CC, Ryffel B, et al.
Epigenetic Manipulation During Infectious Diseases. Pharmacol Ther (2016) Detection of Prokaryotic Mrna Signifies Microbial Viability and Promotes
167:85–99. doi: 10.1016/j.pharmthera.2016.07.013 Immunity. Nature (2011) 474(7351):385–9. doi: 10.1038/nature10072
23. Ding S-Z, Fischer W, Kaparakis-Liaskos M, Liechti G, Merrell DS, Grant PA, 41. Breuilh L, Vanhoutte F, Fontaine J, van Stijn CMW, Tillie-Leblond I,
et al. Helicobacter Pylori-Induced Histone Modification, Associated Gene Capron M, et al. Galectin-3 Modulates Immune and Inflammatory
Expression in Gastric Epithelial Cells, and Its Implication in Pathogenesis. Responses During Helminthic Infection: Impact of Galectin-3 Deficiency
PloS One (2010) 5(4):e9875. doi: 10.1371/journal.pone.0009875 on the Functions of Dendritic Cells. Infect Immun (2007) 75(11):5148–57.
24. Dong W, Rasid O, Chevalier C, Connor M, Eldridge MJG, Hamon MA. doi: 10.1128/IAI.02006-06
Streptococcus Pneumoniae Infection Promotes Histone H3 Dephosphorylation 42. Hu H, Sun S-C. Ubiquitin Signaling in Immune Responses. Cell Res (2016) 26
by Modulating Host PP1 Phosphatase. Cell Rep (2020) 30(12):4016–26.e4. doi: (4):457–83. doi: 10.1038/cr.2016.40
10.1016/j.celrep.2020.02.116 43. Jones MR, Simms BT, Lupa MM, Kogan MS, Mizgerd JP. Lung NF-Kappa b
25. Connor MG. The Histone Demethylase KDM6B Fine-Tunes the Host Activation and Neutrophil Recruitment Require IL-1 and TNF Receptor
Response to Streptococcus Pneumoniae. Nat Microbiol (2021) 6:24. doi: Signaling During Pneumococcal Pneumonia. J Immunol (2005) 175
10.1038/s41564-020-00805-8 (11):7530–5. doi: 10.4049/jimmunol.175.11.7530
Frontiers in Immunology | www.frontiersin.org 15 May 2021 | Volume 12 | Article 573266You can also read