Altered endothelial dysfunction related miRs in plasma from ME/CFS patients
←
→
Page content transcription
If your browser does not render page correctly, please read the page content below
www.nature.com/scientificreports
OPEN Altered endothelial
dysfunction‑related miRs in plasma
from ME/CFS patients
J. Blauensteiner1, R. Bertinat2, L. E. León3, M. Riederer1, N. Sepúlveda4,5,6 &
F. Westermeier1,7*
Myalgic encephalomyelitis/chronic fatigue syndrome (ME/CFS) is a complex disease characterized by
unexplained debilitating fatigue. Although the etiology is unknown, evidence supports immunological
abnormalities, such as persistent inflammation and immune-cell activation, in a subset of patients.
Since the interplay between inflammation and vascular alterations is well-established in other
diseases, endothelial dysfunction has emerged as another player in ME/CFS pathogenesis. Endothelial
nitric oxide synthase (eNOS) generates nitric oxide (NO) that maintains endothelial homeostasis.
eNOS is activated by silent information regulator 1 (Sirt1), an anti-inflammatory protein. Despite
its relevance, no study has addressed the Sirt1/eNOS axis in ME/CFS. The interest in circulating
microRNAs (miRs) as potential biomarkers in ME/CFS has increased in recent years. Accordingly, we
analyze a set of miRs reported to modulate the Sirt1/eNOS axis using plasma from ME/CFS patients.
Our results show that miR-21, miR-34a, miR-92a, miR-126, and miR-200c are jointly increased in ME/
CFS patients compared to healthy controls. A similar finding was obtained when analyzing public miR
data on peripheral blood mononuclear cells. Bioinformatics analysis shows that endothelial function-
related signaling pathways are associated with these miRs, including oxidative stress and oxygen
regulation. Interestingly, histone deacetylase 1, a protein responsible for epigenetic regulations,
represented the most relevant node within the network. In conclusion, our study provides a basis to
find endothelial dysfunction-related biomarkers and explore novel targets in ME/CFS.
Myalgic encephalomyelitis/chronic fatigue syndrome (ME/CFS) is a debilitating multisystem disease of unknown
etiology, characterized by an unexplained persistent fatigue not improved by rest, unrefreshing sleep, cogni-
tive impairment, post-exertional malaise, chronic pain, gastrointestinal symptoms, and orthostatic intolerance.
Symptoms can persist for years, and most patients never return to their normal functioning before disease onset,
which decreases their quality of life. Unfortunately, there is no single biomarker available for accurate clinical
assessment of ME/CFS patients, and its diagnosis is based on the exclusion of other pathologies, leading to a high
rate of under-diagnosed cases1. Therefore, advancing our understanding of ME/CFS is critical for the develop-
ment of objective diagnostic biomarkers and specific treatments.
Despite the pathophysiological mechanism is still unclear, a growing body of evidence has been associating
ME/CFS with immunological abnormalities and inflammation in a subset of p atients2,3. Endothelial cells (ECs)
are actively involved in the regulation of the immune s ystem4 and endothelial dysfunction (ED) is linked to
inflammation and oxidative s tress5. By releasing nitric oxide (NO), ECs regulate the vascular tone to enable an
adequate blood and oxygen supply to tissues throughout the body. Conversely, inadequate NO production is a
major cause of E D6. Recently, two studies have reported ED in vivo in ME/CFS p atients7,8, supporting previous
evidence of vascular a bnormalities9 and reinforcing the assumption that ED is another piece of this complex
pathophysiological puzzle.
1
Institute of Biomedical Science, Department of Health Studies, FH Joanneum University of Applied Sciences,
Graz, Austria. 2Centro de Microscopía Avanzada, CMA‑BIO BIO, Facultad de Ciencias Biológica, Universidad de
Concepción, Concepción, Chile. 3Instituto de Ciencias Biomédicas, Facultad de Ciencias de La Salud, Universidad
Autónoma de Chile, Santiago, Chile. 4Department of Infection Biology, Faculty of Infectious and Tropical Diseases,
London School of Hygiene and Tropical Medicine, London, UK. 5CEAUL - Centro de Estatística e Aplicações da
Universidade de Lisboa, Lisbon, Portugal. 6Institute of Medical Immunology, Charité‑Universitätsmedizin Berlin,
Corporate Member of Freie Universität (FU) Berlin, Humboldt-Universität Zu Berlin and Berlin Institute of Health
(BIH), Berlin, Germany. 7Centro Integrativo de Biología y Química Aplicada (CIBQA), Universidad Bernardo
O´Higgins, Santiago, Chile. *email: francisco.westermeier@fh-joanneum.at
Scientific Reports | (2021) 11:10604 | https://doi.org/10.1038/s41598-021-89834-9 1
Vol.:(0123456789)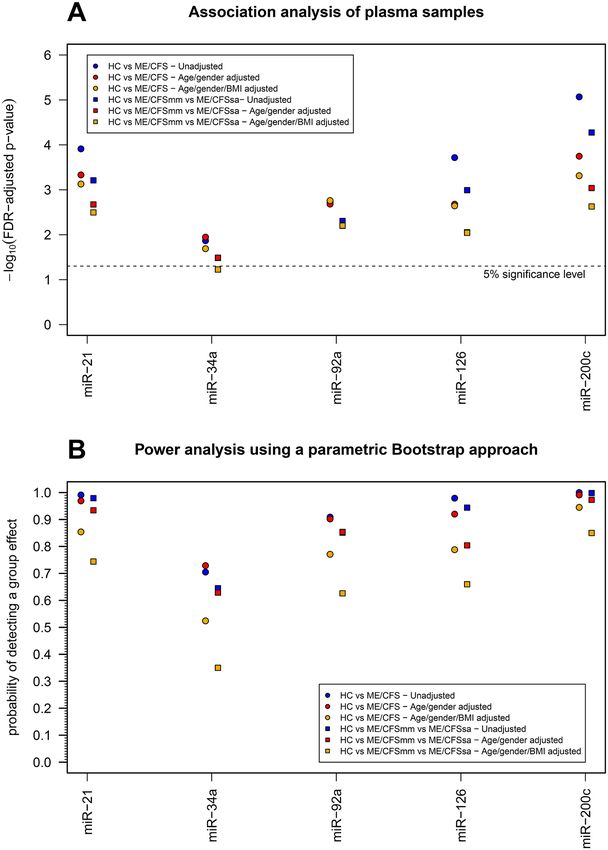
www.nature.com/scientificreports/
In healthy vessels, NO is generated from L-arginine by the endothelial isoform of nitric oxide synthase
(eNOS), in response to several stimuli including shear stress during exercise. Accordingly, eNOS-derived NO is
considered a crucial player in cardiovascular h omeostasis6. Interestingly, silent information regulator 1 (Sirt1)
reduces inflammation and oxidative s tress10 and increases the production of NO by activating eNOS in E Cs11.
Despite, the biological relevance of the Sirt1/eNOS axis both in endothelial and immune homeostasis, there are
no studies addressing potential alterations in ME/CFS.
Significant attention has recently focused on the general role of microRNAs (miRs) in the maintenance of
endothelial function12. miRs are small non-coding RNAs that are altered in many diseases and, consequently,
proposed as suitable biomarkers due to their potential to predict, diagnose, or monitor d iseases12. In this line of
thought, several miRs profiles have been reported in plasma13,14, extracellular vesicles15, and peripheral blood
mononuclear cells (PBMCs)16,17 from ME/CFS patients. However, there are no studies focused on identifying
whether endothelial dysfunction-related miRs are altered in ME/CFS.
In this work, we selected a set of five miRs (miR-21, miR-34a, miR-92a, miR-126, and miR-200c) previously
reported to regulate endothelial function via the Sirt1/eNOS axis both in ECs18–28 and observational clinical
studies22,29–32. We evaluated their expression by means of real-time PCR in plasma from mild/moderate (mm)
and severely affected (sa) ME/CFS patients compared with healthy controls (HC), considering several statisti-
cal adjustments based on the clinical-related data. In order to further support our findings, we also analyzed
their expression using available microarray data reported in PBMCs from patients with ME/CFS17. Finally, we
integrated our experimental findings by performing bioinformatics analyses to predict biological processes and
potential targets linked to the Sirt1/eNOS-related miRs in ME/CFS.
Methods
Samples and clinical data. This study was approved by two independent Research Ethics Committees at
the Medical University of Graz, Austria (Reference number: 31–059 ex 18/19) and by the UCL Biobank Ethical
Review Committee-Royal Free (B-ERC-RF) London NHS Foundation Trust (Reference number: EC2018.005).
Samples were provided by the UK ME/CFS Biobank (UKMEB) in accordance with a material transfer agree-
ment signed by the London School of Hygiene & Tropical Medicine (London, UK) and the FH JOANNEUM
Gesellschaft mbH—University of Applied Sciences (Graz, Austria). All methods were performed in accordance
with relevant guidelines and regulations.
All participants included in this study signed an informed consent form before their samples were stored at
the UKMEB33. The samples included (n = 87) plasma (1 ml vial/participant) from mild/moderate (n = 28) and
severely affected (n = 30) ME/CFS patients and age-matched healthy subjects (n = 29) were collected in EDTA
blood-tubes by qualified UKMEB´s staff members. All samples were provided without patient information. Data
associated with clinical assessments were released after the study was completed: pulse oximetry; diastolic and
systolic pressure; height; waist circumference; weight; body fat (bioimpedance), body muscle (bioimpedance);
body metabolic rate; pain and fatigue (analog scale), blood tests (hemoglobin; white blood cell count; platelets;
red blood cells; hematocrit; neutrophils, lymphocytes; monocytes; eosinophils; creatinine; creatine phosphoki-
nase (CPK); C-reactive protein (CRP), questionnaires (symptoms experienced), and SF-36 Health Survey (SF-
36v2). At enrolment, all participants ages ranged from 19 to 58 years. Patients with ME/CFS were diagnosed by
a clinician according to the Canadian C onsensus34 and/or CDC-1994 (“Fukuda”)35 criteria, as determined by
the responses on the Symptoms Assessment form to confirm case definition compliance and study eligibility.
Participants exclusion criteria included have (1) used drugs in the preceding three months known to alter
immune function or taken anti-viral medications; (2) had any vaccinations in the preceding three months; (3)
had a history of acute or chronic infectious diseases such as hepatitis B and C, tuberculosis, HIV (but not herpes
virus or other retrovirus infection); (4) had another severe illness such as cancer, coronary heart disease, and
uncontrolled diabetes; (5) had a severe mood disorder; (6) been pregnant or breastfeeding in the preceding
12 months; or present morbid obesity (BMI ≥ 40). Home visits were used for recruitment of patients with mobil-
ity restrictions (severely affected) while healthy subjects and mild/moderate patients were invited to a recruiting
center for clinical assessment and blood sampling.
Total RNA isolation. Plasma aliquots were thawed in a 37 °C bath for 1 min. Then, 200 µL were used
for total RNA isolation using the miRNeasy Serum/Plasma Advanced Kit (#217,204, QIAGEN) in accordance
with the operating manual. C. elegans miR-39 miRNA mimic (#219,610, QIAGEN) was added during the RNA
extraction to monitor RNA recovery and reverse transcription efficiency. RNA aliquots of 20 µL were stored at
-80 °C.
First‑strand cDNA synthesis and real‑time PCR. miRCURY LNA RT Kit (#339,340, QIAGEN) was
used to synthesize cDNA. 2 μL of RNA were used as a template for the reverse transcription reaction (60 min at
42 °C). Then, the samples were incubated for 5 min at 95ºC to heat inactivate the reverse transcriptase (peqSTAR
2X Gradient Thermocycler, Peqlab Biotechnologie GmbH). miRCURY SYBR Green PCR Kit (#339,346, QIA-
GEN) and miRCURY LNA miRNA PCR Assays (#339,306, QIAGEN) were used to evaluate the expression
of hsa-miR-21-5p (YP00204230) (Gene ID: 406,991), hsa-miR-34a-5p (YP00204486) (Gene ID: 407,040), hsa-
miR-92a-3p (YP00204258) (Gene ID: 407,048), hsa-miR-126-3p (YP00204227) (Gene ID: 406,913), and hsa-
miR-200c-3p (YP00204482) (Gene ID: 406,985) relative to cel-miR-39-3p (YP00203952) by means of real-time
PCR. 3 μL of cDNA (diluted 1:20) were used as a template for each reaction (final volume 10 μL). PCR cycling
conditions included initial heat activation (2 min at 95 °C), 2 step cycling, denaturation (10 seg at 95 °C), com-
bined annealing/extension (1 min at 56 °C), 40 cycles, and melting curve analysis (60–95 °C). The real-time
PCR was performed in a 96-well thermocycler (StepOnePlus Real-Time PCR System, Applied Biosystems-Life
Scientific Reports | (2021) 11:10604 | https://doi.org/10.1038/s41598-021-89834-9 2
Vol:.(1234567890)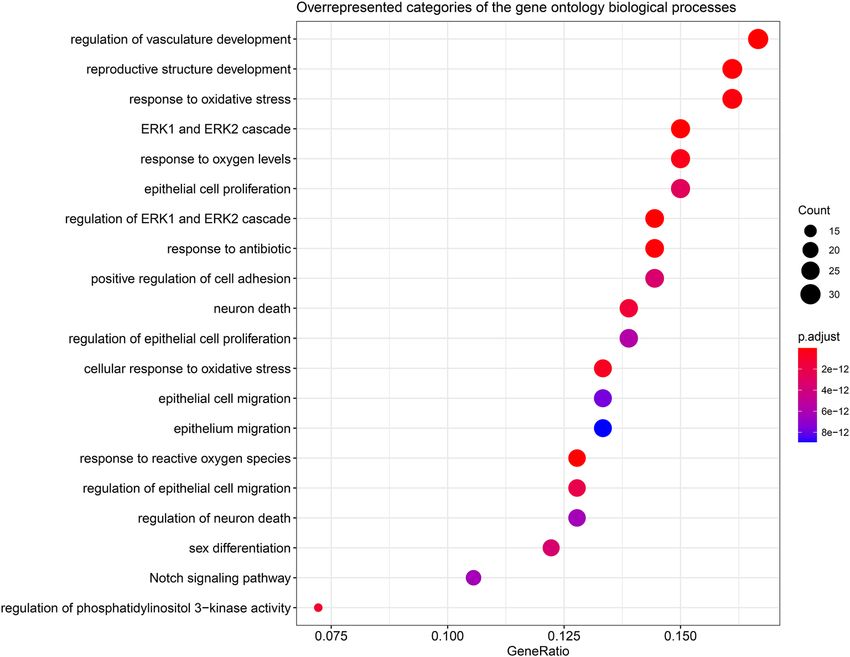
www.nature.com/scientificreports/
technologies). cel-miR-39-3p served as the normalization control, and data were analyzed with Software v2.3
(Applied Biosystems-Life technologies) to obtain miRs relative expression scores. Cycle threshold (Ct) values of
each miR were normalized to cel-miR-39-3p, and the 2 −ΔΔCt method was used to analyze the relative expression
level of miR-21-5p, hsa-miR-34a-5p, hsa-miR-92a-3p, hsa-miR-126-3p, and hsa-miR-200c-3p in plasma sam-
ples from ME/CFSmm, ME/CFSsa patients and HCs.
Statistical analysis of the UKMEB data derived from plasma. To compare basic characteristics
between HC and patients with ME/CFS, t-tests for two independent groups were used for normally distributed
data. The Mann–Whitney rank test for two independent groups was used otherwise. Given that CRP data had
many values below the detection limit of 1, a linear regression based on truncated log-normal distribution was
used to compare the different groups under analysis. In this analysis, it was fitted to two models, one including an
intercept and a group variable and another one including an intercept only. These models were then compared
with Wilks’ likelihood ratio test. P value < 0.05 indicated no differences between the three groups.
A pairwise correlation analysis between the five miR under analysis were conducted using Pearson’s correla-
tion coefficients given that the respective l og10-transformed data followed Normal distributions and the statistical
relationship between any pair of miR was linear approximately. A similar analysis was also performed to assess
the pairwise correlation between each miR and each clinical, blood and SF-36 variable but using Spearman’s
correlation coefficient.
A principal component analysis on the miR data was used to assess the similarity of the study participants in
terms of these variables. In this analysis we only used the first principal components because these components
could account for more than 90% of the miR data variability. In addition, two linear discriminant analyses based
on the miR data were performed to distinguish patients with ME/CFS from healthy controls and to distinguish
severely affected patients from patients with mild or moderate symptoms. In general, linear discriminant analysis
when applied to two-group case aims to find the best linear combination of a given set of variables that could
distinguish two groups. The key output of this analysis is the probability of classifying each individual in the
respective group given the estimated linear combination of the variables.
To detect differential expression of each miR between the three study groups, we estimated linear regression
models defining the log10-transformed data of each miR as the outcome variable, and age, gender, body mass
index, and two possible disease status variables (healthy vs ME/CFS and healthy vs ME/CFSmm vs ME/CFSsa) as
the respective covariates. Three and four-way ANOVA were used to test the statistical significance of the covari-
ates in the models including three and four covariates, respectively. Raw p values were then adjusted in order to
ensure a global false discovery rate of 5% using the Benjamini–Hochberg procedure. Finally, the assumptions
associated with linear regression modelling were confirmed by a residual analysis including normality assess-
ment by Lilliefors and Shapiro–Wilk tests and different diagnostic plots (e.g., scatterplots of fitted values against
standardized residuals).
The last step of the analysis was to estimate an empirical statistical power for detecting a group effect using
the different estimated models including such effect as the true models for the respective data. With this purpose,
we used the so-called parametric Bootstrap36 based on the following algorithm: (1) for each miR, simulate new
values for each study participant according to the Normal distributions associated with the respective linear
regression models estimated from the real data; (2) estimate the same models in the simulated data; (3) for each
miR, calculate the p value to test the significance of the group effect as performed for the real data; (4) adjust
the p values associated with each miR using the Benjamini–Hochberg procedure; (5) repeat the previous steps
1000 times in order to obtain 1000 data sets and to perform the respective analysis; and (6) estimate the power
associated with each miR as the proportion of data sets which the group effect was statistically significant using
adjusted p values as described for the analysis of the real data.
Analysis of public microarray data derived from PBMCs. We re-analyzed a microarray data set from
a previously published study17. In a nutshell, this data set consisted of 15 patients with ME/CFS and 29 HC
matched for age and gender. Mean age of patients and HC was 43.8 and 44.76 years old, respectively. The propor-
tion of males was 0.20 and 0.17 in patients and HCs, respectively. Patients with ME/CFS were diagnosed by the
Fukuda 1994-CDC, but also fulfilled the 2003 Canadian Consensus Criteria. Additional information of the study
participants can be found in the original reference17. The microarray data referred to log10-transformed intensi-
ties for around 385 miR as available in the Ambion Bioarray V1.0. We focused our analysis on data concerning
the five miR of interest. Again, to detect differential expression of each miR between HC and patients with ME/
CFS, we estimated linear regression models where the intensity data associated with each miR was the outcome
variable while age, gender, and disease status (HC vs ME/CFS) were considered as the covariates. The diagnos-
tics of the estimated regression model were conducted as described above for the analysis of plasma-derived
data sample. A three-way ANOVA was used to test the statistical significance of the covariates in the estimated
models. Again, raw p values were adjusted for multiple testing using the Benjamini–Hochberg procedure. The
adjusted p values ensured a global false discovery rate of 5%. The whole data set is publicly available from the
National Center for Biotechnology Information (NCBI) Geo data sets under the reference code GSE70371. The
annotation file of the respective microarray can be found under the accession code GPL3444 in the same data
repository. This file was used to identify each miR in the respective data set.
Statistical software. All statistical analysis was performed in the R software version 4.0.237 (https://www.r-
project.org/). The following R packages were used: “tcensReg” to analyze the CRP data, “nortest” to test the nor-
mal distribution of quantitative variables and residuals of the linear regression analyses, “PerformanceAnalytics”
Scientific Reports | (2021) 11:10604 | https://doi.org/10.1038/s41598-021-89834-9 3
Vol.:(0123456789)www.nature.com/scientificreports/
to produce the correlation matrix shown in Fig. 2, and “MASS” to adjust raw p values for multiple testing. The R
scripts used in this paper are freely available from NS upon request.
Integrative network analysis. Potential miR-mRNA interactions were determined using miRTarBase
7.0 (http://mirtarbase.mbc.nctu.edu.tw/php/index.php), a database that estimates interactions based on experi-
mentally validated assays (e.g. reporter gene assay, qPCR, and western blot). Protein–protein interactions (PPI)
were also estimated using the GeneMANIA prediction server, which uses experimentally confirmed physical
associations38. In order to analyze the PPIs topology network, a graphical representation was generated with
Cytoscape software (version 3.7.2) using the Organic layout. The degree and betweenness centrality of proteins
in the PPIs network were also calculated. The degree score (DS) corresponds to the count of how many interac-
tions a node has in the whole network. On the other hand, betweenness centrality (BC) measures the frequency
with which a node lies between the shortest communication path of all other possible pairs of nodes within a
network, determining which are the key nodes for communication within the network. In this context a protein
with a high DS and BC is likely an essential protein.
Over‑representation analysis. Over representation analysis (ORA), an approach to determine whether
known biological functions or processes are enriched in an experimentally-derived gene list, was performed
calculating a p value using hypergeometric distribution39. The list of miRs targets previously obtained using
miRTarBase 7.0 were used as a target group. In parallel, a full list of genes obtained from the NCBI database was
established as a background set of genes that function together in a known biological pathway. The analysis was
performed using five random lists of genes obtained from miRTarBase 7.0 to ensure the biological processes are
represented in the gene list more often than expected by chance. Random lists were generated using the random
python module to determine if a significative gene ontology term could be obtained by chance.
Results
Study participant characteristics. The demographic and clinical characteristics of the participants are
summarized in Table 1. The final age-matched cohort comprised 58 patients with ME/CFS divided into mild/
moderate (mm) (ME/CFSmm: 28; females: 71%) and severely affected (sa) ones (ME/CFSsa: 30; females: 80%).
Healthy controls included 29 participants (Females: 41%). Fatigue severity scores were higher both in ME/
CFSmm and ME/CFSsa in relation to HC (p < 0.0001). As expected, clinical assessments related to pain and
fatigue were higher in patients with ME/CFS compared to HC, with higher scores in ME/CFSsa comparing to
ME/CFSmm (p < 0.0001). In contrast, waist circumference (p = 0.0124), body metabolic rate (p = 0.0044), and
body muscle impedance (p = 0.0011) were lower, while body fat bioimpedance was higher (p = 0.0235) both in
ME/CFSsa and ME/CFSmm patients compared to HC participants. Diastolic and systolic pressure, along with
BMI were similar across the groups. Blood tests showed increased platelets (p = 0.0264), basophils (p = 0.0359),
erythrocyte sedimentation rate (ESR) (p = 0.0110) and reduced levels of creatinine (p = 0.0045) and creatine
phosphokinase (CPK) (p < 0.0001) both in ME/CFSmm and ME/CFSsa in relation to HC. The median obtained
from the physical functioning scale variables (SF-36 questionnaire) such as physical functioning, role physical,
bodily pain, general health, vitality, social functioning, role emotional, mental health, and both physical and
mental component summary were significantly reduced in both ME/CFSsa and ME/CFSmm patients when
compared to HC.
Analysis of miR expression data from plasma samples. We then used plasma samples from our
cohort to analyze the relative abundance of the set of miRs reported to modulate the Sirt1/eNOS axis. We
detected that the levels/quantities of miR-21, miR-34a, miR-92a, miR-126, and miR-200 were all increased in
both ME/CFS groups compared to HC (Fig. 1), and that these miRs are highly and positively correlated with
each other irrespective of the study group (Fig. 2). In line with this result, the first two principal components
explained more than 90% of the variation in the data (Fig. 3). Interestingly, the principal component analy-
sis showed that some patients with ME/CFS were clearly different from HC in the abundance of these miRs
(Fig. 3A), but it seems not to be related to disease severity (Fig. 3B). To complement this visual interpretation of
the principal components, linear discriminant analysis suggested that miR data could correctly classify 60.8%
(n = 31) of patients with at least 80% probability (Fig. 3C). In contrast, only 30.4% (n = 7) of HC could be clas-
sified as such with the same minimum probability. When linear discriminant analysis was used to distinguish
between ME/CFSsa and ME/CFSmm patients, the corresponding classification probabilities were in the vicinity
of 50% for individuals from each disease group (Fig. 3D). In conclusion, miR expression data may be a support-
ive biomarker to discriminate between ME/CFS patients and HCs, but cannot predict disease severity.
Spearman correlation coefficients were used to assess for an association between the increased Sirt1/eNOS-
related miRs and each clinical parameter, in order to establish novel relationships that could help in better dis-
criminating between patients and controls. In HC, the correlation coefficient involving ESR tends to be positive
for miR-34, miR-92a and miR-200c. Diastolic pressure tends to be positive for miR-34, and miR-92a. The amount
of white blood cells and neutrophils tends to be positively correlated with the level of miR-34a (Fig. 4A). The
correlation estimates associated with ME/CFS patients (Fig. 4B) and all the participants from our cohort (HC
and ME/CFS patients) (Fig. 4C) tends to be around zero for all miRs and clinical parameters, suggesting that
the heterogeneity of ME/CFS patients might mask stronger associations related to the analyzed covariates. The
association analysis shows the comparison between groups after adjusting by either age/gender, BMI or age/
gender/BMI (Fig. 5A). All associations are statistically significant irrespective of their adjustment for possible
confounders (Fig. 5A, Supplementary Table 1), highlighting the need to consider these analyses to obtain more
reliable findings. The empirical power of detecting a group effect assuming the estimated models as the true ones
Scientific Reports | (2021) 11:10604 | https://doi.org/10.1038/s41598-021-89834-9 4
Vol:.(1234567890)www.nature.com/scientificreports/
HC ME/CFSmm ME/CFSsa
Discrete variables (n) (%) (n) (%) (n) (%) p value
Sex
Male 17 59 8 29 6 20
Female 12 41 20 71 24 80 < 0.01
HC ME/CFSmm ME/CFSsa
Continuous variables Median IQR Median IQR Median IQR p value
Age (years) 43 32–48 44 34–48 44 32–54 0.66
Fatigue severity scale scores 1.89 1.44–2.44 6.56 5.95–6.78 6.62 6.25–6.86 < 0.0001
Clinical Assessments
Pulse oximetry (%) 99 98–99 98 97–98 99 98–99 0.03
Systolic pressure (mmHg) 126 111–131 124 110–136 120 108–129 0.48
Diastolic pressure (mmHg) 74 72–83 81 73–92 80 71–85 0.06
Height (cm) 171 168–175 168 162–178 165 159–177 0.31
Weight (kg) 80 66–86 74 63–86 63 54–81 0.06
BMI (kg/m2) 24 22–30 26 23–28 22 20–27 0.21
Waist circumference (cm) 90 78–102 91 87–100 79 72–90 0.01
Body fat 20 15–28 31 25–38 31 22–36 0.02
Body muscle 56 46–64 47 42–56 43 38–53 0.001
Body metabolic rate 1737 1469–1953 1509 1383–1685 1415 1197–1576 0.004
Pain analog scale 0.2 0.0–1.1 2.5 1.6–3.5 4.4 2.0–6.5 < 0.0001
Fatigue analog scale 0.8 0.0–1.7 5.2 3.6–6.9 7.1 6.0–8.2 < 0.0001
Blood tests
Hemoglobin (g/L) 144 131–151 140 130–144 141 131–148 0.64
White blood cells (109/L) 5.75 4.73–6.60 6.56 5.75–7.90 5.96 5.28–7.37 0.15
Platelets (109/L) 227 203–280 274 231–336 264 221–297 0.03
Red blood cells (1012/L) 4.83 4.50–5.02 4.67 4.34–4.94 4.64 4.39–4.89 0.62
Hematocrit 0.430 0.400–0.454 0.427 0.388–0.449 0.422 0.395–0.439 0.89
Neutrophils (109/L) 3.21 2.54–4.08 3.97 2.92 5.28 3.00–4.59 0.18
Lymphocytes (109/L) 1.85 1.65–2.10 1.70 1.60–2.29 1.93 1.55–2.32 0.84
Monocytes (109/L) 0.45 0.36–0.51 0.51 0.41–0.60 0.43 0.40–0.54 0.21
Eosinophils (109/L) 0.12 0.08–0.17 0.13 0.07–0.22 0.14 0.08–0.19 0.93
Basophils (109/L) 0.04 0.03–0.04 0.05 0.03–0.06 0.05 0.03–0.06 0.04
ESR (mm/h) 2.00 2–5 5 2–12 5 2–8 0.01
Creatinine (μmol/L) 86 75–93 75 68–79 69 59–76 0.01
CPK (U/L) 108 83–220 79 62–101 64 50–76 < 0.0001
CRP (CRP) 1.00 0.40–2.49 1.13 0.46–2.81 0.55 0.22–1.36 0.31
SF-36 test
Physical functioning 57.5 57.1–57.5 32.7 28.8–37.5 21.2 19.3–25.0 < 0.0001
Role physical 57.2 54.4–57.2 28.0 22.4–33.6 21.2 21.2–25.7 < 0.0001
Bodily Pain 55.6 51.5–62.0 42.2 34.2–44.7 34.2 26.5–42.2 < 0.0001
General health 60.3 57.4–63.1 30.8 26.1–33.2 28.5 23.7–30.8 < 0.0001
Vitality 52.6 48.9–58.5 28.8 25.9–33.3 25.9 22.9–31.8 < 0.0001
Social functioning 57.3 57.3–57.3 27.2 19.7–32.3 17.2 17.2–22-3 < 0.0001
Role emotional 56.2 56.2–56.2 45.7 35.3–52.7 56.2 38.8–56.2 < 0.001
Mental health 54.8 48.3–58.7 40.4 36.5–48.3 48.3 40.4–53.5 < 0.001
Physical component summary 58.4 55–7-59.8 29.4 26.5–33.9 19.9 16.8–23.1 < 0.0001
Mental health component summary 54.2 47.8–57.1 41.8 34.4–45.0 45.9 43.6–50.4 < 0.0001
Table 1. Demographics of the study population based on sex, age, fatigue severity scale scores, clinical
assessments, blood tests and SF-36 test. HC, participants recruited as healthy controls; ME/CFSmm,
participants recruited as mild/moderate ME/CFS patients; ME/CFSsa, participants recruited as severely
affected ME/CFS patients. Body mass index (BMI); erythrocyte sedimentation rate (ESR); creatine
phosphokinase (CPK); C-reactive protein (CRP). *p values were obtained as follows: χ2 tests for categorical
variables, Kruskal–Wallis test for non-normally distributed continuous variables and ANOVA test for normally
distributed continuous variables. Normal distribution was checked by D’Agostino & Pearson test. Note that
the median and interquantile for CRP were obtained from fitting a linear regression based on a truncated
Lognormal distribution to the respective data.
Scientific Reports | (2021) 11:10604 | https://doi.org/10.1038/s41598-021-89834-9 5
Vol.:(0123456789)www.nature.com/scientificreports/
10
Group
expression
HC
1
ME/CFSmm
ME/CFSsa
0.1
miR-21 miR-34a miR-92a miR-126 miR-200c
Figure 1. miR expression data derived from plasma samples. Violin plots summarizing the expression data
from each miR in healthy controls (HC), mild/moderate (mm) and severely affected (sa) ME/CFS patients.
Note that the violin plots represent the classical boxplot depicted inside the violin together with a density plot
that gives the shape of the violin. The statistical analysis was performed in the R software version 4.0.2 (https://
www.r-project.org/).
Pearson's Correlation Analysis
-0.5 0.0 0.5 1.0 -0.5 0.0 0.5 1.0
0.81 0.91
0.5
log10(miR-21) 0.75 0.80 0.0
-0.5
1.0
0.5
0.0
-0.5
log10(miR-34a) 0.69 0.65 0.69
1.0
0.77
0.5
log10(miR-92a) 0.68 0.0
-0.5
1.0
0.86
0.5
0.0
log10(miR-126)
-0.5
1.0
0.5
log10(miR-200c) 0.0
-0.5
-0.5 0.0 0.5 -0.5 0.0 0.5 1.0 -0.5 0.0 0.5 1.0
Figure 2. Correlation analysis between miRs expression data derived from plasma samples. Lower panel shows
the scatterplots between the expression of a pair of miR taken in log10-scale where the blue line represents
a lowess approximation of the respective relationship between x and y variables, and the dots in light green
and salmon color represent healthy individuals and patients with ME/CFS, respectively. The values in upper
panel are the Pearson´s correlation coefficient estimates for the corresponding data shown in lower panel. The
statistical analysis was performed in the R software version 4.0.2 (https://www.r-project.org/).
Scientific Reports | (2021) 11:10604 | https://doi.org/10.1038/s41598-021-89834-9 6
Vol:.(1234567890)www.nature.com/scientificreports/
for the data was in most cases higher than 80% in unadjusted analysis and in the analysis controlling for age and
gender (Fig. 5B). This power tended to be lower in the analysis controlling for age, gender, and BMI. As expected,
the lowest power was obtained for miR-34a which was already on the borderline of statistical significance after
adjusting for multiple testing. In the worst-case scenario of this miR, the power of detecting a group effect was
estimated at 35% for the analysis controlling age, gender, and BMI when using ME/CFSsa, ME/CFSmm and
healthy controls as the group covariate.
Analysis of microarray data from PBMCs. To provide additional evidence for the above findings on
the UKMEB cohort of participants, we re-analyzed previously published microarray data from 15 patients with
ME/CFS and 29 HC matched for age and gender17. We found that the five miRs under analysis were increased in
patients with ME/CFS in comparison with HC (Fig. 6A, Supplementary Table 1). This increase was statistically
significant for miR-21, miR-34a, miR-92a, and miR-126 after adjusting for multiple testing and controlling for
possible confounding effects of age and gender (Fig. 6B, Supplementary Table 1). With respect to miR200c, the
increase in expression was in the borderline of statistical significance (FDR-adjusted p value = 0.06). In conclu-
sion, the five miRs are increased in both plasma (present data) and P BMCs17 from different cohorts, supporting
their altered expression in ME/CFS.
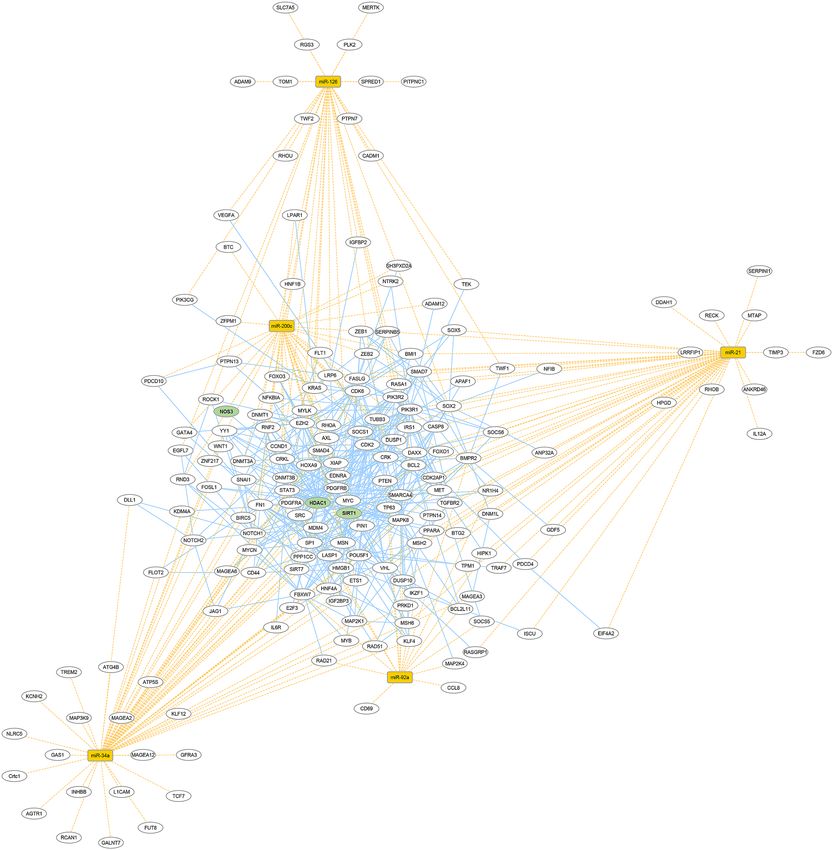
Bioinformatics analysis. Bioinformatics analyses were carried out to visualize targets and biological pro-
cesses associated with the set of miRs. Based on miR-mRNA interaction analyses we observed 182 genes associ-
ated with miR-21 (n = 49), miR-34a (n = 61), miR-92a (n = 17), miR-126 (n = 33), and miR-200c (n = 38) (Fig. 7,
Supplementary Table 2), indicating they are eventually regulated by more than one miR. After integration with
protein–protein interaction data, we observed a cluster of 135 proteins with experimental evidence of physical
interaction. Thus, our set of increased miRs is predicted to target highly interconnected proteins, suggesting a
functional module (Fig. 7). Interestingly, histone deacetylase 1 (HDAC1) represented the most relevant node
based on centrality measures (Fig. 7, Supplementary Table 2). Later, we identified several biological processes
associated with miR-21-5p, miR-34a-5p, miR-92a-3p, miR-126-3p, and miR-200c-3p from a gene list validated
experimentally. Functional pathway enrichment analyses showed that 5 out of 20 most over-represented biologi-
cal processes are linked to regulation of vasculature development, followed by reproductive structure develop-
ment, response to oxidative stress, ERK1/ERK2 cascade, and response to oxygen levels, respectively (Fig. 8).
Additionally, 232 biological processes derived from the same analysis are also provided (Supplementary Table 3).
Overall, the set of miRs selected for our study is mainly associated with endothelial function through regulation
of highly interconnected proteins, where HDAC1 and Sirt1 are predicted as central players.
Discussion
Despite ME/CFS has been studied for decades with significant progress achieved in the field, its etiology remains
elusive. Accordingly, ME/CFS is diagnosed based on symptoms-related criteria which also leads to either undi-
agnosed or misclassified cases due to the heterogeneity of symptoms. Consequently, there is no single objec-
tive diagnostic or therapeutic biomarker, and current treatment is mainly focused on alleviating the complex
symptomatology1. Therefore, there is an urgent need to identify reliable biomarkers for ME/CFS that allow a
more precise diagnose and follow-up of its progression40. Thus, strategies to improve the reproducibility among
studies such as the utilization of uniform clinical and research criteria, standardization of sample collection along
with proper statistical analysis are certainly crucial to overcome this challenge.
We used plasma samples from healthy controls and age-matched mild/moderate and severely affected ME/
CFS patients, obtained from the U KMEB41. In agreement with the stratification of groups in this study, all clini-
cal parameters related with pain and fatigue were higher in ME/CFSsa than ME/CFSmm than HCs. In direct
contrast, parameters associated with muscle mass (body muscle impedance) and muscle activity (creatinine and
CPK) were lower in ME/CFSsa than ME/CFSmm than HCs, whereas body fat mass showed the opposite pat-
tern, as expected due to the debilitating condition of the syndrome and the possibility of a gradual filling of the
space of atrophic muscle tissue by fat tissue, as it occurs in other myopathies42, which, however, does not alter
BMI despite a tendency towards a reduced body weight. As in other reports43, blood pressure and CRP were
not different within our study population, in agreement with the immunological heterogeneity across ME/CFS
cohorts. Furthermore, the non-specific marker of inflammation ESR, was found increased in ME/CFS patients
compared to HCs, as well as reported in a different cohort from U KMEB44.
Notwithstanding the current knowledge that inflammation promotes ED in different diseases6, few studies
have addressed endothelial function in vivo in patients with ME/CFS7–9,43. From a clinical perspective, Newton
and colleagues9 reported ED in large and small arteries from ME/CFS patients using flow-mediated dilatation
(FMD), linked to increased serum levels of CRP. Conversely, Moneghetti et al. neither report significant differ-
ences in CRP levels nor endothelial function assayed by peripheral arterial tonometry (EndoPAT) between ME/
CFS patients still able to exercise and sedentary c ontrols43. Scherbakov et al. also evaluated endothelial function
by EndoPAT, showing ED associated with disease severity and immune symptoms in 51% of ME/CFS patients7.
In line with these findings, Sørland et al. have recently reported ED in 40% of ME/CFS patients by using F MD8.
Interestingly, our results show that ~ 61% of ME/CFS patients from our cohort might be classified as patients with
at least 80% probability of suffering from ED, based on the increased set of miRs reported to regulate endothelial
function via the Sirt1/eNOS axis. Although these findings also suggest that ED might be a trait observed in a
subset (~ 40–60%) of ME/CFS patients, further studies focused on evaluating both endothelial function in vivo
and this set of Sirt1/eNOS-related miRs in plasma from the same cohort might be of great value to support this
assumption, offering a more sensitive approach to detect ED earlier.
Scientific Reports | (2021) 11:10604 | https://doi.org/10.1038/s41598-021-89834-9 7
Vol.:(0123456789)www.nature.com/scientificreports/
A B
0.6 0.6
HC HC
ME/CFS ME/CFSmm
ME/CFSsa
0.4 0.4
2nd Principal Component (8.0%)
2nd Principal Component (8.0%)
0.2 0.2
0.0 0.0
−0.2 −0.2
−0.4 −0.4
−0.6 −0.6
−1.5 −1.0 −0.5 0.0 0.5 1.0 1.5 −1.5 −1.0 −0.5 0.0 0.5 1.0 1.5
1st Principal Component (81.4%) 1st Principal Component (81.4%)
C Healthy Controls Patients with ME/CFS
70 70
60.8%, n=31
60 60
50 50
% individuals
% individuals
40 40
30.4%, n=7
30 30
21.7%, n=5 21.7%, n=5
20 20 17.6%, n=9
13%, n=3 13%, n=3 11.8%, n=6
9.8%, n=5
10 10
0%, n=0
0 0
(0,0.2] (0.2,0.4] (0.4,0.6] (0.6,0.8] (0.8,1] (0,0.2] (0.2,0.4] (0.4,0.6] (0.6,0.8] (0.8,1]
probability of being classified as healthy control probability of being classified as patient
D Patients with ME/CFSmm Patients with ME/CFSsa
70 70
60 60
50 50
44.4%, n=12
% individuals
% individuals
40 40
33.3%, n=8
29.2%, n=7 29.2%, n=7 29.6%, n=8
30 30
20 20 18.5%, n=5
10 10
4.2%, n=1 4.2%, n=1 3.7%, n=1 3.7%, n=1
0 0
(0,0.2] (0.2,0.4] (0.4,0.6] (0.6,0.8] (0.8,1] (0,0.2] (0.2,0.4] (0.4,0.6] (0.6,0.8] (0.8,1]
probability of being classified as patient with ME/CFSmm probability of being classified as patient with ME/CFSsa
Figure 3. Principal component analysis and linear discriminant analysis derived from miR expression data in
plasma. The scatterplots show the representation of each study participant in the first two principal components.
The scatterplots (A) and (B) are the same but color-coded according to healthy controls (HC) versus patients
with ME/CFS and according to healthy controls, mild/moderate (mm) and severely affected (sa) ME/CFS
patients, respectively. The barplots (C) represent the frequency of HC and patients with ME/CFS and their
corresponding classification probability of being classified as such according to a linear discriminant analysis
distinguishing patients from controls specifically. The barplots (D) are similar to ones shown in (C), but for a
linear discriminant analysis distinguishing mild/moderate patients from severely affected patients specifically.
The statistical analysis was performed in the R software version 4.0.2 (https://www.r-project.org/).
The enzyme eNOS has a crucial role in endothelial function as a key mediator of vasodilatation by converting
L-arginine into NO and L-citrulline. On the contrary, uncoupled eNOS and/or reduced eNOS activity induced
by oxidative stress and inflammation triggers ED6. Sirt1 is another key modulator of endothelial homeostasis
by activating eNOS to promote endothelium-dependent v asodilatation11, whose expression/activity is reduced
during inflammation10. Over the last years, miRs have emerged as interesting candidates to identify biomarkers
in ME/CFS13–17, since these noncoding RNAs play widespread roles in regulating gene expression12. Microarray
analyses have identified several miRs differentially expressed in ME/CFS patients compared to HCs, also sup-
porting by in silico analyses that inflammation-related processes and immune abnormalities play a role in its
Scientific Reports | (2021) 11:10604 | https://doi.org/10.1038/s41598-021-89834-9 8
Vol:.(1234567890)Scientific Reports |
(2021) 11:10604 |
Spearman's Correlation Coefficient Spearman's Correlation Coefficient Spearman's Correlation Coefficient
−1.0
−0.5
0.0
0.5
1.0
−1.0
−0.5
0.0
0.5
1.0
−1.0
−0.5
0.0
0.5
1.0
www.nature.com/scientificreports/
C
B
A
Pulse Oximetry Pulse Oximetry Pulse Oximetry
Sistolic Pressure Sistolic Pressure Sistolic Pressure
Diastolic Pressure Diastolic Pressure Diastolic Pressure
miR−21
miR−21
miR−21
miR−126
miR−92a
miR−34a
miR−126
miR−92a
miR−34a
miR−126
miR−92a
miR−34a
Height Height Height
miR−200c
miR−200c
miR−200c
Waist Circumference Waist Circumference Waist Circumference
Weight Weight Weight
Body Mass Index Body Mass Index Body Mass Index
Body Fat Body Fat Body Fat
Body Muscle Body Muscle Body Muscle
Clinical Assessments
Clinical Assessments
Clinical Assessments
Body Metabolic Rate Body Metabolic Rate Body Metabolic Rate
Pain Analog Scale Pain Analog Scale Pain Analog Scale
Fatigue Analog Scale Fatigue Analog Scale Fatigue Analog Scale
Hemoglobulin Hemoglobulin Hemoglobulin
White Blood Cells White Blood Cells White Blood Cells
Platelets Platelets Platelets
Red Blood Cells Red Blood Cells Red Blood Cells
Hematocrit Hematocrit Hematocrit
Neutrophils Neutrophils Neutrophils
Lymphocytes Lymphocytes Lymphocytes
Overall
Monocytes Monocytes Monocytes
Blood Tests
Blood Tests
Blood Tests
Eosinophils Eosinophils Eosinophils
Healthy Controls
Basophils Basophils Basophils
Patients with ME/CFS
ESR ESR ESR
Creatinine Creatinine Creatinine
CPK CPK CPK
Physical Functioning Physical Functioning Physical Functioning
Role Physical Role Physical Role Physical
Bodily Pain Bodily Pain Bodily Pain
General Health General Health General Health
Vitality Vitality Vitality
Social Functioning Social Functioning Social Functioning
Role Emotional Role Emotional Role Emotional
https://doi.org/10.1038/s41598-021-89834-9
Mental Health Mental Health Mental Health
Physical Component Physical Component Physical Component
SF−36 Questionnaire
SF−36 Questionnaire
SF−36 Questionnaire
Mental Component Mental Component Mental Component
The statistical analysis was performed in the R software version 4.0.2 (https://www.r-project.org/).
correlation coefficient. A. Correlation analysis using the data of healthy controls only. B. Correlation analysis
between data of each miR and data of each clinical, blood and SF-36 variable was conducted using Spearman’s
using the data of patients with ME/CFS only. C. Correlation analysis using data irrespective of the study groups.
Figure 4. Correlation analysis between miR expression and clinical-related data. A pairwise correlation analysis
9
Vol.:(0123456789)www.nature.com/scientificreports/
Figure 5. Association analysis between miR expression and study groups. (A) Association analysis adjusting for a
global false discovery rate of 5% and controlling for age, gender, and BMI. Each dot represents the −log10(p value)
of a specific statistical association test while the dashed line represents −log10(0.05) above which it was consider a
statistically significant association (i.e., −log10(p value) > −log10(0.05)). P values were adjusted for a false discovery rate
(FDR) of 5%. (B) Power analysis using a parametric Bootstrap approach under the assumption that the estimated
models in A were the true ones for the data. In this analysis, the probability of detecting a group effect was estimated
by the proportion of simulated data sets in which the group effect was statistically significant after adjusting for an
FDR of 5%. The statistical analysis was performed in the R software version 4.0.2 (https://www.r-project.org/).
Scientific Reports | (2021) 11:10604 | https://doi.org/10.1038/s41598-021-89834-9 10
Vol:.(1234567890)www.nature.com/scientificreports/
A
5
4
Group
expression
3
HC
2 ME/CFS
1
0
miR-21 miR-34a miR-92a miR-126 miR-200c
B
3.0
log10(FDR-adjusted p-value)
2.5
2.0
1.5
1.0
0.5
0.0
miR-21 miR-34a miR-92a miR-126 miR-200c
Figure 6. Analysis of publicly available microarray data derived from PBMCs. (A) Violin plots summarizing
the expression data from each miR in PBMCs from healthy controls (HC) and patients with ME/CFS. (B)
Association analysis adjusting for a FDR of 5% and controlling for age and gender where the dashed line
represents -log10(0.05) and red dots represent the statistically significant associations between ME/CFS and the
respective miR. Check legend of Fig. 5 for additional information about how to interpret this plot. The statistical
analysis was performed in the R software version 4.0.2 (https://www.r-project.org/).
pathophysiology14. Then, we compared the expression of miR-21, miR-34a, miR-92a, miR-126, and miR-200c in
plasma samples from ME/CFSmm and ME/CFSsa versus HCs, obtained from the U KMEB41.
We detected increased plasma levels of each miR in ME/CFS patients compared to HCs, independent of dis-
ease severity. In order to provide additional evidence, we also re-analyzed available microarray data in PBMCs
from a different cohort of ME/CFS patients17. miR-21, miR-34a, miR-92a, and miR-126 were also found increased
in patients with ME/CFS in comparison with HC, while miR-200c showed the same trend but at the borderline
of statistical significance. Altogether, these findings not only support the fact that evaluating this set of miRs,
reported to regulate the endothelial function via the Sirt1/eNOS axis, might be used to differentiate a subset of
ME/CFS patients from HCs but also highlight the importance of available data sets to compare findings across
studies.
Taking into account the immunological heterogeneity across patients during the course of the illness2,3,
several studies have investigated immune patterns in ME/CFS, often with conflicting results45. Nevertheless,
pro-inflammatory cytokines, such as TGF-β, TNF-α, IL-1β, and IL-6 seem to play a role related to illness dura-
tion and s everity2,3. In agreement with a recent study carried out in PBMCs and extracellular vesicles from ME/
CFSsa patients15, we found increased levels of miR-21 in plasma samples from both ME/CFSmm and ME/CFSsa
patients compared to HCs. miR-21 is described to down-regulate the Sirt1/eNOS axis via TGF-β20 and TNF-α28
pathways in ECs and endothelial progenitor cells (EPCs), respectively. Increasing experimental and clinical data
have also suggested that asymmetric dimethylarginine (ADMA), an endogenous eNOS inhibitor, promotes ED
by reducing NO b ioavailability46. Indeed, TNF-α-induced miR-21 up-regulation is linked to increased ADMA
concentration and reduced eNOS activity in E Cs27. L-citrulline, the by-product of NO synthesis from L-arginine
by eNOS, ameliorated ADMA-induced ED by enhancing eNOS function and reducing oxidative s tress47. Interest-
ingly, L-citrulline was found significantly lower in plasma from ME/CFS patients compared to H Cs48. Since the
49
main source of L-citrulline is the gut, its circulating levels are used as an indicator of gut f unction . Gut microbial
dysbiosis has been proposed to be involved in ME/CFS50, and the degree of fatigue associated with the decrease
of plasma L-citrulline in other pathological settings of d ysbiosis49. Thus, increased plasma levels of A DMA47,51
and decreased plasma levels of L-citrulline48 may negatively affect NO production in ME/CFS patients. Addi-
tionally, miR-21 is thought to act as a positive but indirect regulator of Foxp3 expression in human regulatory
Scientific Reports | (2021) 11:10604 | https://doi.org/10.1038/s41598-021-89834-9 11
Vol.:(0123456789)www.nature.com/scientificreports/
Figure 7. Visualization of miR-target interaction network. miR-21-5p, miR-34a-5p, miR-92a-3p, miR-126-3p,
and miR-200c-3p are displayed in yellow squares, while white ovals represent their targets. Dotted yellow lines
and solid blue light ones indicate miR-mRNA and protein–protein interaction, respectively. The graphical
representation was generated with Cytoscape software version 3.7.2 using the Organic layout (https://cytoscape.
org/).
CD4+ T cells (Tregs)52, a key cellular population of the adaptive immune system that controls autoimmunity
and autoreactive T cells53. Accordingly, miR-21 ameliorated the clinical severity of experimental autoimmune
encephalomyelitis in mice via a mechanism involving T regs53. Therefore, it is possible to hypothesize that an
overexpression of miR-21 could promote the expression of Foxp3 in naive CD4+ T cells and their conversion to
the Treg pool. This putative Treg-cell conversion could explain the increase in the proportion of these cells in
patients with ME/CFS observed in some studies54.
In line with this observation, miR-34 also regulates Tregs via NF-κB signaling55, a well-described pathway that
induces inflammation by inhibiting Sirt110. miR-34a also seems to play a key role in the regulation of endothelial
cell inflammation by differentially modulating the antagonistic crosstalk between NF-κB and Sirt126. Moreover,
the negative regulation of miR-34a over the Sirt1/eNOS axis is associated with the premature senescence of E Cs25.
Interestingly, a randomized clinical study reported a negative correlation between miR-34 and Sirt1 expression
Scientific Reports | (2021) 11:10604 | https://doi.org/10.1038/s41598-021-89834-9 12
Vol:.(1234567890)www.nature.com/scientificreports/
Figure 8. Biological processes related to miR-21-5p, miR-34a-5p, miR-92a-3p, miR-126-3p, and miR-200c-3p.
Dot plot of functional enrichment analysis for the top 20 over-represented biological processes (BPs) related
to our selected miRs. Dot sizes represent the number of genes (count) related to a particular BP. Gene Ratio
is the number of genes found enriched in each category over the number of total genes associated to that BP.
Dot colors represent the adjusted p values. Dot plots were generated in R software version 3.6.1 using the
clusterProfiler package version 3.14.3 (https://bioconductor.org/packages/release/bioc/html/clusterProfiler.
html).
in patients with coronary artery disease29. Thus, considering we found miR-34a increased in ME/CFS patients
compared to HCs, further studies are certainly needed to elucidate its potential contribution to the immune and
endothelial abnormalities observed in ME/CFS patients.
Our results also showed increased circulating miR-92a both in ME/CFSmm and ME/CFSsa patients, in agree-
ment with a recent study using PBMCs16. In vitro, inhibition of miR-92a attenuates ED by decreasing the release
of TNF-α and IL-6 by E Cs24. In addition, miR-92a overexpression decreased eNOS activity and release of N O23,
whereas its inhibition restored eNOS-mediated endothelial function by increasing Sirt1 expression in E Cs22. In
observational clinical studies, the circulating miR-92a positively correlated with microvascular coronary E D30.
Moreover, miR-92a was inversely correlated with FMD and positively associated with IL-1β and CRP in serum
from patients with coronary artery d isease22.
In line with our findings, miR-126 was also found increased in extracellular vesicles from ME/CFSsa
patients15. miR-126 is described to exert an endothelial protective role against hypoxia/reoxygenation-induced
injury, oxidative stress, and TNF-α by activating the Sirt1/eNOS axis in E Cs21. The circulating miR-126 was cor-
related to the improvement of endothelial function in male obese adolescents after exercise and diet c ontrol31. In
addition, miR-126 reduces oxidative stress, IL-6, and TNF-α and activates both eNOS and vascular endothelial
growth factor (VEFG) in E Cs21. Recently, VEGF was found decreased in serum from ME/CFS p atients56, an
interesting finding considering that VEGF promotes survival and stability of ECs57. Altogether, higher plasma
levels of miR-126 in ME/CFS patients might involve a compensatory mechanism against ED.
A large body of evidence suggests an autoimmune etiology in a subset of ME/CFS p atients7,58. For instance,
the M3 muscarinic acetylcholine receptor increases NO synthesis mediated by acetylcholine in ECs59, but autoan-
tibodies against this receptor were found significantly higher in ME/CFS patients compared to HC60. Several
autoantibodies, including those against the M3 muscarinic acetylcholine receptor, have been identified in people
suffering from postural orthostatic tachycardia syndrome (POTS), characterized by tachycardia after moving
from the supine to an upright position61, a condition also linked to ME/CFS62. Interestingly, miR-200c overexpres-
sion attenuates acetylcholine-induced endothelium-dependent relaxation in human renal a rteries19. Thus, miR-
200c might be related to acetylcholine-related ED. In this regard, circulating miR-200c was reported increased in
atherosclerotic patients associated with reduced Sirt1/eNOS e xpression32. Additionally, miR-200c up-regulation
induced by oxidative stress reduced Sirt1/eNOS axis a ctivity18, causing apoptosis and senescence in ECs63.
Several bioinformatics analyses were also performed to visualize additional targets and biological pro-
cesses associated with the set of miRs. Based on in silico analyses we validated that endothelial function-related
Scientific Reports | (2021) 11:10604 | https://doi.org/10.1038/s41598-021-89834-9 13
Vol.:(0123456789)www.nature.com/scientificreports/
signaling pathways are closely related to these miRs, including oxidative stress and oxygen regulation. Interest-
ingly, HDAC1 was the most relevant node within our network built with miR-21, miR-34a, miR-92a, miR-126,
and miR-200c. Histone deacetylases remove acetyl-lysine marks on proteins, especially in histones, leading to
chromatin condensation and reduced levels of gene e xpression64. Changes in chromatin compaction through
altered HDAC164 along with other epigenetic alterations previously detected in ME/CFS p atients65, might play
also a role in this syndrome. Sirt1 deacetylates and activates HDAC1, but cell stress induces both Sirt1 degra-
dation and HDAC1 acetylation, rendering HDAC1 less active66. Other HDAC isoforms have been reported
increased in PBMCs from ME/CFS p atients67. Notably, up-regulation of HDAC1 has been shown to reduce NO
production by deacetylating eNOS in ECs in vitro68. Despite these findings might represent potential strategies
for preventing ED via HDAC1, they should be interpreted with caution because both up-regulation of H DAC168
69
and pharmacological inhibition of HDACs negatively affect endothelial function. Thus, we need further stud-
ies to confirm any alteration in HDAC1 amount and/or activity directly related to ED in our cohort. However,
based on the mutual regulation between Sirt1 and H DAC166, a better analysis of endothelial function should
address HDAC1/Sirt1/eNOS axis as a novel platform to dissect the altered regulatory pathways leading to ED.
Noteworthy, we found similarities in the expression of our target miRs in plasma compared to PBMCs from
another cohort17, but their origin is unknown. From a biological aspect, miRs are produced, released, and incor-
porated by different cell types, playing widespread roles in regulating gene expression throughout the b ody70.
NF-κB is also involved in the modulation of a wide range of pleiotropic responses10. Thus, it is not surprising
that this master transcriptional factor, well-known to modulate both immune and inflammatory r esponses71,
might also participate in puzzling signaling pathways ranging from metabolic syndrome72 to d epression73 in
74 75 55 22 76
crosstalk with several miRs , including miR-21 , miR-34a , miR-92a , and miR-126 . Based on the heteroge-
neous nature of ME/CFS1, we are aware that these increased miRs are not exclusively related to this syndrome,
but they reflect an alteration, not related to severity, that might be further exploited to identify novel pathways
with diagnostic and therapeutic value in ME/CFS. Since the ECs-related function varies from acute to chronic
inflammation and even during the switch from innate to adaptive immunity4, further basic and clinical studies
are certainly required to elucidate whether our studied miRs are involved in immune abnormalities in ME/CFS.
To our knowledge, this is the first report that collectively evaluates a set of circulating miRs associated with
the Sirt1/eNOS axis, providing a basis for further studies to find ED-related biomarkers in ME/CFS. Overall, low-
invasive detection of this set of miRs in plasma might help to identify ME/CFS patients, but their abundance per
se cannot discriminate between ME/CFSsa and ME/CFSmm patients in this cohort. Our findings also support
the hypothesis that endothelial homeostasis is an underestimated and partially addressed process which might
play an important role in the complex pathophysiology of ME/CFS. Considering the pivotal function exerted
by ECs and the fact that they are ubiquitous in tissues throughout the body, our study not only supports other
reports associating ME/CFS with E D7–9 but also advances our understanding about potential new players not
reported so far. In conclusion, we propose that a combination of clinical evaluation of endothelial function by
FMD and/or EndoPAT, along with the detection of circulating Sirt1/eNOS-related miRs, might allow a more
sensitive characterization of ED in a subset of ME/CFS patients for better stratification, which will certainly
translate into improved treatment possibilities.
We are aware that these findings are not yet transferable into the clinical setting. Accordingly, observational
studies with follow-up measurements in a bigger cohort are certainly needed to improve the power of the analysis
and confirm our findings. In this line, we agree with Jason et al.77 that it is crucial to include minimum data in
ME/CFS reports regarding patient characteristics, sampling, statistical methods, clinical and research assess-
ments, as we intended to do in this report. Moreover, the use of more specific and restrictive case definitions
represents a pivotal strategy to reduce misclassification bias78 and, as a consequence, improves the chances to
identify reliable biomarkers in ME/CFS40.
For instance, despite the Fukuda case definition is the most used in ME/CFS research, it may misclassify
individuals with major depression as ME/CFS patients79. In summary, including standardized diagnosis and
research criteria into the study design will increase reproducibility/comparability among studies and positively
impact ME/CFS patients’ health care.
Received: 3 December 2020; Accepted: 28 April 2021
References
1. Cortes Rivera, M., Mastronardi, C., Silva-Aldana, C., Arcos-Burgos, M. & Lidbury, B. Myalgic encephalomyelitis/chronic fatigue
syndrome: A comprehensive review. Diagnostics 9, 91 (2019).
2. Montoya, J. G. et al. Cytokine signature associated with disease severity in chronic fatigue syndrome patients. Proc. Natl. Acad.
Sci. 114, E7150–E7158 (2017).
3. Hornig, M. et al. Distinct plasma immune signatures in ME/CFS are present early in the course of illness. Sci. Adv. 1, e1400121
(2015).
4. Pober, J. S. & Sessa, W. C. Evolving functions of endothelial cells in inflammation. Nat. Rev. Immunol. 7, 803–815 (2007).
5. Bai, B. et al. NLRP3 inflammasome in endothelial dysfunction. Cell Death Dis. 11, 776 (2020).
6. Farah, C., Michel, L. Y. M. & Balligand, J.-L. Nitric oxide signalling in cardiovascular health and disease. Nat. Rev. Cardiol. 15,
292–316 (2018).
7. Scherbakov, N. et al. Peripheral endothelial dysfunction in myalgic encephalomyelitis/chronic fatigue syndrome. ESC Hear. Fail.
7, 1064–1071 (2020).
8. Sørland, K. et al. Reduced endothelial function in myalgic encephalomyelitis/chronic fatigue syndrome-results from open-label
cyclophosphamide intervention study. Front. Med. 8, 294 (2021).
9. Newton, D. J. et al. Large and small artery endothelial dysfunction in chronic fatigue syndrome. Int. J. Cardiol. 154, 335–336 (2012).
Scientific Reports | (2021) 11:10604 | https://doi.org/10.1038/s41598-021-89834-9 14
Vol:.(1234567890)You can also read