Best Practice & Research Clinical Anaesthesiology - Semes
←
→
Page content transcription
If your browser does not render page correctly, please read the page content below
Best Practice & Research Clinical Anaesthesiology 28 (2014) 363e380

                                          Contents lists available at ScienceDirect

                               Best Practice & Research Clinical
                                       Anaesthesiology
                            journal homepage: www.elsevier.com/locate/bean

5

Arterial waveform analysis
Stephen A. Esper, MD, MBA, Assistant Professor of
Anesthesiology a, *,
Michael R. Pinsky, MD, CM, Dr hc, Professor of Critical Care
Medicine, Bioengineering, Cardiovascular Diseases and
Anesthesiology a, b
a
    Department of Anesthesiology, University of Pittsburgh, Pittsburgh, PA, USA
b
    Department of Critical Care Medicine, University of Pittsburgh, Pittsburgh, PA, USA

Keywords:
                                                       The bedside measurement of continuous arterial pressure values
arterial waveform                                      from waveform analysis has been routinely available via indwelling
arterial line                                          arterial catheterization for >50 years. Invasive blood pressure
minimally invasive monitoring                          monitoring has been utilized in critically ill patients, in both the
devices                                                operating room and critical care units, to facilitate rapid diagnoses of
cardiac output                                         cardiovascular insufficiency and monitor response to treatments
stroke volume variation                                aimed at correcting abnormalities before the consequences of either
                                                       hypo- or hypertension are seen. Minimally invasive techniques to
                                                       estimate cardiac output (CO) have gained increased appeal. This has
                                                       led to the increased interest in arterial waveform analysis to provide
                                                       this important information, as it is measured continuously in many
                                                       operating rooms and intensive care units. Arterial waveform analysis
                                                       also allows for the calculation of many so-called derived parameters
                                                       intrinsically created by this pulse pressure profile. These include es-
                                                       timates of left ventricular stroke volume (SV), CO, vascular resistance,
                                                       and during positive-pressure breathing, SV variation, and pulse
                                                       pressure variation. This article focuses on the principles of arterial
                                                       waveform analysis and their determinants, components of the arte-
                                                       rial system, and arterial pulse contour. It will also address the
                                                       advantage of measuring real-time CO by the arterial waveform and
                                                       the benefits to measuring SV variation. Arterial waveform analysis
                                                       has gained a large interest in the overall assessment and management
                                                       of the critically ill and those at a risk of hemodynamic deterioration.
                                                                                     © 2014 Elsevier Ltd. All rights reserved.

    * Corresponding author. Department of Anesthesiology, 200 Lothrop Street, Pittsburgh, 15261 PA, USA.
      E-mail address: espersa@upmc.edu (S.A. Esper).

http://dx.doi.org/10.1016/j.bpa.2014.08.002
1521-6896/© 2014 Elsevier Ltd. All rights reserved.
364             S.A. Esper, M.R. Pinsky / Best Practice & Research Clinical Anaesthesiology 28 (2014) 363e380

Introduction

    The bedside measurement of continuous arterial pressure values from waveform analysis has been
routinely available via indwelling arterial catheterization for >50 years. Invasive blood pressure
monitoring has been utilized in critically ill patients, in both the operating room and critical care units,
to facilitate rapid diagnoses of cardiovascular insufficiency and monitor response to treatments aimed
at correcting abnormalities before the consequences of either hypo- or hypertension are seen.
    Arterial blood pressure was first directly measured by Stephen Hales in 1733, when he used a 90 -
long glass tube with a flexible connector (the trachea of a goose) and measured the pressures at the
femoral and carotid arteries [1]. Other scientists and physicians improved on this method, including
Daniel Bernoulli [2] and Jean-Louis Poiseuille who, in 1828, used a mercury-filled U-tube to determine
the pressure at multiple points along the aorta [3]. The first clinically relevant placement of an arterial
catheter was accomplished in 1949 by Peterson and colleagues who described the following meth-
odology: “A small plastic catheter, inserted into an artery through a needle, is left in the artery when
the needle is withdrawn. Attached to a capacitance manometer, this technique permits recording for
long periods of time without discomfort and allows relatively free mobility of the subject.” [4] Since
that time, multiple techniques have been elucidated by Peirce [5] and Seldinger [6]. Seldinger
described the “catheter-over-wire” technique commonly used today. As of 1990, >8 million invasive
arterial catheters had been placed. One added advantage of an invasive arterial catheter is the ability to
easily draw blood samples to measure levels of various including hemoglobin and electrolytes,
allowing greater ease at diagnosis and managing disease. As medical technology improved, noninva-
sive technology was developed to provide continuous arterial waveform monitoring using plethys-
mographic principles with devices placed on a finger or wrist, that is, a continuous noninvasive arterial
pressure (CNAP) monitor [7] and NexFin [8] (BMEYE, Amsterdam, the Netherlands) devices. Some
noninvasive devices require calibration and others do not.
    Hemodynamic monitoring in the operating room and the intensive care unit has evolved over time
by the use of both arterial pressure monitoring and pulmonary artery catheter (PAC)-derived measures.
PAC-derived measures include pulmonary artery pressure, pulmonary artery occlusion pressure, mixed
venous oxygen saturation, and cardiac output (CO) by the thermodilution technique. Although it would
seem that these invasive monitoring techniques to estimate CO would be useful in patient manage-
ment, studies do not show improved outcomes when compared to their lack of use. There have been
multiple randomized controlled trials that have reported no evidence of benefit or harm from the use
of the PAC [9], and some literature has indicated that there may be an increase in complications sec-
ondary to the use of pulmonary artery catheterization [10e12]. There may be a few reasons why there
has been a failure to show the benefit of PAC: some of the studies may not have used treatments
requiring CO values to drive resuscitation, the treatments in the studies may not have been proven to
improve outcome, and the groups studied are too heterogeneous to document a benefit [13].
    Because of this overall lack of interest in the continued widespread use of the PAC, minimally
invasive techniques to estimate CO have gained increased appeal. This has led to increased interest
in arterial waveform analysis to provide this important information. The arterial waveform is
measured continuously in many operating rooms and intensive care units, and obtaining the
arterial pressure waveform can be accomplished by simple catheterization and even noninvasively.
The benefit is the continuous measurement of arterial pressure with decreased risk to the patient.
The cost that exists is the purchase of a device that allows for numerical computation but does not
require further specialty staff. Arterial waveform analysis also allows for the calculation of many so-
called derived parameters intrinsically created by this pulse pressure profile. These include esti-
mates of left ventricular stroke volume (SV), CO, vascular resistance, and during positive-pressure
breathing, SV variation, and pulse pressure variation (PPV). This article focuses on the principles of
arterial waveform analysis and their determinants, components of the arterial system, and arterial
pulse contour. It also addresses the advantage of measuring real-time CO by the arterial waveform
and the benefits to measuring stroke volume variation (SVV). Thus, arterial waveform analysis has
gained a large interest in the overall assessment and management of the critically ill and those at a
risk of hemodynamic deterioration.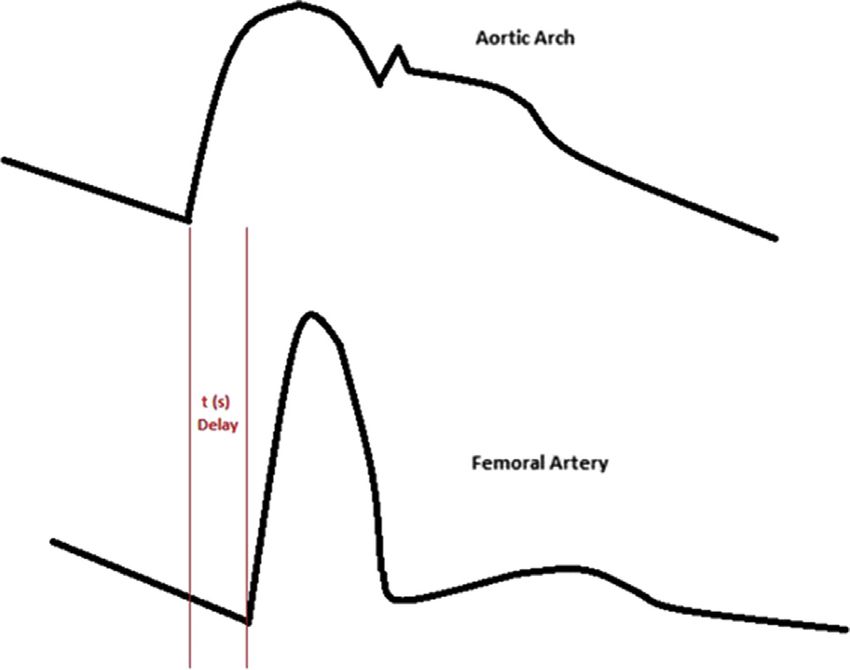
S.A. Esper, M.R. Pinsky / Best Practice & Research Clinical Anaesthesiology 28 (2014) 363e380 365
Technical aspects of pressure monitoring
Invasive monitoring requires the insertion of a catheter into a vessel, with all the associated po-
tential complications of bleeding, thrombosis, and infection. The decision to insert an arterial catheter
needs to be made with an understanding that it always carries a defined risk. Once the decision has
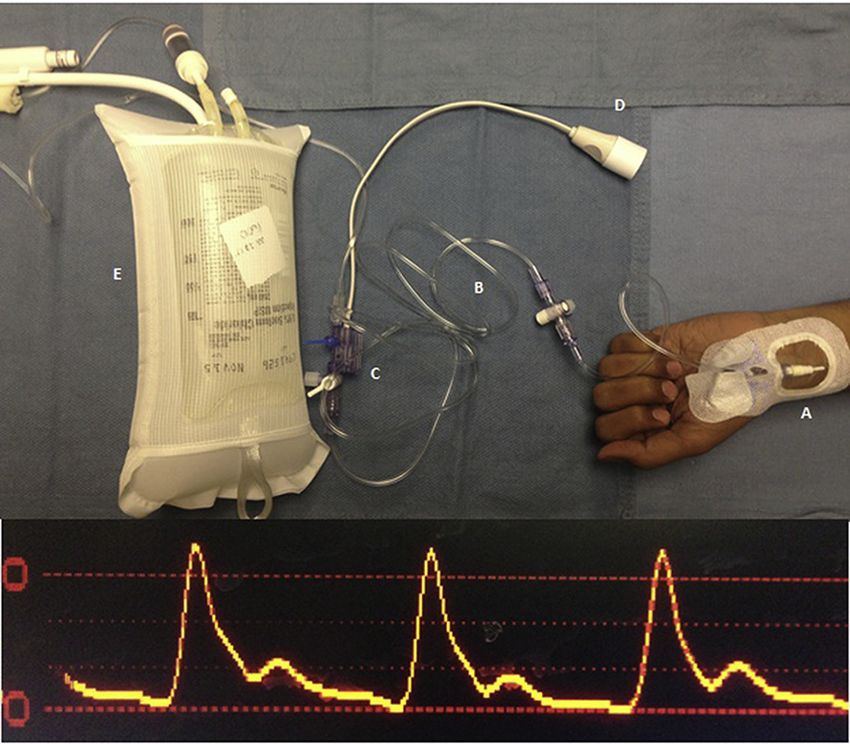
been made to insert an arterial catheter and the arterial cannula is in place, it needs to be connected to a
pressure transduction system so that accurate and continuous measures of arterial pressure can be
made (Fig. 1). The catheter and its connecting tubing need to be made of stiff materials so as not to
absorb the pressure waves which would potentially decrease pressure transfer from the catheter tip to
the pressure transducer system. Currently, normal catheter transduction systems include a parallel
saline or heparinized saline slow infusion system, which is pressurized (usually >200 mmHg) to allow
for slow (2e4 ml/h) continuous flush of the catheter tip into the blood stream. This slow infusion rate
does not affect pressure readings but tends to minimize thrombus formation on the catheter tip.
The pressure within the tubing of the column of saline varies with arterial pressure pulsation. As the
pressure varies, so does the deformity of the pressure transducer dome diaphragm. The transducer
diaphragm distortion causes a proportional change in resistance across a Wheatstone bridge-type
electrical circuit, such that the change in transducer current is directly proportional to changes in
pressure (Fig. 2) [14].
The arterial wave is a rather complex waveform and it can be expressed as a summation of harmonic
waves based upon Fourier theorem calculations. To report these pressure changes, the monitoring
system must have a frequency response that exceeds the natural frequency of the arterial pulse
(1e2.5 Hz). While most commercially available transducers have a frequency of several hundred hertz,
the addition of the tubing, micro-air bubbles in the tubing, thrombus on the catheter tip, and partially
closed stopcocks will decrease the overall frequency response of the monitoring system. A monitoring
system with too low a frequency response (over-dampened and a depressed waveform) or a high
frequency response (under-dampened and a rather vibrant waveform) will result in underestimation
or overestimation, respectively, of the arterial pulse pressure without altering the accuracy of reporting
the mean arterial pressure (MAP). Further, hyperresonance, an artifact secondary to the pressure wave
reverberation within the system, should be counterbalanced by an appropriate damping coefficient to
allow for accurate pressure profile analysis [15,16].
Fig. 1. 1a: (Top) Transduction system and arterial waveform. A: Arterial catheter in the radial artery. B: Stiff, low-compliance
pressure tubing. C: Transducer, which converts mechanical energy into the electrical signal. D: Electrical cable that connects to
the monitor. E: 250-mL bag of normal saline in a pressure bag inflated to nearly 300 mmHg. Fig. 1b: (Below) Arterial waveform signal
on the monitor.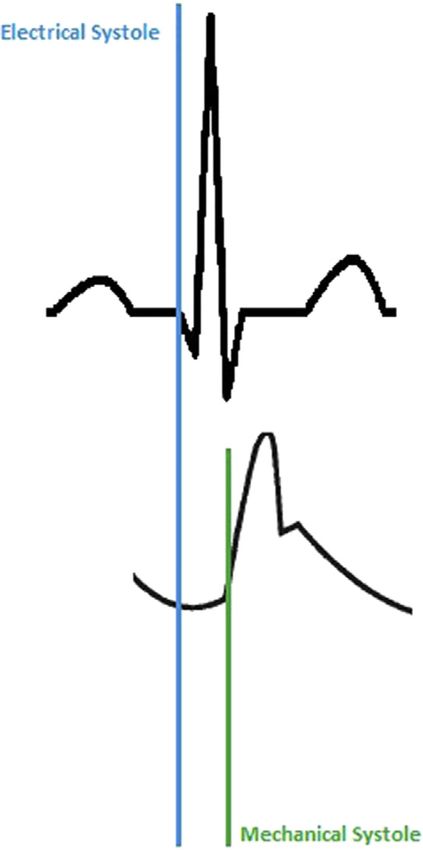
366                S.A. Esper, M.R. Pinsky / Best Practice & Research Clinical Anaesthesiology 28 (2014) 363e380

Fig. 2. Wheatstone Bridge. Pressure is applied to the diaphragm and distortion occurs. R1 and R3 increase, and R2 and R4 decrease
proportionally.

    Once the indwelling arterial catheter is connected through its fluid-filled stiff connecting tubing to
the pressure transducer, the system must be calibrated and have its zero reference value defined. Zero
pressure is defined as the isobestic point approximately equal to the hydrostatic pressure at the left of
the left atrium. If the pressure transducer's zero reference stopcock is opened to air and transducer
when the stopcock is at the isobestic point, then that value reported will be defined as zero for all
subsequent pressure recordings. If the zero reference point for the catheter measuring intrathoracic
pressures different than left atrial pressure once zeroing of the system has occurred, then the
monitoring system needs to be re-zeroed or a systemic pressure error will occur to all measured
pressures. If the patient sits up without a change in transducer height relative to the floor, then an
artifactual low arterial pressure will be reported. As the patient moves, the transducer must always
follow and stay at the level of the left atrium. Similarly, if the system is zeroed with the patient sitting
up and the patient then reclines, the measured arterial pressure will increase equal to the decrease in
the hydrostatic water column created by the position change. Finally, once zeroed, a reference
electrical signal is placed through the pressure transducer circuit known to be directly correlated with
the change in electrical output created by a known amount of increased pressure, usually 100 mmHg.
The “gain” of the system is thus modified so that zero reads zero and the calibration 100 mmHg
reports 100 mmHg. Once these processes are complete, the system can be used to monitor and use
the arterial waveform for clinical decision making.

The physiologic basis of the arterial pressure waveform [17,18]

    The systemic arterial pressure waveform is the result of systolic expulsion of blood from the left
ventricle, which is subsequently followed by diastolic arterial dissipation of the SV (Fig. 3). The elec-
trocardiograph (EKG) signal and the arterial waveform signal are inextricably tied together, one rep-
resenting the electrical contraction of the heart and the other representing its mechanical contraction.
The systolic upstroke of the arterial waveform in a peripheral artery may not appear for 120e200 ms
after the R-wave on the EKG, reflecting a time interval from electrical initiation through the expulsion
of blood by the ventricle, until it reaches the catheter and transducer.
    The systolic components, as labeled in Fig. 4, include a very steep rise or upstroke of the arterial
pressure from its nadir to a peak (systolic ejection with the opening of the aortic valve), as well as the
decline, as the heart goes into the end of systole and then the start of relaxation. The dicrotic notch, or
incisura, which interrupts the arterial downslope, represents the closure of the aortic valve, which
occurs just moments after the start of diastole. At the end of diastole, the waveform reaches its nadir.
Each component of the arterial waveform, diastolic pressure, peak pressure, ejection time, rate of rise
of arterial pressure during systole, and MAP are created based on several interrelated ventriculo-
arterial processes. There is a great deal of information that can be gleaned from examining the arte-
rial waveform.
S.A. Esper, M.R. Pinsky / Best Practice & Research Clinical Anaesthesiology 28 (2014) 363e380                  367

                                     Fig. 3. Electrocardiogram and arterial waveform diagram.

Arterial pressure

    MAP is the mean pressure averaged over time in the arterial tree at a defined locus (i.e., aortic arch,
abdominal aorta, and radial artery). An algorithm measuring the pressure area under a single beat can
also be used to calculate MAP [19]. As MAP is the pressure signal integrated over one cardiac cycle
(effectively the area under the curve) and as systole is usually shorter than diastole, the MAP is less
than the arterial pressure value halfway between systolic and diastolic arterial pressures. Mathe-
matically, it can be estimated as the sum of the diastolic arterial pressure plus one-third of the dif-
ference between the diastolic and systolic arterial pressure.

Fig. 4. An Arterial waveform. A: Upstroke of systole. B: Peak systole. C: Decreasing pressure during systole. D: Incisura. E: Diastole.
368 S.A. Esper, M.R. Pinsky / Best Practice & Research Clinical Anaesthesiology 28 (2014) 363e380
Distal arterial tree pressure amplification [20e24]
The arterial pulse pressure profile is not similar across the arterial tree but increases its systolic
pressure and decreases its diastolic pressure slightly as one moves the sampling loci further away from
the thoracic aortic root into the medium-sized arteries. Thus, the arterial pulse pressure increases as
one moves the sampling site distal from the aortic root to the most peripheral pulse along the arterial
tree (the radial artery in the upper extremity or the dorsalis pedis in the lower extremity). Different
physical characteristics of the vascular tree and ejection velocity will result in different morphologies at
each site. Owing to changes in impedance and harmonic resonance, the arterial upstroke becomes
steeper and its slope increases. The systolic peak is higher and the dicrotic notch appears later in the
cycle; the end-diastolic runoff is lower. There is an increase in systolic pressure and a decrease in
diastolic pressure when peripheral measurements are compared to central measurements. Similarly,
the further one measures the arterial pressure from the aortic values in the periphery, the wider the
pulse pressure becomes. Some of the phase differences are due to pulse wave velocity, as there is a 60-
ms delay between the aortic upstroke and its peripheral counterpart. However, despite these
morphological changes, the MAP is remarkably similar across the arterial tree, decreasing only slightly
in the distal periphery [25] (Fig. 5).
Contractility
The arterial waveform reflects the change in pressure over time, or dP/dt, and thus the slope of the
upstroke reflects this. Generally speaking, the steeper the slope, the quicker the rise, the greater the dP/
dt, and the stronger the contractile forces appear. The shallower the slope or the slower the rise in dP/
dt, the weaker the contractile forces appear. This information has been used in the titration of ino-
tropes. It is appropriate to mention that the relationship between dP/dt from the arterial waveform and
left ventricular contractility is controversial and may be rather complex [26]. Some studies seem to
support that the radial arterial waveform can be predictive of left ventricular function [27e29]. Other
studies indicate that the radial waveform is not a reliable marker of left ventricular systolic function
[30] and that dP/dt is not only affected by contractility but also by aortic diastolic pressure, ventricular
end-diastolic pressure, the manner in which the ventricle is activated, and intrinsic adjustments of
contractility [31]. One study suggested that the femoral measurement underestimated left ventricular
dP/dt but changes in the femoral measurement accurately reflected changes during left ventricular
treatment changes [32].
Fig. 5. Distal amplification of the arterial pulse, which includes the time delay.S.A. Esper, M.R. Pinsky / Best Practice & Research Clinical Anaesthesiology 28 (2014) 363e380 369
Central arterial compliance
The arterial pulse pressure is a function of the left ventricular SV, contractility, and central arterial
compliance. If the central arteries are stiffer, as often occurs with peripheral vascular atherosclerosis,
then the pulse pressure will be greater than if it were normal. Similarly, neonates with highly
complaint central arteries have a low pulse pressure. Finally, as the peripheral vasomotor tone changes,
for the same SV, arterial pulse pressure will covary, increasing with increased arterial tone and
decreasing with decreased arterial tone. Accordingly, arterial pulse pressure is an extremely revealing
parameter within the arterial pressure profile.
Peripheral vascular resistance
The downstroke of the arterial waveform, or diastolic runoff, indicates how much resistance exists
throughout the vascular tree to sustain pressure once left ventricular ejection into the arterial tree has
stopped. When SV is stable and/or fixed, changes in vascular resistance will manifest as changes in the
downslope of the arterial waveform. If the arterial waveform downstroke sharply decreases, as often is
the case with vasodilator therapy or sepsis, there is little resistance to blood flow. If the downstroke of
the arterial waveform is rather shallow, as is often in the case of severe heart failure, then this indicates
a higher resistance. However, this feature has not been utilized clinically as it requires a priori
knowledge of SV. Attempts to quantify SV and SVR purely from the shape of the arterial waveform have
proven to be difficult.
Hypovolemia
As venous return to the heart varies with positive-pressure ventilation, the arterial pulse pressure
may also vary. Thus, changes in pulse pressure across the ventilatory cycle, referred to as pulse pressure
variation (PPV), can be used as a surrogate for volume responsiveness. Increasing PPV can be used to
identify functional hypovolemia [33e35]. Hypovolemia will cause a large increase in the variation of
both systolic pressure and pulse pressure compared to normovolemic states. Large systolic pressure or
PPVs are correlated with lower amounts of intrathoracic blood volume and ventricular filling pressures
[36]. Indeed, these functional hemodynamic parameters are more specific at defining volume
responsiveness than are static measures of ventricular preload [33].
Practice points:
! Distal amplification results in an increase in systolic pressure readings and a decrease in
diastolic pressure readings. However, throughout the arterial tree, the MAP is the same.
! The arterial waveform not only measures arterial pressure but can also be used to measure
SVV, hypovolemia, contractility, and the magnitude of peripheral vascular resistance. This
can help direct therapy in terms of the need for fluid, inotropy, or vasopressors
Means to measure CO using arterial waveforms [37]
There are multiple ways of measuring the CO. While the Fick principle and an electromagnetic
flowmeter can be used to accurately predict CO, the most commonly used approach is using the in-
dicator dilution technique to measure CO either periodically or continuously. Indicator dilution tech-
niques can use any indicator that than be sensed downstream including thermodilution of a cold or hot
thermal bolus, lithium, and indocyanine green. Following a venous bolus injection of the indicator, it is
mixed by passage across the right ventricle and if sampled over time in the pulmonary artery, and the
arterial tree will display a rapid indicator level increase followed by a logarithmic decay. The slope of370 S.A. Esper, M.R. Pinsky / Best Practice & Research Clinical Anaesthesiology 28 (2014) 363e380
the decay portion of the curve is inversely related to blood flow. These approaches are based on the
StewarteHamilton formula [38].
The PAC uses this principle by measuring the thermal signal in the pulmonary artery when a
thermal signal is given into the upstream central venous site. The strength of this approach is that it
requires only one catheter to measure CO. The weakness is that the pulmonary artery flow, which is
what is measured, varies widely over the ventilatory cycle. Thus, measures of CO using the PAC will
show a wide range of variability due to these non-artifactual effects. Accordingly, many measurements
(usually four to five) need to be carried out and their values averaged to derive a relatively accurate CO
estimation.
Indicator dilution can also be transpulmonary using two invasive devices, a central venous catheter,
where the indicator is injected, and an arterial indicator sensor [39e41]. Different arterial sites can be
used for indicator sampling, including the radial, brachial, axillary, and femoral arteries [42]. Studies
have further verified transpulmonary thermodilution reliability [43] and precision [44] against the
pulmonary artery thermodilution technique. Transpulmonary thermodilution has multiple advantages
apart from providing CO. First, cold saline is cheap and readily available. Second, the variation in CO
estimates due to respiratory changes in flow is less due to the buffering of blood within the pulmonary
circulation. Third, it can provide other parameters that might be useful in bedside management, such as
extravascular lung water [45]; pulmonary vascular permeability; the cardiac function index, which is a
marker of the cardiac systolic function [46]; and the global end-diastolic volume, which is a marker of
cardiac preload [43]. Lithium, as an indicator for estimating CO, has the same stability advantage as
thermodilution but has an increased sensitivity, as no lithium is usually present in the blood stream.
Thus, lithium indicator dilution has a greater signal to noise ratio than thermodilution. However, it
requires injection of lithium and the need for a lithium sensor, which usually is extracorporeal
requiring a small blood sampling technique. Any device using this type of indicator dilution is
considered “less invasive” rather than “minimally invasive,” [47] because it does not require a PAC.
The Fick principle can also be applied to measure CO. The Fick principle states that the amount of
oxygen consumed must equal the difference in oxygen quantity between the arterial and venous cir-
culation [32]. Oxygen consumption and content are required for the actual measurement and, again,
the use of an invasive monitor, the PAC, is necessary to obtain certain measurements because one needs
to measure mixed venous and arterial blood oxygen levels.
The most accurate way to measure CO is using an electromagnetic or ultrasonic flow meter. An
ultrasound can be applied to the aorta to obtain instantaneous pulsatile flow and produces a cardiac
cycle flow curve, which when combined with the aortic diameter at the site of the velocity measure
defined flow. The integral of this curve is the SV, and SV multiplied by the heart rate is the CO.
Continuous measures of flow using these devices require an invasive procedure, either a sternotomy or
a thoracotomy, making this an impractical universal solution. However, during cardiac surgery and
with the insertion of left ventricular assist devices, such measures can be used to calibrate these
ventricular support devices. A more practical way of measuring the CO with a less invasive approach,
relative to surgical exposure, is by the use of transesophageal EKG and the Doppler method. This in-
volves measuring the cross-sectional area of the left ventricular outflow tract as well as the instan-
taneous velocity through the left ventricular outflow tract and aortic valve at the point of the
measurement. Then, integrating the velocity as a function of time, one can achieve SV measurements.
This approach is operator dependent in getting a proper visualization window and can give CO esti-
mates only when applied, not continually. Still, it is accurate in an experienced echocardiographer's
hands and regrettably underutilized. A less invasive, simpler form of this approach is to use the ul-
trasonic cardiac output monitoring (USCOM) device that measures the aortic flow velocity at the aorta.
As it does not usually measure aortic diameter, it can only estimate flow, but has as its main advantage
ease of use, noninvasiveness, and reproducibility.
CO is a major part of the hemodynamic profile. CO is routinely used to categorize physiologic and
pathologic cardiovascular states and to monitor response to therapy. Measurements of beat-to-beat SV
and arterial pulse pressure have become important in analyzing the cardiovascular state. The per-
centage of variation of SV over time during positive-pressure breathing, known as the SVV, like PPV,
defines preload reserve [48]. While multiple studies have revealed that PPV and SVV variations are not
exactly the same [49,50], SVV has been just as reliable as PPV to predict fluid responsiveness [51e68].S.A. Esper, M.R. Pinsky / Best Practice & Research Clinical Anaesthesiology 28 (2014) 363e380 371
Unfortunately, using the SVV to predict fluid responsiveness is still subject to the same limitations as
using PPV. These limitations include a lack of spontaneous ventilatory efforts, large-enough tidal
volumes to induce a venous return change (e.g., ~8 ml/kg tidal breath), decreased lung compliance
(restrictive disease), open chest conditions, and cardiac arrhythmias [69,70]. Arterial pressure wave-
form analysis when used to estimate SV and CO provides significant help in assessing rapid CO changes,
as may occur with passive leg raising [51,52,70e73], an end-expiratory occlusion test [70,73,74], or a
fluid bolus challenge. There are multiple devices that can be applied in a minimally invasive or
noninvasive fashion to measure CO.
Practice points:
! The arterial waveform can be used to estimate CO to further guide therapy, though looking at
the arterial waveform alone is not adequate.
! The limitations of these devices include decreased accuracy in the setting of aortic insuffi-
ciency and large changes in afterload must be taken into account.
! The calibration of instruments is generally through thermodilution, either with lithium or with
known-temperature saline.
! There are clinically defined targets for SVV and CO therapies.
Less, minimally, and noninvasive devices to measure arterial pressure
There exists a complex relationship between the MAP and the CO. As a result, multiple algorithms
have been used to calculate the CO based on assumptions of central arterial compliance, resistance, and
impedance. The electric current analogy indicates that the systemic vasculature acts as the resistance to
the current or pressure, supplied by the heart [32]. Ohm's law (V ¼ IR) can then be used to calculate the
flow. However, this is not especially accurate for pulsatile flow within arteries, but for flow averaged over
time. The Windkessel model [75,76] is more accurate to describe the relation between pressure and flow
accounting for pulsatile flow. Further, the arteries act as a capacitor because they hold a significant
amount of blood, which have by their vessel wall nature an inherent impedance to a change in volume.
The Liljestrand and Zander method [32,77] assumes that arterial capacitance varies as a function of
pressure in that as arterial pressure increases, the arterial walls stiffen and capacitance is reduced.
The major issue with these models is that the arterial tree is distributed into multiple branches with
effects including impedance and wave reflection. Most models and all commercially available device
models presume a “lumped parameter” estimate of resistance, compliance, and impedance. The
present-day approaches to estimating SV from the arterial pressure profile have their roots in 1950s
studies documenting that the SV is proportional to the area under the curve of the systolic portion of
the arterial waveform [78] and a correction factor for calculation of CO. The Godje nonlinear compli-
ance model [32,79] added on to the Windkessel model and made the heart a source of pressure, not a
source of flow. It takes into account arterial compliance. The Wesseling Modelflow [32,80] further takes
into account that the entire vasculature is nonlinear. This group used systemic arterial pressure in
humans to compute aortic flow. They found that aortic impedance is a function of arterial compliance,
compliance is a function of pressure, and resistance is a function of pressure divided by flow. As a result
of these observations, formulae were created allowing accurate estimates of CO from the direct analysis
of the arterial pressure waveform in real time.
In 2001, a new method of CO estimation, called the pulse contour CO algorithm (PulseCO), was
devised based on frequency analysis from arterial systems [81]. This study compared PulseCO with
transpulmonary thermodilution and found that CO can be estimated accurately. Based on the princi-
ples of the conservation of mass and power, the PulseCO algorithm calculates SV from an analysis of the
SV-induced pulsatile change in the pressure waveform. The advantage of the PulseCO algorithm over
the original Modelflow approach is that its estimates of CO are less sensitive to artifactual changes in
the arterial pressure waveform contour, especially in the instance of vasopressor administration or
catheter tip clot formation [82].372 S.A. Esper, M.R. Pinsky / Best Practice & Research Clinical Anaesthesiology 28 (2014) 363e380
Present-day Food and Drug Administration (FDA)-approved devices can analyze the arterial
waveform and pressure curve from a peripheral artery such as the radial or femoral artery, compute CO,
and if present quantify SVV and PPV. Because all devices use different algorithmic approaches, as
described above, the devices display different levels of accuracy depending on the pathologic states
studied. Still, to be useful clinically, all the devices must be able to:
1. Analyze the geometry of the arterial pressure curve, especially the systolic portion. Recall that SV is
proportional to the amplitude of the pressure curve.
2. Estimate arterial compliance while accounting for arterial tone. There is a constant, k, that is inversely
proportional to arterial compliance and k is a multiplication factor proportional to the amplitude of
the pressure curve. Additionally, pulse amplification is dependent upon arterial resistance.
3. Estimate aortic pressure from peripheral pulse pressure understanding the concept of distal
amplification, already described.
Two types of devices utilize the arterial waveforms that have been developed. One type requires
external calibration so that it can then calculate the patient's specific compliance and impedance, and
the other type is uncalibrated, assuming a standard compliance and impedance based on known
normal age-, sex-, and size-specific values. In general, the calibrated devices are more accurate
immediately following calibration but their accuracy degrades over time. It is not clear if the uncali-
brated devices change their accuracy over time more than the variation in the physiologic state. For the
calibrated devices (Table 1), depending on the brand, transpulmonary dilution can be accomplished
with the use of cold saline or lithium.
The following are calibrated devices (alphabetical order): LiDCOplus (LiDCO, Ltd., London, UK),
PiCCO plus (Pulsion Medical Systems, Munich, Germany), and VolumeView/EV1000 (Edwards Life-
sciences, Irvine, CA, USA). The following minimally invasive devices do not require calibration
(alphabetical order): FloTrac/Vigileo (Edwards Lifesciences, Irvine, CA, USA), LiDCOrapid (LiDCO Ltd.,
London, UK), Mostcare (VytechHealth, Padua, Italy), and ProAQT/Pulsioflex (Pulsion Medical Systems,
Munich, Germany).
Calibrated devices (Table 1)
These devices are considered “less invasive” because of the use of a central venous catheter for
calibration instead of a PAC. Using the lithium transpulmonary dilution technique to calibrate the analysis
of the pressure waveform, the LiDCOplus uses the PulseCO algorithm to analyze the arterial waveform.
The reliability of the LiDCOplus device has been reliably and successfully compared to thermodilution
methods in multiple studies [83e87]. In addition to being less sensitive to arterial curve morphology
changes, it is also supposed to be less sensitive to arterial catheter pressure dampening.
Table 1
Calibrated devices that measure cardiac output.
Device Calibration Algorithm Special features Disadvantages
LiDCOplus Lithium PulseCO - Less sensitive to arterial - Less invasive
transpulmonary morphology changes
dilution - Less sensitive to arterial
pressure dampening
PiCCO Transpulmonary Analyzes pulse contour - Estimates arterial - Less invasive
thermodilution and integrates compliance and SVR - Requires multiple
area under systolic - CO based on real-time recalibrations
portion of the curve, hemodynamics - Questionable accuracy
dividing it by aortic - Valid against PAC in hypothermic states
compliance
VolumeView/ Transpulmonary Langewouters' - Validated with hyperdynamic - Less invasive
E1000 thermodilution and vasoplegic patients
- Possible improved precision
over PiCCOS.A. Esper, M.R. Pinsky / Best Practice & Research Clinical Anaesthesiology 28 (2014) 363e380 373
Calibrated by transpulmonary thermodilution (making it a “less invasive device” as compared to a
“minimally invasive device”), the PiCCO device analyzes the pulse contour and then estimates CO by
integrating the area under the systolic part of the arterial curve and dividing it by the aortic compliance
[88]. The geometric properties of the curve, including the dicrotic notch, are accounted for. Multiple,
separate algorithms are required to estimate the arterial compliance and systemic vascular resistance
(SVR), which in this approach is defined as the MAP divided by the CO. Recalibration of all externally
calibrated devices is often required to estimate arterial compliance as well as SVR, if the physiologic
state changes markedly. This continuous reassessment allows the systems to adapt to CO estimation
based upon the patient's real-time hemodynamics. Multiple studies have reliably validated that the
PiCCO plus device estimation of CO as compared to the PAC is acceptable [82,88e95], though one study
[94] indicated that measurements are better when they are performed closer to the calibration period.
In fact, the same study indicated that measurements were unreliable if a prior calibration was not
performed more than an hour before, secondary to dynamic changes in the patient's arterial SVR. This
has been cited as a disadvantage to the PiCCO plus device. Further, though studies have attempted to use
the PiCCO plus device in patients with hypothermia [96], it should be validated against more proven
techniques [97]. Further, from the same study, it has also been suggested that a non-temperature or
metabolism-independent calibration needs to be used, as temperature may not be as precise for hy-
pothermic patients. Ultrasound approaches spot estimates of CO would fulfill this requirement.
The VolumeView/E1000 is another calibrated device that requires transpulmonary thermodilution
and is rather similar to the PiCCO system. Based on the Langewouters method [98], the SV is estimated
by pulsatility and a constant k, which quantifies arterial resistance and compliance. This method has
been supported by a large database of pressure tracings recorded in hyperdynamic and vasoplegic
patients [99]. It has been validated to be reliable in a recent study, which has appeared to indicate that
not only is it as reliable as the PiCCO but also an improved precision over that of the PiCCO was seen
with this device [100].
Uncalibrated devices (Table 2)
These devices are considered minimally invasive because they only require an arterial catheter.
The FloTrac/Vigileo has an algorithm by the Langewouters method [98], similar to the VolumeView/
EV1000. This device consists of a standard arterial catheter and a standard arterial line, which is
connected to a disposable specific pressure transducer (“FloTrac”). The latter is connected to the Vigileo
device, which performs analysis and displays CO.
Table 2
Uncalibrated devices that measure cardiac output.
Device Algorithm Special features Disadvantages
FloTrac/Vigileo Langewouters - Most studied - Controversial reliability
- Reliable in perioperative period outside of perioperative period
- Reliability decreases with
variations of vasomotor tone
- Less invasive
LiDCOrapid PulseCO - Height, age, and weight nomograms - Less invasive
infer arterial compliance - When compared to
- Can measure CO by separate technique esophageal Doppler,
reliability is poor
ProAQT/Pulsioflex Confidential, using - Can measure CO by separate technique - Still requires validation
height, weight, age, - Analyze waveform 250 times/second - Less invasive
MAP, HR for
autocalibration
MostCare PRAM - No calibration required - Less invasive
- Acceptable reliability in cardiac
surgical population
- Can use with IABP
- Can use with critically ill patients374 S.A. Esper, M.R. Pinsky / Best Practice & Research Clinical Anaesthesiology 28 (2014) 363e380
The reliability of the FloTrac/Vigileo, or any uncalibrated device, is debated in the literature, more
than for calibrated devices. The first uncalibrated device, FloTrac/Vigileo, has been the most studied.
Multiple studies show a good reliability when compared to PAC thermodilution studies [99,101e106].
However, there are as many number of studies that demonstrate that it is not accurate [92e119]. Good
reliability was shown in the perioperative setting [92e94,96]. However, the reliability of the FloTrac/
Vigileo seems to decrease if there are vasomotor tone changes to a large extent [107,113,114,116,117]
such as in patients who are critically ill [111,115e117] or patients undergoing liver surgery
[107e110,112,118,119]. An example of this was demonstrated by Monnet et al., who found that the
reliability of a recent version of the FloTrac/Vigileo was much poorer to track the changes in CO when
they were induced by changing the dose of norepinephrine than by administering a volume expansion
[116].
In general, any uncalibrated pulse contour analysis device is subject to poor reliability when the
arterial pressure is modified. The cases include aortic valvular regurgitation [113], aortic stenosis [120],
intra-arterial balloon counterpulsation [121], and simple dampening of the arterial waveform from air
bubbles in the pressure tubing or kinks in the catheter or tubing.
The LiDCOrapid uses the same PulseCO algorithm as already described. Further, the patient's age,
height, and weight are used to infer the arterial compliance through established nomograms. While it
does not require any calibration, the CO, measured from an independent technique, can be entered. Its
reliability is not considered to be as good as an esophageal Doppler [122]. Whether this was due to
using a poor reference technique, descending aortic flow as a measure of total CO or actual errors in
PulseCO, is unclear [123].
The ProAQT/Pulsioflex incorporates height, weight, age, MAP, and heart rate for the use of its own
autocalibration algorithm, and from these values, the CO is inferred from a company-specific and
confidential analysis, which is not based on the Windkessel model discussed before. Pulse contour
analysis is then accomplished by the analysis of the arterial waveform 250 times per second [124].
Similar to the LiDCOrapid, one can enter the CO from another independent technique to avoid drift.
This device still requires study and validation.
The MostCare is another uncalibrated device that utilizes the pressure-recording analytical method
(PRAM) [125], which is based on the principle that, in a given vessel, variations in pressure cause
responsorial radial expansion [126]. The process involves the force of left ventricular ejection, arterial
impedance and compliance, and peripheral small vessel resistance. This is the only device that does not
require any calibration and is independent of the baseline characteristic data of the patients [127]. Its
reliability appears to be acceptable in cardiac surgery patients [126]. In contrast to the LiDCO, even in
critically ill septic patients, receiving norepinephrine and compared to the PAC, the PRAM system
exhibited an acceptable percentage of error [128]. Interestingly, patients with an intra-aortic balloon
pump using this device had an acceptable percentage of error [121,129,130], though one study showed
a large difference between the PRAM and PAC estimates of CO [131].
The Nexfin device (BMEYE, Amsterdam, the Netherlands) uses a completely noninvasive method of
measuring patient hemodynamics. Connected to the patient by wrapping an inflatable cuff around the
middle phalanx of the finger, “the pulsating finger artery is clamped to a constant volume by applying a
varying counter pressure equivalent to the arterial pressure.” [124] This is called the volume-clamp
method. The resulting brachial waveform, which is reconstructed based on an algorithm, serves as
the basis to measure CO. The Windkessel model is also used, incorporating arterial pressure, height,
weight, and gender regarding the vascular properties [132]. Multiple studies have validated this for the
measurement of arterial pressure [133e140]. The reliability of this estimation of CO, similar to the
LiDCO device, provided conflicting results, with some positive [134,141e147] and negative studies
[140,148,149]. Once again, critically ill patients with possible poor perfusion of the extremities, in septic
shock, may impede a correct measurement of the curve described above. Thus, this device may be
better suited for the operating theater or other healthy subjects.
In summary, the calibrated devices tend to give more accurate trending data but often are more
invasive. Thus, they are more likely indicated in those patients who are critically ill requiring vaso-
pressor support, or in those patients in whom the vasomotor tone is rather unstable, such as septic
shock. Uncalibrated devices can be set up quickly and tend to be less expensive and thus may be more
useful in healthier subjects, presenting to the operating theater or within the perioperative period.S.A. Esper, M.R. Pinsky / Best Practice & Research Clinical Anaesthesiology 28 (2014) 363e380 375
Practice points:
! There are multiple systems that can be used to measure CO from the arterial waveform.
Some require calibration and others do not.
! There is one system that is completely noninvasive, which is the Nexfin.
! Systems that require calibration require central venous catheterization. While uncalibrated
systems are less invasive, they may not be as accurate or reliable as the calibrated devices.
! Calibrated devices may require multiple recalibrations to guarantee the best accuracy.
! The accuracy and reliability of less invasive and noninvasive devices within the context of the
disease state of the patient and the therapy and temperature required for the patient.
Research points:
! Further research is warranted regarding the interactions between MAP and CO/PPV/SVV, in
the context of vasomotor tone, that is, the septic patient.
! Further research is warranted regarding the interactions of different modes of therapy and
how to define the goals of resuscitation
! Further research is warranted regarding how to use the information given by the arterial
waveform to recognize early onset of instability for early therapy
Conflicts of interest
Stephen A. Esper: None declared.
Michael R. Pinsky: Consultant to Edwards LifeSciences, Inc, LiDCO Ltd, Cheetah Medical Inc and
Massimo Inc. Stock options with LiDCO Ltd and Cheetah Medical Inc.
Funding
This work was supported, in part, by NIH grant HL67181.
References
[1] Lewis O. Stephen Hales and the measurement of blood pressure. J Hum Hypertens Dec 1994;8(12):865e71.
[2] DA Q. Daniel Bernoulli and the making of the fluid equation. Plus Mag 1997. http://plus.maths.org/content/os/issue1/
bern/index.
[3] Sutera SP, Skalak R. The history of Poiseuille law. Annu Rev Fluid Mech 1993;25:1e19.
[4] Peterson LH, Dripps RD, Risman GC. A method for recording the arterial pressure pulse and blood pressure in man. Am
Heart J Apr 15 1949;37(5):771e82.
[5] Peirce 2nd EC. Percutaneous femoral artery catheterization in man with special reference to aortography. Surg
Gynecol Obstetr Jul 1951;93(1):56e74.
[6] Seldinger SI. Catheter replacement of the needle in percutaneous arteriography; a new technique. Acta Radiol May
1953;39(5):368e76.
[7] Dewhirst E, Corridore M, Klamar J, et al. Accuracy of the CNAP monitor, a noninvasive continuous blood pressure
device, in providing beat-to-beat blood pressure readings in the prone position. J Clin Anesth Jun 2013;25(4):309e13.
[8] Ameloot K, Van De Vijver K, Van Regenmortel N, et al. Validation study of Nexfin(R) continuous non-invasive blood
pressure monitoring in critically ill adult patients. Minerva Anestesiol Apr 4 2014 [Epub ahead of print].
[9] Harvey S, Harrison DA, Singer M, et al. Assessment of the clinical effectiveness of pulmonary artery catheters in
management of patients in intensive care (PAC-Man): a randomised controlled trial. Lancet Aug 6e12 2005;
366(9484):472e7.
[10] American Society of Anesthesiologists Task Force on Pulmonary Artery C. Practice guidelines for pulmonary artery
catheterization: an updated report by the American Society of Anesthesiologists Task Force on Pulmonary Artery
Catheterization. Anesthesiology Oct 2003;99(4):988e1014.
[11] Payen D, Gayat E. Which general intensive care unit patients can benefit from placement of the pulmonary artery
catheter? Crit Care 2006;10(Suppl. 3):S7.376 S.A. Esper, M.R. Pinsky / Best Practice & Research Clinical Anaesthesiology 28 (2014) 363e380
[12] Sandham JD, Hull RD, Brant RF, et al. A randomized, controlled trial of the use of pulmonary-artery catheters in high-
risk surgical patients. New Engl J Med Jan 2 2003;348(1):5e14.
[13] Chatterjee K. The Swan-Ganz catheters: past, present, and future. A viewpoint. Circulation Jan 6 2009;119(1):147e52.
[14] Ekelhof S. The genesis of the Wheatstone bridge. Eng Sci Educ J February 2001;10(1):37e40.
[15] Schroeder RA, BA, Bar-Yosef S, et al. Miller's anesthesia. 7th ed., vol. 1. Philadelphia, PA: Churchill Livingstone, Elsevier;
2010.
[16] Butterworth JF, MD, Wasnick JD. Morgan & Mikhail's clinical anesthesiology: cardiovascular monitoring. 5th ed.
United States: McGraw-Hill Companies Inc; 2013.
[17] Durie M, Beckmann U, Gillies DM. Incidents relating to arterial cannulation as identified in 7,525 reports submitted to
the Australian incident monitoring study (AIMS-ICU). Anaesth Intensive Care Feb 2002;30(1):60e5.
[18] McCann 2nd UG, Schiller HJ, Carney DE, et al. Invasive arterial BP monitoring in trauma and critical care: effect of
variable transducer level, catheter access, and patient position. Chest Oct 2001;120(4):1322e6.
[19] Ream AK. Mean blood pressure algorithms. J Clin Monit Apr 1985;1(2):138e44.
[20] Dorman T, Breslow MJ, Lipsett PA, et al. Radial artery pressure monitoring underestimates central arterial pressure
during vasopressor therapy in critically ill surgical patients. Crit Care Med Oct 1998;26(10):1646e9.
[21] ORourke MF, Gallagher DE. Pulse wave analysis. J Hypertens Dec 1996;14:S147e57.
[22] O'Rourke MF, Yaginuma T. Wave reflections and the arterial pulse. Arch Intern Med Feb 1984;144(2):366e71.
[23] Weiss BM, PT. Measurement of systemic arterial pressure. Curr Opin Anaesthesiol 1997;10:459e66.
[24] Abrams JH, CF, Holcroft JW. Cardiopulmonary monitoring. New York: Scientific American Medicine; 1989.
[25] Mark JB. Atlas of cardiovascular monitoring. New York: Churchill Livingstone; 1998.
*[26] Thiele RH, Durieux ME. Arterial waveform analysis for the anesthesiologist: past, present, and future concepts. Anesth
Analgesia Oct 2011;113(4):766e76.
[27] Germano G, Angotti S, Muscolo M, et al. The (dP/dt)max derived from arterial pulse waveforms during 24 h blood
pressure oscillometric recording. Blood Press Monit Jun 1998;3(3):213e6.
[28] Tartiere JM, Logeart D, Beauvais F, et al. Non-invasive radial pulse wave assessment for the evaluation of left ven-
tricular systolic performance in heart failure. Eur J Heart Fail May 2007;9(5):477e83.
[29] Tartiere JM, Tabet JY, Logeart D, et al. Noninvasively determined radial dP/dt is a predictor of mortality in patients with
heart failure. Am Heart J Apr 2008;155(4):758e63.
[30] Sharman JE, Qasem AM, Hanekom L, et al. Radial pressure waveform dP/dt max is a poor indicator of left ventricular
systolic function. Eur J Clin Investig Apr 2007;37(4):276e81.
[31] Wallace AG, Skinner NS, Mitchell JH. Hemodynamic determinants of maximal rate of rise of left ventricular pressure.
Am J Physiol 1963;205(1):30.
[32] De Hert SG, Robert D, Cromheecke S, et al. Evaluation of left ventricular function in anesthetized patients using
femoral artery dP/dt(max). J Cardiothorac Vasc Anesth Jun 2006;20(3):325e30.
[33] Coriat P, Vrillon M, Perel A, et al. A comparison of systolic blood pressure variations and echocardiographic estimates
of end-diastolic left ventricular size in patients after aortic surgery. Anesth Analgesia Jan 1994;78(1):46e53.
[34] Pizov R, Segal E, Kaplan L, et al. The use of systolic pressure variation in hemodynamic monitoring during deliberate
hypotension in spine surgery. J Clin Anesth MareApr 1990;2(2):96e100.
[35] Rooke GA, Schwid HA, Shapira Y. The effect of graded hemorrhage and intravascular volume replacement on systolic
pressure variation in humans during mechanical and spontaneous ventilation. Anesth Analgesia May 1995;80(5):
925e32.
[36] Marik PE. The systolic blood pressure variation as an indicator of pulmonary capillary wedge pressure in ventilated
patients. Anaesth Intensive Care Aug 1993;21(4):405e8.
[37] XS J. Cardiac output estimation using arterial blood pressure [Scientific]. MIT: Massachusetts Institute of Technology,
Department of Electrical Engineering and Computer Science, Massachusetts Institute of Technology; 2006.
[38] Sakka SG, Reuter DA, Perel A. The transpulmonary thermodilution technique. J Clin Monit Comput Oct 2012;26(5):
347e53.
[39] Sakka SG, Reinhart K, Meier-Hellmann A. Comparison of pulmonary artery and arterial thermodilution cardiac output
in critically ill patients. Intensive Care Med Aug 1999;25(8):843e6.
[40] Faybik P, Hetz H, Baker A, et al. Iced versus room temperature injectate for assessment of cardiac output, intrathoracic
blood volume, and extravascular lung water by single transpulmonary thermodilution. J Crit Care Jun 2004;19(2):103e7.
[41] Bock JC, Barker BC, Mackersie RC, et al. Cardiac-output measurement using femoral-artery thermodilution in patients.
J Crit Care Jun 1989;4(2):106e11.
[42] Segal E, Katzenelson R, Berkenstadt H, et al. Transpulmonary thermodilution cardiac output measurement using the
axillary artery in critically ill patients. J Clin Anesth May 2002;14(3):210e3.
*[43] Reuter DA, Huang C, Edrich T, et al. Cardiac output monitoring using indicator-dilution techniques: basics, limits, and
perspectives. Anesth Analgesia Mar 1 2010;110(3):799e811.
[44] Monnet X, Persichini R, Ktari M, et al. Precision of the transpulmonary thermodilution measurements. Crit Care 2011;
15(4):R204.
[45] Monnet X, Teboul JL. Clinical utility of extravascular lung water measurements. In: Vincent JL, editor. Yearbook of
intensive care and emergency medicine. Berlin e Heidelberg e New-York: Springer Verlag; 2009. p. 433e42.
[46] Jabot J, Monnet X, Lamia B, et al. Cardiac function index provided by transpulmonary thermodilution behaves as an
indicator of left ventricular systolic function. Crit Care Med 2009;37:2913e8.
[47] Belda FJ, Aguilar G, Teboul JL, et al. Complications related to less-invasive haemodynamic monitoring. Br J Anaesth Apr
2011;106(4):482e6.
*[48] Monnet X, Teboul JL. Assessment of volume responsiveness during mechanical ventilation: recent advances. Crit Care
Mar 19 2013;17(2):217.
[49] de Wilde RB, Geerts BF, van den Berg PC, et al. A comparison of stroke volume variation measured by the LiDCOplus
and FloTrac-Vigileo system. Anaesthesia. Sep 2009;64(9):1004e9.
*[50] Pinsky MR. Functional hemodynamic monitoring. Intensive Care Med Apr 2002;28(4):386e8.S.A. Esper, M.R. Pinsky / Best Practice & Research Clinical Anaesthesiology 28 (2014) 363e380 377
*[51] Monnet X, Dres M, Ferre A, et al. Prediction of fluid responsiveness by a continuous non-invasive assessment of
arterial pressure in critically ill patients: comparison with four other dynamic indices. Br J Anaesth Sep 2012;109(3):
330e8.
[52] Monnet X, Guerin L, Jozwiak M, et al. Pleth variability index is a weak predictor of fluid responsiveness in patients
receiving norepinephrine. Br J Anaesth Feb 2013;110(2):207e13.
[53] Rex S, Schalte G, Schroth S, et al. Limitations of arterial pulse pressure variation and left ventricular stroke volume
variation in estimating cardiac pre-load during open heart surgery. Acta Anaesthesiol Scand Oct 2007;51(9):1258e67.
[54] Marx G, Cope T, McCrossan L, et al. Assessing fluid responsiveness by stroke volume variation in mechanically
ventilated patients with severe sepsis. Eur J Anaesthesiol Feb 2004;21(2):132e8.
[55] Vos JJ, Kalmar AF, Struys MM, et al. Comparison of arterial pressure and plethysmographic waveform-based dynamic
preload variables in assessing fluid responsiveness and dynamic arterial tone in patients undergoing major hepatic
resection. Br J Anaesth Jun 2013;110(6):940e6.
[56] Trepte CJ, Eichhorn V, Haas SA, et al. Comparison of an automated respiratory systolic variation test with dynamic
preload indicators to predict fluid responsiveness after major surgery. Br J Anaesth Nov 2013;111(5):736e42.
[57] Biais M, Nouette-Gaulain K, Cottenceau V, et al. Uncalibrated pulse contour-derived stroke volume variation predicts
fluid responsiveness in mechanically ventilated patients undergoing liver transplantation. Br J Anaesth Dec 2008;
101(6):761e8.
[58] Berkenstadt H, Margalit N, Hadani M, et al. Stroke volume variation as a predictor of fluid responsiveness in patients
undergoing brain surgery. Anesth Analgesia Apr 2001;92(4):984e9.
[59] Yang SY, Shim JK, Song Y, et al. Validation of pulse pressure variation and corrected flow time as predictors of fluid
responsiveness in patients in the prone position. Br J Anaesth May 2013;110(5):713e20.
[60] Hofer CK, Senn A, Weibel L, et al. Assessment of stroke volume variation for prediction of fluid responsiveness using
the modified FloTrac and PiCCOplus system. Crit Care 2008;12(3):R82.
[61] Reuter DA, Kirchner A, Felbinger TW, et al. Usefulness of left ventricular stroke volume variation to assess fluid
responsiveness in patients with reduced cardiac function. Crit Care Med May 2003;31(5):1399e404.
[62] Derichard A, Robin E, Tavernier B, et al. Automated pulse pressure and stroke volume variations from radial artery:
evaluation during major abdominal surgery. Br J Anaesth Nov 2009;103(5):678e84.
[63] Hofer CK, Muller SM, Furrer L, et al. Stroke volume and pulse pressure variation for prediction of fluid responsiveness
in patients undergoing off-pump coronary artery bypass grafting. Chest Aug 2005;128(2):848e54.
[64] Cannesson M, Musard H, Desebbe O, et al. The ability of stroke volume variations obtained with Vigileo/FloTrac system
to monitor fluid responsiveness in mechanically ventilated patients. Anesth Analgesia Feb 2009;108(2):513e7.
[65] Wiesenack C, Fiegl C, Keyser A, et al. Assessment of fluid responsiveness in mechanically ventilated cardiac surgical
patients. Eur J Anaesthesiol Sep 2005;22(9):658e65.
[66] Reuter DA, Felbinger TW, Schmidt C, et al. Stroke volume variations for assessment of cardiac responsiveness to
volume loading in mechanically ventilated patients after cardiac surgery. Intensive Care Med Apr 2002;28(4):392e8.
[67] Biais M, Bernard O, Ha JC, et al. Abilities of pulse pressure variations and stroke volume variations to predict fluid
responsiveness in prone position during scoliosis surgery. Br J Anaesth Apr 2010;104(4):407e13.
[68] Preisman S, Kogan S, Berkenstadt H, et al. Predicting fluid responsiveness in patients undergoing cardiac surgery:
functional haemodynamic parameters including the respiratory systolic variation test and static preload indicators. Br
J Anaesth Dec 2005;95(6):746e55.
*[69] Marik PE, Monnet X, Teboul JL. Hemodynamic parameters to guide fluid therapy. Ann Intensive Care 2011;1(1):1.
[70] Monnet X, Bleibtreu A, Ferre ! A, et al. Passive leg raising and end-expiratory occlusion tests perform better than pulse
pressure variation in patients with low respiratory system compliance. Crit Care Med 2012;40:152e7.
[71] Monnet X, Bataille A, Magalhaes E, et al. End-tidal carbon dioxide is better than arterial pressure for predicting volume
responsiveness by the passive leg raising test. Intensive Care Med Jan 2013;39(1):93e100.
[72] Monnet X, Jabot J, Maizel J, et al. Norepinephrine increases cardiac preload and reduces preload dependency assessed
by passive leg raising in septic shock patients. Crit Care Med Apr 2011;39(4):689e94.
*[73] Monnet X, Osman D, Ridel C, et al. Predicting volume responsiveness by using the end-expiratory occlusion in me-
chanically ventilated intensive care unit patients. Crit Care Med Mar 2009;37(3):951e6.
[74] Silva S, Jozwiak M, Teboul JL, et al. End-expiratory occlusion test predicts preload responsiveness independently of
positive end-expiratory pressure during acute respiratory distress syndrome. Crit Care Med Jul 2013;41(7):1692e701.
[75] Bourgeois MJ, Gilbert BK, Donald DE, et al. Characteristics of aortic diastolic pressure decay with application to the
continuous monitoring of changes in peripheral vascular resistance. Circulation Res Jul 1974;35(1):56e66.
[76] Erlanger JHB. An experimental study of blood pressure and pulse-pressure in man. Johns Hopkins Hosp Rep 1904;12:
145e378.
[77] Liljestrand GZE. Vergleichende bestimmungen des minutenvolumens des herzens beim menschen mittels der
stickoxydulmethode und durch blut druckmessung. Z Ges Exp Med 1984;59:105e22.
[78] Warner HR, SH, Connolly DC, et al. Quantitation of beat-to-beat changes in stroke volume from the aortic pulse
contour in man. J Appl Physiology 1953;5:495e507.
[79] Godje OLP, Schmitz C, Theil M, et al. Continuous, less invasive, hemodynamic monitoring in intensive care after cardiac
surgery. Thorac Cardiovasc Surg 1998;46:242e9.
[80] Wesseling Jr KH, Settels J, Schreuder J. Computation of aortic flow from pressure in humans using nonlinear, three-
element model. J Appl Physiology 1993;74(5):2566e73.
[81] Linton NW, Linton RA. Estimation of changes in cardiac output from the arterial blood pressure waveform in the upper
limb. Br J Anaesth Apr 2001;86(4):486e96.
[82] Rodig G, Prasser C, Keyl C, et al. Continuous cardiac output measurement: pulse contour analysis vs thermodilution
technique in cardiac surgical patients. Br J Anaesth Apr 1999;82(4):525e30.
[83] Costa MG, Della Rocca G, Chiarandini P, et al. Continuous and intermittent cardiac output measurement in hyper-
dynamic conditions: pulmonary artery catheter vs. lithium dilution technique. Intensive Care Med Feb 2008;34(2):
257e63.You can also read