Deep learning-based molecular morphometrics for kidney biopsies - JCI Insight
←
→
Page content transcription
If your browser does not render page correctly, please read the page content below
Deep learning–based molecular morphometrics for kidney
biopsies
Marina Zimmermann, … , Stefan Bonn, Victor G. Puelles
JCI Insight. 2021;6(7):e144779. https://doi.org/10.1172/jci.insight.144779.

 Technical Advance    Nephrology

Morphologic examination of tissue biopsies is essential for histopathological diagnosis. However, accurate and scalable
cellular quantification in human samples remains challenging. Here, we present a deep learning–based approach for
antigen-specific cellular morphometrics in human kidney biopsies, which combines indirect immunofluorescence imaging
with U-Net–based architectures for image-to-image translation and dual segmentation tasks, achieving human-level
accuracy. In the kidney, podocyte loss represents a hallmark of glomerular injury and can be estimated in diagnostic
biopsies. Thus, we profiled over 27,000 podocytes from 110 human samples, including patients with antineutrophil
cytoplasmic antibody–associated glomerulonephritis (ANCA-GN), an immune-mediated disease with aggressive
glomerular damage and irreversible loss of kidney function. We identified previously unknown morphometric signatures of
podocyte depletion in patients with ANCA-GN, which allowed patient classification and, in combination with routine clinical
tools, showed potential for risk stratification. Our approach enables robust and scalable molecular morphometric analysis
of human tissues, yielding deeper biological insights into the human kidney pathophysiology.

Find the latest version:
https://jci.me/144779/pdf
TECHNIC AL ADVANCE

                                         Deep learning–based molecular
                                         morphometrics for kidney biopsies
                                         Marina Zimmermann,1,2 Martin Klaus,1,2 Milagros N. Wong,1 Ann-Katrin Thebille,2 Lukas Gernhold,1
                                         Christoph Kuppe,3,4 Maurice Halder,3,4 Jennifer Kranz,5,6 Nicola Wanner,1 Fabian Braun,1 Sonia Wulf,7
                                         Thorsten Wiech,7 Ulf Panzer,8,9 Christian F. Krebs,8,9 Elion Hoxha,1 Rafael Kramann,3,4,10
                                         Tobias B. Huber,1 Stefan Bonn,2 and Victor G. Puelles1
                                         III. Department of Medicine, University Medical Center Hamburg-Eppendorf, Hamburg, Germany. 2Institute of Medical
                                         1

                                         Systems Biology, Center for Biomedical AI (bAIome), Center for Molecular Neurobiology (ZMNH), University Medical
                                         Center Hamburg-Eppendorf, Hamburg, Germany. 3Department of Nephrology and Clinical Immunology and 4Institute
                                         of Experimental Medicine and Systems Biology, RWTH Aachen University, Aachen, Germany. 5St.-Antonius Hospital
                                         Eschweiler, Department of Urology, Eschweiler, Germany. 6Department of Urology and Kidney Transplantation, Martin-
                                         Luther-University, Halle, Germany. 7Department of Pathology, University Medical Center Hamburg-Eppendorf, Hamburg,
                                         Germany. 8III. Department of Medicine, Division of Translational Immunology, and 9Hamburg Center for Translational
                                         Immunology, University Medical Center Hamburg-Eppendorf, Hamburg, Germany. 10Department of Internal Medicine,
                                         Nephrology and Transplantation, Erasmus Medical Center, Rotterdam, The Netherlands.

                                                 Morphologic examination of tissue biopsies is essential for histopathological diagnosis.
                                                 However, accurate and scalable cellular quantification in human samples remains challenging.
                                                 Here, we present a deep learning–based approach for antigen-specific cellular morphometrics
                                                 in human kidney biopsies, which combines indirect immunofluorescence imaging with U-Net–
                                                 based architectures for image-to-image translation and dual segmentation tasks, achieving
                                                 human-level accuracy. In the kidney, podocyte loss represents a hallmark of glomerular injury
                                                 and can be estimated in diagnostic biopsies. Thus, we profiled over 27,000 podocytes from
                                                 110 human samples, including patients with antineutrophil cytoplasmic antibody–associated
                                                 glomerulonephritis (ANCA-GN), an immune-mediated disease with aggressive glomerular
                                                 damage and irreversible loss of kidney function. We identified previously unknown morphometric
                                                 signatures of podocyte depletion in patients with ANCA-GN, which allowed patient classification
                                                 and, in combination with routine clinical tools, showed potential for risk stratification. Our approach
                                                 enables robust and scalable molecular morphometric analysis of human tissues, yielding deeper
                                                 biological insights into the human kidney pathophysiology.

Authorship note: MZ and MK are
co–first authors and contributed
equally to this work. TBH, SB, and VGP   Introduction
are co–senior authors and contributed    The kidney continuously filters blood and maintains overall body homeostasis, relying on a delicate balance
equally to this work.                    between a complex vascular network and multiple specialized cell types (1). Podocytes are kidney epithe-
Conflict of interest: The authors have   lial cells with limited capacity for regeneration that function as master regulators of glomerular health (2).
declared that no conflict of interests   Experimental models show that severe podocyte loss leads to an irreversible process of progressive scarring,
exists.                                  rendering the affected glomeruli nonfunctional (3–5). Furthermore, human podocyte loss has been identified
                                         in association with all major diseases contributing to chronic kidney disease (6–13).
Copyright: © 2021, Zimmermann
et al. This is an open access article         Antineutrophil cytoplasmic antibody–associated glomerulonephritis (ANCA-GN) is primarily a sys-
published under the terms of the         temic vasculitis with a strong immune-mediated epithelial reaction in the kidney, which leads to the for-
Creative Commons Attribution 4.0         mation of destructive glomerular lesions and a rapid loss of kidney function (14). While ANCA-GN has
International License.                   well-defined cellular changes (15) that include podocyte injury (16), podocyte loss is yet to be characterized
Submitted: October 1, 2020               in ANCA-GN patients. Using indirect immunofluorescence imaging, it is now possible to visualize different
Accepted: February 24, 2021              podocyte structures, facilitating the unambiguous identification of podocytes and, thereby, the quantifica-
Published: April 8, 2021                 tion of podocyte depletion (5, 6). However, reliable image segmentation for routine clinical analysis remains
                                         challenging, mostly due to time constraints for detailed quantitative analysis with cellular resolution and lack
Reference information: JCI Insight.
2021;6(7):e144779.                       of accuracy in available automated methods.
https://doi.org/10.1172/jci.                  Time constraints, precision, and reproducibility are known hurdles in histopathology. For this reason, the
insight.144779.                          automation of classification and quantification processes has the potential to lessen the diagnostic burden and

                                                                                                                                                              1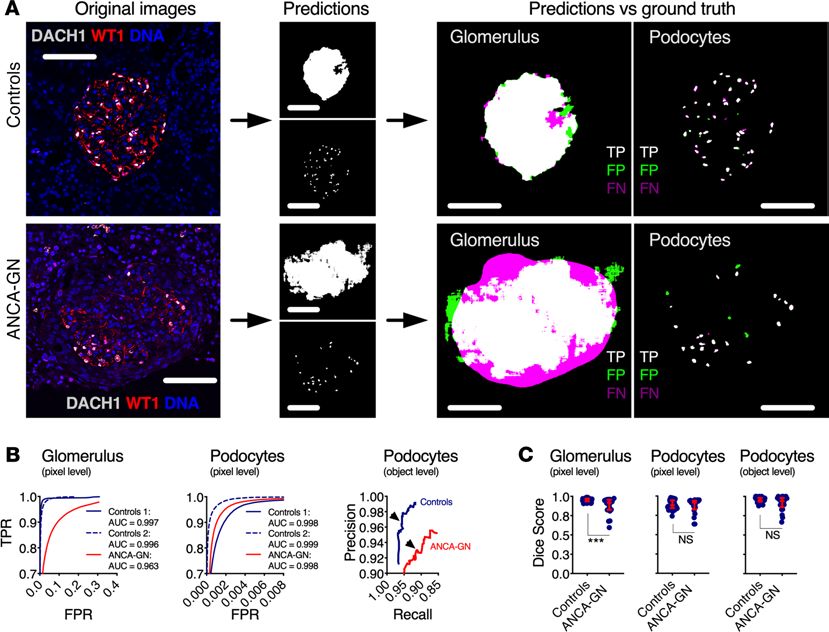
TECHNIC AL ADVANCE

                                 improve the quality of the acquired data. Deep learning is increasingly gaining attention in multiple biomed-
                                 ical areas due to its potential clinical applications (17), including natural language processing (e.g., analysis
                                 of electronic health records) and computer vision (e.g., histopathology and radiology). Frameworks based on
                                 U-Net (a convolutional neural network specifically designed for the segmentation of images) are particularly
                                 interesting for histopathology (18, 19), since they can be used for image segmentation and specific tasks such
                                 as image-to-image translation (20, 21). To date, multiple reports have shown the high performance of deep
                                 learning networks for tissue-based classification of human disease (22, 23). Nonetheless, their role in detailed
                                 cellular morphometric profiling of clinical tissues remains unclear.
                                      In this study, we present a deep learning–based workflow to perform cell-specific morphometric profiling
                                 of human kidney biopsies, including numbers, sizes, densities, and distributions of podocytes within their
                                 respective glomerulus, which allowed a comprehensive characterization of endpoint variability within and
                                 between patients. We analyzed a total of 1095 glomeruli from 110 patients to profile 27,696 podocytes based
                                 on tissue expression of 2 complementary antigens in order to identify, segment, and quantify podocyte deple-
                                 tion. A previously unrecognized morphometric signature of podocyte depletion was detected in patients with
                                 ANCA-GN (as listed in Supplemental Table 1; supplemental material available online with this article; https://
                                 doi.org/10.1172/jci.insight.144779DS1), allowing patient classification with near–human level accuracy and
                                 showing potential for risk stratification when combined with established clinical tools. Our findings suggest
                                 that focal podocyte loss may be a transitional state before the onset of overt lesion formation in patients with
                                 ANCA-GN. Together, these findings highlight the potential of deep learning–based architectures for enabling
                                 robust and scalable molecular morphometric analyses of human tissues.

                                 Results
                                 Morphometric profiling of human samples using a dual segmentation U-Net. Human kidney biopsies from patients
                                 with available clinical data (i.e., age, sex, and estimated glomerular filtration rate [eGFR]), pathological
                                 endpoints (i.e., interstitial fibrosis), and integrative scores (i.e., ANCA-GN score) were immunolabeled using
                                 antibodies against podocyte-specific transcription factors, including nuclear expression of Dachshund Family
                                 Transcription Factor 1 (DACH1) and cytoplasmic expression of Wilms’ Tumor 1 (WT1), in order to unam-
                                 biguously identify glomerular podocytes (Figure 1A) and carefully profile a total of 27,696 podocytes. A total
                                 of 1095 immunolabeled images was used for training, validation, and testing during the development of the
                                 deep learning architectures, including 722 images from 48 controls and 373 images from 62 patients with
                                 ANCA-GN. General patient demographics are outlined in Supplemental Figure 1.
                                       Common definitions of machine learning–related language are provided in Table 1. In general, deep learn-
                                 ing architectures for image analysis consist of convolutional layers that analyze the image sequentially in order
                                 to extract increasingly complex features. During this process, the image size is conventionally reduced through
                                 max-pooling (down-sampling), encoding the data in a smaller dimension. To obtain segmentation predictions
                                 of the same size as the input image, a decoder restores the information to the original size via upconvolu-
                                 tions combined with additional convolutional layers. Following this logic, we developed a dual output deep
                                 learning–based segmentation architecture (U-Net) that has an encoder/decoder structure with 3 convolutional
                                 layers, each containing between 32 (first/last layers) and 256 filters (bottom layer), which can simultaneously
                                 extract glomerular and podocyte nuclear areas from a composite fluorescence image (Figure 1B). Segmented
                                 areas are integrated into model-based stereology formulas that estimate podocyte morphometrics (podomet-
                                 rics), including glomerular dimensions, numbers of podocytes, and podocyte dimensions and distributions
                                 (i.e., minimal distances between neighboring podocytes) within each glomerulus (Figure 1C).
                                       The parameters or weights of the U-Net convolutional layers are iteratively updated in a training pro-
                                 cess, which consists of multiple epochs (or temporal steps). In each epoch, all training images are passed
                                 through the network once. To update the weights of the network, the difference between the network’s pre-
                                 diction and the manually annotated ground truth is determined for each image based on a “loss function.”
                                 We used a balanced 2-layer binary cross-entropy loss function that adaptively accounts for the performance
                                 of each individual segmentation task (Supplemental Figure 2, B–D). Once the images of the validation set
                                 are passed through the network, predictions are computed and evaluated. This way, the performance of
                                 the network is monitored during training, and the best weights and hyperparameters can be determined.
                                 The held-out test set is only used to evaluate the best network, which thus provides unbiased results. In this
                                 study, the overall quality of the segmentation performed by the U-Net has been evaluated using standardized
                                 metrics that measure the similarity between prediction and ground truth of the glomerular and podocyte

JCI Insight 2021;6(7):e144779 https://doi.org/10.1172/jci.insight.144779                                                                        2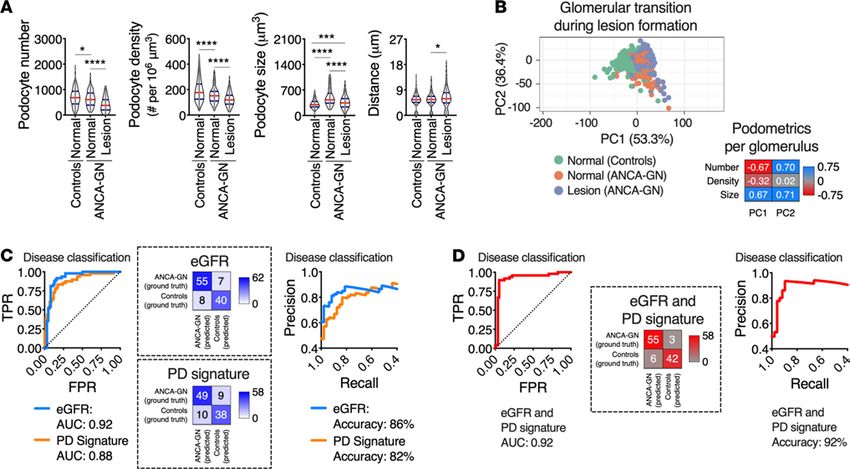
TECHNIC AL ADVANCE
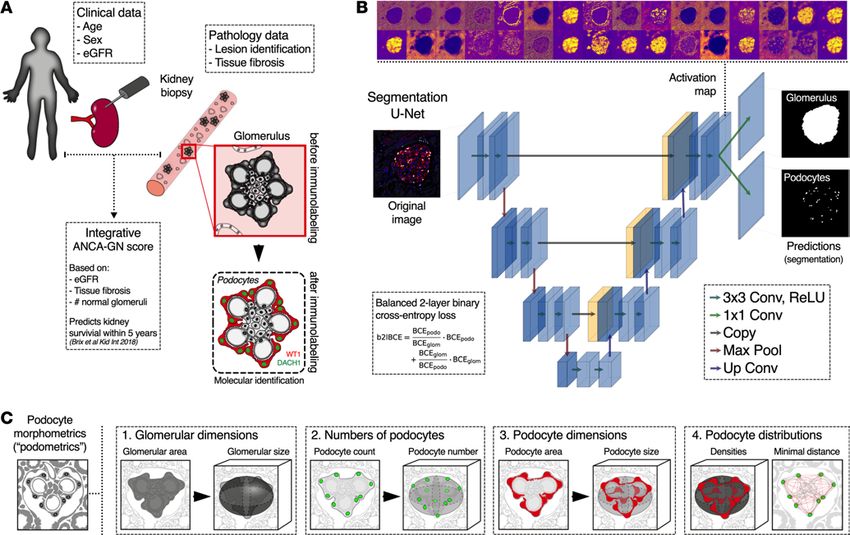
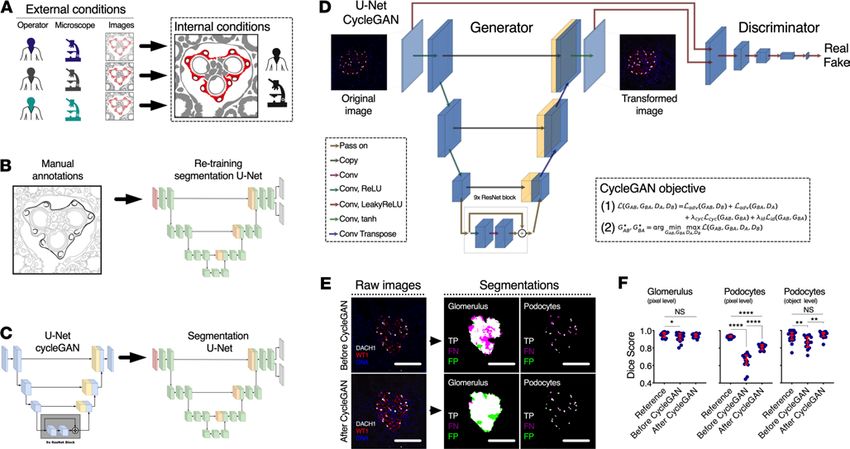
Figure 1. Segmentation U-Net for molecular morphometrics in kidney samples. (A) Biopsies from patients with immune-mediated kidney diseases,
which are diagnosed, treated, and monitored based on clinical, pathological, and integrative data, are used to perform molecular labeling of kidney podo-
cytes, based on indirect immunofluorescence (24). (B) Glomerular area and podocyte nuclei are virtually dissected from high-resolution confocal images
with a segmentation U-Net for 2 simultaneous outputs that was trained using a balanced 2-layer binary cross-entropy loss. (C) 3D podocyte morphomet-
rics (podometrics) were generated by model-based stereology, which extrapolates 3D from 2D data; in this case, glomerular and podocyte areas and podo-
cyte spatial location were used to estimate 3D glomerular dimensions, as well as numbers, sizes, and distributions of podocytes. ANCA-GN, antineutrophil
cytoplasmic antibody–associated glomerulonephritis; eGFR, estimated glomerular filtration rate; DACH1, Dachshund Family Transcription Factor 1; WT1,
Wilms’ Tumor 1; BCE, binary cross-entropy; Conv, convolution; ReLU, rectified linear unit; Max Pool, max pooling.
segmentations at pixel and object levels (i.e., Dice scores, where a Dice score of 0 indicates no overlap of
prediction and ground truth and 1 a perfect match).
In order to ensure an optimal performance of our U-Net, hyperparameters were determined using
cross-validation, where we confirmed that the number of training images was sufficient to achieve Dice scores
over 0.90 (Supplemental Figure 2A). We compared our dual-output segmentation U-Net to 2 single-output
U-Nets (for glomerular and podocyte nuclear areas separately), showing similar results (Supplemental Figure
3, A and B), which means that we can work with fewer parameters and require less training and evaluation
time for the dual-output U-Net than for the 2 single-output U-Nets. Furthermore, our dual-output U-Net out-
performed a customized ImageJ-based segmentation script at pixel and object levels, with a strong reduction in
false-positive rates (Supplemental Figure 4, A and B).
U-Net cycleGAN for annotation-free bias minimization. A lack of generalization is a well-known vulnerability of
deep learning architectures (17). To this end, we first compared podometrics obtained from the same patients
who were systematically imaged in 2 different locations with different microscopes and by different operators
with different levels of microscopy experience. Podocyte density was not affected by these different conditions
(Supplemental Figure 5A), neither at a patient level nor at a glomerular level (Supplemental Figure 5B), when
the segmentation U-Net was trained jointly on these data sets. However, we observed significant differences in the
variance of DACH1 or WT1 expression per image (pixel level) (Supplemental Figure 5C), suggesting that batch
effects and image bias should be addressed in order to increase the reproducibility and scalability of the method.
Multiple operators and microscopes led to differences in image quality, differing from the reference
data set (Figure 2A). One solution is to continuously retrain the segmentation U-Net (Figure 2B), which
JCI Insight 2021;6(7):e144779 https://doi.org/10.1172/jci.insight.144779 3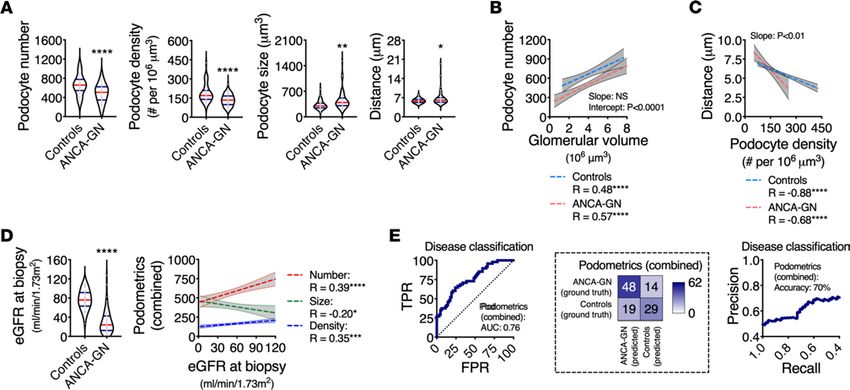
TECHNIC AL ADVANCE

Table 1. Glossary of technical terminology.

                                           A subfield of computer science in which a machine or computer learns to perceive its environment and
Artificial intelligence (AI)
                                           acts to achieve a goal (38). Examples: self-driving cars, face recognition, robotics, etc.
Machine learning (ML)                      Computer algorithms that learn to solve a task in an iterative training process based on sample data.
                                           Models distantly inspired by neurons in the brain that “learn” to produce outputs based on samples
Artificial neural network (ANN)
                                           seen in a so-called training process that iteratively updates the model’s parameters.
Deep learning (DL)                         Refers to artificial neural networks with multiple layers between input and output.
                                           Consist of 2 artificial neural networks, a “generator” and a “discriminator” playing an adversarial
Generative adversarial networks (GANs)     game. While the generator learns to create a synthetic, but realistic sample, the discriminator tries to
                                           discriminate real from generated samples.
                                           Cycle-consistent generative adversarial network that learns to translate images from one domain to
CycleGAN
                                           another domain (e.g., zebra to horse, painting to photograph) and vice versa in an unsupervised manner.
Segmentation                               Assigning pixels or regions of an image to certain classes (e.g., people, trees, sky).
Classification                             Assigning a sample to a certain class (e.g., disease versus healthy).
                                           Deep learning architecture for image segmentation, which relies heavily on convolutional layers in an
U-Net
                                           encoder/decoder structure.
                                           Layer in a deep learning architecture that uses convolutions (systematic multiplication of subregions of
Convolutional layer
                                           a sample with a learnable set of weights) in order to detect specific features in a sample.
Metric                                     Assesses match of deep learning prediction with human-created ground truth.
                                           Commonly used metric: 2 |X∩Y| / (|X| + |Y|), where X denotes the ground truth and Y denotes the
Dice score
                                           prediction. Dice score 0, no match between ground truth and prediction. Dice score 1, perfect match.
                                           Penalizes algorithm for yielding predictions that do not match the ground truth. During training, model
Loss function
                                           parameters are adjusted to minimize the loss function.
                                           Widely used loss function in machine learning that measures the difference between ground truth and
Binary cross-entropy
                                           prediction for binary classification tasks.
                                           Strategy to enlarge the number of training samples and diversify their appearance to achieve better
Data augmentation
                                           performance. For images, for example, rotation, shifting, flipping, and brightness variation are applied.
                                           While the model parameters are iteratively optimized by the algorithm during training,
Hyperparameter optimization                hyperparameters are chosen a priori. Configurations with different hyperparameters are compared and
                                           the best configuration is selected.

                                  progressively leads to a more robust network but requires manual annotations. An alternative approach can
                                  be found in the use of deep learning–based annotation-free bias minimization (Figure 2C). Thus, we imple-
                                  mented a U-Net cycleGAN (cycle-consistent generative adversarial network with a U-Net–like generator) to
                                  transform images obtained under different conditions (i.e., microscope and operator) into images resembling
                                  the reference data set used for training the segmentation network (Figure 2D). Representative images show
                                  the resulting segmentation optimization (Figure 2E) and improvements in Dice scores at both pixel and
                                  object levels (Figure 2F). Training curves of the U-Net cycleGAN, as well as receiver operating characteristic
                                  (ROC) and precision-recall curves for the different combinations of data and segmentation networks, are
                                  provided in Supplemental Figure 6, A and B. While these results provide evidence that unannotated data sets
                                  can be efficiently segmented using a network trained on the reference data set when they are bias transferred
                                  using the U-Net cycleGAN (e.g., improvement of the mean podocyte pixel–based Dice score from 0.65 to
                                  0.81; see center and right panel of Supplemental Figure 6C), we obtained slightly better segmentation results
                                  using a segmentation U-Net trained on all images, including the 2 control and the ANCA-GN data sets
                                  (mean podocyte pixel-based Dice score, 0.84; left panel of Supplemental Figure 6C). All further results are,
                                  therefore, based on the U-Net trained jointly on the 2 control and the ANCA-GN data sets.
                                      Molecular podometrics reveal podocyte loss in ANCA-GN. Representative images show high accuracy and preci-
                                  sion of the U-Net for podocyte segmentation in samples from both controls and ANCA-GN patients (Figure
                                  3A); this was illustrated by ROC and precision-recall curves (Figure 3B). Strong agreement between ground
                                  truth and U-Net outputs was determined by pixel- and object-based Dice scores (mean podocyte pixel- and
                                  object-based Dice scores for controls 0.86 and 0.95, respectively) (Figure 3C). While image segmentation in
                                  ANCA-GN patients was comparable with controls, detection levels were not identical (mean podocyte Dice
                                  scores for ANCA-GN patients 0.87 and 0.91, respectively). For this reason, we compared segmented areas from
                                  glomeruli and podocytes in the ground truth and those obtained from the U-Net, which showed identical dif-
                                  ferences between controls and ANCA-GN patients (Supplemental Figure 7, A and B); this supports biological

JCI Insight 2021;6(7):e144779 https://doi.org/10.1172/jci.insight.144779                                                                          4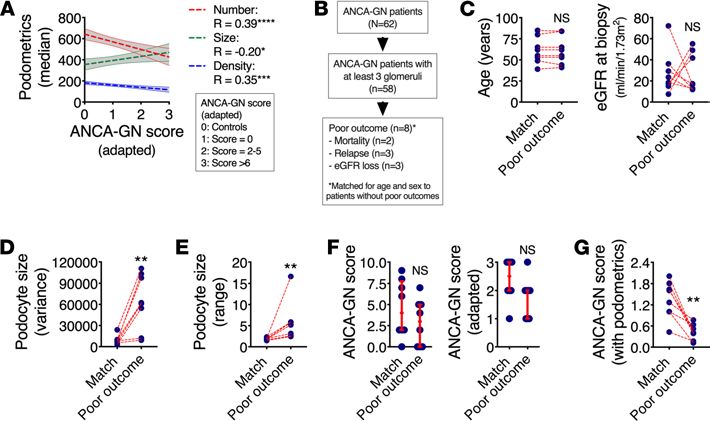
TECHNIC AL ADVANCE

Figure 2. U-Net cycleGAN for bias minimization between different data set domains. (A) Scalable frameworks require adaptability to external conditions. While
indirect immunofluorescence protocols can be standardized, operator training, microscopy set-up, and eventually image quality are hard to control, especially if
segmentation tasks have been defined based on tightly controlled internal conditions. (B) The images can be annotated manually in order to retrain the segmen-
tation U-Net before it is applied to a new data set. (C) Alternatively, we propose using a U-Net cycleGAN (without annotations) in order to transform images before
applying the segmentation U-Net. (D) While the generator in the U-Net cycleGAN transforms images from one data set domain to the other, the discriminator
tries to distinguish between “real” and “fake” images. This adversarial game is reflected in the cycleGAN objective, which is made up of the adversarial loss Ladv,
the cycle-consistency loss Lcyc, and an identity loss Lid. (E) Representative images showing segmentation agreement with ground truth and reductions in false
negatives. (F) Dice score at both pixel and object level significantly improved after cycleGAN for podocytes (n = 20 images for the reference and n = 24 images for
before/after U-Net cycleGAN; Kruskal-Wallis with Dunn’s multiple-comparisons tests were performed). In dot plots, every blue dot represents 1 image, and red
error bars represent medians and IQRs. Conv, convolution; ReLU, rectified linear unit; tanh, hyperbolic tangent; DACH1, Dachshund Family Transcription Factor 1;
WT1, Wilms’ Tumor 1; TP, true positives; FP, false positives; FN, false negatives. ****P < 0.0001, **P < 0.01, *P < 0.05. Scale bars: 150 μm.

                                     differences rather than technical artifacts. Furthermore, we also determined direct correlations between ground
                                     truth and U-Net segmentation outputs from both controls and ANCA-GN patients (Supplemental Figure 7C).
                                          Reductions in median podocyte numbers and densities with consequent increases in median podocyte
                                     sizes and distances between closest neighbors were found in patients with ANCA-GN compared with con-
                                     trols (Figure 4A). The median glomerular size was directly associated with median podocyte number (R
                                     = 0.48, P < 0.0001 in controls, and R = 0.57, P < 0.0001 in ANCA-GN) with significant differences in the
                                     intercept (P < 0.0001), which suggests podocyte loss across the entire spectrum of glomerular size (Figure
                                     4B). Similarly, median podocyte density was inversely associated with median minimal distances between
                                     neighboring podocytes (R = –0.88, P < 0.0001 in controls, and R = 0.68, P < 0.0001 in ANCA-GN) with
                                     statistical differences in the slope (P < 0.01), suggesting that compensatory podocyte hypertrophy is exacer-
                                     bated in ANCA-GN patients (Figure 4C).
                                          In our cohort, the main clinical discriminator between controls and ANCA-GN patients was kidney
                                     function, assessed by eGFR at the time of biopsy. In particular, eGFR was associated with podocyte number
                                     (R = 0.39, P < 0.0001), density (R = 0.35, P < 0.001) and size (R = –0.20, P < 0.05) (Figure 4D). Using leave-
                                     one-out cross-validation, we generated a combined podometric score, including podocyte number, density,
                                     and size, which also partially discriminated between controls and ANCA-GN patients in a logistic regression
                                     with an AUC of 0.76 (Figure 4E). Together, these findings show a potential overlap in the levels of podocyte
                                     depletion between controls and ANCA-GN patients.
                                          Morphometric signature of podocyte depletion identifies patients with ANCA-GN. Lesion development in ANCA-
                                     GN is focal, meaning that, within the same patient, some glomeruli are affected and others are not (Sup-
                                     plemental Figure 8A). This is directly reflected in the changes in the variances per subject of all podometric

JCI Insight 2021;6(7):e144779 https://doi.org/10.1172/jci.insight.144779                                                                                         5
TECHNIC AL ADVANCE
Figure 3. Application of segmentation U-Net to human kidney biopsies. (A) Visual representation of the segmentation process, from original images, to seg-
mentation outputs for glomeruli and podocytes, and their respective correlation with manually segmented ground truths, highlighting true positives, false pos-
itives, and false negatives. (B) Receiver operating characteristic (ROC) and precision-recall curves in samples from controls and ANCA-GN patients; arrowheads
show selected thresholds for both conditions (n = 20 images for Controls 1, n = 24 images for Controls 2, and n = 21 images for ANCA-GN patients). (C) Dice scores
at pixel and object levels for glomeruli and podocytes, showing comparable segmentation performance in health and disease (n = 44 images for controls and n =
21 images for ANCA-GN patients; Mann-Whitney U tests were performed). In dot plots, each blue dot represents 1 image, and red error bars represent medians
and IQRs. ANCA-GN, antineutrophil cytoplasmic antibody–associated glomerulonephritis; DACH1, Dachshund Family Transcription Factor 1; WT1, Wilms’ Tumor
1; TPR, true positive rate; FPR, false positive rate; TP, true positives; FP, false positives; FN, false negatives. ***P < 0.001. Scale bars: 100 μm.
parameters (Supplemental Figure 8B), which decreased in podocyte numbers and densities, but increased in
sizes and distances between closest neighbors.
Analyses of single glomeruli showed that podocyte depletion was present in ANCA-GN patients, even in
glomeruli that were not defined as glomerular lesions, and was associated with compensatory podocyte hyper-
trophy (Figure 5A). A principal component analysis (PCA) also revealed that normal glomeruli in ANCA-GN
patients represent a transitional state from normal glomeruli in controls to overt glomerular lesions in ANCA-
GN (Figure 5B), suggesting that analyses of individual glomeruli within one patient may provide additional
clues that may be applied to differentiate controls and ANCA-GN patients. Using leave-one-out cross-valida-
tion, we generated a morphometric signature of podocyte depletion, which is generated per subject based on
all available morphometric data, including both central tendencies and measures of variability. Importantly,
this integrative parameter discriminated between controls and ANCA-GN patients in a logistic regression, as
shown in both ROC (Figure 5C) and precision-recall curves (AUC, 0.88) with an accuracy of 82% (Figure 5D),
which was almost identical to the discrimination power of eGFR (AUC, 0.92; accuracy, 86%).
In this cohort, 3 ANCA-GN patients were classified as controls and 6 controls were classified as ANCA-
GN. First, we hypothesized that this could be due to segmentation artifacts, since DACH1 expression is
upregulated in other cell types (i.e., erythrocytes and proximal tubular cells). However, we carefully screened
all images from these 9 misclassified subjects and confirmed appropriate segmentation; representative images
are shown in Supplemental Figure 9A. In patients with ANCA-GN, misclassified subjects were younger and
had higher eGFR than median values for controls. In controls, misclassified cases were older and had lower
eGFR than median values for ANCA-GN patients (Supplemental Figure 9, B and C). Together, these findings
suggest that misclassifications may be associated with early stages of disease in ANCA-GN and age-related
JCI Insight 2021;6(7):e144779 https://doi.org/10.1172/jci.insight.144779 6TECHNIC AL ADVANCE
Figure 4. Molecular podometrics reveal podocyte loss in patients with ANCA-GN. (A) Podocyte morphometric analysis (podometrics; median per patient)
showing reductions in podocyte numbers and densities, as well as increases in podocyte sizes and closest neighbor distances in ANCA-GN patients compared
with controls. (B) Spearman’s rank correlation analyses confirm a pattern of podocyte loss across the entire range of glomerular volume. (C) Increases in podo-
cyte closest neighbor distances are associated with reductions in podocyte density. (D) ANCA-GN patients have a lower estimated glomerular filtration rate
(eGFR) at the time of biopsy compared with controls; features of podocyte depletion are associated with eGFR at biopsy. (E) Receiver operating characteristic
(ROC) and precision-recall curves of a logistic regression using leave-one-out cross-validation showing the discrimination power of combined podometrics
(podocyte number, density, and size), including confusion matrix. In all panels n = 48 patients for controls and n = 62 patients for ANCA-GN; Mann-Whitney
U tests were performed. In violin plots, each gray dot represents the median value per subject, red lines represent medians, and blue lines represent IQRs.
Regression lines represent lines of best fit and 95% CI. ANCA-GN, antineutrophil cytoplasmic antibody–associated glomerulonephritis; eGFR, estimated
glomerular filtration rate; TPR, true positive rate; FPR, false positive rate. ****P < 0.0001, **P < 0.01, and *P < 0.05.
podocyte loss in controls. Furthermore, this morphometric signature of podocyte depletion marks the degree
of disease progression in close relation to physiological readouts.
Potential of podometrics for risk stratification in patients with ANCA-GN. A recent study proposed an integra-
tive predictive score of 5-year kidney survival in ANCA-GN (24), based on eGFR, percentage of interstitial
fibrosis, and number of nonpathological glomeruli. We adapted this ANCA score to include a baseline com-
parison with control patients and model associations to podometrics, showing that median podocyte number,
density, and size are significantly correlated with the modified ANCA-GN score (Figure 6A). From a total
of 62 patients with ANCA-GN, 58 had at least 3 identified glomeruli in the diagnostic biopsy, which allowed
us to perform analysis of intrasubject variability. Then, 8 patients were identified based on our definition
of “poor outcomes,” including mortality, relapse, or loss of at least 10% of eGFR within their respective
follow-up period (Figure 6B). For a balanced comparison, we carefully matched these 8 subjects for age and
sex within the remaining available patients from our cohort (n = 8 matched ANCA-GN patients). While our
matching strategy was successful for age and sex, we were not able to obtain matches by eGFR (Figure 6C).
Variances (Figure 6D) and ranges (Figure 6E) in podocyte size were significantly increased in ANCA-GN
patients with poor outcomes. Neither the conventional ANCA-GN score nor our adapted version were dif-
ferent between the outcome groups (Figure 6F), but a ratio between the adapted ANCA-GN score and range
in podocyte size showed significant differences by outcome group (Figure 6G). In summary, these findings
highlight a potential for additional risk stratification among ANCA-GN patients using a combination of
podometrics and available clinical and pathological tools.
Discussion
In this study, we present a deep learning–based approach that automatically identifies morphometric signa-
tures of podocyte depletion in human kidney biopsies, achieving human-level accuracy while saving time
and resources. Our method provides robust and scalable molecular morphometric endpoints for patients
with ANCA-GN, revealing potentially novel pathophysiological insights of kidney epithelial biology and
serving as an example for the potential integration of deep learning–based technologies into clinical settings.
JCI Insight 2021;6(7):e144779 https://doi.org/10.1172/jci.insight.144779 7TECHNIC AL ADVANCE
Figure 5. Podocyte morphometric signature identifies ANCA-GN patients. (A) Podocyte-morphometric analysis (podometrics; per glomerulus) showing a
pattern of podocyte loss and hypertrophy in glomeruli classified as “normal” (without lesion) in ANCA-GN patients. (B) Principal component analysis (PCA)
using Pareto scaling to rows. Probabilistic PCA was used to calculate principal components, confirming that normal glomeruli in ANCA-GN patients repre-
sent a transitional state between normal glomeruli in controls and lesions in ANCA-GN patients. In A and B, n = 722 normal glomeruli for controls and n =
373 glomeruli for ANCA-GN patients; Kruskal-Wallis with Dunn’s multiple-comparisons tests were performed. (C) Receiver operating characteristic (ROC),
precision-recall curves, and confusion matrices of patient classification with a logistic regression using leave-one-out cross-validation based on eGFR and
on a morphometric signature of podocyte depletion (PD), which combines morphometric data from every available glomerulus per biopsy per patient. (D)
ROC, precision-recall curves, and confusion matrices for eGFR and PD signature as classifiers. In C and D, n = 48 patients for controls and n = 58 patients
for ANCA-GN with PD signature; n = 62 patients for ANCA-GN with eGFR only. In violin plots, each gray dot represents 1 glomerulus, red lines represent
medians, and blue lines represent IQRs. ANCA-GN, antineutrophil cytoplasmic antibody–associated glomerulonephritis; eGFR, estimated glomerular
filtration rate; TPR, true positive rate; FPR, false positive rate. ****P < 0.0001, ***P < 0.001, and *P < 0.05.
Previous deep learning studies focused on the end-to-end evaluation of biopsies through classification into
several categories based on classical histology (22, 23, 25–27). To the best of our knowledge, this is the first
report to combine deep learning for object segmentation in clinical samples with cell-specific morphometrics,
which does not only allow disease classification and risk stratification, but also provides objective endpoints
for the analysis of kidney biopsies. Furthermore, antigen-based cellular identification reduces subjectivity in
annotation strategies, since extensive specialized training is not needed in order to identify protein expression
with fluorescence microscopy, accelerating annotations and homogenizing ground truth definition — all of
which are well-defined obstacles for clinical translation of deep learning–based methodologies (17). However,
reproducibility remains a valid drawback for new clinical tools — especially those dependent on microscopy.
Bias minimization through a U-Net cycleGAN allows a wider use of the pipeline, given that data
obtained by various users and on different microscopes can be adapted in order to efficiently homogenize
image quality. Generative networks have been used in the past for histopathological analysis but mostly have
been limited to classical histological stainings (28, 29). While this strategy is certainly effective and is compa-
rable with multi–data set training, manual annotations and retraining of the segmentation architecture is the
safest approach to maximize accuracy. In this manuscript, we provide both options, allowing users to decide
based on their experimental and clinical needs.
The limited sample size for training, optimization, validation, and testing of multiple deep learning
architectures may be perceived as a shortcoming of the present study. However, this is a very common prob-
lem in biomedical sciences. The number of patients with follow-up data and negative outcomes, even with
extended internal criteria (i.e., at least 10% of eGFR), prevented us from providing predictive analyses at this
stage. For this reason, our observations should be taken as proof-of-principle and will need careful validation
JCI Insight 2021;6(7):e144779 https://doi.org/10.1172/jci.insight.144779 8TECHNIC AL ADVANCE
Figure 6. Potential role of podometrics for ANCA-GN risk evaluation. (A) Features of podocyte depletion correlate
with an adapted ANCA-GN score that predicts poor clinical outcomes within 5 years (n = 62 patients for ANCA-GN;
Spearman’s rank correlation analyses were performed). (B) Among all 62 ANCA-GN patients, clinical follow-up data
identified a total of 8 patients with poor clinical outcomes, including mortality, relapse, and loss of estimated glomer-
ular filtration rate (eGFR) of at least 15% from baseline; these were carefully age- and sex-matched to patients without
negative outcomes. (C) Successful age-match with random selection of variable eGFR. (D) Variance in podocyte size
per biopsy was significantly elevated in patients with poor outcomes. (E) The ratio between maximal and minimal
podocytes sizes (range) per biopsy was also increased in patients with poor outcome. (F) Neither the classical ANCA-
GN score nor an adapted ANCA-GN score were different between patients with poor outcome and matched controls.
(G) A modified ANCA-GN score based on a ratio between the adapted ANCA-GN score and the range of podocyte size
per biopsy was significantly reduced in patients with poor outcome. In C–G, n = 8 ANCA-GN patients with negative
outcomes were carefully age- and sex-matched to n = 8 ANCA-GN patients without negative outcomes; Mann-Whitney
U tests were performed. Regression lines represent lines of best fit and 95% CI. Each blue dot represents 1 subject. In F,
red lines represent medians and IQRs. ANCA-GN, antineutrophil cytoplasmic antibody–associated glomerulonephritis.
****P < 0.0001, ***P < 0.001, **P < 0.01, and *P < 0.05.
in larger patient cohorts with longer and standardized follow-up periods. Furthermore, the successful inte-
gration of artificial intelligence–based morphometrics into clinical practice will not only depend on larger
data sets, but also on standardization and automation of tissue processing and imaging. While our efforts for
batch effect minimization are promising, we only tested variations in image quality based on 2 parameters:
microscopy operators and confocal systems. The compatibility of our approach with other high-throughput
imaging methodologies, such as spinning disk and epifluorescence–based systems, still needs to be validated.
The devastating nature of ANCA-GN requires continuous efforts to identify diagnostic and prognostic
tools that may guide clinical management (15). In the pathophysiology of lesion formation during ANCA-GN
development and progression, it is known that immune cells and parietal epithelial cells play key roles (1, 14,
16). Importantly, our data highlight a previously unrecognized role of podocyte loss in ANCA-GN that could
only be revealed by analyzing single glomeruli and their variability within and between subjects. The unex-
pected value of podometric endpoints in diagnostic ANCA-GN biopsies can only strengthen the position of
podocyte depletion as a hallmark of glomerular disease (30, 31). Future studies will assess whether podocyte
depletion signatures may serve as objective endpoints for the management of glomerular diseases, as well as
their potential applicability to patient diagnosis and prognosis. It is our hope that this study may pave the way
for the development and implementation of advanced tissue morphometrics in routine clinical pathology.
Methods
Human samples. Tissue collection from nephrectomy samples due to renal cell carcinoma was performed at Esch-
weiler Medical Center. After fixation with 4% paraformaldehyde (PFA), representative kidney blocks from the
pole opposite to the tumor were extracted — a strategy that aimed to collect nonpathological tissue. Kidney
biopsies from patients with ANCA-associated glomerulonephritis were obtained from the Hamburger Glomer-
ulonephritis Registry (https://www.sfb1192.de/en/register).
JCI Insight 2021;6(7):e144779 https://doi.org/10.1172/jci.insight.144779 9TECHNIC AL ADVANCE
Immunofluorescence and confocal microscopy. Previously reported protocols were applied (5, 6). To identify
podocytes, we used a combination of WT1 (Agilent Technologies; IS05530-2) and DACH1 (Sigma-Aldrich;
HPA012672) (32) as primary antibodies; Alexa-Fluor 488, -555, and/or -647 as secondary antibodies (Invi-
trogen; A21202, A31572, A31571, and A31573, respectively) depending on the experiment; and a DNA
marker to identify single nuclei — either DAPI (Sigma-Aldrich; D9542) or DRAQ5 (Abcam; ab108410).
Optical images were obtained using inverted laser confocal microscopes (Nikon and LSM800, Zeiss), stored
in 1024 × 1024 pixel frames. Each image contained 1 glomerulus.
Manual image annotation for ground truth generation. Ground truth data sets were generated based on
podocyte nuclei and glomerular areas in manual segmentation performed by 3 expert scientists trained
under equal conditions within our team, blinded from the patient data. Quality control was performed by a
senior scientist within our team. During training, the segmentation U-Net then learned from the annotated
images (training and validation sets) to segment the structures of interest, and the final results were validat-
ed on another set of annotated images (test set).
Glomeruli were classified as normal or lesions based on anatomical criteria. Normal glomeruli had a
monolayer of parietal epithelial cells and glomerular tufts with homogenous and robust podocyte labels,
namely cytoplasmic WT1 and nuclear DACH1. Glomerular lesions showed at least a double layer of pari-
etal epithelial cells, capillary collapse, and/or segmental or global absence of podocyte labeling.
ImageJ baseline script for glomerulus and podocyte nuclei segmentation. In order to segment the glomerulus
using ImageJ, the following sequence was used: (a) channel splitting; (b) thresholding and then dilation
applied to each channel separately; (c) channel merging; (d) filling holes, eroding, and particle analysis; and
(e) selection of the biggest region of interest. In order to segment podocyte nuclei using ImageJ, the fol-
lowing sequence was used: (a) channel splitting and thresholding; (b) dilation of WT1 channel followed by
combination of all channels using the logical operator “AND”; (c) thresholding of DNA label; (d) dilation,
filling holes, and eroding; and (e) distance transformation using watershed (MorphoLibJ plugin).
Dual-output segmentation U-Net. Inspired by Ronneberger et al. (18, 19), a U-Net architecture was imple-
mented in Python 3 using Tensorflow 1.13. The segmentation U-Net consists of an encoder with 3 layers,
where the convolutions in the first layer have 32 filters. The number of filters is doubled in the following
layers. After the bottom layer with 256 filters, the number of filters is halved again for each of the 3 layers
of the decoder. We pad the images in order to receive segmentations of the same size as the input images.
The U-Net was modified to simultaneously return a dual segmentation output: glomerular areas and
podocyte nuclear areas. An annotated subset of images (n = 317) was split into training (192 images), vali-
dation (60 images), and test (65 images) subsets with the relation of approximately 60/20/20, maintaining
that all images from 1 subject should belong to 1 subset. For training, the use of extensive on-the-fly data
augmentation (horizontal and vertical flips, horizontal and vertical shifts, rotations up to 45°) was import-
ant for the generalizability of the network. The network was trained for 2000 epochs with a batch size of 2
images on an Nvidia Tesla V100 graphics card. We used RMSprop as an optimizer and introduced a cus-
tom balanced 2-layer binary cross-entropy loss that adaptively takes into account the current performance
of each segmentation task. The binary cross-entropy for each task,
(Equation 1)
for mask (y) and prediction (ŷ) (the prediction is clipped to lie between ε and 1 – ε, with ε = 1 × 10⁻⁷, in order
to avoid logarithms of 1 and, thus, later divisions by 0) is adapted to consider both segmentation tasks simul-
taneously and to weight each term so that the currently poorer performing task receives more importance:
(Equation 2)
where BCEpodo and BCEglom are the binary cross-entropies for the podocyte and glomerulus segmentation
tasks, respectively. Additionally, we weighted foreground objects and the background in the training loss in
order to enforce a better segmentation of narrowly spaced podocytes. This was done using the function
weight maps w(x) for each image using its ground truth mask x similar to those proposed by Falk et al. (19):
(Equation 3)
JCI Insight 2021;6(7):e144779 https://doi.org/10.1172/jci.insight.144779 10TECHNIC AL ADVANCE
where wc is the class probability map for the mask, d1 is the distance to the border of the nearest cell, d2 is
the distance to the border of the second nearest cell, w0 a coefficient that controls the importance of the
distance maps, and σ2 the variance of the Gaussian filter.
Our evaluation metric is the commonly used Dice score, evaluated for each task separately at pixel
level and additionally at object level for the podocytes. Incomplete nuclear parts or glomeruli were fil-
tered out using postprocessing, removing all objects smaller than 800 μm for glomeruli and smaller than
3 μm for podocyte nuclei. Given that this architecture provided excellent results, and some tests with
a more complex architecture (i.e., Mask R-CNN) yielded similar results, we decided to work with our
more compact and faster dual U-Net.
Hyperparameter optimization. In order to find the optimal architecture and hyperparameters, an extensive
grid search across various options was performed using Ray Tune (https://docs.ray.io/en/master/tune/
index.html) and Sacred (https://sacred.readthedocs.io/en/stable/). Chosen values are in parentheses: sin-
gle versus dual segmentation (dual), number of layers (n = 3), number of filters in the first layer (n = 32),
dropout in encoder and decoder (no), dropout in the bottom layer (yes), skip connections between encoder
and decoder (yes), dropout in the skip connections (no), batch normalization (yes), optimizer (RMSprop),
learning rate (1 × 10⁻⁵), learning rate decay (no), loss (balanced 2-layer binary cross-entropy), weighting
(yes), histogram equalization (no), contrast stretching (no), data augmentation (yes), and oversampling of
crescents (no). To evaluate these, iteratively, a few (related) hyperparameters were varied. Then, using 4-fold
cross-validation on the combined training and validation subsets of the Controls 1 data set (Supplemental
Table 1), networks were trained, and the optimal configuration was chosen based on the average Dice scores,
as well as their SD between the different folds of the cross-validation (or, for similar performance, the least
data/computationally intensive). This process was repeated with the next set of hyperparameters. In a sim-
ilar fashion, using 10-fold cross-validation, we evaluated the number of images used for training to ensure
that approximately 60–70 images per data set yielded satisfactory results, with Dice scores above 0.90.
U-Net cycleGAN configuration. The U-Net cycleGAN was implemented in Python 3 with Tensorflow 2.0.
The generator is made up of an encoder, a transformer, and a decoder. Based on Zhu et al. (20), the encoder
consists of 3 convolutional layers with 64, 128, and 256 filters; kernel sizes 7, 3, and 3; and strides 1, 2, and
2. All layers use instance normalization, as well as ReLU activation. The transformer consists of 9 ResNet
blocks (33), which are made up of 2 convolutional layers with instance normalization and ReLU activation
for the first layer. The decoder is made up of 3 transposed convolutional layers. Before each decoder layer,
the input is concatenated with the output of the corresponding layer in the encoder. The transposed convolu-
tional layers have 128, 64, and 3 filters; kernel sizes 3, 3, and 7; and strides 2, 2, and 1. All layers use instance
normalization, except for the first 2 layers, which are ReLU activated, and the last layer, which has a hyper-
bolic tangent (tanh) activation since its output is the generated image having pixel values between –1 and 1.
The discriminator consists of 6 convolutional layers, with 64, 128, 256, 512, 512, and 1 filters; kernel size 4;
and strides 2, 2, 2, 2, 1, and 1. Except for the first and last layer, all are instance normalized. And, except for
the last layer, all use a leaky ReLU activation with an α slope of 0.2.
CycleGAN training. The model has been trained on 285 images from Controls 2 (Supplemental Table 1)
and 180 images from Controls 1. For the validation, 46 images from Controls 2 and 44 from Controls 1 have
been used. The images were resized to 256 × 256 pixels with 3 channels (RGB) using Gaussian pyramids.
After their transformation, the images were upsampled to the original size of 1024 × 1024 pixels using
Laplacian pyramids, as has been done in Engin et al. (34). The pyramids consist of layers calculated based
on the original input. The network was trained for up to 200 epochs with a steady learning rate of 2 × 10⁻⁴
for the first 100 epochs and a linearly decaying learning rate that ends at 0 after 200 epochs. The cycle con-
sistency loss and identity loss have been weighted with weights λcyc = 10 and λid = 5, respectively. The batch
size was 1. The epoch with the lowest validation loss has been selected for transferring the images (epoch
83). The network was trained on an NVIDIA Quadro RTX 8000 48GB with TeslaLink.
Since bias between different data sets is not a new problem, a comparison between generative mod-
els and traditional approaches was necessary. Because the (initial) effort for generative models is higher, it
should be shown that they lead to better results. As baseline methods, histogram equalization, color transfer
based on a single reference image, and an adaptation of the mean colors to the reference have been tested.
However, none of these methods showed a substantial improvement.
Molecular podometrics. Model-based stereology was applied (35) and allowed the estimation of podocyte
number and podocyte density per glomerulus. Fiji imaging software (Max Planck Institute of Molecular
JCI Insight 2021;6(7):e144779 https://doi.org/10.1172/jci.insight.144779 11TECHNIC AL ADVANCE
Cell Biology and Genetics) was used to navigate the raw files. Podocytes were defined as DAPI+WT-
1+DACH1+ cells. Glomerular cross-sectional areas were measured in order to estimate glomerular volumes
and thereby define podocyte densities.
The morphometric signature combines the podometrics per glomerulus within each patient by cal-
culating the minimum, maximum, mean, median, and variance of podocyte number, podocyte density,
podocyte distance (distance to closest neighboring podocyte), podocyte nuclear area, and glomerular area
across all glomeruli per subject.
Data and materials availability. The data sets generated and analyzed during the current study are available
from the corresponding authors. The code is available via https://github.com/imsb-uke/podometric_u_net
(Branch name: main, commit ID: a33afcc).
Statistics. All statistical analyses were performed using GraphPad Prism (v8.0.2) and Stata 13.1. Results
are reported as median and IQR. Significance was evaluated using the unpaired Mann-Whitney U test
when comparing 2 continuous variables. For comparison of 3 groups, Kruskal-Wallis test with Dunn’s mul-
tiple-comparisons test was used. Correlation analyses were performed using Spearman’s rank coefficients.
A P value below 0.05 was considered to be statistically significant.
Classification of subjects into controls and ANCA-GN patients was performed in scikit-learn (36)
using a logistic regression and leave-one-out cross-validation, where 1 subject was iteratively excluded from
the training of the model and then used as a test set. The final results are a combination of all subjects’
results, each tested on a different model. Due to the nature of leave-one-out cross-validation without a com-
pletely unseen test set, no further optimization of parameters was possible. Each of the features in the mor-
phometric signature was normalized by removing its mean and dividing by its SD before using it to train
the logistic regression (excluding the test subject). To evaluate podometrics at the level of single glomeruli,
individual glomeruli were clustered using ClustVis (37) based on podometrics via PCA by Pareto scaling to
rows. Probabilistic PCA was used to calculate principal components.
Study approval. The ethics approval was obtained from the IRB of the RWTH Aachen University Med-
ical Center, Germany (EK-016/17); the Ethik-Kommission der Ärztekammer Hamburg; and local ethics
committee of the chamber of physicians in Hamburg (PV4806), all in accordance with the ethical princi-
ples stated by the Declaration of Helsinki.
Author contributions
Study initiation was contributed by TBH, SB, and VGP. Conceptualization was contributed by MK, MZ, TBH,
SB, and VGP. Methodology and analysis were contributed by MZ, MK, MNW, AKT, LG, CK, MH, JK, NW,
FB, SW, TW, UP, CFK, EH, RK, SB, and VGP. Writing was contributed by MZ, MK, AKT, TBH, SB, and
VGP. Supervision was contributed by TBH, SB, and VGP. Order of authors was decided based on timeline of
authors’ contributions.
Acknowledgments
Deutsche Forschungsgemeinschaft (DFG; CRC1192 to NW, TW, UP, CFK, EH, TBH, SB, and VGP), Deut-
sche Gesellschaft für Nephrologie to CFK and VGP, and eMed Consortia “Fibromap” from the Bundesminis-
terium für Bildung und Forschung (BMBF) to RK and VGP. EH was also supported by the DFG (Heisenberg
Programme). TBH was also supported by the DFG (HU 1016/8-2, HU 1016/11-1, HU 1016/12-1), by the
BMBF (STOP-FSGS-01GM1901C and NephrESA-031L0191E), by the Else-Kröner Fresenius Foundation
(Else Kröner-Promotionskolleg – iPRIME), by the European Research Council-ERC (616891), and by the
H2020-IMI2 consortium BEAt-DKD (115974); this joint undertaking receives support from the European
Union’s Horizon 2020 research and innovation program, and EFPIA and JDRF. VGP received additional
funding from National Health and Medical research Council of Australia and the Humboldt Foundation. RK
received additional funding from the DFG (KR-4073/3-1, SCHN1188/5-1, SFB/TRR57). MK was part of the
iPRIME program supported by the Else Kröner-Fresenius-Stiftung.
Address correspondence to: Victor G. Puelles, III. Department of Medicine, University Medical Cen-
ter Hamburg-Eppendorf, Martinistraße 52, Gebäude N27, 3. Etage, Hamburg 20246, Germany. Phone:
49.40.741035337; Email: v.puelles@uke.de. Or to: Stefan Bonn, Center for Molecular Neurobiology Hamburg
(ZMNH), Institute of Medical Systems Biology, Falkenried 94, 1. Etage, Hamburg 20251, Germany. Phone:
49.40.741055061; Email: sbonn@uke.de. Or to: Tobias B. Huber, III. Department of Medicine, University
JCI Insight 2021;6(7):e144779 https://doi.org/10.1172/jci.insight.144779 12TECHNIC AL ADVANCE
Medical Center Hamburg-Eppendorf, Martinistraße 52, Gebäude O10, 1. Etage, Hamburg 20246, Germany.
Phone: 49.40.741053908; Email: t.huber@uke.de.
1. Kitching AR, Hutton HL. The players: cells involved in glomerular disease. Clin J Am Soc Nephrol. 2016;11(9):1664–1674.
2. Puelles VG, Moeller MJ. Postnatal podocyte gain: Is the jury still out? Semin Cell Dev Biol. 2019;91:147–152.
3. Wharram BL, et al. Podocyte depletion causes glomerulosclerosis: diphtheria toxin-induced podocyte depletion in rats expressing
human diphtheria toxin receptor transgene. J Am Soc Nephrol. 2005;16(10):2941–2952.
4. Wanner N, et al. Unraveling the role of podocyte turnover in glomerular aging and injury. J Am Soc Nephrol. 2014;25(4):707–716.
5. Puelles VG, et al. mTOR-mediated podocyte hypertrophy regulates glomerular integrity in mice and humans. JCI Insight.
2019;4(18):99271.
6. Puelles VG, et al. Podocyte number in children and adults: associations with glomerular size and numbers of other glomerular
resident cells. J Am Soc Nephrol. 2015;26(9):2277–2288.
7. Puelles VG, et al. Human podocyte depletion in association with older age and hypertension. Am J Physiol Renal Physiol.
2016;310(7):F656–F688.
8. Hodgin JB, et al. Glomerular aging and focal global glomerulosclerosis: a podometric perspective. J Am Soc Nephrol.
2015;26(12):3162–3178.
9. Pagtalunan ME, et al. Podocyte loss and progressive glomerular injury in type II diabetes. J Clin Invest. 1997;99(2):342–348.
10. Lemley KV, et al. Evolution of incipient nephropathy in type 2 diabetes mellitus. Kidney Int. 2000;58(3):1228–1237.
11. Lemley KV, et al. Podocytopenia and disease severity in IgA nephropathy. Kidney Int. 2002;61(4):1475–1485.
12. Weil EJ, et al. Podocyte detachment and reduced glomerular capillary endothelial fenestration promote kidney disease in type 2
diabetic nephropathy. Kidney Int. 2012;82(9):1010–1017.
13. Fufaa GD, et al. Structural predictors of loss of renal function in American Indians with Type 2 diabetes. Clin J Am Soc Nephrol.
2016;11(2):254–261.
14. Shochet L, et al. Animal models of ANCA associated vasculitis. Front Immunol. 2020;11:525.
15. Anguiano L, et al. The glomerular crescent: triggers, evolution, resolution, and implications for therapy. Curr Opin Nephrol
Hypertens. 2020;29(3):302–309.
16. Lazareth H, et al. Parietal epithelial cells role in repair versus scarring after glomerular injury. Curr Opin Nephrol Hypertens.
2020;29(3):293–301.
17. Esteva A, et al. A guide to deep learning in healthcare. Nat Med. 2019;25(1):24–29.
18. Ronneberger O, Fischer P, Brox T. U-Net: Convolutional Networks for Biomedical Image Segmentation. In: Navab N, Hornegger J,
Wells W, Frangi A (eds). Medical Image Computing and Computer-Assisted Intervention – MICCAI 2015. Springer, Cham; 2015; 234–241.
19. Falk T, et al. Author corresction: U-Net: deep learning for cell counting, detection, and morphometry. Nat Methods. 2019;16(4):351.
20. Zhu J, et al. Unpaired image-to-image translation using cycle-consistent adversarial networks. Paper presented at: IEEE
International Conference on Computer Vision (ICCV); October 22–29, 2017; Venice, Italy. 2017. https://doi.org/10.1109/
ICCV.2017.244. Accessed February 26, 2021.
21. de Bel T, et al. Stain-transforming cycle-consistent generative adversarial networks for improved segmentation of renal histopathology.
PMLR. 2019;102:151–163.
22. Campanella G, et al. Clinical-grade computational pathology using weakly supervised deep learning on whole slide images. Nat Med.
2019;25(8):1301–1309.
23. Coudray N, et al. Classification and mutation prediction from non-small cell lung cancer histopathology images using deep
learning. Nat Med. 2018;24(10):1559–1567.
24. Brix SR, et al. Development and validation of a renal risk score in ANCA-associated glomerulonephritis. Kidney Int.
2018;94(6):1177–1188.
25. Alemi Koohbanani N, et al. NuClick: a deep learning framework for interactive segmentation of microscopic images. Med Image
Anal. 2020;65:101771.
26. Kather JN, et al. Deep learning can predict microsatellite instability directly from histology in gastrointestinal cancer. Nat Med.
2019;25(7):1054–1056.
27. Echle A, et al. Clinical-grade detection of microsatellite instability in colorectal tumors by deep learning. Gastroenterology.
2020;159(4):1406–1416.
28. Hermsen M, et al. Deep learning-based histopathologic assessment of kidney tissue. J Am Soc Nephrol. 2019;30(10):1968–1979.
29. Ginley B, et al. Computational segmentation and classification of diabetic glomerulosclerosis. J Am Soc Nephrol. 2019;30(10):1953–1967.
30. Wiggins RC. The spectrum of podocytopathies: a unifying view of glomerular diseases. Kidney Int. 2007;71(12):1205–1214.
31. Kriz W, et al. Progression of glomerular diseases: is the podocyte the culprit? Kidney Int. 1998;54(3):687–697.
32. Endlich N, et al. The transcription factor Dach1 is essential for podocyte function. J Cell Mol Med. 2018;22(5):2656–2669.
33. He K, et al. Deep residual learning for image recognition. Paper presented at: Proceedings of the IEEE Conference on
Computer Vision and Pattern Recognition (CVPR); June 27–30, 2016, Las Vegas, Nevada, USA. https://doi.org/10.1109/
CVPR.2016.90. Accessed February 26, 2021.
34. Engin D, et al. Version 1. Cycle-Dehaze: Enhanced CycleGAN for Single Image Dehazing; 2018. Accessed February 26, 2021.
https://arxiv.org/abs/1805.05308.
35. Lemley KV, et al. Estimation of glomerular podocyte number: a selection of valid methods. J Am Soc Nephrol. 2013;24(8):1193–1202.
36. Pedregosa F, et al. Scikit-learn: machine learning in python. JMLR. 2011;12(85):2825–2830.
37. Metsalu T, Vilo J. Clustvis: a web tool for visualizing clustering of multivariate data using principal component analysis and
heatmap. Nucleic Acids Res. 2015;43(W1):W566–W570.
38. Russell SJ, et al. Artificial Intelligence: A Modern Approach (2nd ed.). Upper Saddle River, New Jersey: Prentice Hall, 2003.
JCI Insight 2021;6(7):e144779 https://doi.org/10.1172/jci.insight.144779 13You can also read