Multi omic analysis unveils biological pathways in peripheral immune system associated to minimal hepatic encephalopathy appearance in cirrhotic ...
←
→
Page content transcription
If your browser does not render page correctly, please read the page content below
www.nature.com/scientificreports
OPEN Multi‑omic analysis unveils
biological pathways in peripheral
immune system associated
to minimal hepatic encephalopathy
appearance in cirrhotic patients
Teresa Rubio1,9, Vicente Felipo1,9, Sonia Tarazona2,9, Roberta Pastorelli3,
Desamparados Escudero‑García4, Joan Tosca5, Amparo Urios1,6, Ana Conesa7* &
Carmina Montoliu6,8
Patients with liver cirrhosis may develop minimal hepatic encephalopathy (MHE) which affects their
quality of life and life span. It has been proposed that a shift in peripheral inflammation triggers the
appearance of MHE. However, the mechanisms involved in this immune system shift remain unknown.
In this work we studied the broad molecular changes involved in the induction of MHE with the goal
of identifying (1) altered genes and pathways in peripheral blood cells associated to the appearance
of MHE, (2) serum metabolites and cytokines with modified levels in MHE patients and (3) MHE-
regulated immune response processes related to changes in specific serum molecules. We adopted
a multi-omic approach to profile the transcriptome, metabolome and a panel of cytokines of blood
samples taken from cirrhotic patients with or without MHE. Transcriptomic analysis supports the
hypothesis of alternations in the Th1/Th2 and Th17 lymphocytes cell populations as major drivers of
MHE. Cluster analysis of serum molecules resulted in six groups of chemically similar compounds,
suggesting that functional modules operate during the induction of MHE. Finally, the multi-omic
integrative analysis suggested a relationship between cytokines CCL20, CX3CL1, CXCL13, IL-15, IL-22
and IL-6 with alteration in chemotaxis, as well as a link between long-chain unsaturated phospholipids
and the increased fatty acid transport and prostaglandin production. We found altered immune
pathways that may collectively contribute to the mild cognitive impairment phenotype in MHE. Our
approach is able to combine extracellular and intracellular information, opening new insights to the
understanding of the disease.
Minimal hepatic encephalopathy (MHE) is a neuropsychiatric syndrome that produces mild cognitive impair-
ment, attention deficits, psychomotor slowing and impaired coordination in cirrhotic p atients1. The combination
of hyperammonemia and peripheral inflammation, even before progression to cirrhosis, is enough to induce
cognitive and motor d isturbances2. Specific alterations of the immunophenotype have been already described
as triggers of MHE in cirrhotic p atients3. Furthermore, infiltration of peripheral lymphocytes in cerebellum
has been observed at early stages of liver disease4. This suggests that changes in peripheral inflammation cause
infiltration of lymphocytes in the brain, leading to neuroinflammation which alters neurotransmission and
1
Laboratory of Neurobiology, Centro Investigación Príncipe Felipe, Valencia, Spain. 2Departamento de Estadística
e Investigación Operativa Aplicadas y Calidad, Universitat Politècnica de València, Valencia, Spain. 3Protein and
Metabolite Biomarkers Unit, Laboratory of Mass Spectrometry, Istituto di Ricerche Farmacologiche Mario Negri
IRCCS, Milan, Italy. 4Unidad de Digestivo, Hospital Clínico de Valencia, Departamento Medicina, Universidad de
Valencia, Valencia, Spain. 5Unidad de Digestivo, Hospital Clínico de Valencia, Valencia, Spain. 6Neurological
Impairment Laboratory, Fundación Investigación Hospital Clínico Universitario de Valencia, Instituto de
Investigación Sanitaria-INCLIVA, Valencia, Spain. 7Microbiology and Cell Science Department, Institute for Food
and Agricultural Sciences, Genetics Institute, University of Florida, Gainesville, USA. 8Departamento de Patología,
Facultad de Medicina, Universidad de Valencia, Valencia, Spain. 9These authors contributed equally: Teresa Rubio,
Vicente Felipo and Sonia Tarazona. *email: aconesa@ufl.edu
Scientific Reports | (2021) 11:1907 | https://doi.org/10.1038/s41598-020-80941-7 1
Vol.:(0123456789)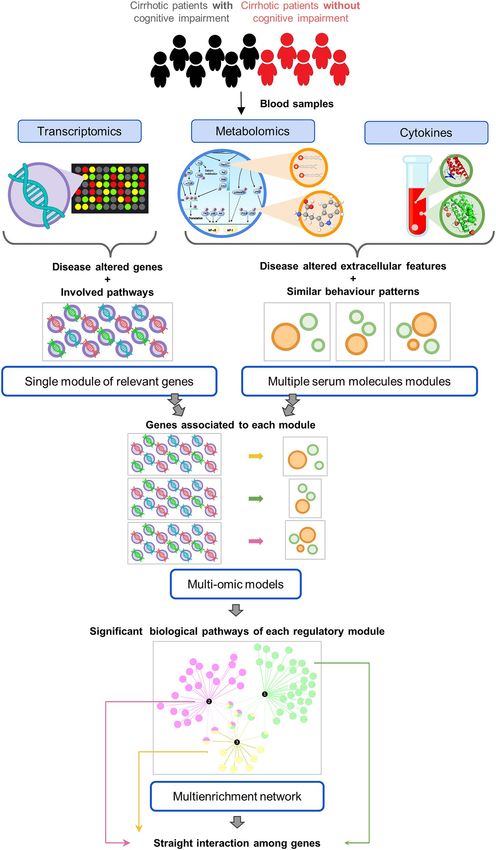
www.nature.com/scientificreports/
ultimately leads to cognitive i mpairment5. The neuro-immune axis has been found to be relevant in many other
neurological human diseases such as multiple sclerosis6, hepatocellular carcinoma7, Alzheimer’s disease and other
neurological disorders8. Potential pro-inflammatory biomarkers have been suggested, including chemokines,
which mediate acute inflammation by driving leukocyte migration to damaged or infected t issues6. Beyond their
classical chemotactic functions, these immune proteins have been implicated in different neural processes such
as neuromodulation, neurotransmission and regulation of n eurogenesis8.
The precise pathways that trigger a systemic immune response leading to a neurological disorder are still
poorly understood. Next to the role of pro-inflammatory chemokines, other signaling, metabolic and regula-
tory components are likely to contribute. Here, we have adopted a multi-omic approach to investigate the set of
molecular and cellular events that are associated with MHE. Multi-omic technologies such as genomics, epig-
enomics, transcriptomics, proteomics and metabolomics are increasingly being used to profile the multi-layered
component of living cells and pathological p rocesses9–12. The rationale behind this strategy is that disease usually
impacts different types of biomolecules and by expanding the molecular space under study, the likelihood of
identifying relevant biomarkers will increase. In the context of neurological pathologies, multi-omics has allowed
the modeling of the highly sophisticated brain metabolic networks and their contribution to human h ealth13,14,
as well as the identification of specific and common features for this type of d iseases15.
In this study we combine blood transcriptomics, serum metabolomics and cytokines to identify pathways
and biomarkers associated with MHE in cirrhotic patients. We deploy a bioinformatics analysis pipeline that
combines univariate, multivariate and enrichment methods to find genes and extracellular compounds that share
variation patterns linked to the MHE phenotype. Using this approach, we discovered a relationship between
extracellular CCL20, CX3CL1, CXCL13, IL-15, IL-22 and IL-6 with the alteration of chemotactic receptors and
ligands in MHE patients. In addition, this methodology suggested a link between long-chain unsaturated phos-
pholipids and the increment of fatty acid transport and prostaglandin production, which jointly may contribute
to the onset of mild cognitive impairment.
Methods
Overview of the analysis strategy. In order to understand the joint contribution of gene expression and
extracellular metabolite changes to MHE, we developed an extensive pipeline that combines univariate and mul-
tivariate regression for feature selection while taking into account the biology of the system (Fig. 1). Basically, we
first identified genes and associated pathways that significantly changed between cirrhotic individuals with and
without MHE. In parallel, metabolites and cytokines with significant serum level changes were identified and
grouped by their variation pattern across individuals. These groups represent metabolic modules that change in
a coordinated fashion. Next, we asked if there exists a gene expression signature that associates to each of these
modules. We applied Partial Least Square (PLS) to the multi-omic data taking the selected genes as explanatory
variables and each module of extracellular compounds as a shared response. This analysis selected the genes with
the strongest associations to each metabolic group, which are then further investigated by pathway enrichment
and biological interaction modeling (Fig. 1).
Patients and sample collection. 11 patients with liver cirrhosis were recruited from the outpatient clin-
ics in the Hospital Clínico of Valencia, Spain. The diagnosis of cirrhosis was based on clinical, biochemical and
ultrasonographic data. Exclusion criteria were: overt hepatic encephalopathy, recent (< 6 months) alcohol intake,
infection, recent (< 6 weeks) antibiotic use or gastrointestinal bleeding, recent (< 6 weeks) use of drugs affect-
ing cognitive function, presence of hepatocellular carcinoma, or neurological or psychiatric disorder. Patients
included in the study did not show fever or any clinical or biological sign of recent infection. None of the patients
included in the study had hypothyroidism or altered TSH (Thyroid-Stimulating Hormone). All participants were
included in the study after signing a written informed consent. Study protocols were approved by the Scientific
and Ethical Committees of the Hospital Clínico of Valencia. The procedures followed were in accordance with
the ethical guidelines of the Declaration of Helsinki3.
Diagnosis of MHE. MHE was diagnosed using the Psychometric Hepatic Encephalopathy Score (PHES) which
comprises 5 psychometric t ests16,17. The scores were adjusted for age and education level using Spanish normality
tables (www.redeh.org). Patients were classified as MHE when the score was ≤ − 4 points. From the 11 recruited
cirrhotic patients, five were diagnosed without MHE and six with MHE. All patients were males and the mean
age in group with MHE (70.7 ± 4.0) and in group without MHE (63.8 ± 1.2) did not show significant differences
(p = 0.157).
Sample collection. Transcriptomic dataset was measured in blood samples collected in PAXgene® blood RNA
tubes (BD Biosciences) that were frozen at − 20 °C during 24 h and kept at − 80 °C for subsequent analysis. For
metabolomic measurements, plasma samples were obtained from blood collected in BD P100 tubes (BD Bio-
sciences) containing EDTA and protein stabilizers. Plasma samples were obtained after two serial centrifuga-
tions, first at 5 °C, 2500g, for 20 min, and after transferring plasma to new tubes, a second centrifugation at 10 °C,
2500g, for 10 min, were performed. Plasma samples were distributed in several aliquots and stored at − 80 °C.
Cytokines were measured in serum fraction after blood sample collection in tubes without EDTA.
Analysis of cytokines in serum samples. Concentration of IL-4, IL-6, IL-13, IL-17, IL-18, IL-22, TGFβ
(Affymetrix eBioscience, Vienna, Austria), IL-10, IL-12, IL-15, CXCL13, CCL20, CX3CL1 and TNFα (R&D
Systems, Minneapolis, MN, USA) were measured by ELISA according to the manufacturer’s instructions. High
sensitivity kits were necessary for IL-17, IL-4 and TNFα assessment.
Scientific Reports | (2021) 11:1907 | https://doi.org/10.1038/s41598-020-80941-7 2
Vol:.(1234567890)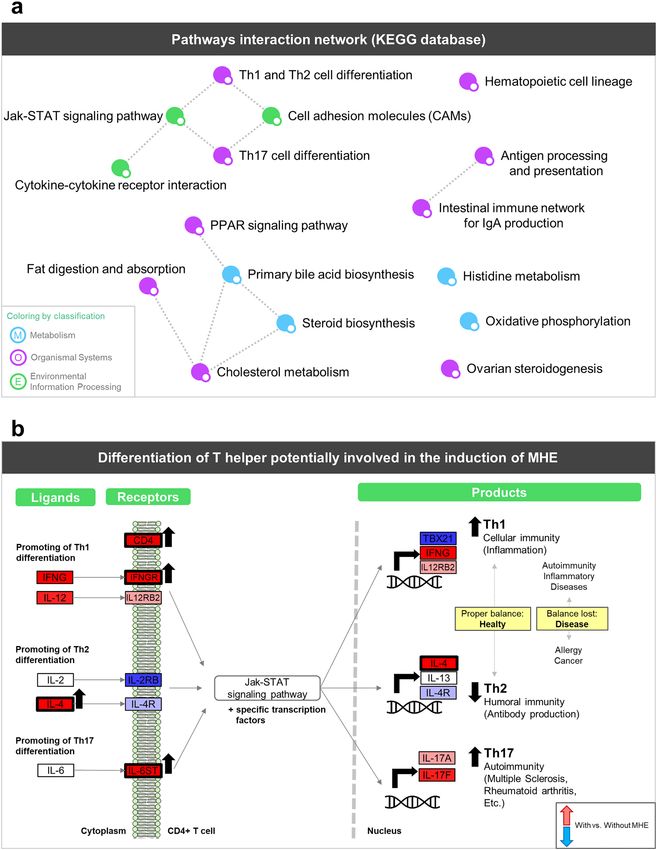
www.nature.com/scientificreports/

                                  Figure 1.  Summary of the analysis pipeline. Transcriptomics, metabolomics and cytokines were measured
                                  in blood samples of 11 cirrhotic patients (6 with and 5 without MHE). Step 1: genes and pathways altered in
                                  MHE. Step 2: altered metabolites and cytokines grouped by correlation. Step 3: integration of extracellular and
                                  intracellular datasets. Step 4: enrichment and network analysis of iterative models.

Scientific Reports |   (2021) 11:1907 |               https://doi.org/10.1038/s41598-020-80941-7                                                    3

                                                                                                                                            Vol.:(0123456789)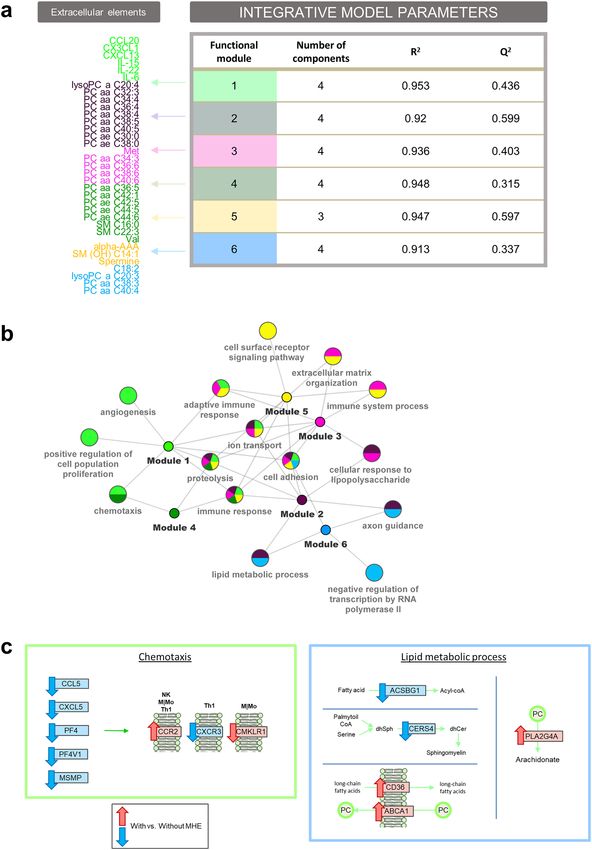
www.nature.com/scientificreports/
Cytokines data analysis. Significant differences in cytokines between patients with and without MHE were
tested using the non-parametric Wilcoxon test after homoscedasticity were checked. Multiple testing correction
was applied by FDR.
Transcriptomic profiling of plasma samples. RNA extracted from peripheral blood cells was quan-
tified with NanoDrop ND1000 (NanoDrop Technologies, Wilminton, Delaware USA) and RNA quality was
confirmed with RNA 6000 Nano Bioanalyzer assay (Agilent Technologies, Palo Alto, California USA). Using
the One-Color Low Input Quick Amp Labelling Kit (Agilent p/n 5190-2305) according to the manufacturer’s
instructions, 200 ng of total RNA were used to produce Cyanine 3-CTP-labeled cRNA. Following ‘One-Color
Microarray-Based Gene Expression Analysis’ protocol Version 6.7 (Agilent p/n G4140-90040), 600 ng of labeled
cRNA was hybridized with the SurePrint G3 Human Gene Expression Microarrays v3 8X60K (Agilent p/n
G4858A-072363). Microarrays were scanned in an Agilent Microarray Scanner (Agilent G2565C) as reported in
the guidelines from the manufacturer and the image analysis was made with Agilent Feature Extraction Software
11.5.1.1 using default parameters (protocol GE1_1105_Oct12, grid template 072363_D_F_20150612 and QC
Metric Set GE1_QCMT_Oct12).
Transcriptomic data analysis. The normalization method VSN, implemented in the vsn R/Bioconductor
package18, was applied to stabilize the variance of microarray intensity data. Weighted linear modeling from
limma R/Bioconductor p ackage19 was performed to find differentially expressed genes between two groups:
cirrhotic patients with and without cognitive impairment. Enrichment analysis was calculated using Fisher’s
Exact Test implemented in PaintOmics20, which identifies those gene sets that share an unusually large number
atabase21 as
of genes within the list resulting from the differential expression test. PaintOmics includes KEGG d
annotation for enrichment analyses and subsequent gene expression representation.
Metabolomic profiling of serum samples. Targeted metabolomic analysis was performed using the
Absolute-IDQ™ P180 kit (BIOCRATES Life Sciences AG, Innsbruck, Austria). The metabolite extracts were
processed following the instructions by the manufacturer and analyzed on a triple-quadropole mass spectrom-
eter (AB SCIEX triple-quad 5500) operating in the multiple reaction monitoring (MRM-MS) mode. The assay
is based on PITC (phenylisothiocyanate)-derivatization in the presence of internal standards for the analysis of
aminoacids and biogenic amines resolved and analyzed by liquid chromatography (LC) tandem mass spectrom-
etry (MS/MS) using scheduled MRMs. Separation was achieved on a Agilent Zorbax Eclipse XDB C18 column
(3 × 100 mm, 3.5 μm) with a mobile phases of 0.2% formic acid in water (A) and 0.2% formic acid in acetonitrile
(B). The gradient program was as follows: 0 min, 100% A; 0.5 min, 100% A; 5.5 min, 5% A; 6.5 min, 5% A;
7.0 min, 100% A; 9.5 min 100% A. The column was maintained at 50 °C, with 0.5 ml/min flow rate and 10 μl
volume injection. In the mass spectrometer, sample analysis was performed in positive electrospray ionization
(ESI) mode. Declustering potential (DP) and collision energy (CE) were provided by the kit. The MRM MS/MS
detector conditions were set as follows: temperature 500 °C; ion spray voltage 5500 V; curtain gas 20 psi; colli-
sion gas (CAD) medium; entrance potential (EP) 10 V; collision cell exit potential (CXP) 15 V; ion source gas
1 (GS1) 40 psi; ion source gas 2 (GS2) 50 psi. Retention times for every metabolite were adjusted previously to
the experiment22.
To analyze acylcarnitines, glycerophospholipids, hexose, subsequent flow injection analysis tandem mass spec-
trometry (FIA-MS/MS) was performed. PEEK Tubing Red (1/16 × 0.005) was used for separation with Biocrates
solvent I diluted in 290 ml methanol as mobile phase ("isocratic elution mode"). The gradient program: 0 min,
0.03 ml/min; 1.6 min, 0.03 ml/min; 2.4 min, 0.20 ml/min; 2.8 min, 0.20 ml/min; 3.0 min, 0.03 ml/min. Positive
electrospray ionization (ESI) mode was used in spectrometry although some parameters were different for lipids
and sugars. For lipids, exactly the same parameters used in LC–MS/MS except the temperature (200 °C). For
sugars: ion spray voltage − 4500 V (negative); curtain gas 20 psi; CAD medium; EP − 10 V; CXP − 15 V; GS1 40
psi; GS2 50 psi; DP − 55 V; CE − 12 V 22.
Lipid concentrations were automatically calculated in μM using the MetIDQTM software (Biocrates Life Sci-
ence AG, Innskruck, Austria) and the rest of metabolites were quantified from standard curves with the software
Analyst from SCIEX. Isotope-labeled internal standards are integrated into the platform for metabolite absolute
quantification. The measurements are made in a 96-well format. Metabolite limit of detection was set three times
the value of the “zero samples” and the average coefficient of variation of the metabolites among the biological
replicates was 30%. Based on the five internal quality controls, technical variation was below 15%. A metabolite
was excluded from further analyses if its concentration measurement data did not meet all of the following crite-
ria: (1) minor of 20% of missing values (non-detectable peak) for each quantified metabolite in each experimental
group (2) 50% of all measured sample concentrations for the metabolite had to be above the limit of d etection22.
The provided metabolomic data matrix included 143 metabolites without missing values: 8 acylcarnitines, 21
amino acids, 17 biogenic amines, the sum of hexoses, 15 sphingomyelins (SM) and 81 glycerophospholipids,
including lysophosphatidylcholines (lysoPC) and phosphatidylcholines (PC). According platform annotation,
lipid side-chain composition is abbreviated as “C x:y”, where “x” denotes the number of carbon atoms and “y”
the number of double bonds present in the fatty acid residues. The presence of a hydroxyl group in SMs is indi-
cated with OH. Glycerophospholipids are differentiated according to the presence of ester and ether bonds in
the glycerol moiety. Double letters (aa = diacyl, ae = acyl-alkyl) indicate that two glycerol positions are bound to
a fatty acid residue, while a single letter (a = acyl or e = alkyl) indicates a bond with only one fatty acid residue23.
Metabolomic data pre‑processing and analysis. As in transcriptomics, vsn normalization18 and limma19 proce-
dures were applied to find the altered metabolites between groups of patients. Significantly altered metabolites
Scientific Reports | (2021) 11:1907 | https://doi.org/10.1038/s41598-020-80941-7 4
Vol:.(1234567890)www.nature.com/scientificreports/
in MHE were considered when FDR < 0.05. Although vsn and limma were primarily developed for microarray
data, they can be applied to mass spectrometry-based data since normality assumption holds. The effectiveness
for using these methods in metabolomic datasets has been already validated in different s tudies24–28.
Omic power analysis. The statistical power of each omic data type was evaluated with the MultiPower
tool29 as a quality control of differential expression results. For gene expression and metabolomic data, we found
values of power above 0.75 when aiming to detect features with relatively large changes and low variability
(Cohen’s d of at least 1.5). For cytokines, a power of at least 0.75 was obtained for a higher proportion of features
since they present bigger effect sizes compared to the other omics. We concluded that, despite of the small sam-
ple size available, we had enough power to validate our results and proceed with the analysis.
Obtaining modules of coordinated metabolites and cytokines. A comparative analysis of several
methods including Hierarchical Clustering, K-means and Partitioning Around Medoids (PAM)30 was performed
and evaluated using a Silhouette analysis31. PAM clustering analysis was finally applied to our data since it pro-
vided the best Silhouette results. We used the absolute Spearman correlation value (r) between all significant
serum features, including metabolites and cytokines. Specifically, distance measure was √2(1–r2). Every cluster
was a group of features with similar variation patterns across patients and clusters were denoted as “Modules”.
Integration of multi‑omic datasets. We used Partial Least Squares (PLS) regression32 to link changes
in gene expression with the variation in the serum levels of metabolites and cytokines. PLS integrates two data
matrices, X (e.g. transcriptomics) and Y (e.g. metabolomics), maximizing the covariance between them.
For all PLS models, the same set of genes were used as explanatory variables. These genes were selected by
having an FDR < 0.05 in the limma analysis (i.e. “significant” genes). In this way, we compiled a gene expression
matrix of explanatory variables that were relevant to the disease. Then, for each Module-specific PLS model, the
serum levels of the metabolites and cytokines included in the model were taken as response Y matrix.
Two parameters were calculated to assess performance of PLS models: R2 (multiple correlation coefficient;
degree of Y variance explained by X) and Q 2 (predictive power). As the number of samples n is small in this
study, leave-one-out cross-validation was used to compute Q 2. Gene loadings of the resulting PLS models are a
measure of the relative importance of the gene variables to the model. Enrichment analysis using mdgsa test33
were run for the list of genes ranked by the loading values of the first component of the PLS models. The Bio-
logical Process branch of the Gene Ontology34 was chosen as the annotation database for enrichment analyses.
Results
Transcriptomic analysis confirms changes in the immunophenotype in MHE patients and
unveils new altered pathways. Gene expression analysis identified 847 differentially expressed genes with
FDR < 0.05 (Supplementary Table S1) and enrichment analysis showed 11 significant pathways (p-value < 0.05)
(Supplementary Table S2) when comparing MHE versus non-MHE patients. Three additional pathways with
p-values < 0.1 were included in this selection due to their high relevance to the disease. Pathway enrichment
analysis was made with PaintOmics20, which creates a network of interconnected significant pathways (Fig. 2A).
This analysis revealed a network of immunity related pathways consisting of “Th1 and Th2 cell differentiation”
and “Th17 cell differentiation” linked with “Cell adhesion molecules (CAMs)” and “Jak-STAT signaling path-
ways”, in turn connected with “Cytokine-cytokine receptor interaction”. Jak-STAT pathway plays critical roles in
the immune system, especially cytokine receptors and the polarization of T helper c ells35. In addition, “Antigen
processing and presentation” was joined with “Intestinal immune network for IgA production”, while “Hemat-
opoietic cell lineage” remained as a single node. A second group of processes in this network was related to lipid
metabolism and included “Fat digestion and absorption”, “Cholesterol metabolism”, “Steroid biosynthesis”, “Pri-
mary bile acid biosynthesis” and “PPAR signaling pathway”. This set of functions together with the associated
regulated genes depict the most relevant immunological events associated with MHE.
The advantage of using PaintOmics is that this web tool allows the visualization of gene expression levels
onto KEGG21 pathways. Inspection of the “Hematopoietic cell lineage” pathway revealed significant differences
in genes related to B and T cells differentiation (Supplementary Fig. S1). In particular, the mature B-cell marker
MS4A1 (also known as CD20) was up-regulated in MHE patients. This gene is a relevant target for autoimmune
disease therapies36 and has also been related to T-cell-dependent immune responses37. T cells are divided into
different subsets according to their markers and functions like CD8+ that are T cytotoxic cells (Tc) and CD4+
are T helper cells (Th). Our results showed a significant up-regulation of CD4 and significant down-regulation
of CD8A and CD8B in MHE patients. Additionally, the “Antigen processing and presentation” pathway was also
generally decreased (Supplementary Fig. S1). Tumor Necrosis Factor (TNF) and Proteasome Activator Subunit
(PSME1), two upstream key genes in Major Histocompatibility Complex (MHC) class I peptides, were sig-
nificantly down-regulated. TNF is able to activate PSME1 that is implicated in immunoproteasome assembly,
rocessing38. Moreover, the antigen presentation genes of MHC class II, HLA-DQA2
required for efficient antigen p
and HLA-DRB5, were also significantly decreased. Altogether, these results describe an immune response signa-
ture in MHE patients where antigen processing and presentation were down-regulated and T cells population
showed opposite regulation patterns with Tc down-regulated and Th up-regulated.
More details on changes at T helper lymphocytes were found when analyzing the “Th1 and Th2 cell dif-
ferentiation” pathway (Fig. 2B). We found significant differences between Th1 and Th2 subtypes in cytokine
receptors and products (left and right part of the pathway, respectively). For instance, the Th1-related molecules
IFNGR, IL12R, IFNG and IL12 were increased while Th2 showed decreased IL2R and IL4R receptors, significantly
increased IL4 and unaltered IL13 expression. Th17 lymphocytes are the third Th subset most important for the
Scientific Reports | (2021) 11:1907 | https://doi.org/10.1038/s41598-020-80941-7 5
Vol.:(0123456789)www.nature.com/scientificreports/
Figure 2. Summary of PaintOmics enrichment analysis. (a) Network showing pathway-pathway interactions
in PaintOmics 3. Nodes represent pathways with a p-value lower than 0.05 and are colored by KEGG category.
Edges between two nodes indicate that both biological processes are closely related. (b) Pathway scheme that
summarizes Th1, Th2 and Th17 differentiation pathways. Rectangles represent up (red) or down (blue) gene
regulation in patients with versus without MHE. Black arrows and thicker black borders mark those genes with
statistical significance (FDR < 0.05).
regulation of i mmunity39 and the “Th17 cell differentiation” pathway showed a significant up-regulation of the
IL6ST receptor and an increase in IL17A and IL17F expression that suggested the promotion of Th17 cell type in
Scientific Reports | (2021) 11:1907 | https://doi.org/10.1038/s41598-020-80941-7 6
Vol:.(1234567890)www.nature.com/scientificreports/
ID Biocrates logFCa FDRb ID Biocrates logFCa FDRb
PC aa C36:4 − 0.7436 0.0005 PC aa C38:5 − 0.6788 0.0009
PC aa C38:4 − 0.7106 0.0006 PC aa C38:3 − 0.5105 0.0165
PC aa C38:5 − 0.6788 0.0009 alpha-AAA − 0.4547 0.0167
PC aa C40:5 − 0.6272 0.0015 PC aa C40:4 − 0.4155 0.0228
PC aa C34:4 − 0.8185 0.0038 PC aa C36:6 − 0.6148 0.0230
lysoPC a C20:4 − 0.5669 0.0041 lysoPC a C20:3 − 0.6249 0.0245
PC aa C40:6 − 0.7801 0.0046 PC aa C34:3 − 0.5725 0.0250
PC aa C38:6 − 0.8598 0.0051 Val − 0.4825 0.0296
PC ae C38:0 − 0.5767 0.0055 SM C22:3 1.1125 0.0372
Met 0.6004 0.0063 PC aa C32:3 − 0.3489 0.0379
PC aa C36:5 − 0.8773 0.0067 PC aa C42:1 0.3616 0.0386
SM (OH) C14:1 0.5611 0.0075 SM C16:0 0.3501 0.0399
PC ae C44:6 0.6000 0.0137 PC ae C30:0 0.4426 0.0409
Spermine − 0.3971 0.0139 PC ae C42:5 0.5168 0.0424
PC aa C36:4 − 0.7436 0.0005 PC ae C44:5 0.5536 0.0473
PC aa C38:4 − 0.7106 0.0006 C18:2 0.4845 0.0477
Table 1. Serum metabolites with significant differences between patients with and without MHE. Lipids are
described with the notation “Cx:y”, where x denotes the number of carbons in the side chain and y denotes
the number of double bonds. PC phosphatidylcholine, lysoPC lysophosphatidylcholine, SM sphingomyelin.
alogFC: log2-fold-change; bp-value of t-test calculated and adjusted by FDR with the limma R package.
MHE patients. These new results corroborate previous observations where activity of Th1 and Th17 cells tends
to be more elevated in patients with MHE while Th2 cells activity tends to d ecrease3.
We also found significant alterations in the expression of chemokine receptors (CCR2 and CXCR3) and
ligands (CCL5, CXCL5, PF4 (CXCL4), PF4V1 (CXCL4V1) and XCL1) in patients with MHE, which in all cases
were down-regulated except for CCR2. Chemokine receptor regulation on T cells is a complex mechanism that
is dependent on both T cell activation and the differentiation state40. For instance, Th1 pro-inflammatory cells
preferentially express CCR5, CXCR3 and CXCR6, while the expression of CCR3, CCR4, CCR8 is associated with
Th2 anti-inflammatory c ells41–44. Chemokine receptors such as CCR2 have been proposed to play critical roles
lzheimer45,46 and Multiple S clerosis6, where it was found to be a critical modula-
in neurological diseases like A
tor of the aberrant migration of peripheral T cells towards the site of inflammation. The observed changes in
chemokine receptors expression in MHE patients reinforce the hypothesis of a readjustment of the population
of immune cell types in these patients.
Beyond immunological processes, also lipid metabolism pathways appeared to be significantly enriched in
MHE patients. Differentially expressed genes in this set of pathways were the up-regulated CD36, ABCA1 (both
transporters), PLPP3, NCEH1 (both enzymes) and the down-regulated apolipoproteins APOA1 and APOB. Indi-
cated differences pointed to an increased fatty acid digestion and absorption in immune cells of MHE patients.
A coordinated metabolic and cytokines signature is present in MHE patients. We identified 29
metabolites with significant differences between patients with and without MHE, (FDR < 0.05) (see Table 1).
Increased metabolites included methionine, 3 sphingomyelins (SMs), 5 phosphatidylcholines (PCs) and octa-
decenoylcarnitine (C18:2). Metabolites with reduced levels included 17 PCs and 2 lysophosphatidylcholines
(lysoPC), spermine, alpha-Aminoadipic (alpha-AAA) acid and valine. The most altered molecules in MHE
patients were PCs and lysoPCs, that were mainly down-regulated (negative logFC values). Previously, these
phospholipids were found to be decreased in the peripheral blood samples47 and postmortem brain samples48
of patients with Alzheimer’s disease. As for cytokines, 6 molecules (IL-15, CXCL13, CCL20, CX3CL1, IL-6 and
IL-22) were identified as having significant different levels (FDR < 0.05) in patients with or without MHE. All
molecules presented increased levels in MHE patients (see Table 2). The majority of cytokines showed the same
direction of change at mRNA and protein level in MHE patients (Supplementary Table S3).
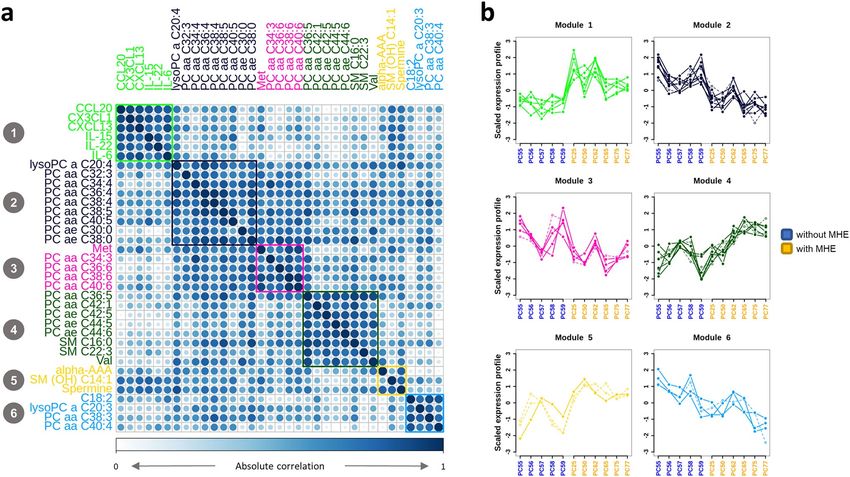
We then evaluated the co-abundance patterns of these differential serum compounds across cirrhotic patients.
Data clustered into 6 distinct groups where elements were highly correlated (Fig. 3A) and had abundance profiles
that distinguished between groups with and without MHE (Fig. 3B). Most correlation groups were composed of
chemically similar compounds, suggesting a functional significance for this co-variation pattern. For example,
one relevant cluster was composed of cytokines CCL20, CX3CL1, CXCL13, IL-15, IL-22 and IL-6 (Module 1,
green in Fig. 3, values shown in Supplementary Table S4), which have been already proposed as candidate modu-
lators of lymphocyte infiltration into the brain and may contribute to cognitive impairment in MHE3. In addition,
phospholipids almost perfectly clustered by molecular mass (total number of carbon atoms) and saturation level
(total number of double bonds) in 3 main functional modules: (a) short and softly unsaturated lipids with ≤ 40C
and ≤ 5 double bonds (purple Module); (b) short and highly unsaturated lipids with ≤ 40C and > 5 double bonds
(pink module); (c) long and softly unsaturated lipids with > 40C and ≥ 5 double bonds (dark green Module).
Scientific Reports | (2021) 11:1907 | https://doi.org/10.1038/s41598-020-80941-7 7
Vol.:(0123456789)www.nature.com/scientificreports/
IL-6 (pg/ml) IL-15 (pg/ml) IL-22 (pg/ml) CXCL13 (pg/ml) CCL20 (pg/ml) CX3CL1 (pg/ml)
Without MHE 1.15 (0.13) 4.66 (1.70) 56.04 (5.74) 109.37 (17.82) 58.37 (7.04) 603.38 (79.32)
With MHE 3.70 (5.99) 9.71 (2.35) 81.05 (58.09) 194.48 (14.89) 90.20 (10.95) 833.42 (13.75)
Table 2. Serum cytokines with significant differences between patients with and without MHE. Values are
median (IQR, Interquartile Range). Differences between patients were tested using non-parametric Wilcoxon
test and adjusted by FDR (see “Methods”).
Figure 3. Metabolic and cytokines signature present in MHE patients. (a) Absolute correlation plot and
clustering analysis of extracellular features. (b) Profiles of scaled compound levels across patients indicate
the ability to distinguish between the groups of patients with (yellow) and without (blue) MHE. Dashed lines
represent compounds with negative correlations with the average block profile, which were set to positive for
representation purposes.
Multi‑omic integration analysis highlights gene pathways related with metabolites and
cytokines altered in MHE patients. The previous analyses identified transcriptional signature in whole
blood cells and a metabolic signature in serum that is associated with MHE. We then asked whether both sig-
natures could be related by identifying gene expression signals that correlated with the extracellular compound
changes linked to cognitive impairment. To answer this question, we established Partial Least Square (PLS) mul-
tivariable regression models where differentially expressed genes were taken as explanatory variables, and each
of the 6 metabolic modules were used as joint response variables to obtain a model per module. The accuracy
and predictive ability of these models were determined by the goodness of fit ( R2) and goodness of prediction
(Q2), respectively. All 6 PLS models had high (> 0.9) R2, indicating a good explanatory value, while most models
had good (> 0.5) Q2 predictive values (Fig. 4A).
One interesting property of the PLS method is the direct interpretability of the loading values as a measure
of the relative importance of the variables in the model. To further understand the biological significance of the
models, gene set enrichment tests were run for genes ranked by their loading values at the first component, which
provided the best separation between patients with and without MHE in each of the six models (Supplementary
Fig. S2). Results were summarized in a multi-enrichment graph (Fig. 4B), where every node is a selected GO
term from the enrichment analysis of PLS loadings and the edges link them to the compound modules in which
they were found to be significant. This representation locates module-specific pathways at the periphery of the
network, while shared pathways are grouped towards the center. Overall, frequently shared pathways included
“cell adhesion”, “immune response”, “proteolysis”, “ion transport” and “adaptive immune response”, while module-
specific pathways involved distinct signaling and metabolic pathways. Details of the significant genes within each
enriched pathway are given in Supplementary Table S5.
Scientific Reports | (2021) 11:1907 | https://doi.org/10.1038/s41598-020-80941-7 8
Vol:.(1234567890)www.nature.com/scientificreports/
Figure 4. Multi-omic integration analysis and biological interpretation. (a) Results of PLS integrative models.
R2: goodness of fit. Q2: goodness of prediction. (b) Multi-enrichment network. Every node is a selected
significant GO biological process from the enrichment analysis in the PLS models. Edges denote links to the
metabolites/cytokines modules where these pathways were found to be significant. (c) Some MHE altered GO
terms at gene (rectangles) and metabolite (circles) level. Arrows indicate significant up (red) or down (blue)
regulation in patients with versus without MHE.
Scientific Reports | (2021) 11:1907 | https://doi.org/10.1038/s41598-020-80941-7 9
Vol.:(0123456789)www.nature.com/scientificreports/
Interestingly, the model for Module 1, that consisted of the previously highlighted cytokines CCL20, CX3CL1,
CXCL13, IL-15, IL-22 and IL-6, showed enrichment for 3 immune related pathways including “chemotaxis”,
“adaptive immune response” and “immune response” (Fig. 4B). At the “chemotaxis” pathway, significant altera-
tions in the expression of chemokine receptors (CCR2, CXCR3 CMKLR1) and ligands (CCL5, CXCL5, PF4
(CXCL4), PF4V1 (CXCL4V1) and MSMP) were found in patients with MHE (Fig. 4C), which in all cases were
down-regulated except for CCR2 and CMKLR1 (values shown in Supplementary Table S4). These results indi-
cate the connection between the cellular chemotactic response discussed above and the serum accumulation of
inflammatory markers.
Another interesting model was obtained for the Module 2, composed of phosphatidylcholines with ≤ 40
carbons and between 0 and 5 double bond in the fatty acid chain, that appeared correlated to genes of the “lipid
metabolic process”, “cellular response to lipopolysaccharide” and “immune response”, among other pathways
(Fig. 4B). The lipid metabolic process pathway was shared also by Module 6 (composed of similar phospholipid
in length and saturation level) and included annotated genes from different pathways. In particular, we identi-
fied the down-regulation of ACSBG1 and CERS4 (Fig. 4C). ACSBG1 catalyzes the conversion of very long-chain
fatty acids into their active form (acyl-CoA) for both biosynthesis and degradation of cellular lipids49, while
CERS4 catalyzes formation of SMs with high selectivity toward long and very-long c hains50. This result suggests
that impairment of long-chain fatty acids activation and SM production may be on-going in MHE patients.
Additionally, we found two significantly up-regulated lipid transporters within this pathway: ABCA1 (trans-
port phosphatidylcholine from cell to e nvironment51) and CD36 (internalization of long-chain fatty acids into
cells52), pointing to an increased fatty acid transport in MHE. CD36 is also a scavenger receptor that cooper-
ates with Toll-Like receptors in the internalization of oxidized phospholipid activating the inflammasome in
macrophages53. Moreover, the gene PLA2G4A was up-regulated in MHE patients its gene product selectively
hydrolyzes phosphatidylcholines in arachidonic acid that finally derives in prostaglandins, and together with its
enzymatic activity, it is also implicated in the initiation of the inflammatory r esponse54.
Discussion
This work identified immune system pathways potentially involved in the induction of MHE by integrating
multiple molecular assays from human blood samples. Transcriptomic analysis suggested new altered immune
subtypes in MHE patients like up-regulated B-cells and down-regulated cytotoxic CD8 T (Tc) cells. It has been
proposed that the appearance of MHE is associated to a shift in peripheral inflammation to an autoimmune-like
profile3. The up-regulation of B cells may contribute to potentiate this shift. It has been reported that B cells can
contribute to autoimmune diseases through different functions such as secretion of autoantibodies, presentation
of autoantigen, secretion of inflammatory cytokines, modulation of antigen processing and presentation or gen-
eration of ectopic germinal centers55. The up-regulation of B cells in MHE may induce some of these functions
and contribute to triggering the appearance of MHE.
CD8+ T cell deficiency and an increased CD4/CD8 ratio are features of many human chronic autoimmune
diseases56. It is also an early and persistent feature of patients with multiple sclerosis. Deficiency of CD8+ T cells
is present at the onset of multiple sclerosis and persists throughout the clinical c ourse57. The reduced total CD8+
T cells in the blood of these patients has been attributed to sequestration of CD8+ T cells in the brain58. It is
therefore likely that an early down-regulation of CD8+ T cells could also contribute to trigger the autoimmune
shift in peripheral inflammation of MHE patients and to promote infiltration of T cells into the brain.
The results reported here also confirmed the inflammatory signature previously detected in MHE individuals
and suggested cytokine signaling pathways as putative mechanisms for the decrease of Th2 and the increase of
Th1 and Th17 cells in MHE patients. In a previous study, using isolated CD4+ lymphocytes in culture, we identi-
fied in the medium higher levels of IL-17, IL-21, IL-22 and TNFα(3), which are a signature of factors released by
for Th17 and Th22 cells. This supports increased activation of these Th-cell subtypes and further validates the
results of our analysis approach. Th17 cells are one of the major pathogenic Th cell populations underlying the
development of many autoimmune diseases, including multiple sclerosis, rheumatoid arthritis or p soriasis59.
The increase in Th17 would also contribute to promote an autoimmune profile in patients with MHE. This shift
to autoimmune-like inflammation in turn would trigger mild cognitive impairment.
We have also identified other yet unexplored biological processes such as lipid metabolism to play important
roles in the pathogenesis of MHE. The PLS analysis also revealed that long-chain unsaturated phosphatidylcho-
lines, increased fatty acid transport and prostaglandin production are strongly linked in MHE patients, suggesting
a possible pathway for the dysregulation of structural phospholipids during this mild cognitive decline. Altered
lipid metabolism in immune system cells has also been found in other diseases associated to cognitive impairment
such as Alzheimer’s d isease60 and Mild Cognitive I mpairment61. Notably, the relationship between phospholip-
ids and peripheral inflammation has been extensively reported in the context of autoimmune d iseases62,63. For
instance, metabolomic measures using the same technological platform used here, identified a panel of lipids
that predict mild cognitive impairment or Alzheimer’s d isease64 and three of them, PC aa C36:6, PC aa C38:6,
PC aa C40:6, were also significantly down-regulated in MHE patients. Another lipidomic screen in Alzheimer’s
disease47 identified 3 phosphatidylcholine molecules that were significantly diminished in cases. The authors
hypothesized that altered phospholipase (PLA2) activity could lead to an increased metabolism of the PCs, and
thereby a subsequent decrease in plasma levels. This is part of the Lands cycle for synthesis and degradation of
PCs, where plasma PCs are synthesized in the liver and secreted as components of lipoprotein particles. PCs are
hydrolyzed by PLA2 producing lysoPC, which is rapidly cleared from circulation by transporters to the liver for
the synthesis of PC, closing the c ycle65. In agreement, our study shows an increase of PLA2G4A in the immune
system cells of MHE patients which may contribute to the decrease of PCs. It is relevant to note that a differential
Scientific Reports | (2021) 11:1907 | https://doi.org/10.1038/s41598-020-80941-7 10
Vol:.(1234567890)www.nature.com/scientificreports/
phospholipid pattern is detected in peripheral blood of patients having or not cognitive decline in MHE as well
as in Alzheimer’s d isease47 and Parkinson66.
During inflammation or under conditions of oxidative stress, the polyunsaturated fatty acid side chains of
phospholipids in lipoproteins or cellular membranes can be oxidatively modified, generating structurally diverse
oxidized phospholipid (OxPL) species and reactive aldehydes [e.g. malondialdehyde (MDA), hydroxynonenal
(HNE)]67, each of which may exert both pro-inflammatory and anti-inflammatory effects. We showed in previous
studies that patients with MHE had increased oxidative stress in blood compared with cirrhotic patients without
MHE. Furthermore, MDA, an indicator of oxidative damage to lipids, was also increased in patients with MHE
and correlated with psychometric tests68. Altered lipid metabolism is here described for the first time in the
context of mild cognitive impairment in MHE. The mechanisms by which these changes in lipids contribute to
MHE could be similar to those involved in mild cognitive i mpairment64 and Alzheimer’s d isease69.
Another relevant contribution of this study is the identification of specific sets of serum metabolites and
cytokines. The majority of cytokines showed the same direction of change at mRNA and protein level in MHE
patients (Supplementary Table S3). Since cytokine proteins were measured in plasma while mRNA was obtained
from blood cells, a perfect correlation between both levels was not expected. Firstly, mRNA for cytokines are
subjected to post-transcriptional regulation by RNA binding proteins70,71 or microRNAs72. In addition, plasma
cytokines can derive from sources other than blood cells. For instance, IL-15, CX3CL1, IL-17 and TNFα can come
from the liver73–75. Peripheral lymphocyte subtypes Th17 and Th22 may infiltrate into the liver with subsequent
IL-17 and TNFα production, which may contribute to the up-regulation at plasma level of these cytokines in
MHE patients75.
Our findings that MHE-regulated immune response processes relate to changes in specific serum molecules
point to a chemotactic function or structural patterns of lipids as mediators of MHE induction. Integrative
modelling suggests a link between certain cytokines and the alteration of chemotactic receptors and ligands
in MHE. This reveals a link between the production and reception of inflammatory signals operating in these
patients which may contribute to infiltration of peripheral blood cells into the brain and triggering of MHE.
The model for Module 1, consisting of the cytokines CCL20, CX3CL1, CXCL13, IL-15, IL-22 and IL-6, showed
enrichment for 3 immune related pathways including “chemotaxis”, “adaptive immune response” and “immune
response”, indicating the connection between the cellular immune response and the serum accumulation of
inflammatory markers. Further inspection of the “chemotaxis” GO term revealed that this extracellular module
of cytokines was related with the chemokine receptors and ligands (CCR2, CXCR3, CCL5, CXCL5, PF4 and
PF4V1). Many of these chemokine receptors are altered in multiple sclerosis patients, who show high levels of
CCR2, CCR5, C XCR376. Similarly, mouse models of inflammatory liver injury showed increased numbers of
circulating CCR2-expressing monocytes that are attracted to the brain by activated m icroglia77, while in vitro
models of transmigration revealed that T cells from multiple sclerosis patients exhibit an increased attraction to
CCL3 and CCL578. Moreover, the ligand MSMP acts as ligand for CCR2 and exhibits a chemotactic activity for
monocytes and lymphocytes79 while the receptor CMKLR1 plays a key role in directing plasmacytoid dendritic
cell trafficking80. In a similar way, these results suggest an important role of chemokines in MHE patients related
to trafficking of peripheral blood cells into the brain already shown in M HE4.
In summary, this work identified immune system pathways potentially involved in the induction of MHE
by integrative multi-omic analysis of multiple molecular parameters from human blood samples. We detected
biological pathways that corroborate the observed decrease of Th2 and the increase of Th1 and Th17 in MHE
patients, while other pathways suggested B-cell up-regulation and CD8 T cells down-regulation. Lipid metabo-
lism is identified for the first time as related with mild cognitive impairment in MHE. Secondly, specific sets of
serum metabolites and cytokines were identified that point to chemotactic function or structural patterns of
lipids as mediators of MHE induction. Finally, integrative modelling suggests a link between cytokines CCL20,
CX3CL1, CXCL13, IL-15, IL-22 and IL-6 and the alteration of chemotactic receptors (CCR2, CXCR3, CMKLR1)
and ligands (CCL5, CXCL5, PF4, PF4V1 and MSMP) in MHE. Our integrated model is able to link the extracel-
lular information (metabolites/cytokines) with the gene expression in blood human samples of MHE patients.
These results provide the basis for further studies on the mechanisms by which changes in peripheral inflam-
mation trigger mild cognitive impairment in patients with liver cirrhosis and MHE. Our results also illustrate
the power of the integrative statistical analysis of multi-omics in modelling disease processes and connecting
phenotypic changes across molecular layers. For diseases where multiple underlying mechanisms are involved
in pathogenesis like MHE81, multi-component analysis increases the chances of detecting relevant molecular
signals that can be combined for diagnosis. Our pilot study (n = 11) suggests that indeed alterations in MHE
patients occur in different types of biomolecules, which are functionally connected and have the potential to
serve as biomarkers for the disease. However, future work is required to validate these results with a larger cohort
and establish the utility of these molecular mechanisms as biomarkers of MHE.
Data availability
The transcriptomic dataset supporting the conclusions of this article is available in the GEO database repository,
GSE149741, https://www.ncbi.nlm.nih.gov/geo/query/acc.cgi?acc=GSE149741. The rest of datasets supporting
the conclusions of this article are included within the article (Supplementary Tables S6 and S7).
Received: 8 September 2020; Accepted: 23 December 2020
References
1. Felipo, V. Hepatic encephalopathy: Effects of liver failure on brain function. Nat. Rev. Neurosci. 14, 851–858 (2013).
Scientific Reports | (2021) 11:1907 | https://doi.org/10.1038/s41598-020-80941-7 11
Vol.:(0123456789)www.nature.com/scientificreports/
2. Felipo, V. et al. Contribution of hyperammonemia and inflammatory factors to cognitive impairment in minimal hepatic encepha-
lopathy. Metab. Brain Dis. 27, 51–58 (2012).
3. Mangas-Losada, A. et al. Minimal hepatic encephalopathy is associated with expansion and activation of CD4+CD28−, Th22 and
Tfh and B lymphocytes. Sci. Rep. 7, 6683 (2017).
4. Balzano, T. et al. The cerebellum of patients with steatohepatitis shows lymphocyte infiltration, microglial activation and loss of
purkinje and granular neurons. Sci. Rep. 8, 3004 (2018).
5. Cabrera-Pastor, A. et al. Peripheral inflammation induces neuroinflammation that alters neurotransmission and cognitive and
motor function in hepatic encephalopathy: Underlying mechanisms and therapeutic implications. Acta Physiol. (Oxf.) 226, e13270
(2019).
6. Fantuzzi, L., Tagliamonte, M., Gauzzi, M. C. & Lopalco, L. Dual CCR5/CCR2 targeting: Opportunities for the cure of complex
disorders. Cell Mol. Life Sci. 76, 4869–4886 (2019).
7. Hu, L. et al. Potential circulating biomarkers of circulating chemokines CCL5, MIP-1β and HA as for early detection of cirrhosis
related to chronic HBV (hepatitis B virus) infection. BMC Infect. Dis. 19, 523 (2019).
8. Stuart, M. J. & Baune, B. T. Chemokines and chemokine receptors in mood disorders, schizophrenia, and cognitive impairment:
A systematic review of biomarker studies. Neurosci. Biobehav. Rev. 42, 93–115 (2014).
9. Gomez-Cabrero, D. et al. STATegra, a comprehensive multi-omics dataset of B-cell differentiation in mouse. Sci. Data 6, 256 (2019).
10. Yu, X., Lai, S., Chen, H. & Chen, M. Protein–protein interaction network with machine learning models and multi-omics data
reveals potential neurodegenerative disease-related proteins. Hum. Mol. Genet. https://doi.org/10.1093/hmg/ddaa065 (2020).
11. Mens, M. M. J. et al. Multi-omics analysis reveals microRNAs associated with cardiometabolic traits. Front. Genet. 11, 110 (2020).
12. Li, H.-J. et al. Further confirmation of netrin 1 receptor (DCC) as a depression risk gene via integrations of multi-omics data.
Transl. Psychiatry 10, 98 (2020).
13. Martín-Jiménez, C. A., Salazar-Barreto, D., Barreto, G. E. & González, J. Genome-scale reconstruction of the human astrocyte
metabolic network. Front. Aging Neurosci. 9, 23 (2017).
14. Sertbas, M. & Ulgen, K. O. Unlocking human brain metabolism by genome-scale and multiomics metabolic models: Relevance
for neurology research, health, and disease. OMICS 22, 455–467 (2018).
15. Sertbaş, M., Ulgen, K. & Cakır, T. Systematic analysis of transcription-level effects of neurodegenerative diseases on human brain
metabolism by a newly reconstructed brain-specific metabolic network. FEBS Open Bio 4, 542–553 (2014).
16. De Rui, M., Montagnese, S. & Amodio, P. Recent developments in the diagnosis and treatment of covert/minimal hepatic encepha-
lopathy. Expert. Rev. Gastroenterol. Hepatol. 10, 443–450 (2016).
17. Ferenci, P. et al. Hepatic encephalopathy–definition, nomenclature, diagnosis, and quantification: Final report of the working party
at the 11th World Congresses of Gastroenterology, Vienna, 1998. Hepatology 35, 716–721 (2002).
18. Huber, W., von Heydebreck, A., Sültmann, H., Poustka, A. & Vingron, M. Variance stabilization applied to microarray data calibra-
tion and to the quantification of differential expression. Bioinformatics 18(Suppl 1), S96-104 (2002).
19. Ritchie, M. E. et al. limma powers differential expression analyses for RNA-sequencing and microarray studies. Nucleic Acids Res.
43, e47 (2015).
20. Hernández-de-Diego, R. et al. PaintOmics 3: A web resource for the pathway analysis and visualization of multi-omics data. Nucleic
Acids Res. 46, W503–W509 (2018).
21. Kanehisa, M. & Goto, S. KEGG: Kyoto encyclopedia of genes and genomes. Nucleic Acids Res. 28, 27–30 (2000).
22. Ferrario, M. et al. Mortality prediction in patients with severe septic shock: A pilot study using a target metabolomics approach.
Sci. Rep. 6, 20391 (2016).
23. Paapstel, K. et al. Metabolomic profiles of lipid metabolism, arterial stiffness and hemodynamics in male coronary artery disease
patients. IJC Metab. Endocr. 11, 13–18 (2016).
24. Purohit, P. V., Rocke, D. M., Viant, M. R. & Woodruff, D. L. Discrimination models using variance-stabilizing transformation of
metabolomic NMR data. OMICS J. Integr. Biol. 8, 118–130 (2004).
25. Ibarra, R. et al. Metabolomic analysis of liver tissue from the VX2 rabbit model of secondary liver tumors. HPB Surg. 2014, 1–12
(2014).
26. Li, B. et al. Performance evaluation and online realization of data-driven normalization methods used in LC/MS based untargeted
metabolomics analysis. Sci. Rep. 6, 38881 (2016).
27. Ladva, C. N. et al. Particulate metal exposures induce plasma metabolome changes in a commuter panel study. PLoS ONE 13,
e0203468 (2018).
28. Shin, H., Medriano, C. A., Park, B., Park, Y. H. & Lee, K. Y. Screening and identification of neuroprotective compounds from
Scrophularia buergeriana using cell extraction coupled with LC–MS. J. Pharm. Biomed. Anal. 148, 355–360 (2018).
29. Tarazona, S. et al. Harmonization of quality metrics and power calculation in multi-omic studies. Nat. Commun. 11, 3092 (2020).
30. Reynolds, A. P., Richards, G., de la Iglesia, B. & Rayward-Smith, V. J. Clustering rules: A comparison of partitioning and hierarchi-
cal clustering algorithms. J. Math. Model Algor. 5, 475–504 (2006).
31. Rousseeuw, P. J. Silhouettes: A graphical aid to the interpretation and validation of cluster analysis. J. Comput. Appl. Math. 20,
53–65 (1987).
32. Wold, S., Sjöström, M. & Eriksson, L. PLS-regression: A basic tool of chemometrics. Chemometr. Intell. Lab. Syst. 58, 109–130
(2001).
33. Montaner, D. & Dopazo, J. Multidimensional gene set analysis of genomic data. PLoS ONE 5, e10348 (2010).
34. Ashburner, M. et al. Gene ontology: Tool for the unification of biology. Nat. Genet. 25, 25–29 (2000).
35. Seif, F. et al. The role of JAK-STAT signaling pathway and its regulators in the fate of T helper cells. Cell Commun. Signal 15, 23
(2017).
36. Glennie, M. J., French, R. R., Cragg, M. S. & Taylor, R. P. Mechanisms of killing by anti-CD20 monoclonal antibodies. Mol. Immunol.
44, 3823–3837 (2007).
37. Morsy, D. E. D. et al. Reduced T-dependent humoral immunity in CD20-deficient mice. J. Immunol. 191, 3112–3118 (2013).
38. McCusker, D., Wilson, M. & Trowsdale, J. Organization of the genes encoding the human proteasome activators PA28alpha and
beta. Immunogenetics 49, 438–445 (1999).
39. Steinman, L. A brief history of T(H)17, the first major revision in the T(H)1/T(H)2 hypothesis of T cell-mediated tissue damage.
Nat. Med. 13, 139–145 (2007).
40. Langenkamp, A. et al. Kinetics and expression patterns of chemokine receptors in human CD4+ T lymphocytes primed by myeloid
or plasmacytoid dendritic cells. Eur. J. Immunol. 33, 474–482 (2003).
41. Watanabe, S., Yamada, Y. & Murakami, H. Expression of Th1/Th2 cell-related chemokine receptors on CD4+ lymphocytes under
physiological conditions. Int. J. Lab. Hematol. https://doi.org/10.1111/ijlh.13141 (2019).
42. Kim, C. H. et al. Bonzo/CXCR6 expression defines type 1-polarized T-cell subsets with extralymphoid tissue homing potential. J.
Clin. Investig. 107, 595–601 (2001).
43. Sallusto, F., Lenig, D., Mackay, C. R. & Lanzavecchia, A. Flexible programs of chemokine receptor expression on human polarized
T helper 1 and 2 lymphocytes. J. Exp. Med. 187, 875–883 (1998).
44. Zingoni, A. et al. The chemokine receptor CCR8 is preferentially expressed in Th2 but not Th1 cells. J. Immunol. 161, 547–551
(1998).
Scientific Reports | (2021) 11:1907 | https://doi.org/10.1038/s41598-020-80941-7 12
Vol:.(1234567890)You can also read