Co-Administration of Iron and a Bioavailable Curcumin Supplement Increases Serum BDNF Levels in Healthy Adults - MDPI
←
→
Page content transcription
If your browser does not render page correctly, please read the page content below
antioxidants
Article
Co-Administration of Iron and a Bioavailable
Curcumin Supplement Increases Serum BDNF Levels
in Healthy Adults
Helena Tiekou Lorinczova 1,† , Owen Fitzsimons 1,† , Leah Mursaleen 1,2 , Derek Renshaw 3 ,
Gulshanara Begum 1 and Mohammed Gulrez Zariwala 1, *
 1    School of Life Sciences, University of Westminster, 115 New Cavendish Street, London W1W 6UW, UK;
      H.Lorinczova@westminster.ac.uk (H.T.L.); O.Fitzsimons@westminster.ac.uk (O.F.);
      w1655446@my.westminster.ac.uk (L.M.); begumru@westminster.ac.uk (G.B.)
 2    The Cure Parkinson’s Trust, 120 New Cavendish St, Fitzrovia, London W1W 6XX, UK
 3    Centre for Sport, Exercise and Life Sciences, Faculty of Health and Life Sciences, Coventry University,
      Priory St, Coventry CV1 5FB, UK; derek.renshaw@coventry.ac.uk
 *    Correspondence: zariwam@wmin.ac.uk; Tel.: +44-20-7911-5000 (ext. 65086)
 †    These authors contributed equally to this work.

 Received: 19 June 2020; Accepted: 16 July 2020; Published: 22 July 2020

 Abstract: Brain-derived neurotrophic factor (BDNF) is key for the maintenance of normal neuronal
 function and energy homeostasis and has been suggested to improve cognitive function, including
 learning and memory. Iron and the antioxidant curcumin have been shown to influence BDNF
 homeostasis. This 6-week, double blind, randomized, placebo-controlled study examined the effects
 of oral iron supplementation at low (18 mg) and high (65 mg) ferrous (FS) iron dosages, compared to
 a combination of these iron doses with a bioavailable formulated form of curcumin (HydroCurcTM ;
 500 mg) on BDNF levels in a healthy adult cohort of 155 male (26.42 years ± 0.55) and female
 (25.82 years ± 0.54) participants. Participants were randomly allocated to five different treatment
 groups: both iron and curcumin placebo (FS0+Plac), low dose iron and curcumin placebo (FS18+Plac),
 low dose iron and curcumin (FS18+Curc), high dose iron and curcumin placebo (FS65+Plac) and
 high dose iron and curcumin (FS65+Curc). Results showed a significant increase in BDNF over
 time (26%) in the FS18+Curc group (p = 0.024), and at end-point between FS18+Curc and FS18+Plac
 groups (35%, p = 0.042), demonstrating for the first time that the combination with curcumin, rather
 than iron supplementation alone, results in increased serum BDNF. The addition of curcumin to iron
 supplementation may therefore provide a novel approach to further enhance the benefits associated
 with increased BDNF levels.

 Keywords: BDNF (brain-derived neurotrophic factor); curcumin; iron; ferrous sulphate;
 supplementation; brain function; antioxidant capability

1. Introduction
     Iron is a critical micronutrient vital for oxygen transport and energy production via cellular
respiration [1] as well as for the development and maintenance of normal neuronal function [2].
Assuming a mixed human diet, dietary iron intake ranges from 12 to 18 mg/day, of which 1–2 mg is
absorbed into the circulation via the duodenum and proximal jejunum [3,4]. Iron intake often does not
meet the body’s requirements due to inadequate nutrient intake and poor bioavailability on account of
the complexities of iron absorption (such as the influence of dietary iron inhibitors and enhancers),
thus leading to widespread iron deficiency [5–7]. This is a worldwide public health issue as iron

Antioxidants 2020, 9, 645; doi:10.3390/antiox9080645                           www.mdpi.com/journal/antioxidants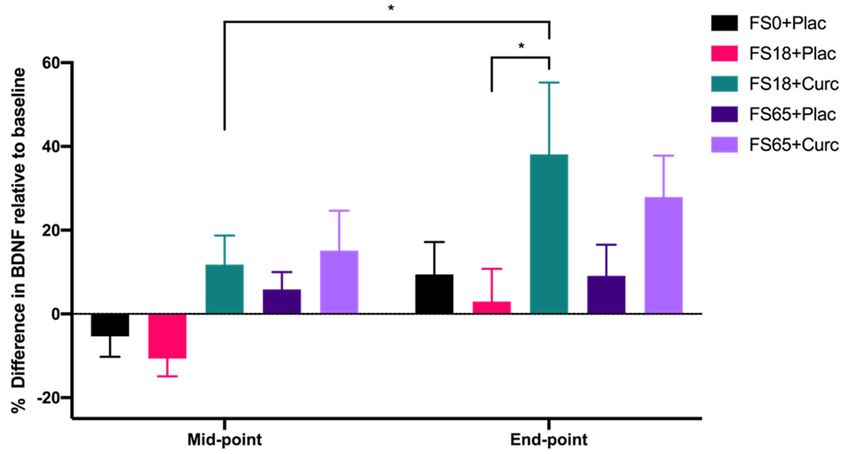
Antioxidants 2020, 9, 645                                                                            2 of 16

deficiency has been attributed to more than 60% of anaemia cases, a condition estimated to affect
around two billion people globally [8–11].
      Iron deficiency can lead to impaired cognitive and physical development in children, compromise
physical and cognitive performance in adults [12–15] and has been linked with fatigue [16], impaired
quality of life [17] and reduced mood [14,15]. In addition to being a critical component of
haemoglobin [1], iron also has a key role in electron transport during cellular respiration [18],
deoxyribonucleic acid (DNA) synthesis [19] and is an important cofactor in the synthesis of
neurotransmitters such as serotonin and norepinephrine [20].
      Hippocampal brain-derived neurotrophic factor (BDNF) is a neurotrophic growth factor,
which is suggested to be essential for normal neuronal development and cognitive function [21].
BDNF expression is associated with neurotransmitter levels and its synthesis is activated by neuronal
activity and by increased cytoplasmic calcium levels via the activation of the transcription factor cyclic
adenosine monophosphate (cAMP) responsive element binding protein (CREB) [22,23]. As well as
being essential for maintaining the normal function of mature neurons, BDNF also regulates dendrite
growth, spinal development and aids long term synaptic potentiation during neuronal development,
which is associated with learning and memory formation [21]. BDNF exhibits neuroprotective effects
via its role in the modulation of synaptic plasticity and function [24] and has been found to enhance
explicit memory encoding, storage and retrieval of information in the hippocampal region of the
brain [25]. In addition to its role in cognitive function, BDNF is thought to be a major contributor to
energy homeostasis [26]. Therefore, it is thought that increased levels of BDNF could enhance cognitive
capacity and potentially lead to reduced fatigue [24]. It has been shown that radiolabelled BDNF
rapidly crosses the blood-brain barrier (BBB) and the efflux of unmodified BDNF to the circulation
following intracerebroventricular injection has also been demonstrated in mice [27]. Further animal
studies have also demonstrated the influx of BDNF from the circulation to the brain and vice versa
and suggested that this may occur via a saturable transport mechanism [28,29]. Furthermore, positive
correlations and parallel changes between peripheral and central BDNF levels have been shown in
animal studies, indicating that circulatory BDNF measured in plasma or serum can be used as a
biomarker for central BDNF levels [29–31].
      Although the mechanistic pathways of iron and BDNF interaction are not yet fully elucidated,
optimal iron levels are thought to be essential for BDNF homeostasis [32]. It has been suggested
that when brain iron levels are low, BDNF may be down regulated as a consequence of altered
neurotransmitter levels [33]. However, excessive cerebral iron levels can also reduce BDNF expression
and are associated with cognitive and mental impairments [34–36]. This is claimed to be a consequence
of the brain’s altered redox state, as high iron levels facilitate the production of detrimental reactive
oxygen species (ROS) [36,37], and the brain lacks efficient levels of antioxidant defences to counteract
them [35,36]. The accumulation of ROS results in oxidative stress, damage to DNA, proteins and lipids,
which can result in cell death [38,39]. Antioxidants can counteract the effects of ROS and have therefore
generated interest as molecules that could potentially enhance BDNF levels [40,41].
      Curcumin, a non-flavonoid polyphenol, is the most biologically active antioxidant component
in the rhizomatous spice Curcuma longa Linnaeus (L.) or turmeric [42]. Curcumin is a pleiotropic
compound with wide ranging beneficial properties including antioxidative, anti-inflammatory and
neuroprotective effects [43,44]. Curcumin and its analogue curcuminoids, demethoxycurcumin (DMC)
and bisdemethoxycurcumin (BDMC), can exist in two different forms depending on their environment;
keto and enol [45]. In their enol form, they are capable of accepting as well as donating hydrogen
and have metal chelation characteristics [46]. Curcumin is extensively studied for its ROS scavenging
properties [47–50]. It acts as a free-radical chain breaker, capable of donating hydrogen to ROS due to the
presence of a hydroxyl group in its structure [51]. Furthermore, studies examining the neuroprotective
properties of curcumin have shown that it has potential as a treatment for neurological disorders,
such as depression, bipolar disorders and neurodegenerative diseases [44,52]. Since curcumin is
lipophilic in nature, it is assumed to be able to cross the BBB [53]. However, it is debated whether it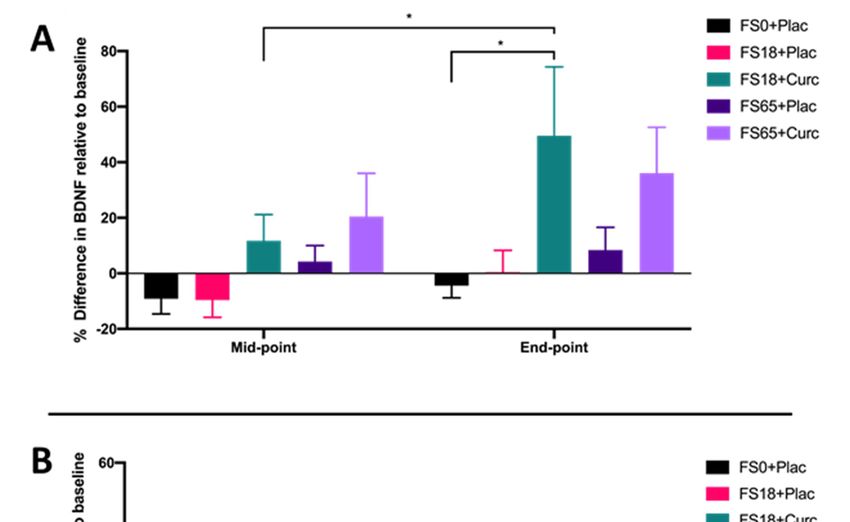
Antioxidants 2020, 9, 645 3 of 16
can access the brain at therapeutic concentrations as it is rapidly metabolised following ingestion [54].
The pharmacological use of curcumin has therefore been limited due to its poor bioavailability, limited
bio-distribution, poor stability and short half-life [55]. Formulation science strategies have shown
that nanocarrier delivery systems such as liposomes and micelles may address these limitations and
enhance curcumin’s therapeutic potential [44,56,57]. A recent study by Briskey and colleagues [58]
demonstrated that formulation of curcumin using a novel delivery system comprising a mixture
of surfactants, polar lipids and solvents (known as LipiSperse® ) significantly increases the plasma
concentration of curcumin in human volunteers, further highlighting the application of delivery
systems to increase the bioavailability of poorly absorbed molecules.
As iron and curcumin have both been independently associated with BDNF homeostasis in animal
and cellular models [33–36,52], there is scope to further investigate their co-administration. The aim
of this 6-week, double blind, randomized, placebo-controlled study was to examine the effects of
oral iron supplementation at low (18 mg) versus high (65 mg) ferrous iron dosages, either alone or
co-administered with curcumin (500 mg) supplementation on serum BDNF levels in healthy adults.
The study was designed to determine whether co-administration of ferrous sulphate and a bioavailable
formulated curcumin supplement (commercially available as HydroCurc™) would amplify serum
levels of BDNF.
2. Materials and Methods
2.1. Study Design
The present double blind, placebo-controlled, randomized study recruited 155 healthy participants
(79 males and 76 females) for a study duration of 6 weeks. Sample size was calculated using G*Power
statistical analysis software [59,60] to achieve 80% power.
Study participants were randomly allocated to one of five different treatment groups using the
online service by Study Randomizer [61], via a permuted block and gender-balanced randomisation
algorithm with 31 participants in each group. The 5 different treatment groups were ferrous sulphate
and curcumin placebos (FS0+Plac), low ferrous sulphate (18 mg elemental iron) and curcumin
placebo (FS18+Plac), low ferrous sulphate (18 mg elemental iron) and 500 mg curcumin (FS18+Curc),
high ferrous sulphate (65 mg elemental iron) and curcumin placebo (FS65+Plac) and high ferrous
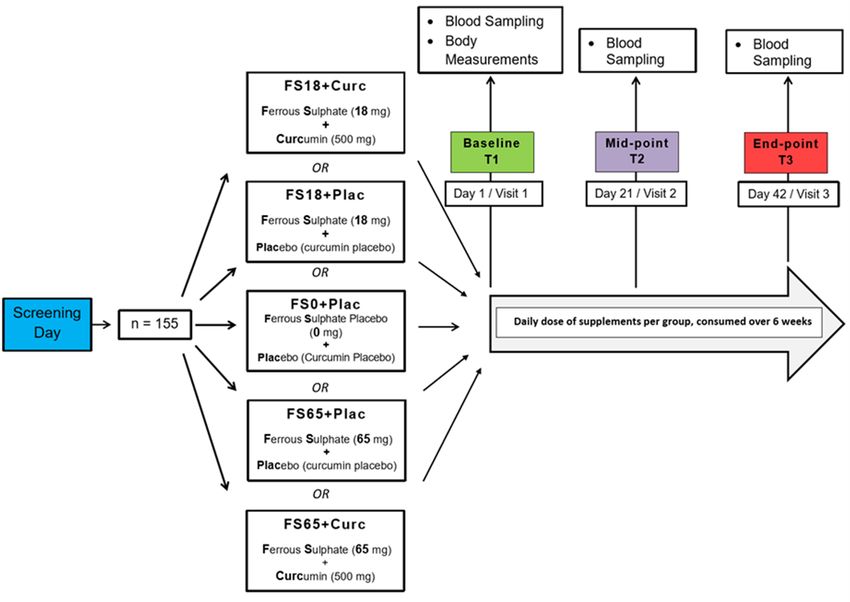
sulphate (65 mg elemental iron) and 500 mg curcumin (FS65+Curc) (Figure 1).
Healthy adults aged between 18 and 40 years with ferritin levels in the normal physiological range
were recruited into the study. Normal ferritin was defined as 15–300 µg/L for men and 15–200 µg/L for
women, according to United Kingdom (UK) guidelines [62,63]. Any participants with haemoglobin
values below the World Health Organization (WHO) cut-off for anaemia [64] were not enrolled in the
study (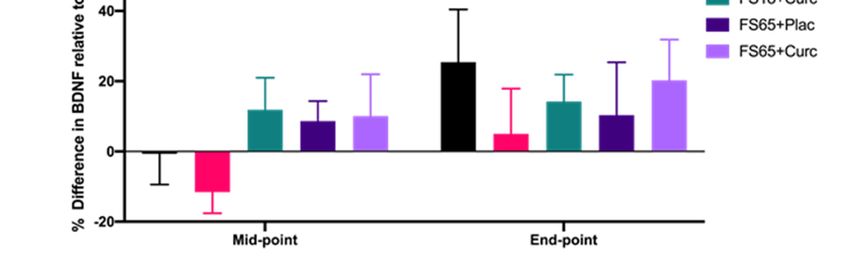
online service by Study Randomizer [61], via a permuted block and gender-balanced randomisation
algorithm with 31 participants in each group. The 5 different treatment groups were ferrous sulphate
and curcumin placebos (FS0+Plac), low ferrous sulphate (18 mg elemental iron) and curcumin
placebo (FS18+Plac), low ferrous sulphate (18 mg elemental iron) and 500 mg curcumin (FS18+Curc),
high ferrous
Antioxidants 2020,sulphate
                   9, 645  (65 mg elemental iron) and curcumin placebo (FS65+Plac) and high ferrous
                                                                                               4 of 16
sulphate (65 mg elemental iron) and 500 mg curcumin (FS65+Curc) (Figure 1).

     Figure  1. Study
     Figure 1.  Study design.   Participants who
                      design. Participants   who metmet the
                                                         the inclusion
                                                             inclusion criteria
                                                                         criteria during
                                                                                  during the
                                                                                         the screening
                                                                                             screening day
                                                                                                         day were
                                                                                                             were
     randomly            to  5 different treatment   groups   (n =
     randomly assigned to 5 different treatment groups (n = 31/group). There were three visit days over
                assigned                                           31/group).   There  were three visit days over
     the
     the study
         study duration
                duration of
                         of 66 weeks.
                               weeks. On
                                       On the
                                           the first
                                               first visit
                                                     visit day,
                                                           day,(Baseline)
                                                                 (Baseline) body
                                                                             body measurements,
                                                                                   measurements, blood
                                                                                                   blood samples
                                                                                                          samples
     and questionnaires were collected from the participants. On the following visit days, (Mid-point and
     End-point) blood samples and questionnaires were collected from the participants.

2.2. Supplementation
      As per Figure 1, participants were provided two different doses (high and low) of ferrous
sulphate supplement, co-administered with a dose of curcumin or equivalent placebo(s) (depending
on supplement group allocation). The high dose ferrous sulphate supplementation (200 mg/day, 65 mg
elemental iron) is based upon the traditional first line oral iron therapy for treatment and prophylaxis
of iron deficiency and iron deficiency anaemia [72,73]. The low dose ferrous sulphate supplementation
(55 mg/day with 18 mg elemental iron) is based upon the recommended Daily Value (DV) of iron as per
the Food and Drug Administration (FDA) [74]. Curcumin supplements were in the form of 500 mg/day
of formulated curcumin (HydroCurc™, Pharmako Biotechnologies Pty Ltd. New South Wales,
Australia). This formulation consisted of 85% total curcuminoids (80% curcumin, 17% DMC and
3% BDMC) entrapped in a proprietary delivery system (LipiSperse® , Pharmako Biotechnologies Pty
Ltd. New South Wales, Australia) that has previously been shown to have enhanced bioavailability
and deliver a higher therapeutic curcumin dose [58]. Microcrystalline cellulose served as a placebo
as well as the bulking agent in the capsules of active ingredients. White-opaque hydroxypropyl
methylcellulose (HPMC) capsules were used, with sizes of #1 and #00, for the ferrous sulphate and
curcumin supplements, respectively. The supplements were presented in white, screw lid bottles,
labelled with the related group codes. The participants were required to take one ferrous sulphate
and one curcumin supplement per day with water, at least 2 h after or 1 h before food consumption;
at separate times.

2.3. Physical Examination
    Baseline anthropometric measurements were collected by trained research staff. Height was
measured using a Seca 287 ultrasonic stadiometer (Seca GmbH & Co. KG, Hamburg, Germany).
Weight and body mass index (BMI), were measured using the Seca 515 medical Body Composition
Analyser (Seca GmbH & Co. KG, Hamburg, Germany). Blood pressure (BP) was measured using an
Omron M6 BP monitor (Omron, Hoofddorp, The Netherlands).
Antioxidants 2020, 9, 645 5 of 16
2.4. Blood Collection
Participants attended blood collection appointments following an overnight fast (12 h fast). Venous
blood samples were collected at baseline, mid-point (21 day) and end-point (42 day) visits from the
antecubital fossa by venepuncture (using a 21G needle). Approximately 10 mL of blood was collected
from each participant per procedure using Becton Dickinson (BD) Vacutainer ® serum-separating tubes
(SST) (BD, Oxford, UK). Blood in the SST was left to coagulate at room temperature for 45 min and then
centrifuged (Hettich 340r, Hettich GmbH & Co. KG, Tuttlingen, Germany) for 10 min at 3857 g. Serum
supernatant was aliquoted into 1.5 mL microcentrifuge tubes post-centrifugation and stored at −80 ◦ C.
2.5. Ferritin Assay
Serum ferritin samples were analysed using a Horiba ABX Pentra 400 (Horiba Ltd., Kyoto, Japan)
multiparametric medical bench top chemistry analyser, compliant with the National Committee for
Clinical Laboratory Standards (NCCLS) [75]. Ferritin values were determined by latex-enhanced
immunoturbidimetric assay, in accordance with the manufacturer’s protocol and as previously
described by Simó et al. [76].
2.6. BDNF Assay
Serum was assayed for BDNF levels using the Biosensis Mature BDNF RapidTM enzyme-linked
immunosorbent assay (ELISA) Kit (ATI Atlas, Chichester, UK) following the manufacturer’s protocol,
using a dilution factor of 1:100. Pre-coated microplates were incubated with 100 µL of diluted BDNF
standards, quality control (QC) samples, serum samples (1:100) or blanks (sample diluent only) for
45 min on a plate shaker (140 rpm), at room temperature (RT). Plates were then washed five times with
wash buffer (200 µL per well). After the addition of 100 µL detection antibody per well, the plates were
incubated on the plate shaker (140 rpm at RT) for 30 min. Following five more washes, 100 µL of 1×
streptavidin-HRP conjugate was added to each well. The plates were incubated for a further 30 min at
140 rpm (RT). The plates were then washed 5 times and 100 µL of 3,30 ,5,50 -Tetramethylbenzidine (TMB)
was added to each well and incubated at RT for 9 min in the dark before the addition of 100 µL of
stop solution into each well. The absorbance was read with a SPECTROstar® Nano microplate reader
(BMG Labtech GmbH, Ortenberg, Germany) at 450 nm (within 5 min).
2.7. Study Compliance
Compliance with the study protocol (including supplementation) and adverse effects were checked
during the mid-point (week 3) and at the end-point (week 6) of each study period and any deviation
from the study protocol was noted and assessed. Adherence to daily supplementation of the active or
placebo capsules was ≥80% at all times. Data from all participants who successfully completed the
study period was utilised for further analysis.
2.8. Statistical Analysis
Values are expressed as mean ± Standard Error of Mean (SEM). The BDNF assay results were
statistically analysed using a two-way, repeated measures analysis of variance (ANOVA) or mixed
effects model (where missing values were present). Post-hoc tests (Sidak’s and Tukey’s) were carried
out to assess differences between and within treatment groups (PRISM software package, Version 8,
Graphpad Software Inc., San Diego, CA, USA).
3. Results
Of the 155 participants recruited, 150 completed all study visits. Two participants withdrew from
the FS0+Plac groups, one from nausea after the baseline visit and one from loss of interest in the study
after the mid-point visit. One participant also withdrew from the FS65+Curc group after the baselineAntioxidants 2020, 9, 645 6 of 16
visit due to loss of interest and another withdrew due to gastric distress. A participant in the FS18+Plac
group was excluded from the study due to incomplete blood sampling at the mid-point (Figure S1).
The mean age of participants was 26.12 years (±0.39). There was no significant difference in
mean age between the five treatment groups. There were also no significant differences observed in
anthropometric measurements of participants (Table 1). The study population was of mixed ethnicity,
representative of the population at the site of recruitment (London, UK).
Table 1. Participant age, weight, height, body mass index (BMI) and body fat percentages (mean ± SEM).
Variable FS0+Plac FS18+Plac FS18+Curc FS65+Plac FS65+Curc
Age (yrs) 26.29 ± 0.84 25.84 ± 0.93 24.48 ± 0.82 27.23 ± 0.83 26.77 ± 0.87
Weight (kg) 70.79 ± 2.37 72.45 ± 3.13 66.17 ± 2.45 70.21 ± 3.54 67.70 ± 2.13
Height (m) 1.72 ± 0.02 1.71 ± 0.01 1.68 ± 0.02 1.70 ± 0.02 1.72 ± 0.02
BMI (m/kg2 ) 23.89 ± 0.58 24.51 ± 0.85 23.32 ± 0.64 24.11 ± 1.00 22.83 ± 0.55
Body fat (%) 25.27 ± 1.71 24.96 ± 1.67 24.32 ± 1.76 24.97 ± 1.54 23.39 ± 1.39
At baseline, no significant differences were observed in mean ferritin levels across the treatment
groups (Table 2). However, there was a significant difference observed in baseline BDNF levels between
the FS18+Plac (37.16 ng/mL) and FS18+Curc (30.28 ng/mL) groups, with the mean BDNF being (22.7%
p = 0.049) higher in the FS18+Plac group compared to the FS18+Curc group (Table 2). No significant
differences in baseline BDNF were observed when comparing any of the other groups (Table 2).
Table 2. Participant baseline ferritin and brain-derived neurotrophic factor (BDNF) levels expressed as
mean ± SEM.
Variable FS0+Plac FS18+Plac FS18+Curc FS65+Plac FS65+Curc
Ferritin(µg/L) 58.71 ± 9.37 68.58 ± 10.30 52.36 ± 7.74 55.14 ± 8.18 61.46 ± 8.47
BDNF (ng/mL) 35.18 ± 2.10 37.16 ± 1.88 30.28 ± 1.54 31.59 ± 1.35 30.85 ± 8.47
When evaluating the effect of treatment group on serum BDNF levels after 21 day (mid-point)
and 42 day (end-point) supplementation, significant differences were observed between the different
treatment groups (F(4, 144) = 2.746, p = 0.031) and the two time points (F(1, 142) = 11.36, p = 0.001).
A significant increase of 26.34% in BDNF levels from mid-point to end-point was observed in
participants taking FS18+Curc (p = 0.024) (Figure 2). At the end-point, there was also a significant
difference observed in BDNF levels between the FS18+Curc and FS18+Plac groups (p = 0.042), with the
FS18+Curc treatment resulting in a 34.94% higher concentration of BDNF than FS18+Plac (Figure 2).
A similar trend of increased BDNF was observed at the end-point when comparing the FS65+Curc
treatment with FS65+Plac, however this was not significant (Figure 2). There were no other significant
differences in BDNF levels between or within treatment groups (Figure 2).
When participants were sub-grouped according to low ferritin (participants taking FS18+Curc (p = 0.024) (Figure 2). At the end-point, there was also a significant
difference observed in BDNF levels between the FS18+Curc and FS18+Plac groups (p = 0.042), with the
FS18+Curc treatment resulting in a 34.94% higher concentration of BDNF than FS18+Plac (Figure 2). A
similar trend of increased BDNF was observed at the end-point when comparing the FS65+Curc
treatment 2020,
Antioxidants with9,FS65+Plac,
645 however this was not significant (Figure 2). There were no other significant
7 of 16
differences in BDNF levels between or within treatment groups (Figure 2).
Figure 2. BDNF levels are expressed as percentage difference compared to baseline levels (mean ±
SEM): FS0+Plac [Mid-point n = 29; End-point n = 28], FS18+Plac [Mid-point n = 30; End-point n = 29],
FS18 + Curc [Mid-point n = 31; End-point n = 31], FS65+Plac [Mid-point n = 30; End-point n = 30] and
FS65 + Curc [Mid-point n = 29; End-point n = 29]). Samples were collected and analysed at mid-point
(day 21) and end-point (day 42). * represents significance values when comparing each condition and
time points within the same condition. (* p < 0.05).
No significant differences were observed in baseline ferritin levels between the low and normal
ferritin groups (Tables 3 and 4). In the low ferritin sub-group (Table 3), significant differences were
observed between baseline, mid-point and end-point time points (F (2, 158) = 27.81, p < 0.0001).
A significant increase of 35.17% in ferritin levels was observed at end-point compared to baseline in
the FS18+Curc group (p = 0.0013) (Table 3). A significant increase of 58.75% in ferritin levels was also
observed at end-point compared to baseline in the FS65+Curc group (p = 0.0002) (Table 3).
Furthermore, there were significant increases from baseline for the FS65+Plac group at mid-point
(43.6%) and end-point (68.34%) (p = 0.0014 and p < 0.0001, respectively) (Table 3). In the normal ferritin
sub-group, there was no significant effect observed in ferritin levels over time or between groups in
relation to any supplementation (Table 4).
Table 3. Mean ferritin (µg/L) values (low ferritin sub-group) per treatment group and timepoints (mean
± SEM). * represents significance values when comparing mid-point or end-point to baseline within the
same condition (** p < 0.01; *** p < 0.001; **** p < 0.0001).
Timepoint FS0+Plac FS18+Plac FS18+Curc FS65+Plac FS65+Curc
Baseline 25.08 ± 1.73 25.29 ± 2.81 30.25 ± 2.52 25.55 ± 1.78 25.04 ± 2.72
Mid-point 28.23 ± 2.96 34.59 ± 4.24 36.45 ± 2.92 36.69 ± 3.34 ** 32.10 ± 4.04
End-point 31.39 ± 5.12 33.31 ± 3.39 40.89 ± 4.99 ** 43.01 ± 4.01 **** 39.75 ± 6.19 ***
Table 4. Mean ferritin (µg/L) values (normal ferritin sub-group) per treatment group and timepoints
(mean ± SEM).
Timepoint FS0+Plac FS18+Plac FS18+Curc FS65+Plac FS65+Curc
Baseline 91.38 ± 12.94 109.17 ± 13.30 98.79 ± 15.37 94.54 ± 9.94 100.31 ± 10.01
Mid-point 93.37 ± 13.75 100.10 ± 16.85 102.23 ± 13.56 101.50 ± 11.75 101.63 ± 11.45
End-point 87.88 ± 11.45 100.21 ± 13.27 102.32 ± 16.18 98.37 ± 15.49 106.62 ± 12.29cohort with low ferritin who were supplemented with FS18+Curc (p = 0.019) (Figure 3A). Although
no significant difference in BDNF was observed between the FS18+Curc and FS18+Plac group for
participants with low baseline ferritin, the FS18+Curc group had significantly higher BDNF at the
end-point compared to the FS0+Plac group, (increased by 53.78%, p = 0.028) (Figure 3A). No
significant differences in BDNF levels were observed between treatment groups, at either time point,
Antioxidants 2020, 9, 645 8 of 16
in participants with normal ferritin levels (Figure 3B).
Figure 3. (A). Mean ± SEM, % difference in BDNF for participants with low ferritin at baseline
Figure 3. (A). Mean ± SEM, % difference in BDNF for participants with low ferritin at baseline (< 50
(Antioxidants 2020, 9, 645 9 of 16
sulphate being within ranges that are unlikely to cause a high degree of gastric distress, which often
results in the poor compliance typically seen in oral iron supplementation [77].
All participants had ferritin values in the normal range for the UK (15–300 µg/L—men and
15–200 µg/L—women) [63]. The 2011 WHO guidelines state that serum ferritin less than 15 µg/L is a
specific indicator for iron deficiency [78]. Globally, there is ongoing debate calling for an increase in
the normal ferritin cut-off value. Numerous authors [79–81] recommend a serum ferritin cut-off of
30 µg/L, as it has been shown to be indicative of insufficient iron stores. Iron therapy may therefore be
appropriate in such individuals (ferritinAntioxidants 2020, 9, 645 10 of 16
The current study also demonstrated an increase in serum BDNF levels between mid- and
end-point in the high dose iron group (FS65+Curc), with an observable difference between FS65+Curc
and FS65+Plac groups at the end-point. However, these results were not significant. This observable
but non-significant change could be due to reduced fractional iron absorption (FIA); in other words,
the proportion of the dose absorbed. According to Moretti et al. [88], iron doses above 60 mg,
when taken on consecutive rather than alternative days, resulted in reduced FIA. This is understood to
be mediated by significantly increased levels of serum hepcidin, which are observed following 24 h
supplementation with ≥60 mg elemental iron [88]. Hepcidin is the key regulatory protein of systemic
iron homeostasis and protects against iron overload [89]. It is synthesised mainly by the liver and
regulated by iron, erythropoietic activity, hypoxia and inflammation [90]. Hepcidin regulates iron
homeostasis by binding to ferroportin, the transmembrane protein that mediates iron efflux from the
cells, initiating its internalisation and degradation. Consequently, the iron-efflux activity of ferroportin
is down regulated, leading to a reduced dose of iron being transported to the systemic circulation
from the gut enterocytes [90,91]. Stoffel et al. [92] showed that FIA was 34% lower following 14
consecutive days compared to 28 alternative days dosing with oral ferrous sulphate (60 mg elemental
iron supplementation) in iron-depleted women (median age 22 years) without anaemia.
Alternatively, reduced iron absorption following consecutive days of high iron supplementation
could be explained by the mucosal block theory [93]. The enterocytes uptake iron from the gut lumen
via divalent metal transporter 1 (DMT1) in the ferrous (Fe2+ ) form. This iron is then converted into
ferric (Fe3+ ) form and can be stored by binding to apoferritin, forming ferritin, (the temporary storage
form of iron) or can be transported to the systemic circulation via ferroportin after being reduced
back to its Fe2+ form [94]. It is assumed that enterocytes exposed to large doses of iron would store
iron in ferritin form, when the body’s iron requirement is reduced. Furthermore, with the reduced
availability of apoferritin, the enterocytes’ iron absorption would consequently reduce until the cells
are replaced in 5 to 6 days [95] with their iron content being lost in the faeces. Nonetheless, the accuracy
of mucosal block theory has been debated in recent studies [96–98]. However, in either case, reduced
FIA or mucosal block could lead to the accumulation of large amounts of unabsorbed iron, which may
cause gut inflammation [77], increase the production of free radicals in the mucosa (the innermost
layer of the gut) [99,100] and may alter the gut microbiota by increasing pathogenic microorganisms
whilst reducing commensal microflora [101,102]. Commensal microorganisms such as Escherichia coli,
Blautia sp. (MRG-PMF1) or Lactobacillus acidophilus have been shown to be biologically active in
curcumin metabolism in the gut, producing curcumin derivates with increased biological activity and
improved pharmacokinetics related to absorption compared to native curcumin. Thus, microbiota may
enhance the neuroprotective effects of curcumin [103]. However, the enhancing role of curcumin on
gut microbiota may be diminished when compromised by high iron accumulation in the gut [104].
Additionally, the increased levels of free radicals in the gut following high iron absorption may result
in the free radical scavenging properties of curcumin being utilised locally [48]. This could explain
why the combination of curcumin with low iron supplementation (FS18+Curc) generally resulted in
higher end-point serum BDNF levels than with high iron plus curcumin (FS65+Curc) treatment.
The normal range of serum BDNF levels varies according to numerous factors such as age, ethnicity,
study location and sample processing methods [105–107]. However, previous research indicates that
normal serum BDNF levels may fall within the range of 8 ng/mL and 46 ng/mL [108,109]. The data from
the current study suggests that supplementation with 18 mg iron and 500 mg curcumin over 42 days
elevates BDNF levels towards the higher end of this normal range, given the average end-point value
of 39.17 ng/mL within this group (Table S1). However, a recent Swiss study of healthy adults reported a
wider range of serum BDNF levels, between 15.83 ng/mL and 79.77 ng/mL [107], which highlights the
difficulty in precisely establishing normal serum BDNF levels within a healthy cohort. Nevertheless,
the relationship between BDNF and cognitive function is well established [110–113] and low serum
BDNF levels have been attributed to cognitive impairment in the elderly [114]. Therefore, the evident
increase in serum BDNF following low iron and curcumin supplementation in this cohort may beAntioxidants 2020, 9, 645 11 of 16
expected to be associated with probable cognitive benefits. However, in the future, it would be of value
to also directly assess cognitive performance in relation to serum BDNF following iron and curcumin
supplementation at varying timeframes, as this could help identify the specific levels of serum BDNF
that correlate with the enhancement of cognitive function.
In summary, the current study demonstrates for the first time that the co-administration of a
bioavailable formulated curcumin supplement with ferrous sulphate containing 18 mg elemental iron
for 42 days results in increased serum BDNF levels. The addition of curcumin may therefore provide a
novel approach to iron supplementation and possibly enhance the iron-associated cognitive benefits
linked to increased serum BDNF levels.
Supplementary Materials: The following are available online at http://www.mdpi.com/2076-3921/9/8/645/s1,
Figure S1: shows the study compliance after 155 participants were enrolled and randomised equally into 5
treatment groups: FS0+Plac (full placebo, placebos for both iron and curcumin), FS18+Plac (18 mg elemental iron
and placebo for curcumin), FS18+Curc (18 mg elemental iron and 500 mg curcumin), FS65+Plac (65 mg elemental
iron and placebo for curcumin) and FS65+Curc (65 mg elemental iron and 500 mg curcumin). Table S1: Mean
BDNF (ng/mL) values per treatment group/timepoint (mean ± SEM).
Author Contributions: Conceptualisation and methodology: M.G.Z., D.R., G.B. and O.F. Supervision: M.G.Z.,
D.R. and G.B. Investigation and data curation: O.F. and H.T.L. Data analysis: O.F., H.T.L., L.M. and G.B.
Writing—original draft preparation: H.T.L., O.F., L.M. and M.G.Z. Writing—review and editing: M.G.Z., D.R., G.B.
and L.M. All authors have read and agreed to the published version of the manuscript.
Funding: The study was supported by Knowledge Exchange funding from Gencor Pacific Ltd (UT722720).
Acknowledgments: We gratefully acknowledge the time and dedication of all participants who participated in
this study. We would like to acknowledge all colleagues from The University of Westminster who contributed
support and expertise to this study. We thank Lina Temouri for assistance with administrative duties, phlebotomy
and laboratory work, Chrystalla Ferrier for assisting with the operation of the Ilab Aries instrument and Yvoni
Kyriakidou for assistance with phlebotomy. We thank Sonita Chea, Hashum Sum and Ruchita Venkatesh for their
laboratory and administration assistance and Gloria Koncz for her administration assistance, and Mariana Peixoto
for her logistical support to this project. The authors would also like to thank the Research Interns and Visiting
Researchers who assisted over the course of this project.
Conflicts of Interest: The funder was involved in the study design process but had no involvement in the data
collection or analysis. The authors declare no other conflict of interest.
References
1. Ganz, T.; Nemeth, E. Iron homeostasis in host defence and inflammation. Nat. Rev. Immunol. 2015, 15, 500–510.
[CrossRef] [PubMed]
2. Beard, J.L.; Connor, J.R. Iron status and neural functioning. Annu. Rev. Nutr. 2003, 23, 41–58. [CrossRef]
[PubMed]
3. Zariwala, M.; Elsaid, N.; Jackson, T.L.; López, F.C.; Farnaud, S.; Somavarapu, S.; Renshaw, D. A novel
approach to oral iron delivery using ferrous sulphate loaded solid lipid nanoparticles. Int. J. Pharm. 2013,
456, 400–407. [CrossRef] [PubMed]
4. Dev, S.; Babitt, J.L. Overview of iron metabolism in health and disease. Hemodial. Int. 2017, 21, S6–S20. [CrossRef]
5. Zimmermann, M.; Hurrell, R. Nutritional iron deficiency. Lancet 2007, 370, 511–520. [CrossRef]
6. Hurrell, R.F.; Egli, I. Iron bioavailability and dietary reference values. Am. J. Clin. Nutr. 2010, 91, 1461S–1467S.
[CrossRef]
7. Paesano, R.; Natalizi, T.; Berlutti, F.; Valenti, P. Body iron delocalization: The serious drawback in iron
disorders in both developing and developed countries. Pathog. Glob. Health 2012, 106, 200–216. [CrossRef]
8. McLean, E.; Cogswell, M.; Egli, I.; Wojdyla, D.; De Benoist, B. Worldwide prevalence of anaemia, WHO Vitamin
and Mineral Nutrition Information System, 1993–2005. Public Health Nutr. 2009, 12, 444–454. [CrossRef]
9. de Benoist, B.; McLean, E.; Egli, I.; Cogswell, M. World Health Organization Worldwide Prevalence of Anaemia
1993–2005: WHO Global Database on Anaemia; WHO Press, World Health Organization: Geneva, Switzerland, 2008.
10. Kassebaum, N.J. The Global Burden of Anemia. Hematol. Oncol. Clin. 2016, 30, 247–308. [CrossRef]
11. Williams, A.M.; Addo, O.Y.; Grosse, S.D.; Kassebaum, N.J.; Rankin, Z.; Ballesteros, K.E.; Olsen, H.E.;
Sharma, A.J.; Jefferds, M.E.; Mei, Z. Data needed to respond appropriately to anemia when it is a public
health problem. Ann. N. Y. Acad. Sci. 2019, 1450, 268–280. [CrossRef]Antioxidants 2020, 9, 645 12 of 16
12. Haas, J.D.; Brownlie, T. Iron deficiency and reduced work capacity: A critical review of the research to
determine a causal relationship. J. Nutr. 2001, 131, 676S–690S. [CrossRef] [PubMed]
13. Brownlie, T.; Utermohlen, V.; Hinton, P.; Giordano, C.; Haas, J.D. Marginal iron deficiency without anemia
impairs aerobic adaptation among previously untrained women. Am. J. Clin. Nutr. 2002, 75, 734–742.
[CrossRef] [PubMed]
14. Jáuregui-Lobera, I. Iron deficiency and cognitive functions. Neuropsychiatr. Dis. Treat. 2014, 10, 2087–2095.
[CrossRef]
15. Lopez, A.; Cacoub, P.; Macdougall, I.C.; Peyrin-Biroulet, L. Iron deficiency anaemia. Lancet 2016, 387, 907–916.
[CrossRef]
16. Patterson, A.J.; Brown, W.J.; Powers, J.R.; Roberts, D.C. Iron deficiency, general health and fatigue: Results
from the Australian Longitudinal Study on Women’s Health. Qual. Life Res. 2000, 9, 491–497. [CrossRef]
[PubMed]
17. Enjuanes, C.; Klip, I.T.; Bruguera, J.; Cladellas, M.; Ponikowski, P.; Banasiak, W.; Van Veldhuisen, D.J.;
Van Der Meer, P.; Jankowska, E.A.; Comin-Colet, J. Iron deficiency and health-related quality of life in chronic
heart failure: Results from a multicenter European study. Int. J. Cardiol. 2014, 174, 268–275. [CrossRef]
[PubMed]
18. Pino, J.M.V.; Da Luz, M.H.M.; Antunes, H.K.M.; Giampá, S.Q.D.C.; Martins, V.R.; Lee, K.S. Iron-Restricted
Diet Affects Brain Ferritin Levels, Dopamine Metabolism and Cellular Prion Protein in a Region-Specific
Manner. Front. Mol. Neurosci. 2017, 10, 145. [CrossRef]
19. Abbaspour, N.; Hurrell, R.; Kelishadi, R. Review on iron and its importance for human health. J. Res. Med. Sci.
2014, 19, 164–174.
20. Chen, M.J.; Nguyen, T.; Pike, C.J.; Russo-Neustadt, A. Norepinephrine induces BDNF and activates the PI-3K
and MAPK cascades in embryonic hippocampal neurons. Cell. Signal. 2007, 19, 114–128. [CrossRef]
21. Gonzalez, A.; Moya-Alvarado, G.; Gonzalez-Billaut, C.; Bronfman, F.C. Cellular and molecular mechanisms
regulating neuronal growth by brain-derived neurotrophic factor. Cytoskeleton 2016, 73, 612–628. [CrossRef]
22. Tao, X.; Finkbeiner, S.; Arnold, D.B.; Shaywitz, A.J.; Greenberg, M.E. Ca2+ Influx Regulates BDNF Transcription
by a CREB Family Transcription Factor-Dependent Mechanism. Neuron 1998, 20, 709–726. [CrossRef]
23. Zheng, F.; Zhou, X.; Luo, Y.; Xiao, H.; Wayman, G.; Wang, H. Regulation of Brain-Derived Neurotrophic
Factor Exon IV Transcription through Calcium Responsive Elements in Cortical Neurons. PLoS ONE 2011,
6, e28441. [CrossRef] [PubMed]
24. Bathina, S.; Das, U.N. Brain-derived neurotrophic factor and its clinical implications. Arch. Med. Sci. 2015,
11, 1164–1178. [CrossRef] [PubMed]
25. Bekinschtein, P.; Cammarota, M.; Katche, C.; Slipczuk, L.; Rossato, J.I.; Goldin, A.; Izquierdo, I.; Medina, J.H.
BDNF is essential to promote persistence of long-term memory storage. Proc. Natl. Acad. Sci. USA 2008,
105, 2711–2716. [CrossRef] [PubMed]
26. Bothwell, M. Functional interactions of neurotrophins and neurotrophin receptors. Annu. Rev. Neurosci.
1995, 18, 223–253. [CrossRef] [PubMed]
27. Pan, W.; Banks, W.A.; Fasold, M.B.; Bluth, J.; Kastin, A.J. Transport of brain-derived neurotrophic factor
across the blood-brain barrier. Neuropharmacology 1998, 37, 1553–1561. [CrossRef]
28. Poduslo, J.F.; Curran, G.L. Permeability at the blood-brain and blood-nerve barriers of the neurotrophic
factors: NGF, CNTF, NT-3, BDNF. Mol. Brain Res. 1996, 36, 280–286. [CrossRef]
29. Sartorius, A.; Hellweg, R.; Litzke, J.; Vogt, M.A.; Dormann, C.; Vollmayr, B.; Danker-Hopfe, H.;
Gass, P. Correlations and Discrepancies between Serum and Brain Tissue Levels of Neurotrophins after
Electroconvulsive Treatment in Rats. Pharmacopsychiatry 2009, 42, 270–276. [CrossRef]
30. Karege, F.; Schwald, M.; Cisse, M. Postnatal developmental profile of brain-derived neurotrophic factor in
rat brain and platelets. Neurosci. Lett. 2002, 328, 261–264. [CrossRef]
31. Klein, A.B.; Williamson, R.; Santini, M.A.; Clemmensen, C.; Ettrup, A.; Rios, M.; Knudsen, G.M.; Aznar, S.
Blood BDNF concentrations reflect brain-tissue BDNF levels across species. Int. J. Neuropsychopharmacol.
2011, 14, 347–353. [CrossRef]
32. Mehrpouya, S.; Nahavandi, A.; Khojasteh, F.; Soleimani, M.; Ahmadi, M.; Barati, M. Iron administration
prevents BDNF decrease and depressive-like behavior following chronic stress. Brain Res. 2015, 1596, 79–87.
[CrossRef] [PubMed]Antioxidants 2020, 9, 645 13 of 16
33. Texel, S.J.; Camandola, S.; Ladenheim, B.; Rothman, S.M.; Mughal, M.R.; Unger, E.L.; Cadet, J.L.; Mattson, M.P.
Ceruloplasmin deficiency results in an anxiety phenotype involving deficits in hippocampal iron, serotonin,
and BDNF. J. Neurochem. 2012, 120, 125–134. [CrossRef] [PubMed]
34. Lozoff, B.; Jimenez, E.; Wolf, A.W. Long-Term Developmental Outcome of Infants with Iron Deficiency.
N. Engl. J. Med. 1991, 325, 687–694. [CrossRef] [PubMed]
35. Sian-Hülsmann, J.; Mandel, S.; Youdim, M.B.H.; Riederer, P. The relevance of iron in the pathogenesis of
Parkinson’s disease. J. Neurochem. 2011, 118, 939–957. [CrossRef] [PubMed]
36. Radak, Z.; Suzuki, K.; Higuchi, M.; Balogh, L.; Boldogh, I.; Koltai, E. Physical exercise, reactive oxygen
species and neuroprotection. Free. Radic. Biol. Med. 2016, 98, 187–196. [CrossRef] [PubMed]
37. Hwang, O. Role of oxidative stress in Parkinson’s disease. Exp. Neurobiol. 2013, 22, 11–17. [CrossRef]
38. Ray, P.D.; Huang, B.-W.; Tsuji, Y. Reactive oxygen species (ROS) homeostasis and redox regulation in cellular
signaling. Cell. Signal. 2012, 24, 981–990. [CrossRef]
39. Jiang, H.; Wang, J.; Rogers, J.; Xie, J. Brain Iron Metabolism Dysfunction in Parkinson’s Disease. Mol. Neurobiol.
2017, 54, 3078–3101. [CrossRef]
40. Fahnestock, M.; Marchese, M.; Head, E.; Pop, V.; Michalski, B.; Milgram, W.N.; Cotman, C.W. BDNF increases
with behavioral enrichment and an antioxidant diet in the aged dog. Neurobiol. Aging 2012, 33, 546–554.
[CrossRef]
41. Assunção, M.; Santos-Marques, M.J.; Carvalho, F.; Andrade, J.P. Green tea averts age-dependent decline of
hippocampal signaling systems related to antioxidant defenses and survival. Free Radic. Biol. Med. 2010,
48, 831–838. [CrossRef]
42. Kulkarni, S.K.; Dhir, A.; Akula, K.K. Potentials of Curcumin as an Antidepressant. Available online:
https://www.hindawi.com/journals/tswj/2009/624894/ (accessed on 8 April 2020).
43. Lopresti, A.L.; Hood, S.; Drummond, P.D. Multiple antidepressant potential modes of action of curcumin:
A review of its anti-inflammatory, monoaminergic, antioxidant, immune-modulating and neuroprotective
effects. J. Psychopharmacol. 2012, 26, 1512–1524. [CrossRef] [PubMed]
44. Mursaleen, L.; Somavarapu, S.; Zariwala, M.G. Deferoxamine and Curcumin Loaded Nanocarriers Protect
Against Rotenone-Induced Neurotoxicity. J. Parkinsons Dis. 2020, 10, 99–111. [CrossRef] [PubMed]
45. Bich, V.T.; Thuy, N.T.; Binh, N.T.; Huong, N.T.M.; Yen, P.N.D.; Luong, T.T. Structural and Spectral Properties of
Curcumin and Metal-Curcumin Complex Derived from Turmeric (Curcuma Longa); Springer: Berlin/Heidelberg,
Germany, 2009; pp. 271–278.
46. Ferrari, E.; Benassi, R.; Sacchi, S.; Pignedoli, F.; Asti, M.; Saladini, M. Curcumin derivatives as metal-chelating
agents with potential multifunctional activity for pharmaceutical applications. J. Inorg. Biochem. 2014,
139, 38–48. [CrossRef]
47. Tcnnesen, H.H.; Greenhill, J.V. Studies on curcumin and curcuminoids. XXII: Curcumin as a reducing agent
and as a radical scavenger. Int. J. Pharm. 1992, 87, 79–87. [CrossRef]
48. Reddy, A.C.P.; Lokesh, B.R. Studies on the inhibitory effects of curcumin and eugenol on the formation of
reactive oxygen species and the oxidation of ferrous iron. Mol. Cell. Biochem. 1994, 137, 1–8. [CrossRef]
[PubMed]
49. Borsari, M.; Ferrari, E.; Grandi, R.; Saladini, M. Curcuminoids as potential new iron-chelating agents:
Spectroscopic, polarographic and potentiometric study on their Fe (III) complexing ability. Inorg. Chim. Acta
2002, 328, 61–68. [CrossRef]
50. Bernabé-Pineda, M.; Ramírez-Silva, M.T.; Romero-Romo, M.; González-Vergara, E.; Rojas-Hernández, A.
Determination of acidity constants of curcumin in aqueous solution and apparent rate constant of its
decomposition. Spectrochim. Acta Part Mol. Biomol. Spectrosc. 2004, 60, 1091–1097. [CrossRef]
51. Salem, M.; Rohani, S.; Gillies, E.R. Curcumin, a promising anti-cancer therapeutic: A review of its chemical
properties, bioactivity and approaches to cancer cell delivery. RSC Adv. 2014, 4, 10815–10829. [CrossRef]
52. Sarraf, P.; Parohan, M.; Javanbakht, M.H.; Ranji-Burachaloo, S.; Djalali, M. Short-term curcumin
supplementation enhances serum brain-derived neurotrophic factor in adult men and women: A systematic
review and dose-response meta-analysis of randomized controlled trials. Nutr. Res. 2019, 69, 1–8. [CrossRef]
53. Rossi, L.; Mazzitelli, S.; Arciello, M.; Capo, C.R.; Rotilio, G. Benefits from Dietary Polyphenols for Brain
Aging and Alzheimer’s Disease. Neurochem. Res. 2008, 33, 2390–2400. [CrossRef]
54. Tsai, Y.-M.; Chien, C.-F.; Lin, L.-C.; Tsai, T.-H. Curcumin and its nano-formulation: The kinetics of tissue
distribution and blood–brain barrier penetration. Int. J. Pharm. 2011, 416, 331–338. [CrossRef] [PubMed]Antioxidants 2020, 9, 645 14 of 16
55. Prasad, S.; Tyagi, A.K.; Aggarwal, B.B. Recent Developments in Delivery, Bioavailability, Absorption and
Metabolism of Curcumin: The Golden Pigment from Golden Spice. Cancer Res. Treat. 2014, 46, 2. [CrossRef]
[PubMed]
56. Zhongfa, L.; Chiu, M.; Wang, J.; Chen, W.; Yen, W.; Fan-Havard, P.; Yee, L.D.; Chan, K.K. Enhancement
of curcumin oral absorption and pharmacokinetics of curcuminoids and curcumin metabolites in mice.
Cancer Chemother. Pharmacol. 2012, 69, 679–689. [CrossRef] [PubMed]
57. Zupancic, S.; Kocbek, P.; Kristl, J.; Zariwala, M.; Renshaw, D.; Gul, M.O.; Elsaid, Z.; Taylor, K.; Somavarapu, S.
Formulation and characterization of curcumin loaded DQAsomes for pulmonary delivery. In Proceedings
of the 10th International Conference and Workshop on Biological Barriers, Saarbrücken, Germany,
16–21 February 2014.
58. Briskey, D.; Sax, A.; Mallard, A.R.; Rao, A. Increased bioavailability of curcumin using a novel dispersion
technology system (LipiSperse® ). Eur. J. Nutr. 2019, 58, 2087–2097. [CrossRef]
59. Faul, F.; Erdfelder, E.; Lang, A.-G.; Buchner, A. G*Power 3: A flexible statistical power analysis program for
the social, behavioral, and biomedical sciences. Behav. Res. Methods 2007, 39, 175–191. [CrossRef]
60. Faul, F.; Erdfelder, E.; Buchner, A.; Lang, A.-G. Statistical power analyses using G*Power 3.1: Tests for
correlation and regression analyses. Behav. Res. Methods 2009, 41, 1149–1160. [CrossRef]
61. Study Randomizer. Available online: https://app.studyrandomizer.com/ (accessed on 1 October 2019).
62. Dooley, J.; Worwood, M. Guidelines on Diagnosis and Therapy: Genetic Haemochromatosis; British Committee for
Standards in Haematology: London, UK, 2000; pp. 1–33.
63. Fitzsimons, E.J.; Cullis, J.O.; Thomas, D.; Tsochatzis, E.; Griffiths, W.J. Diagnosis and therapy of genetic
haemochromatosis (review and 2017 update). Br. J. Haematol. 2018, 181, 293–303. [CrossRef]
64. World Health Organization. Nutritional Anaemias: Tools for Effective Prevention and Control; World Health
Organization: Geneva, Switzerland, 2017.
65. Punnonen, K.; Irjala, K.; Rajamäki, A. Serum Transferrin Receptor and Its Ratio to Serum Ferritin in the
Diagnosis of Iron Deficiency. Blood 1997, 89, 1052–1057. [CrossRef]
66. Verdon, F.; Burnand, B.; Stubi, C.-L.F.; Bonard, C.; Graff, M.; Michaud, A.; Bischoff, T.; De Vevey, M.;
Studer, J.-P.; Herzig, L.; et al. Iron supplementation for unexplained fatigue in non-anaemic women: Double
blind randomised placebo controlled trial. BMJ 2003, 326, 1124. [CrossRef]
67. Koulaouzidis, A.; Cottier, R.; Bhat, S.; Said, E.; Linaker, B.D.; Saeed, A.A. A ferritin level >50 µg/L is frequently
consistent with iron deficiency. Eur. J. Intern. Med. 2009, 20, 168–170. [CrossRef]
68. Vaucher, P.; Druais, P.-L.; Waldvogel, S.; Favrat, B. Effect of iron supplementation on fatigue in nonanemic
menstruating women with low ferritin: A randomized controlled trial. Can. Med. Assoc. J. 2012, 184, 1247–1254.
[CrossRef] [PubMed]
69. Peyrin-Biroulet, L.; Williet, N.; Cacoub, P. Guidelines on the diagnosis and treatment of iron deficiency across
indications: A systematic review. Am. J. Clin. Nutr. 2015, 102, 1585–1594. [CrossRef] [PubMed]
70. Blood Pressure Association UK. Blood Pressure Chart Bloodpressureuk.org. 2008. Available online: http:
//www.bloodpressureuk.org/BloodPressureandyou/Thebasics/Bloodpressurechart (accessed on 5 May 2020).
71. Williams, B.; Mancia, G.; Spiering, W.; Rosei, E.A.; Azizi, M.; Burnier, M.; Clement, D.L.; Coca, A.;
De Simone, G.; Dominiczak, A.; et al. 2018 ESC/ESH Guidelines for the management of arterial hypertension:
The Task Force for the management of arterial hypertension of the European Society of Cardiology and the
European Society of Hypertension. J. Hypertens. 2018, 36, 1953–2041. [CrossRef] [PubMed]
72. Goddard, A.F.; James, M.W.; McIntyre, A.S.; Scott, B.B. Guidelines for the management of iron deficiency
anaemia. Gut 2011, 60, 1309–1316. [CrossRef] [PubMed]
73. British National Formulary. Ferrous Sulfate Bnf.nice.org.uk. 2020. Available online: https://bnf.nice.org.uk/
drug/ferrous-sulfate.html (accessed on 8 May 2020).
74. Food and Draug Administration (FDA) Center for Food Safety and Applied Nutrition. Guidance for Industry:
Food Labeling Guide; Food and Draug Administration: College Park, MD, USA, 2013.
75. Coudène, P.; Marson, B.; Badiou, S.; Flavier, S.; Anelli, S.; Cristol, J.; Dupuy, A.M. Evaluation of the ABX
Pentra 400: A newly available clinical chemistry analyser. Clin. Chem. Lab. Med. 2005, 43, 782–792. [CrossRef]
76. Simó, J.M.; Joven, J.; Clivillé, X.; Sans, T. Automated latex agglutination immunoassay of serum ferritin with
a centrifugal analyzer. Clin. Chem. 1994, 40, 625–629. [CrossRef]Antioxidants 2020, 9, 645 15 of 16
77. Tolkien, Z.; Stecher, L.; Mander, A.P.; Pereira, D.; Powell, J.J. Ferrous Sulfate Supplementation Causes
Significant Gastrointestinal Side-Effects in Adults: A Systematic Review and Meta-Analysis. PLoS ONE 2015,
10, e0117383. [CrossRef]
78. World Health Organization (WHO). Serum Ferritin Concentrations for the Assessment of Iron Status and Iron
Deficiency in Populations; World Health Organization: Geneva, Switzerland, 2011.
79. Mast, A.E.; Blinder, M.A.; Gronowski, A.M.; Chumley, C.; Scott, M.G. Clinical utility of the soluble transferrin
receptor and comparison with serum ferritin in several populations. Clin. Chem. 1998, 44, 45–51. [CrossRef]
80. Clénin, G.E. The treatment of iron deficiency without anaemia (in otherwise healthy persons). Swiss Med.
Wkly. 2017, 147, w14434.
81. Soppi, E. Iron Deficiency without Anemia—Common, Important, Neglected. Clin. Case Rep. Rev. 2019,
5, 1–7.
82. Cook, J.D.; Lipschitz, D.A.; Miles, L.E.M.; Finch, C.A. Serum ferritin as a measure of iron stores in normal
subjects. Am. J. Clin. Nutr. 1974, 27, 681–687. [CrossRef] [PubMed]
83. Institute of Medicine (US) Panel on Micronutrients. Dietary Reference Intakes for Vitamin A, Vitamin K, Arsenic,
Boron, Chromium, Copper, Iodine, Iron, Manganese, Molybdenum, Nickel, Silicon, Vanadium, and Zinc; National
Academies Press: Washington, DC, USA, 2001.
84. Manoguerra, A.S.; Erdman, A.R.; Booze, L.L.; Christianson, G.; Wax, P.M.; Scharman, E.J.; Woolf, A.D.;
Chyka, P.A.; Keyes, D.C.; Olson, K.R.; et al. Iron Ingestion: An Evidence-Based Consensus Guideline for
Out-of-Hospital Management. Clin. Toxicol. 2005, 43, 553–570. [CrossRef] [PubMed]
85. Barbara, R.; Belletti, D.; Pederzoli, F.; Masoni, M.; Keller, J.; Ballestrazzi, A.; Vandelli, M.; Tosi, G.; Grabrucker, A.
Novel Curcumin loaded nanoparticles engineered for Blood-Brain Barrier crossing and able to disrupt Abeta
aggregates. Int. J. Pharm. 2017, 526, 413–424. [CrossRef] [PubMed]
86. Hoppe, J.B.; Coradini, K.; Frozza, R.L.; Oliveira, C.M.; Meneghetti, A.B.; Bernardi, A.; Pires, E.S.; Beck, R.C.;
Salbego, C.G. Free and nanoencapsulated curcumin suppress β-amyloid-induced cognitive impairments in
rats: Involvement of BDNF and Akt/GSK-3β signaling pathway. Neurobiol. Learn. Mem. 2013, 106, 134–144.
[CrossRef]
87. Navaratna, D.; Guo, S.-Z.; Hayakawa, K.; Wang, X.; Gerhardinger, C.; Lo, E.H. Decreased Cerebrovascular
Brain-Derived Neurotrophic Factor—Mediated Neuroprotection in the Diabetic Brain. Diabetes 2011,
60, 1789–1796. [CrossRef]
88. Moretti, D.; Goede, J.S.; Zeder, C.; Jiskra, M.; Chatzinakou, V.; Tjalsma, H.; Melse-Boonstra, A.; Brittenham, G.;
Swinkels, R.W.; Zimmermann, M.B. Oral iron supplements increase hepcidin and decrease iron absorption
from daily or twice-daily doses in iron-depleted young women. Blood 2015, 126, 1981–1989. [CrossRef]
89. Nemeth, E.; Ganz, T. Regulation of Iron Metabolism by Hepcidin. Annu. Rev. Nutr. 2006, 26, 323–342.
[CrossRef]
90. Rossi, E. Hepcidin—The iron regulatory hormone. Clin. Biochem. Rev. 2005, 26, 47.
91. Sangkhae, V.; Nemeth, E. Regulation of the Iron Homeostatic Hormone Hepcidin. Adv. Nutr. 2017, 8, 126–136.
[CrossRef]
92. Stoffel, N.U.; Cercamondi, C.I.; Brittenham, G.; Zeder, C.; Geurts-Moespot, A.J.; Swinkels, D.W.; Moretti, D.;
Zimmermann, M. Iron absorption from oral iron supplements given on consecutive versus alternate days
and as single morning doses versus twice-daily split dosing in iron-depleted women: Two open-label,
randomised controlled trials. Lancet Haematol. 2017, 4, e524–e533. [CrossRef]
93. Granick, S. Protein Apoferritin and Ferritin in Iron Feeding and Absorption. Science 1946, 103, 107. [CrossRef]
[PubMed]
94. Fuqua, B.K.; Vulpe, C.D.; Anderson, G.J. Intestinal iron absorption. J. Trace Elem. Med. Biol. 2012, 26, 115–119.
[CrossRef] [PubMed]
95. Peña-Rosas, J.P.; De-Regil, L.M.; Malave, H.G.; Flores-Urrutia, M.C.; Dowswell, T. Intermittent oral iron
supplementation during pregnancy. Cochrane Database Syst. Rev. 2015, 2015, CD009997. [CrossRef] [PubMed]
96. Galy, B.; Ferring-Appel, D.; Becker, C.; Gretz, N.; Gröne, H.-J.; Schümann, K.; Hentze, M.W. Iron Regulatory
Proteins Control a Mucosal Block to Intestinal Iron Absorption. Cell Rep. 2013, 3, 844–857. [CrossRef]
97. Cegarra, L.; Colins, A.; Gerdtzen, Z.P.; Nuñez, M.T.; Salgado, J.C. Mathematical modeling of the relocation of
the divalent metal transporter DMT1 in the intestinal iron absorption process. PLoS ONE 2019, 14, e0218123.
[CrossRef]Antioxidants 2020, 9, 645 16 of 16
98. Stoffel, N.U.; Zeder, C.; Brittenham, G.M.; Moretti, D.; Zimmermann, M.B. Iron absorption from supplements
is greater with alternate day than with consecutive day dosing in iron-deficient anemic women. Haematologica
2019, 105, 1232–1239. [CrossRef]
99. Lund, E.K.; Wharf, S.G.; Fairweather-Tait, S.J.; Johnson, I. Oral ferrous sulfate supplements increase the
free radical—Generating capacity of feces from healthy volunteers. Am. J. Clin. Nutr. 1999, 69, 250–255.
[CrossRef]
100. Lund, E.K.; Fairweather-Tait, S.J.; Wharf, S.G.; Johnson, I. Chronic exposure to high levels of dietary iron
fortification increases lipid peroxidation in the mucosa of the rat large intestine. J. Nutr. 2001, 131, 2928–2931.
[CrossRef]
101. Jaeggi, T.; Kortman, G.A.M.; Moretti, D.; Chassard, C.; Holding, P.; Dostal, A.; Boekhorst, J.; Timmerman, H.M.;
Swinkels, R.W.; Tjalsma, H.; et al. Iron fortification adversely affects the gut microbiome, increases pathogen
abundance and induces intestinal inflammation in Kenyan infants. Gut 2015, 64, 731–742. [CrossRef]
102. Paganini, D.; Uyoga, M.A.; Kortman, G.A.M.; Cercamondi, C.I.; Moretti, D.; Barth-Jaeggi, T.; Schwab, C.;
Boekhorst, J.; Timmerman, H.M.; Lacroix, C.; et al. Prebiotic galacto-oligosaccharides mitigate the adverse
effects of iron fortification on the gut microbiome: A randomised controlled study in Kenyan infants. Gut
2017, 66, 1956–1967. [CrossRef]
103. Di Meo, F.; Margarucci, S.; Galderisi, U.; Crispi, S.; Peluso, G. Curcumin, Gut Microbiota, and Neuroprotection.
Nutrients 2019, 11, 2426. [CrossRef] [PubMed]
104. Hibberd, M.C.; Wu, M.; Rodionov, D.A.; Li, X.; Cheng, J.; Griffin, N.W.; Barratt, M.J.; Giannone, R.J.;
Hettich, R.L.; Osterman, A.L.; et al. The effects of micronutrient deficiencies on bacterial species from the
human gut microbiota. Sci. Transl. Med. 2017, 9, eaal4069. [CrossRef] [PubMed]
105. Pivac, N.; Kim, B.; Nedic, G.; Joo, Y.H.; Kozaric-Kovacic, D.; Hong, J.P.; Mück-Šeler, D. Ethnic Differences in
Brain-derived Neurotrophic Factor Val66Met Polymorphism in Croatian and Korean Healthy Participants.
Croat. Med. J. 2009, 50, 43–48. [CrossRef] [PubMed]
106. Bus, B.A.; Molendijk, M.; Penninx, B.; Buitelaar, J.; Kenis, G.; Prickaerts, J.; Elzinga, B.; Voshaar, R.O.
Determinants of serum brain-derived neurotrophic factor. Psychoneuroendocrinology 2011, 36, 228–239.
[CrossRef]
107. Naegelin, Y.; Dingsdale, H.; Säuberli, K.; Schädelin, S.; Kappos, L.; Barde, Y.-A. Measuring and Validating
the Levels of Brain-Derived Neurotrophic Factor in Human Serum. Eneuro 2018, 5, 1–9. [CrossRef]
108. Polacchini, A.; Metelli, G.; Francavilla, R.; Baj, G.; Florean, M.; Mascaretti, L.G.; Tongiorgi, E. A method
for reproducible measurements of serum BDNF: Comparison of the performance of six commercial assays.
Sci. Rep. 2015, 5, 17989. [CrossRef]
109. Matrisciano, F.; Bonaccorso, S.; Ricciardi, A.; Scaccianoce, S.; Panaccione, I.; Wang, L.; Ruberto, A.; Tatarelli, R.;
Nicoletti, F.; Girardi, P.; et al. Changes in BDNF serum levels in patients with major depression disorder
(MDD) after 6 months treatment with sertraline, escitalopram, or venlafaxine. J. Psychiatr. Res. 2009,
43, 247–254. [CrossRef]
110. Mu, J.-S.; Li, W.-P.; Yao, Z.-B.; Zhou, X.-F. Deprivation of endogenous brain-derived neurotrophic factor
results in impairment of spatial learning and memory in adult rats. Brain Res. 1999, 835, 259–265. [CrossRef]
111. Tapia-Arancibia, L.; Aliaga, E.; Silhol, M.; Arancibia, S. New insights into brain BDNF function in normal
aging and Alzheimer disease. Brain Res. Rev. 2008, 59, 201–220. [CrossRef]
112. Piepmeier, A.; Etnier, J.L. Brain-derived neurotrophic factor (BDNF) as a potential mechanism of the effects
of acute exercise on cognitive performance. J. Sport Health Sci. 2015, 4, 14–23. [CrossRef]
113. Miranda, M.; Morici, J.F.; Zanoni, M.B.; Bekinschtein, P. Brain-Derived Neurotrophic Factor: A Key Molecule
for Memory in the Healthy and the Pathological Brain. Front. Cell. Neurosci. 2019, 13, 363. [CrossRef] [PubMed]
114. Shimada, H.; Makizako, H.; Doi, T.; Yoshida, D.; Tsutsumimoto, K.; Anan, Y.; Uemura, K.; Lee, S.; Park, H.;
Suzuki, T. A Large, Cross-Sectional Observational Study of Serum BDNF, Cognitive Function, and Mild
Cognitive Impairment in the Elderly. Front. Aging Neurosci. 2014, 6, 69. [CrossRef] [PubMed]
© 2020 by the authors. Licensee MDPI, Basel, Switzerland. This article is an open access
article distributed under the terms and conditions of the Creative Commons Attribution
(CC BY) license (http://creativecommons.org/licenses/by/4.0/).You can also read