Spatio-Temporal Trends of E-Bike Sharing System Deployment: A Review in Europe, North America and Asia - MDPI
←
→
Page content transcription
If your browser does not render page correctly, please read the page content below
sustainability

Review
Spatio-Temporal Trends of E-Bike Sharing System
Deployment: A Review in Europe, North America
and Asia
Nikolaos-Fivos Galatoulas 1,2 , Konstantinos N. Genikomsakis 2,3
and Christos S. Ioakimidis 2,3, *
 1    Department of Thermodynamics and Mathematical Physics, University of Mons, Boulevard Dolez 31,
      7000 Mons, Belgium; nikolaos-foivos.galatoulas@umons.ac.be
 2    European Research Area Chair (*Holder) ‘Net-Zero Energy Efficiency on City Districts, NZED’ Unit,
      Research Institute for Energy, University of Mons, Rue de l’Epargne, 56, 7000 Mons, Belgium;
      kgenikom@inteligg.com
 3    Inteligg P.C., Karaiskaki 28, 10554 Athens, Greece
 *    Correspondence: cioakim@inteligg.com

 Received: 27 April 2020; Accepted: 2 June 2020; Published: 5 June 2020

 Abstract: Recent data on conventional bike and/or electric bike (e-bike) sharing systems reveal that
 more than 2900 systems are operating in cities worldwide, indicating the increased adoption of
 this alternative mode of transportation. Addressing the existing gap in the literature regarding the
 deployment of e-bike sharing systems (e-BSSs) in particular, this paper reviews their spatio-temporal
 characteristics, and attempts to (a) map the worldwide distribution of e-BSSs, (b) identify temporal
 trends in terms of annual growth/expansion of e-BSS deployment worldwide and (c) explore the
 spatial characteristics of the recorded growth, in terms of adoption on a country scale, population
 coverage and type of system/initial fleet sizes. To that end, it examines the patterns identified from
 the global to the country level, based on data collected from an online source of BSS information
 worldwide. A comparative analysis is performed with a focus on Europe, North America and Asia,
 providing insights on the growth rate of the specific bikesharing market segment. Although the
 dockless e-BSS has been only within three years of competition with station-based implementations,
 it shows a rapid integration to the overall technology diffusion trend, while it is more established in
 Asia and North America in comparison with Europe and launches with larger fleet sizes.

 Keywords: e-bikesharing; exploratory data analysis; sustainable transportation; technology diffusion

1. Introduction
     Recent years have witnessed a rapid growth in the popularity of bikesharing systems (BSSs)
globally, in alignment with the urban transformations implied in the context of smart city planning,
where zones dedicated to pedestrian and public transportation access are adopted as a key measure
for decongestion, while BSSs provide a sustainable mobility alternative for densely populated city
centers [1]. Supported by technological advances over the years, including mobile technology, electronic
payment and GPS-enabled devices, BSSs have been overcoming many operational challenges to provide
fully automated, secure and cost-effective systems. Even though the BSS concept dates back to the
1960s, and despite the fact that less than 10 cities globally were operating such systems until the late
1990s [2], sharing systems based on conventional bikes and/or electric bikes (e-bikes), which in the latter
case are typically referred to as e-bike sharing systems (e-BSSs), have grown to more than 2900 systems
operating in cities worldwide, as of November 2019, according to the bikesharing map developed by
DeMaio and Meddin [3].

Sustainability 2020, 12, 4611; doi:10.3390/su12114611                      www.mdpi.com/journal/sustainability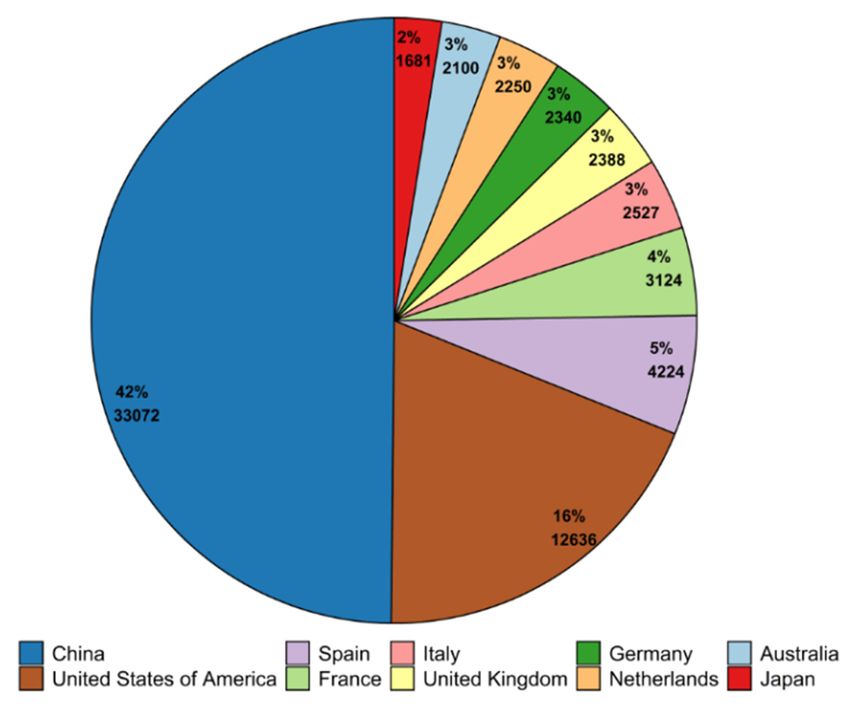
Sustainability 2020, 12, 4611                                                                      2 of 17

      To a significant extent, the success of BSSs, and later of e-BSSs over the past years, with both
dock-based (or station-based) and dockless (or free-floating) implementations, followed the
developments in station infrastructure, enabling automated electronic access to bikes/e-bikes,
smartphone technologies and fast credit card transactions. With an updated service point infrastructure,
main obstacles in the functionality of the system were overcome. Information on station locations,
vehicle availability or reservation on-demand, anti-theft and vandalism prevention, rapid payments
and member subscription programs comprise the main advancements that ensured an enhanced
and feature-rich system operability. On the one hand, real-time tracking of the vehicles through the
on-board installed GPS components and alarm systems aims to prevent theft and vandalism, while on
the other hand, it enables information technology (IT) solutions on the operators server side to guide
users into dedicated parking zones for avoiding congestion of bikes in central areas or suggest drop-off
locations that facilitate rebalancing via an application on users’ smartphones.
      Aiming to explore the adoption patterns of BSSs and their evolution over the past decades,
the authors in [4] combined quantitative and qualitative methods on data from operators in Europe
and North America and secondary sources (Internet, online surveys and reports) within the context
of diffusion innovation theory [5], which describes the rate of adoption of an innovation while it
spreads through social systems (urban societies), assuming that it is related to the gradual shifts on
the perception of the innovation’s characteristics. Their findings suggested that Europe was leading
in the adoption rate, while the deployment of BSSs in North America was gaining momentum and
expected to follow in investment. According to their timing in adopting a new technology, specific
groups can be defined based on the level of risk-taking and stage of adoption as to the maturity of
the innovation. Hence, diffusion innovation theory is suitable when analyzing the trends of e-BSS
deployment growth over different continents. In a similar direction, the work in [6] provided empirical
results on the dispersion of bikesharing innovation focusing on the BiciMAD system, which is the e-BSS
with electrically assisted bikes deployed in Madrid, based on a series of surveys among subscribers,
where the adopter profiles were categorized in four main segments, with cycling familiarity being the
main classification attribute. Criteria for selecting e-bikes for the e-BSS fleet are examined in [7].
      The paper in [8] presented the automated collection process of bikesharing data from 38 BSSs
located in Europe, the Middle East, Asia, Australasia and the Americas, in order to analyze the
temporal and spatial patterns, relationships and characteristics. The work in [2] reviewed the literature
in bikesharing from North America, Asia, Europe and Australia, covering a wide range of relevant
topics, such as growth, usage patterns, user preferences, demographics and barriers to bikesharing.
The study in [9] discussed the findings from the scientometric analysis of 208 articles on bikesharing,
revealing that the US, China, Canada, England and Australia are the most significant contributors in
this field of research, while identifying the underlying trend and increasing interest of the research
community in dockless BSSs. In this context, the authors in [10] employed an empirical analysis to
examine and compare the deployment of dock-based and dockless BSSs in China. The differences in
spatio-temporal usage patterns of dockless BSSs linking to metro stations were analyzed in [11], using
Shanghai, China as a case study. Similarly, spatio-temporal usage patterns of BSSs near rail transit
stations in Beijing, China were discussed in [12].
      Combining all the above, this paper addresses the gap in the literature regarding the deployment
of the e-BSS in particular, conducting a review of its spatio-temporal characteristics. To that end,
it examines the patterns identified from the global to the country level, based on data collected from an
online source of self-service automated, advanced automated and mixed automated/manned public
use BSSs worldwide [3]. A comparative analysis is performed with a focus on Europe, North America
and Asia. From the processing and visualization of the collected data, insights on the growth rate of
the specific bikesharing market segment can be revealed. To the best of the authors’ knowledge, the
present study comprises the first attempt to (a) map the worldwide distribution of e-BSSs, (b) identify
temporal trends in terms of annual growth/expansion of e-BSS deployment worldwide and (c) explore
the spatial characteristics of the recorded growth, in terms of adoption on a country scale, population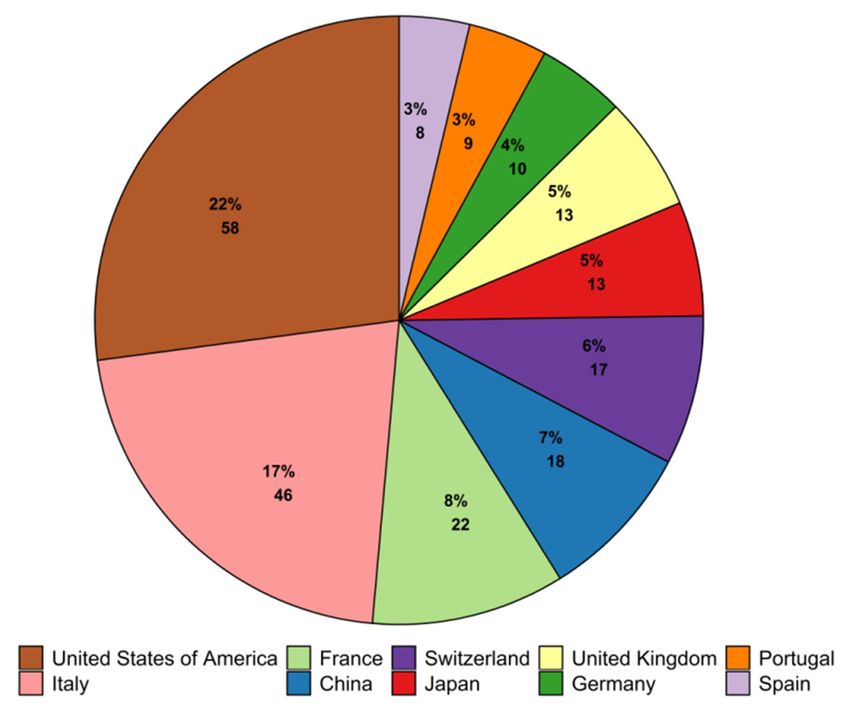
Sustainability 2020, 12, 4611                                                                         3 of 17

coverage and type of system/initial fleet sizes. From a scientific point of view, the contributions of
this paper include the analysis of spatial and temporal trends on e-BSS deployment in the context of
diffusion innovation theory, as well as the identification of relationships between the total e-BSS size
and population size of the cities in the regions under study, using linear regression modelling.
     The rest of this paper is organized as follows: Section 2 presents the methods employed for
the data collection, processing and analysis of the spatio-temporal relationships. Section 3 presents
the results obtained and provides an extensive discussion on the spatio-temporal trends of e-BSS
deployment in Europe, North America and Asia, while Section 4 underlines the main conclusions of
this work.

2. Materials and Methods

2.1. Data Collection
      The analysis of BSS data usually is performed on data released sporadically from operators, or by
supplied application programming interfaces (APIs), which enable external software developers to
access operator website generated data [8]. The aim of this analysis is to capture global trends regarding
the deployment of e-BSSs, through gathering and mapping the following information fields: city of
operation, launch date, number of e-bikes on initial stage of deployment, geographical coordinates,
number of stations, country of operation, continent, whether the system was previously a conventional
bikeshare and running a mixed fleet system.
      An open access online source containing information on BSSs worldwide, initiated by Paul
DeMaio in 2007 and maintained by Russell Meddin since 2009, namely The Bike-sharing Map
(www.bikesharingmap.com) [3], provides an extensive database for mining e-BSS locations, fleet and
station sizes along with launch dates and updates on operation status. Each entry of the database also
includes a field with the source describing the deployment of the system, e.g., news, and publications
on operators’ or public authorities’ websites, among others. The Bike-sharing Map is typically
employed for the purposes of relevant studies on the deployment of BSSs, as in [2,8,10]. In this context,
The Bike-sharing Map is employed for the purposes of this work as a suitable database containing
e-BSS deployment data for the three regions under study, namely Asia, Europe, and North America.
The website was accessed on November 2019, and a total of 2937 BSS information entries were processed
in the RStudio integrated development environment [13], employing software tools written in the R
programming language [14]. Data were initially acquired in KML format, and converted to formats
compatible with the processing software, resulting to four fields containing string values.

2.2. Data Treatment
       Upon retrieval, the dataset was filtered based on a string search for the terms “e-bike” or “pedelec”,
consequently, entries with mixed fleet compositions (bikes and e-bikes) were considered in the analysis,
leading to a dataset of 266 entries tallying 79,163 shared e-bikes. Geographical coordinates of system
locations were directly extractable from the mined dataset, by means of a string separator on the name
of city field, further distinguishing point coordinates as different columns (latitude, longitude) for
map visualization purposes and a reverse geolocation of the country and continent fields. In addition,
a string query on city names was applied in order to retrieve city population size data, therefore
completing the comparison on fleet size coverage ratios from the quota database. With the use of string
manipulation, launch dates were extracted and stored in a separate column, formatted accordingly.
It is important to mention that 19 entries (16 station-based, 3 dockless, with 10,923 e-bikes) were not
included in historical plots due to missing timestamp information, following a manual screening
process. In turn, city population quotas were retrieved via string matching with the world cities
dataset [15] and a control operation on coordinates, therefore certain locations were excluded from the
population coverage evaluation due to their exclusion from the queried dataset.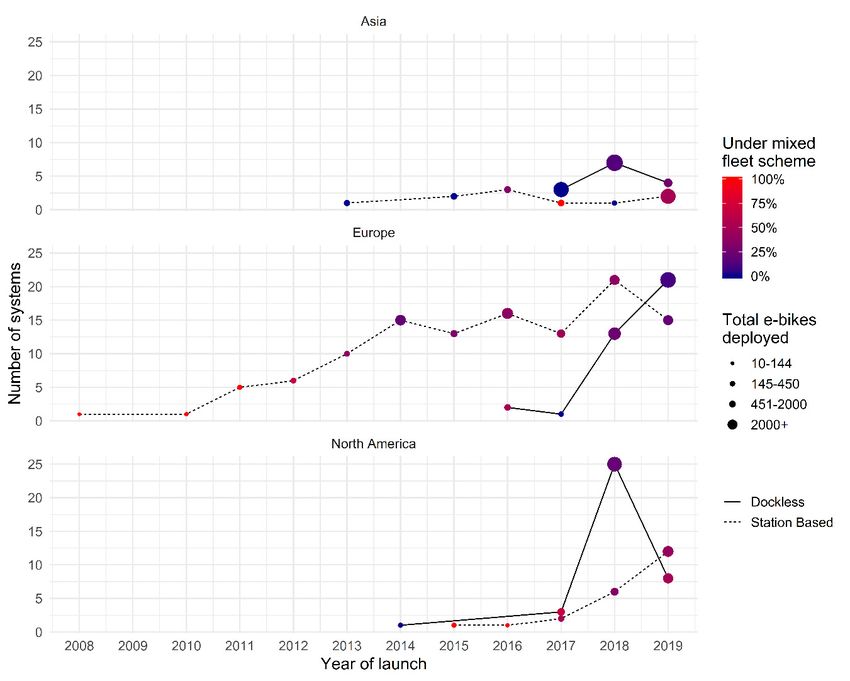
Sustainability 2020, 12, 4611                                                                          4 of 17

    For the purposes of this work, exploratory data analysis (EDA) is employed as a data analysis
method for summarizing the data so as to detect patterns, extract main characteristics and create
graphical representations using different parameters.

2.3. Linear Modelling
     Linear models, or regression models compare the distribution of a response variable (in this case
the total number of deployed e-bikes) or a characteristic of this distribution to that of an explanatory or
independent variable (city population). Statistical significance is evaluated by means of the p-test value,
indicating the suitability of the selected independent variable in the explanation of the variance in the
response variable. Both variable distributions were identified with rightward skewness, meanwhile,
the 95th percentile of the e-bike fleet size distribution was calculated at 1000 e-bikes, while for the city
distribution population, it was estimated at 8.2 million citizens. Population and e-BSS launch fleet size
values were both log-transformed on the base of 10, resulting in normally distributed variables, which
in turns enables a better visualization and facilitates the interpretation of the coefficient of correlation.
The hypothesis checked was whether population size is proportional to the roll-out fleet size, in other
words, if operators decided to launch a larger system depending on the city’s population.

3. Results and Discussion
     In this section, a description of the key similarities and differences among the e-BSSs recorded in
the database is attempted through exploratory data analysis and accompanying visualizations. It must
be mentioned that determining the exact e-BSS adoption trends is hindered by its inherent rapid growth
rate as well as the multiple data sources available. Moreover, the dataset refers to e-BSS launches,
therefore capturing a single instance of the systems’ state, while ridership data were unavailable.
Analyzing e-BSS launch data can be useful in understanding the strategic viewpoint of actors in the
e-BSS market, thereupon explaining their operative decisions and how they tailor their initial fleet size
depending on the intended installation.
     The structure of the analysis was designed to trace the diffusion characteristics from a worldwide
perspective to a breakdown per continent and further on the presentation of adoption leaders at the
national level, in terms of cumulative number of deployed systems and respective size, as well as
vehicle to population ratios and details on the largest systems reported in the data.

3.1. Global Outlook of E-BSS Deployment
     A global outlook on the uptake of e-bikes in bikesharing is explored in the present section.
An assessment of the temporal evolution of e-BSS is performed through an initial screening of the
primary dataset, containing both conventional and electrified fleet systems. The annual shares of
the number of system launches are distinguished upon their bikesharing system type, revealing the
gradual penetration of e-BSS compared with the established conventional bikesharing.
     Observing the recorded annual worldwide system deployments—note that 2019 is not fully
incorporated since entries are updated until November 2019 (Figure 1)—demonstrates the rapid growth
of bikesharing during the past decade, from a total of 20 new systems deployed in 2008 to 337 in 2018,
equivalent to an average annual growth rate of 39.6%. In Figure 1, BSSs offering both conventional
and electric bikes are classified as e-BSSs, representing a partial or full electrification of the bike fleet.
Focusing on the average annual growth rate of e-BSSs during the decade 2008–2018, it is estimated at
79.3%. Moreover, by the comparison of annual growth rates, three major milestones can be identified,
reflecting different innovation maturity stages concerning bikesharing technology. An abrupt increase
can be traced to the variation in figures from 2012 to 2013, with 59 systems (53 BSSs and 6 e-BSSs)
launching in 2012 compared with 135 in 2013 (124 BSSs and 11 e-BSSs), translating to a 129% increase
in deployment. Next, a deceleration can be observed from 2014 to 2015, reflecting the failure of third
generation bikesharing technology to convince in terms of operability and scalability, equivalent to
a 16% decrease. From 2015 till the peak observed in 2018, an increasing growth trend is recorded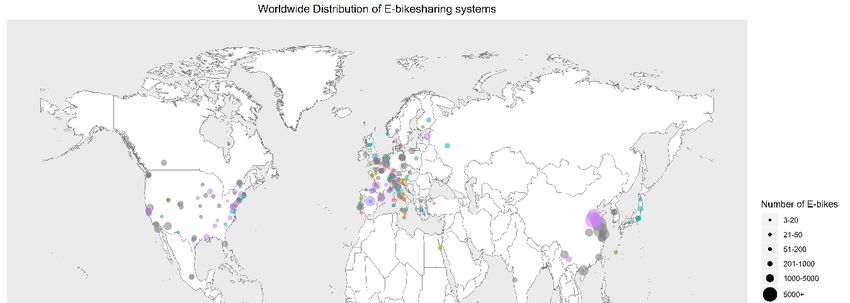
Sustainability 2020, 12, x FOR PEER REVIEW                                                                         5 of 17

Sustainability 2020, 12, 4611                                                                                      5 of 17
 the failure of third generation bikesharing technology to convince in terms of operability and
 scalability, equivalent to a 16% decrease. From 2015 till the peak observed in 2018, an increasing
 growthover
(139%     trend  is recorded
               three           (139%
                      years), with     over
                                     2018    three years),
                                          topping            with 2018
                                                     deployment         topping
                                                                     rates with adeployment
                                                                                    total of 337 rates
                                                                                                   systemswith(259
                                                                                                                a total
                                                                                                                    BSSsof
 337 systems
and   78 e-BSSs)(259  BSSs and
                   starting  their78operation
                                     e-BSSs) starting
                                                duringtheir
                                                          that operation
                                                                year. More during   that year.
                                                                             specifically,       More
                                                                                             e-BSSs      specifically,
                                                                                                       expanded     frome-
 BSSs
17     expanded
    launches        from
              in 2015  to 17 launches
                          78 in         in 2015 to 78 in
                                2018, corresponding     to2018,  corresponding
                                                           an almost               to anThe
                                                                       4-fold growth.     almost
                                                                                              latter4-fold growth.
                                                                                                      can be          The
                                                                                                              accounted
 latter
to      can be accounted
   the introduction           to thesystems
                       of massive     introduction
                                              in Chinaof and
                                                          massive   systems
                                                              the USA,   alonginwith
                                                                                 China    and the
                                                                                       dockless       USA, along
                                                                                                 bikesharing         with
                                                                                                                 gaining
 dockless bikesharing
acceptance    and persuading gaining    acceptance
                                 investors             and
                                            as a reliable      persuading
                                                           solution.         investors
                                                                      Interestingly,       as for
                                                                                      figures   a 2019
                                                                                                     reliable   solution.
                                                                                                          underline   the
 Interestingly,
potential         figures
            of e-BSSs      for 2019and
                       to scale-up     underline
                                          competethe withpotential    of e-BSSs
                                                            conventional    BSSs, to
                                                                                  sincescale-up
                                                                                          31.7% ofand    compete
                                                                                                      service        with
                                                                                                               launches
 conventional
(65  e-BSSs) wereBSSs,  since 31.7% of service launches (65 e-BSSs) were e-bike-based.
                     e-bike-based.

      Figure 1. Number of bikesharing systems (BSSs) launched worldwide from 2008 to 2019 with respect
       Figure 1. Number of bikesharing systems (BSSs) launched worldwide from 2008 to 2019 with respect
      to fleet type (conventional or electrified) along with the corresponding annual percentage shares.
       to fleet type (conventional or electrified) along with the corresponding annual percentage shares.

      Figure 2 maps the global distribution of the e-BSS locations based on the geographical coordinates
       Figure 2 maps the global distribution of the e-BSS locations based on the geographical
mined from the primary dataset. In accordance with the findings in [4], the majority of e-BSSs are
 coordinates mined from the primary dataset. In accordance with the findings in [4], the majority of
primarily located in Europe (59%) followed by the Americas (27%) and Asia (13.1%), while Egypt and
 e-BSSs are primarily located in Europe (59%) followed by the Americas (27%) and Asia (13.1%), while
Australia are the only countries from Africa and Oceania featured in the dataset. However, larger
 Egypt and Australia are the only countries from Africa and Oceania featured in the dataset. However,
fleets are met in Asia (35,963 e-bikes), where the adoption of the technology occurred at a later stage,
 larger fleets are met in Asia (35,963 e-bikes), where the adoption of the technology occurred at a later
on which fourth generation bikesharing technologies were developed with geo-tracking integrated
 stage, on which fourth generation bikesharing technologies were developed with geo-tracking
on the shared vehicles, allowing the operation and control of extended fleet coverage. Europe trails
 integrated on the shared vehicles, allowing the operation and control of extended fleet coverage.
with 25,564 shared e-bikes, while North America registered 13,894 e-bikes, evidencing that e-BSSs are
 Europe trails with 25,564 shared e-bikes, while North America registered 13,894 e-bikes, evidencing
diffused mainly on the North Hemisphere (95% of worldwide shared e-bike fleet). In total, 231 cities
 that e-BSSs are diffused mainly on the North Hemisphere (95% of worldwide shared e-bike fleet). In
were included in the dataset, with Europe leading in small station-based launches in contrast with
 total, 231 cities were included in the dataset, with Europe leading in small station-based launches in
North America and Asia, where larger scale launches were realized. The first record in the dataset is a
 contrast with North America and Asia, where larger scale launches were realized. The first record in
station-based e-BSS located in Monaco, launching in 2008 with 10 e-bikes in four stations as a mixed
 the dataset is a station-based e-BSS located in Monaco, launching in 2008 with 10 e-bikes in four
fleet scheme and operated by the local bus company, and thus can be credited as the longest running
 stations as a mixed fleet scheme and operated by the local bus company, and thus can be credited as
e-BSS in Europe.
 the longest running e-BSS in Europe.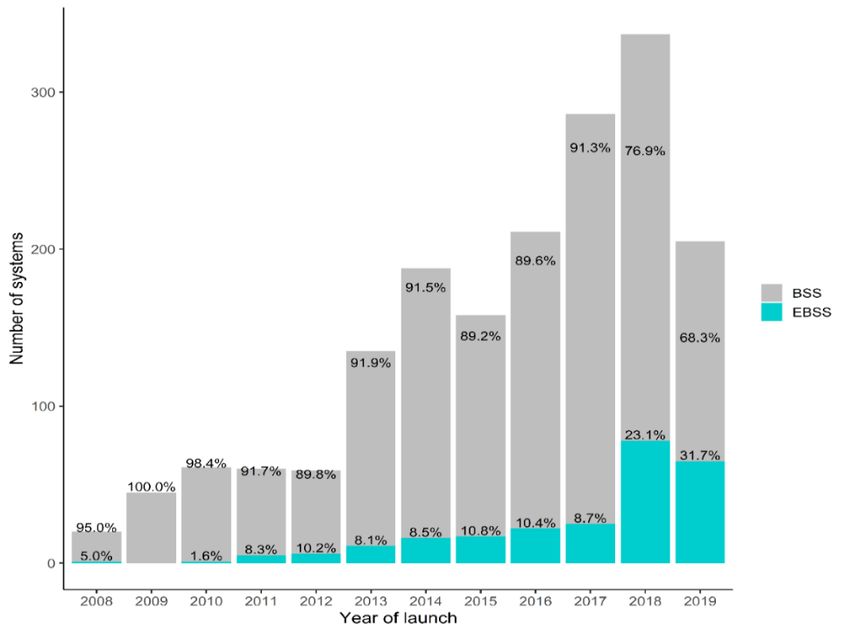
Since a global outlook on the uptake of e-BSSs has been provided in the previous section, it is
yet essential to detail the spatio-temporal trends per region. It can be noted that the e-BSS is becoming
a considerable alternative in bikesharing as proven by the respective shares of launches per system
type worldwide, specifically during the past two years. Large-scale deployments infer higher initial
capital investment
Sustainability costs when contrasted with conventional BSSs, and when considering the average
2020, 12, 4611 6 of 17
market purchase value of an e-bike in relation to that of a regular bike.
Figure Visualizationofofthe
2. Visualization
Figure 2. thedistribution
distribution
of of electric
electric (e)-BSSs
(e)-BSSs on on global
global scale,
scale, datadata mined
mined fromfrom
The
The Bike-sharing
Bike-sharing MapMap
basedbased on reported
on reported entries
entries till November
till November 20192019 (Source:
(Source: [3]).[3]).
3.2. Analysis per Region
Investigating the rate of e-BSS diffusion, an initial step is to record the global overall trend in
annual Since a global
system outlook
launches. Toon theend,
this uptake
Figureof e-BSSs
3 detailshasthe
been provided
number of newin the previous
systems section,
per year it is yet
in Europe,
essential to detail
North America andthe spatio-temporal
Asia, as well as thetrends
overallper region. Ittrend.
worldwide can be noted
All curvesthat the e-BSS
resemble is becoming
a sigmoid curve,a
considerable alternative in bikesharing as proven by the respective shares of
in accordance with the key feature of innovation diffusion theory [5], and thus a delayed adoption launches per system type
worldwide,
during the firstspecifically during the
years, followed by past twogrowth.
a rapid years. Large-scale
Breaking down deployments infer higher
the deployment rate initial capital
per region, it
investment
can be observedcosts that
when contrasted
Europe withinitiative
held the conventional BSSs, and
in adoption when
for the considering
first thethe
five years till average market
concept was
purchase
spread tovalueAsia ofandanone
e-bike in relation
year to that America.
later to North of a regular In bike.
fact, the overall trend coincides with the
Investigating
European the rate
market until 2013,ofalthough
e-BSS diffusion,
the uptakean initial step is shared
of electrified to record thefleets
bike global
wasoverall trendThe
reluctant. in
annual system launches. To this end, Figure 3 details the number of new systems
delayed entry of the two other key regions contributed to the global average annual growth rate of per year in Europe,
North
e-BSSsAmerica and Asia,
for the period as well aswhere
2014–2017, the overall worldwide
the European trend.presented
market All curvesvariations
resemble aand sigmoid curve,
instability.
in accordance
However, with of
the level thesystem
key feature of innovation
launches diffusion theory
remained relatively [5], and
low in both thus acharacteristic
regions, delayed adoptionof the
during the first years, followed by a rapid growth. Breaking down the deployment
delayed adoption of e-BSSs. Impressively, the increase in the cumulative number of system launches rate per region,
it
incan be observed
North that Europe
America traced held thetrend
the European initiative in adoption
in 2018, taking off fore-BSSs
the first five years
to 23.1% till bikesharing
of new the concept
was spread
systems to Asia
in that and
year. Theone year later in
differences to diffusion
North America.
patternsInper fact, the overall
region can betrend coincidesinwith
summarized the
the European market until 2013, although the uptake of electrified shared
following statements: Europe led the adoption in the first years when bikesharing technology was bike fleets was reluctant.
The
still delayed entry
in the third of the two
generation other
and key regions
gradually contributed
transitioning to the
to the global
fourth, withaverage
a stableannual growth
diffusion rate
pattern
of e-BSSs for the period 2014–2017, where the European market presented
till 2018; Asia since 2015 is establishing the fourth generation bikesharing technology, remaining variations and instability.
However, the level of system launches remained relatively low in both regions, characteristic of the
delayed adoption of e-BSSs. Impressively, the increase in the cumulative number of system launches
in North America traced the European trend in 2018, taking off e-BSSs to 23.1% of new bikesharing
systems in that year. The differences in diffusion patterns per region can be summarized in the
following statements: Europe led the adoption in the first years when bikesharing technology was still
in the third generation and gradually transitioning to the fourth, with a stable diffusion pattern till
2018; Asia since 2015 is establishing the fourth generation bikesharing technology, remaining hesitant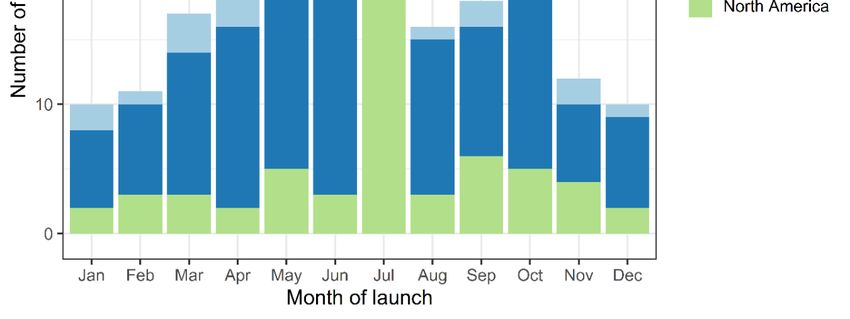
75.8% for Europe.
       An important contribution to the e-BSS expansion was marked by large actors in vehicle sharing
 schemes, for instance, Forever-Gonbike in Asia launched seven systems during 2017–2018,
 representing a high share of the innovation’s diffusion (average 56% of overall deployments in Asia)
 alongside 2020,
Sustainability public12, investment,
                          4611        while Uber, Jump and Lime in North America were responsible for        7 ofthe
                                                                                                                  17
 launch of 29 systems in the three-year period 2017–2019 (average 52% of overall deployments in
 North America), signifying the shift from the innovator stage to the early adoption phase of the
in the large-scale
 technology               integration
                 and attempting     toof e-bikes;
                                       gain        meanwhile,
                                            a pivotal placementNorth     America
                                                                   in leading      is presenting
                                                                              the e-BSS          a clear
                                                                                         landscape.      diffusion
                                                                                                    In Europe,   the
pattern,   boosting    the   e-BSS uptake.  Since 2019 is not fully included, all average
 market appears more fragmented with the large multinationals playing a minor part in      annual growth  rates are
                                                                                                             e-BSS
calculated     till 2018,
 diffusion along      with  corresponding  to 230% for North America, 58.3% for Asia and 75.8% for Europe.
                              smaller operators.

      Figure 3. Diffusion curve of e-bike sharing systems: comparison of number of new systems per year in
      Figure 3.North
      Europe,   Diffusion  curve
                     America,    of e-bike
                               Asia        sharing
                                     and the       systems:
                                             worldwide      comparison of number of new systems per year
                                                        trend.
      in Europe, North America, Asia and the worldwide trend.
      An important contribution to the e-BSS expansion was marked by large actors in vehicle sharing
       In terms
schemes,          of the number
            for instance,            of e-bikes,
                           Forever-Gonbike       inlarge  players dominated
                                                    Asia launched                the during
                                                                     seven systems    annual 2017–2018,
                                                                                                 percentagerepresenting
                                                                                                               shares of e-
a high share of the innovation’s diffusion (average 56% of overall deployments in Asia) alongsideregions.
 BSS  deployment      during   the past  three    years with   massive  roll-outs  over   the  three   examined      public
 In detail, 72%
investment,       of shared
               while          e-bikes
                      Uber, Jump    and deployed     globally
                                          Lime in North        in 2017were
                                                             America    were  attributedfor
                                                                            responsible     to athe
                                                                                                  large operator,
                                                                                                    launch           mainly
                                                                                                             of 29 systems
 Forever-Gonbike
in                     with 2017–2019
   the three-year period     62%. This (average
                                            is repeated
                                                      52%inof2018,   where
                                                               overall       71% of shared
                                                                       deployments      in Northe-bikes     globally
                                                                                                    America),          were
                                                                                                                 signifying
 rolled-out   by  a large  operator,   in  this case  with   respective  shares  distributed     more
the shift from the innovator stage to the early adoption phase of the technology and attempting to gain smoothly     among
aoperators,   while in 2019,
  pivotal placement             this percentage
                         in leading                 dropped toIn30%.
                                      the e-BSS landscape.          Europe, the market appears more fragmented
       Aiming    to examine    in detail  the  technical   characteristics
with the large multinationals playing a minor part in e-BSS diffusion      of e-BSSalong
                                                                                      deployments,
                                                                                             with smallera disaggregation
                                                                                                              operators.
 of the
      In diffusion
          terms of thecurves   presented
                          number              abovelarge
                                     of e-bikes,      is pursued
                                                            players upon   three exploratory
                                                                     dominated                      variables (Figure
                                                                                  the annual percentage                  4).
                                                                                                                  shares of
 Firstly,
e-BSS      the total number
        deployment     during theof e-bikes
                                     past threedeployed     as an
                                                   years with      indicator
                                                                massive       of the
                                                                         roll-outs oversystem’s
                                                                                           the threesize, then a variable
                                                                                                       examined     regions.
 capturing
In detail, 72%whether   a specific
                  of shared         system
                              e-bikes         is operating
                                       deployed     globallya in
                                                               mixed
                                                                  2017shared   fleet and finally
                                                                       were attributed              a variable
                                                                                            to a large  operator,indicating
                                                                                                                     mainly
 the type of vehicle
Forever-Gonbike         sharing
                      with   62%.(dockless      or station-based).
                                     This is repeated                 The latter
                                                           in 2018, where    71%comprises
                                                                                   of shared the      mainglobally
                                                                                                  e-bikes    technological
                                                                                                                      were
 attribute  distinguishing    the  operating    model    followed   by e-BSS  operators,    in the
rolled-out by a large operator, in this case with respective shares distributed more smoothly among meantime     providing
operators, while in 2019, this percentage dropped to 30%.
      Aiming to examine in detail the technical characteristics of e-BSS deployments, a disaggregation
of the diffusion curves presented above is pursued upon three exploratory variables (Figure 4). Firstly,
the total number of e-bikes deployed as an indicator of the system’s size, then a variable capturing
whether a specific system is operating a mixed shared fleet and finally a variable indicating the
type of vehicle sharing (dockless or station-based). The latter comprises the main technological
attribute distinguishing the operating model followed by e-BSS operators, in the meantime providing
a quantified comparative basis for the assessment of the innovation diffusion between the third
generation bikesharing counterposed with the fourth generation technology.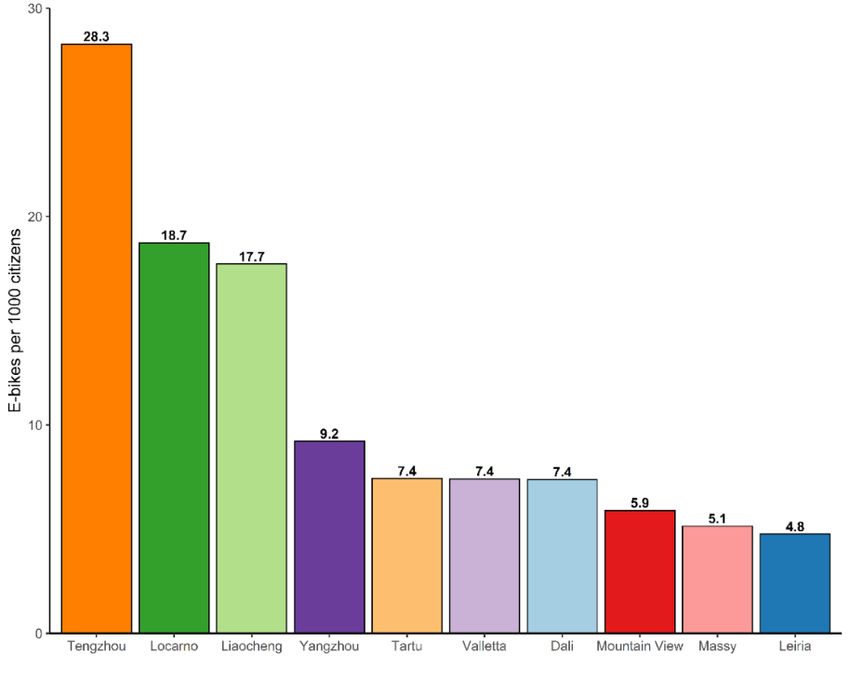
in late 2019. What is notable in the case of the dockless e-BSS is its rapid integration to the overall
 technology diffusion trend, only within three years of competition with station-based
 implementations. Specifically, the recorded average annual growth rate from 2014 to 2019 for
 dockless e-BSSs was 200%, whereas for station-based e-BSSs, it was 18%. Nevertheless, the overall
 growth of station-based remains positive since from 2008 to 2019, it corresponded to a 60.7% annual
Sustainability 2020, 12, 4611                                                                     8 of 17
 growth rate.

     Figure
      Figure 4.  Diffusion curve
              4. Diffusion  curveofofe-BSS:
                                      e-BSS:comparison
                                             comparison  ofof
                                                            thethe number
                                                                 number     of system
                                                                        of system     deployments
                                                                                   deployments      per year
                                                                                                per year      by
                                                                                                         by type
     type  (station-based   or dockless) and  region, color  gradient scale denoting the percentage of
      (station-based or dockless) and region, color gradient scale denoting the percentage of roll-outsroll-outs
     operating
      operatingaamixed
                   mixedfleet.
                           fleet.

      As a general observation, it can be supported that the dockless e-BSS is more established in Asia
      Regarding the inclusion of e-bikes in mixed fleet sharing schemes, the data revealed that in
and North America in comparison with Europe and launches with larger fleet sizes (mean 465) than
 Europe, where e-BSS adoption was engaged earlier than the other regions, e-bikes were initially
station-based e-BSSs (mean 166). The first dockless e-BSS launched in Cincinnati, Ohio in 2014 with
 offered as an additional vehicle option in conventional BSSs until 2012, when the first exclusively
a fleet size of 102 e-bikes, prior to its wide establishment from 2016 and onwards. Cross-examining
 electrified e-BSS launched in Predazzo, Italy. The gradient scale in Figure 4 describes the percentage
the evolution of fleet type annual percentage shares on the global scale, in the last two years, the
dockless e-BSS has gained a significant share since its introduction. In particular, 47 out of 78 total
e-BSS deployments were dockless in 2018, in contrast to 7 out of 25, in 2017. The pattern proceeds till
November 2019, where 34 out of 67 e-BSSs were dockless bikeshares. Elaborating these findings per
region and taking into account the respective fleet sizes for the period during which both types coincide
(2016–2019), in Europe, dockless e-bikes deployed constituted 13% in 2016 and reached 78% of total
e-bikes deployed in 2019, in Asia, e-BSS fleets were mainly composed (98%) of dockless e-bikes till 2019
when the trend reversed and the respective recorded shares were 15% dockless and 85% station-based,
meanwhile in North America, a 70% fraction at the end of 2017 dropped to 45% in late 2019. What is
notable in the case of the dockless e-BSS is its rapid integration to the overall technology diffusion
trend, only within three years of competition with station-based implementations. Specifically, the
recorded average annual growth rate from 2014 to 2019 for dockless e-BSSs was 200%, whereas for
station-based e-BSSs, it was 18%. Nevertheless, the overall growth of station-based remains positive
since from 2008 to 2019, it corresponded to a 60.7% annual growth rate.
      Regarding the inclusion of e-bikes in mixed fleet sharing schemes, the data revealed that in Europe,
where e-BSS adoption was engaged earlier than the other regions, e-bikes were initially offered as
an additional vehicle option in conventional BSSs until 2012, when the first exclusively electrified
e-BSS launched in Predazzo, Italy. The gradient scale in Figure 4 describes the percentage of systems,
regardless of docking type, operating under a mixed fleet scheme with their respective launch year.
It can be derived from the first years of e-BSS launches in Europe, that the implementations were
Sustainability 2020, 12, x FOR PEER REVIEW 9 of 17
Sustainability 2020, 12, 4611 9 of 17
of systems, regardless of docking type, operating under a mixed fleet scheme with their respective
launch year. It can be derived from the first years of e-BSS launches in Europe, that the
mainly foreseen aswere
implementations mixed fleet schemes,
mainly foreseen similar
as mixed tofleet
North America.
schemes, In addition,
similar to Northstation-based schemes
America. In addition,
supplying
station-baseda mixed
schemesfleet supplying
are more favorable thanare
a mixed fleet dockless schemes. than dockless schemes.
more favorable
Another
Anotherfactor
factorforfore-BSS
e-BSSdeployment
deployment unraveling
unraveling further
further details onon
details thethe
temporal
temporal characteristics of
characteristics
the diffusion
of the waswas
diffusion thethe
monthly
monthly seasonality
seasonalityof of
launches
launches perperregion.
region.Figure
Figure5 5presents
presentsthe thenumber
numberof of
e-BSS deployments per region by month of launch. It is evident that summer
e-BSS deployments per region by month of launch. It is evident that summer months are the most months are the most
preferredfor
preferred forthe
thelaunch
launchofofan ane-BSS
e-BSS(40%).
(40%). This
This can
can bebe accounted
accounted to to certain
certain aspects,
aspects, such
such as
as the
the
seasonalcharacter
seasonal characterofofbikesharing
bikesharing due
due to to
thethe dependence
dependence of ridership
of ridership fromfrom weather
weather conditions,
conditions, the
the fact
fact the
that thatstudied
the studied
regionsregions are located
are located in the in the Northern
Northern HemisphereHemisphere
and theand aimthe aim of operators
of operators to attractto
attract
also also tourists
tourists in orderin toorder to accelerate
accelerate their roll-out
their service service roll-out
plan. Inplan.
detail,InJuly
detail, Julya holds
holds a 17%trailed
17% share, share,
trailed
by June by Juneand
at 16% at 16%
Mayand May The
at 10%. at 10%. The distribution
distribution for Asia for Asia is uniform
is uniform withfrom
with a peak a peak fromtoMarch
March June,
to June, however,
however, the number theofnumber
entries of entries
is only 24, is
inonly 24, in
Europe, theEurope,
peak is the peak is
recorded inrecorded
June within32June without
entries 32
entries
of out of 153 aresembling
153 resembling a normal distribution,
normal distribution, while
while for North for North
America, anAmerica,
abrupt peakan abrupt peakout
(21 e-BSSs (21ofe-
BSSs
59) out of in
appears 59)July,
appears
with intheJuly, with themonths
remaining remaining months
trailing, trailing,
therefore therefore concentrating
concentrating a lower
a lower preference
preference
for for deployment.
deployment.
Figure 5. Number of e-BSS deployments per region by month of launch, as an indicator for
Figure 5. Number of e-BSS deployments per region by month of launch, as an indicator for
deployment seasonality.
deployment seasonality.
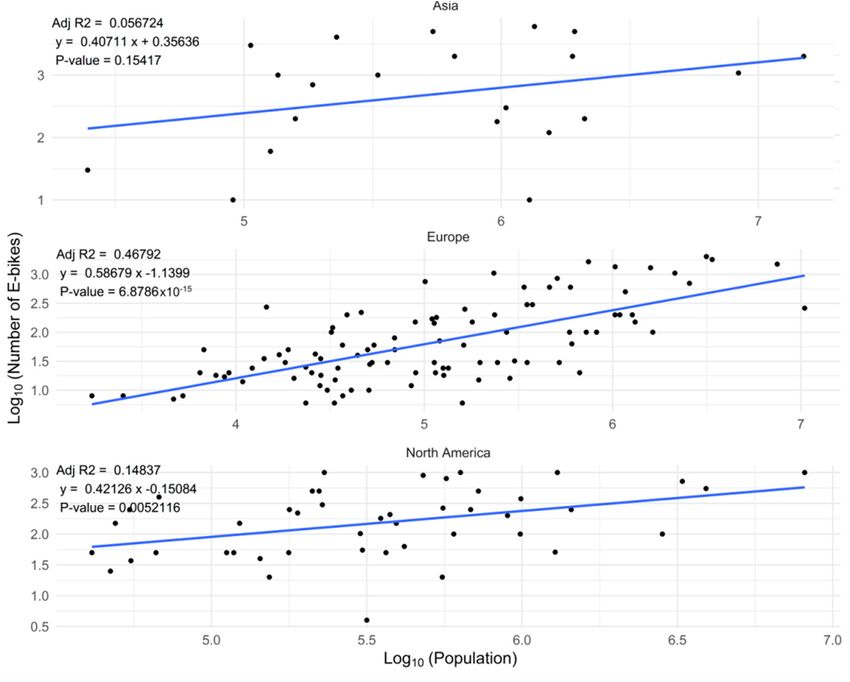
Within the context of discovering the underlying motives for e-BSS diffusion and launch fleet sizing
Within the context of discovering the underlying motives for e-BSS diffusion and launch fleet
as a function of population, a linear regression model is applied on each region between the logarithms
sizing as a function of population, a linear regression model is applied on each region between the
of population size and the logarithm of the number of e-bikes deployed. This log transformation is
logarithms of population size and the logarithm of the number of e-bikes deployed. This log
motivated from assuming a non-linear relationship for the compared variables. Additionally, capturing
transformation is motivated from assuming a non-linear relationship for the compared variables.
the correlation between these variables can provide useful arguments for validating the assumption
Additionally, capturing the correlation between these variables can provide useful arguments for
that cities with larger populations will necessarily require larger fleet coverage. In this direction,
validating the assumption that cities with larger populations will necessarily require larger fleet
Figure 6 demonstrates the resulting plots with their respective fitted linear regression curves. Clearly,
coverage. In this direction, Figure 6 demonstrates the resulting plots with their respective fitted linear
a low correlation (0.0567) pinpoints the inadequacy of the fitted curve to describe the relationship
regression curves. Clearly, a low correlation (0.0567) pinpoints the inadequacy of the fitted curve to
between the data points from Asia, suggesting that a polynomial relationship could improve the
describe the relationship between the data points from Asia, suggesting that a polynomial
regression model’s accuracy. By comparing the strengths of correlation, attempting to model the
relationship could improve the regression model’s accuracy. By comparing the strengths of
relationship between population and fleet size fails to score a reasonable adjusted R squared value
correlation, attempting to model the relationship between population and fleet size fails to score a
for Asia, therefore contradicting the initial hypothesis. Nevertheless, the assumption is confirmed for
reasonable adjusted R squared value for Asia, therefore contradicting the initial hypothesis.Nevertheless, the assumption is confirmed for the remaining two regions with calculated correlations
higher than the results presented for the early stages of the bikesharing technology diffusion in [4].
Specifically, the previous study focusing on the diffusion of public BSSs over a 15-year timespan
(1998–2012)
Sustainability presented
2020, 12, 4611 a 0.1994 R value for 55 BSSs in Europe and 0.1315 for 19 BSSs in 10
2 North
of 17
America. The respective values estimated in this study were 0.4679 for 97 e-BSSs in Europe and 0.1484
on 45 e-BSSs in North America. Although these coefficients are relatively low to suggest a strong
the remaining
correlation two regions
between with calculated
the examined correlations
variables, higher
it has to be than thethat
mentioned results
citiespresented
recordingformore
the early
than
stages of the bikesharing technology diffusion
one system were aggregated on a common population value.in [4].
Figure 6. Comparison of the logarithm of total e-BSS fleet size versus the logarithm of population size
Figure 6. Comparison of the logarithm of total e-BSS fleet size versus the logarithm of population size
for cities in Europe, North America and Asia with the corresponding linear regression coefficients.
for cities in Europe, North America and Asia with the corresponding linear regression coefficients.
Specifically, the previous study focusing on the diffusion of public BSSs over a 15-year timespan
3.3. Deployment on Country Scale 2
(1998–2012) presented a 0.1994 R value for 55 BSSs in Europe and 0.1315 for 19 BSSs in North
Deployment
America. trendsvalues
The respective at the continental
estimated inlevel revealed
this study weredifferences
0.4679 forin97average
e-BSSs inannual
Europe growth rates
and 0.1484
between the three regions with the highest incorporation in the dataset,
on 45 e-BSSs in North America. Although these coefficients are relatively low to suggest a strongnonetheless, an exploration
of the magnitude
correlation between ofthe
theexamined
trends onvariables,
a countryitscale
has toallows the inference
be mentioned of therecording
that cities contribution
moreofthan
specific
one
e-bike markets.
system It is expected
were aggregated on a common that major drivers
population in the adoption of e-BSSs will be the largest
value.
bikesharing markets with an established cycling tradition. A normalization on population size serves
3.3. Deployment
as the weightedoncomparative
Country Scalestandard for the appeal of e-BSS technology, as well as the growth
potential in the studied
Deployment trends atlocation. Furthermore,
the continental this analysis
level revealed can in
differences highlight
average specific deployment
annual growth rates
features in
between thefiner
threeresolution.
regions with the highest incorporation in the dataset, nonetheless, an exploration of
Aiming toofexplore
the magnitude the on
the trends characteristics
a country scale of the innovation
allows diffusion
the inference of theatcontribution
the nationaloflevel, Figure
specific 7a
e-bike
illustrates the top 10 countries in the adoption of e-BSS based on the number
markets. It is expected that major drivers in the adoption of e-BSSs will be the largest bikesharing of entries per countries
in the dataset
markets with an registering
establishedat least six launched
cycling tradition.systems, and Figureon
A normalization 7bpopulation
depicts thesizetop serves
10 ranking of
as the
countries based on the percentage breakdown of e-bikes deployed during
weighted comparative standard for the appeal of e-BSS technology, as well as the growth potential the examined period.
Indicatively,
in the studiedItaly which Furthermore,
location. holds the second this biggest
analysisshare of deployed
can highlight e-BSSs
specific (17% with features
deployment 46 entries)
in
would have
finer resolution.been overrepresented if the analysis was performed solely on the absolute number of
systems as in the results presented in [10]. The corresponding share is attributed
Aiming to explore the characteristics of the innovation diffusion at the national level, Figure 7a to an extensive
deployment
illustrates theoftopmostly third generation
10 countries systemsofwhich
in the adoption e-BSSwere
basedsmall-scale
on the number station-based
of entries(up
pertocountries
20 bikes
fleet) and operating in small cities, in contrast with the large fourth generation
in the dataset registering at least six launched systems, and Figure 7b depicts the top 10 ranking deployments met in
Chinese large cities or the US [16]. When the ranking is based on the
of countries based on the percentage breakdown of e-bikes deployed during the examined period. percentage breakdown of e-
Indicatively, Italy which holds the second biggest share of deployed e-BSSs (17% with 46 entries) would
have been overrepresented if the analysis was performed solely on the absolute number of systems
as in the results presented in [10]. The corresponding share is attributed to an extensive deployment
of mostly third generation systems which were small-scale station-based (up to 20 bikes fleet) andSustainability 2020, 12, 4611 11 of 17
operating in
Sustainability small
2020, 12, xcities, in contrast
FOR PEER REVIEWwith the large fourth generation deployments met in Chinese
11large
of 17
cities or the US [16]. When the ranking is based on the percentage breakdown of e-bikes deployed
bikes
during deployed duringperiod
the examined the examined period
(Figure 7b), (Figure
China 7b),the
records China records
largest share the largest share
of available of available
e-bikes on e-BSS
e-bikes
launches on(42%)
e-BSS followed
launches by(42%)
thefollowed
USA (16%). by the USA (16%).
Combining theCombining
above, anthe above,e-BSS
average an average
launche-BSS
fleet
launch
size perfleet size per
country can country can bewith
be estimated estimated withofthe
the values values
1837 of 1837
e-bikes e-bikes for
per system perChina
systemandfor218
Chinafor
and 218 for
the USA. the USA.
However, thisHowever, this number
number hinders hinders the
the extraction of aextraction of a rigid
rigid conclusion conclusion
on the diffusiononof the
diffusion
technology ofdue
thetotechnology
the omissiondueofto the omission
important of important
historical parameters historical parameters
concerning the stagesconcerning the
of bikesharing
stages of bikesharing
technology’s evolutiontechnology’s evolution
(more reluctant (more reluctant
and small-scale and small-scale
deployments preferred deployments preferred
during the first years
during the first years
of the diffusion) of the diffusion) and traits
and spatio-demographic spatio-demographic
such as tailoring traits
the such as fleet
launch tailoring
size the launch
to the fleet
intended
size to the metropolitan
location’s intended location’s metropolitan
area and population.area and population.
(a)
(b)
Figure 7. Top
Top 10 e-bike
e-bike sharing countries: (a)
(a) percentage
percentage breakdown
breakdown and
and number
number of of e-BSSs
e-BSSs deployed
deployed
by country, and (b) percentage breakdown
breakdown andand number
number ofof e-bikes
e-bikes deployed
deployed in
in e-BSSs
e-BSSs by
by country.
country.
A common trend can be attributed to the USA and China regarding adoption patterns,
specifically, both enter the e-BSS landscape after fourth generation products reach the market and
from 2017 onwards show a tendency in launching large-scale (>1000 bikes fleet) dockless systems.
This temporal pattern is reflected in almost every facet of Figure 5, where at least one large-scaleSustainability 2020, 12, 4611 12 of 17
A common trend can be attributed to the USA and China regarding adoption patterns, specifically,
both enter the e-BSS landscape after fourth generation products reach the market and from 2017
onwards show a tendency in launching large-scale (>1000 bikes fleet) dockless systems. This temporal
pattern is reflected in almost every facet of Figure 5, where at least one large-scale dockless e-BSS
appears on the map after 2017. Italy and Switzerland comprise the main leaders in the early adoption
stages since 2012 and 2010, respectively [17], while China and the USA are the main areas of e-BSS
deployment in recent years. The latter reflects the shift in the e-bikesharing technology innovation,
from an early period when the Italian company Bicincitta engaged a wide deployment campaign
throughout rural areas, offering a demo third generation system for small-scale applications [18], to the
emergence of key innovation leaders (it cannot be considered as an exaggeration to coin the term
fifth generation for the ongoing service schemes offered from Chinese bikesharing companies [9]) in
the form of private funded initiatives combined with governmental subsidies enacted later in the
implementation phase.
Driven by the roll-out strategy experienced in the Chinese e-bike sharing market and in line with
the latest demands of the fourth generation of bikesharing, companies in the USA decided to engage on
aggressive roll-outs of dockless e-BSSs with free floating e-bikes accessible at major densely populated
cities, with each stakeholder offering his own built-in technology and pricing policy [19]. This transition
can be linked with the market placement of large mobility-on-demand providers (i.e., Uber) through
the purchase of bike tech companies (Jump Bikes), therefore permitting larger-scale campaigns and
higher initial capital investments.
Ranking the top 10 performing cities on the e-BSS fleet size to population ratio was performed
solely on city populations cross-validated with the city population dataset. Importantly, the results
(Figure 8) were scaled on e-bike availability per 1000 citizens for the purposes of comparability with
previous studies. It can be noted that Tengzhou, China ranks in first place with 28.3 e-bikes per
1000 citizens, along with four other Chinese cities (i.e., Liaocheng third, Yangzhou fourth and Dali
seventh), followed by Locarno, Italy with 18.7 e-bikes per 1000 citizens. Highly performing European
cities are also Tartu, Estonia and Valetta, Malta, with their rate computed from only one system serving
small populations in both cities, i.e., 750 e-bikes deployed in Tartu and 50 e-bikes in Valetta, whereas
Chinese cities with 15 entries tallying 32,340 e-bikes present a more reliable figure. For example, the
US market, which is highly incorporated in the population quota dataset with 43 entries, recorded
two top-ranking cities with 5.9 and 5.1 e-bikes per 1000 citizens over an average country level of 1.
In contrast, Italy, the second most represented country in terms of the number of systems (i.e., 28 in
Figure 7a) in the population quota database, ranked 20th in country averages, at a 0.5 ratio. Hence,
in contrast with the rankings in Figure 7, the analysis from the population coverage suggests that
leaders in number of deployed systems would not necessarily land a position in the highest ranks of
population coverage due to the rate’s sensitivity to low population values.
Table 1 lists the largest e-BSSs included in the dataset, describing their launch date, number of
e-bikes, number of docking stations, operator, population in millions and total BSS fleet size of all
systems available within the studied location. Values for the last data field were extracted from an
online source with live data on bikesharing from 300+ cities [20]. The largest recorded roll-out was
5000 e-bikes in two Chinese cities, namely Yangzhou and Shunyang, while in Europe, the largest
roll-outs are recorded for Madrid (BiciMAD around 2000 e-bikes, launched 2014), Amsterdam (Urbee
1150 e-bikes, launched 2016), Brussels (Uber 1200 dockless e-bikes, started in 2019) and Milan (BikeMi,
1000 e-bikes, launched 2016). A dockless e-BSS in San Diego was the largest roll-out for North
America, where the most frequent value for initial fleet size was 500. Evidently, larger systems launch
in Chinese cities, while flexible access to shared e-bikes (dockless shared fleet) is more favored for
large-scale deployments.recorded two top-ranking cities with 5.9 and 5.1 e-bikes per 1000 citizens over an average country
level of 1. In contrast, Italy, the second most represented country in terms of the number of systems
(i.e., 28 in Figure 7a) in the population quota database, ranked 20th in country averages, at a 0.5 ratio.
Hence, in contrast with the rankings in Figure 7, the analysis from the population coverage suggests
that leaders2020,
Sustainability in number
12, 4611 of deployed systems would not necessarily land a position in the highest13
ranks
of 17
of population coverage due to the rate’s sensitivity to low population values.
Figure 8. Top 10 performing cities in terms of total number of e-bikes deployed in e-BSS to population ratio.
Figure 8. Top 10 performing cities in terms of total number of e-bikes deployed in e-BSS to population
ratio. Table 1. Top 10 e-BSS included in the analyzed dataset (November 2019 data).
Total BSS Fleet
Number Number Population
City of Operation Launch Date Operator Size
of E-Bikes of Stations (Millions)
(All Systems) [20]
Yangzhou,
1 November 2017 5000 Dockless Forever GonBike 4.4 20,000
Jiangsu, China
Shuyang, Suqian,
8 September 2018 5000 Dockless Forever GonBike 1.9 5000
Jiangsu, China
Public Bicycle
Liaocheng, China 4 April 2019 4060 370 5.7 5000
Service
Public Bicycle
Tengzhou, China 14 May 2019 3000 Dockless 0.8 3000
Service
Madrid, Spain 23 June 2014 2030 165 BiciMAD 3.2 2430
Shanghai, China 1 May 2017 2000 Dockless Forever GonBike 23.7 180,000
Sydney, Australia 7 November 2018 2000 Dockless Lime 4.4 3000
Brussels, Belgium 25 April 2019 1200 Dockless Jump/Uber 1.0 8242
Amsterdam, The
23 December 2016 1150 25 Urbee 2.3 3150
Netherlands
Milan, Italy 13 November 2016 1000 280 BikeMi 8.2 15,000
Hangzhou, Public Bicycle
12 January 2018 1000 Dockless 21.1 23,794
Zhejiang, China Service
San Diego,
15 February 2018 1000 Dockless Lime 1.4 15,000
California, USA
Suizhou,
1 May 2018 1000 Dockless Forever GonBike 2.5 24,891
Hubei, China
Dali, Yunnan, China 1 June 2018 1000 Dockless Forever GonBike 0.1 n/a
Barcelona,
30 June 2018 1000 Dockless Scoot 1.8 5229
Catalonia, Spain
In Hangzhou, a Chinese city that alone accounts for almost one million shared bicycles, a new
system launched in January 2018 which introduced 1000 e-bikes in the district of Binjiang that run
on a large removable battery. The difference is that these batteries are stored and charged in a
separate solar-powered vending machine at each station. As an effect, users can still choose between a
conventional or e-bike, but without the responsibility of carrying and maintaining the battery [21].
The opposite principle applies in the case of the envisioned e-BSS for Stockholm, where a fleet of
“hybrid bikes” will be rolled out with members carrying the responsibility for charging a battery that
is compatible with the vehicle and receiving it upon subscription. Aiming to lower the cost of theSustainability 2020, 12, 4611 14 of 17
membership fees, the city authorities reached an agreement with the system operator for allocation of
advertising space in privileged locations [22].
3.4. Discussion
The results in the previous sub-sections revealed the diversity of e-BSS adoption patterns
depending on the examined scale. Mainly, the technology has spread to three regions, namely Europe,
North America and Asia, being initiated in Europe and with short delays arriving in the other continents.
The temporal evolution of e-BSSs compared to conventional BSSs demonstrates the gradual penetration
of electrified fleet deployments throughout three stages, firstly as a pure innovation followed by an
early adoption period (stabilized on 9% of total bikesharing launches) and lately as an established
transportation solution. In fact, in the last two years, e-BSSs comprise almost one quarter on average of
all BSS roll-outs worldwide.
In terms of system fleet size, China and USA constitute the key market leaders in e-BSS deployment.
Other cases of large-scale systems have been launched also in large cities in Europe and Australia with
dockless e-BSSs gaining popularity in contrast to station-based implementations. City population
presents a positive correlation with launch fleet size, validating the hypothesis that deployment decisions
vary depending on scale. According to the findings presented in Figure 6, Europe demonstrates a
statistically significant relationship between initial fleet size and targeted city population, whereas
in Asia and North America, large-scale systems are launched in cities with a population over
100,000 citizens.
The dynamics of the deployment trends observed point that the peak in the e-BSS diffusion curve
has not yet been reached. Bikesharing remains a considerable micro-mobility solution with e-bikes
bearing the potential to extend the technology’s scalability, also confirmed by the rapid diffusion rate
presented in the analysis. The maturity of BSS adoption in a city’s transportation plan facilitates and
motivates the transition or the integration of e-BSSs. It becomes clear that fully characterizing the
diffusion patterns of the e-BSS technology requires the inclusion of key categorical predictors and
quantitative variables, for example, utilization patterns, budget considerations, mobility plans, level of
established cycling culture, public or private operator model, selected payment system (impeding or
not flexible vehicle acquisition) and trip costs. However, the purpose of implementing a BSS on each of
the cities recorded in the database was beyond the scope of this study.
Tracing the deployment characteristics at the country level, multiple aspects were explored,
such as top adopters according to percentage breakdown of the number of e-BSSs, total fleet size
compared with the global fleet size, system size to population ratio and the largest systems recorded
in the database. After a close examination of the results presented in Figures 7 and 8, as well as in
Table 1, China undoubtedly drives e-BSS adoption followed by the USA, in alignment with the rapid
diffusion rate of the BSS technology. In addition, e-BSS deployment in these countries is also influenced
from the presence of an innovation competition that attracts more operators into planning future
implementations or pursuing to introduce the technology to new locations in order to achieve a market
advantage. At this point, it is noted that a permit is necessary for an operator to deploy a system in a
city, thus deployment trends are subject to local transport policy and regulation.
Importantly, the degree of e-BSS expansion on an urban scale is impacted by the competition
with other vehicle sharing technologies apart from conventional BSSs, such as e-scooter rental/sharing
systems or ridesharing depending on the service level of micro-mobility demand. Especially, in cities
where alternative micro-mobility schemes have established their presence within the transportation
landscape, this hinders the appeal of an e-BSS roll-out for a prospective operator. Recent studies
comparing ridership patterns between scooter sharing schemes and BSSs in cities where both are
offered revealed that shared bikes were mostly used for commuting while shared scooters for recreation
in Washington D.C. [23], and that scooter sharing exhibits an increased utilization rate on a smaller fleet
size than BSSs in Singapore, although over a significantly lower total daily usage [24]. Notwithstanding
this, the large-scale integration of micro-mobility schemes is beneficial for transport systems, such asYou can also read