The untapped potential of niche commodity value chain A perspective of the rabbit industry - An analysis of the South African aquaculture market ...
←
→
Page content transcription
If your browser does not render page correctly, please read the page content below
ISSUE 85 | MAY 2021

                 The untapped potential of
            niche commodity value chain A
          perspective of the rabbit industry

The rise of South African maize
in the international markets

An analysis of the South
African aquaculture market
and opportunities
FOREWORD
Welcome to the eighty-fifth (85th) issue of the Trade Probe publication produced under the Markets and
Economic Research Centre (MERC) of the National Agricultural Marketing Council (NAMC). This issue aims
at providing a detailed analysis of the current trade issues within South Africa and its trading partners. Over the
past year, South Africa has concluded various trade protocols to expand its export footprint in the international
markets.. There it is important to assess the untapped potential of South Africa’s exports. Therefore, this
Trade Probe Issue focus on examining the untapped potential of niche commodity value chains such as the
rabbit product. The rise of South African maize in the international markets; An analysis of the South African
aquaculture market and opportunities; and Opportunities making AGOA work for Africa: Untapped potential.
The publication’s main objective is to inform policymakers, producers, traders and other stakeholders about
trending agricultural trade issues and provide information on market opportunities and potential products
demanded in the local and international markets.

REPORT STRUCTURE

Trade Analysis
1. The untapped potential of niche commodity value chains; A perspective of the rabbit
   industry
2. The rise of South African maize in the international markets
3. An analysis of the South African aquaculture market and opportunities
4. Making AGOA work for Africa: Untapped potential

Trade Opportunities
5. Market analysis for sisal (HS: 560721)
6. SACU trade analysis and its potential
7. South Africa has positive prospects to further export grapes, wine, oranges and nuts

Trade News
8. AfCFTA is a key instrument in post-COVID-19 recovery
9. The African Continental Free Trade Agreement (AfCFTA): What has South Africa actually offered Africa?
10. Making the AfCFTA and the RECs work

                                              CONTRIBUTORS:
                                               Dr Sifiso Ntombela
                                               Mr Lindikaya Myeki
                                              Mr Thabile Nkunjana
                                               Mr Lucius Phaleng
                                               Ms Onele Tshitiza
                                               Dr Moses Lubinga
                                              Ms Fezeka Matebeni

2                                           TRADE PROBE ISSUE 85 - MAY 2021
TRADE ANALYSIS
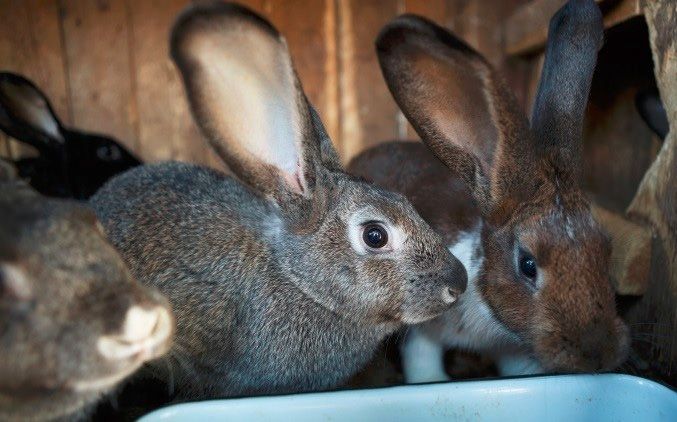
The untapped potential of niche commodity value chains: A
perspective of the rabbit industry
By Moses H Lubinga
Background What is known about the rabbit industry?
With the fast-growing global population, there is Although commercial rabbit farming has been
increasing pressure on natural resources as the practised in South Africa for about a decade or
human race works towards ensuring that the food so, the industry is still in its infancy with a need for
system continues to meet the burgeoning demand. further support. Rabbit meat and live rabbits are the
However, one of the key challenges in ensuring that major products produced by the industry. There are
all people are food secure is the reliance on a few crop
several rabbit processed meat products available,
and animal value chains as food sources. Moreover,
including rabbit meat pies, rabbit meatloaf and
in some cases, the few currently being explored are
sausages. The excrement (droppings & urine) from
characterised by being highly commercialised, and
hutches (rabbit cages) is a very good type of manure,
the cost of entry for emerging value chain actors
(producers, processors, traders) is also exorbitantly rich in many nutrients required for crop farming.
high, coupled with other non-monetary barriers to Rabbit meat has high nutritional value, although it
entry, including strict market standards. continues to be considered for rural usage or limited
to ethnic groups in some countries. Rabbit meat
Nevertheless, many other value chains with has a very low-calorie content per serving but with
opportunities for food production, job creation, a high concentration of protein. The meat has lower
inclusive growth of both youth and women, and cholesterol, fat and sodium as compared to other
fewer barriers to entry, which possibly require less meat types.
investment in land and financial resources than
commercialised value chains, are accorded little or Due to its health properties, with the World
no attention. This situation has rendered such value Health Organisation describing rabbit meat as the
chains to become underdeveloped and left to be
healthiest due to its high protein and low-fat content,
underutilised. To fulfil the food demand for a growing
the meat is now trending, especially in Europe and
population, it is important to find different means of
Asia. The uniqueness and high demand for rabbit
food production, and rabbit meat production is one
meat present enormous potential for the industry’s
of those, given that it is a great source of protein.
further growth if well supported. In South Africa, the
If well supported, developed and well utilised, the domestic consumption of rabbit meat is still low but
industry presents enormous potential to the extent with an increasing trend due to increasing consumer
that it can relieve the pressure mounting on the awareness about its benefits.
poultry industry in a quest to produce more chicken
meat. Thus, this article aims at providing insights
into South Africa’s rabbit industry and the export
potential of rabbit meat.
Author:Dr. Moses Lubinga is a senior economist
under the Trade Research Unit at the National
Agricultural Marketing Council. He can be contacted
at hlubinga@namc.co.za or (012) 341 1115.
TRADE PROBE ISSUE 85 - MAY 2021 3
TRADE ANALYSIS

South Africa’s trade in rabbit meat                        How much untapped export potential exists for
South Africa is a net exporter of rabbit meat, and         rabbit meat?
according to Thulo (2020), about 80 % of the rabbit        The global rabbit meat industry still has large
meat produced is exported while the other proportion       untapped export potential. Germany, France, and
(20%) is consumed domestically. Between 2016 and           Belgium are the top three markets with the greatest
2020, the value of rabbit meat exports exponentially       export potential, which presents South Africa’s
increased from R0.249 million to R2.306 million. An        industry with an opportunity to tap into international
increase in the volume of rabbit meat exported is          markets while also increasing the domestic market.
one of the key drivers of the observed exponential         In Hong Kong and Qatar, where South Africa’s rabbit
growth. Twenty-eight (28) tons of rabbit meat were         meat has established a footprint, the untapped export
exported in 2020 as compared to only four (4)              potential is estimated at US$ 180 thousand and US$
tons exported in 2016. The volume of rabbit meat           71 thousand, respectively. In Hong Kong, South
exported in 2020 alone is much more than the total         Africa’s rabbit meat is bound to face stiff competition
volume (17 tons) exported between 2016 and 2019            from supplies originating/sourced from France,
(Trade Map, 2021). Another contributing factor was         Belgium and Hungary, among other countries, due
the increase in the global prices of rabbit meat. In       to the economies of scale in the volume of exports.
2020, the price of rabbit meat was about R82,352           In addition, these countries have well-developed
per ton and this was the highest price in the past         rabbit industries, unlike South Africa. According to
five-year period. The price increase was equivalent        the International Trade Centre (ITC, 2021), France
to 119 % and 471 % compared to the 2018- and               already surpassed her rabbit meat export potential in
2019-unit prices, respectively. Thirdly, South Africa’s    Hong Kong by slightly over US$ 80 thousand while
market diversification for the product was also a very     Belgium and Hungary exhibit US$ 17.3 thousand
strong contributing factor. Unlike in all the previous     and US$ 37 thousand untapped export potential,
years during which rabbit meat was destined for            respectively. In Qatar, rabbit meat from South Africa
countries within Southern Africa, including Lesotho,       is bound to compete with that from France, China,
Botswana, Mozambique and Angola, in 2020, all the          Spain, Belgium, Hungary and the Netherlands. The
meat was exported outside of Africa. Sixty per cent        Netherlands exhibits the highest untapped trade
(60 %) of rabbit was exported to Hong Kong while           potential, valued at about US$ 728 thousand, but
the other 40% went to Qatar (Trade Map, 2021).             actual exports made so far are worth US$ 4300 only.
Despite the afore-mentioned drastic increase in the        All the other countries mentioned above (except
volume of rabbit meat exports, its percentage share        Spain) have not yet had market access into Qatar
in the country’s category of similar products (meat)       for rabbit meat, which leaves South Africa in a better
remained very negligible (0 %).                            position to further affirm its footprint in Qatar before
                                                           the afore-mentioned global competitors gain access
                                                           into the market.

4                                           TRADE PROBE ISSUE 85 - MAY 2021
TRADE ANALYSIS

Conclusion
The rabbit industry is still underdeveloped and underutilised despite its potential in contributing towards food
security, job creation, and poverty alleviation with less financial and land investment if compared with the
requirements to establish any of the existing commercialised agricultural value chains. Notwithstanding the
challenges faced by producers and exporters in the industry, a drastic increase in the volume and value of
rabbit meat exports has been recorded in the recent past. Moreover, individual export firms have diversified
into better paying new markets in Asia and the Middle East, unlike the traditional markets within Southern
Africa. Based on the untapped export potential in the new markets (Hong Kong and Qatar), it is commendable
that exporters of rabbit meat consider expanding their footprint in Qatar before other key global suppliers
(e.g., France, China, …) of rabbit meat gain access into this market. South Africa should also explore gaining
access into other countries in Eastern and Western Asia (e.g., Oman, Saudi Arabia). Europe is to a great
extent dominated by suppliers within the European Union, which makes it harder to penetrate this market,
unlike other countries’ markets. There is also a need to further support the emerging rabbit meat industry in
South Africa.

                                           TRADE PROBE ISSUE 85 - MAY 2021                                     5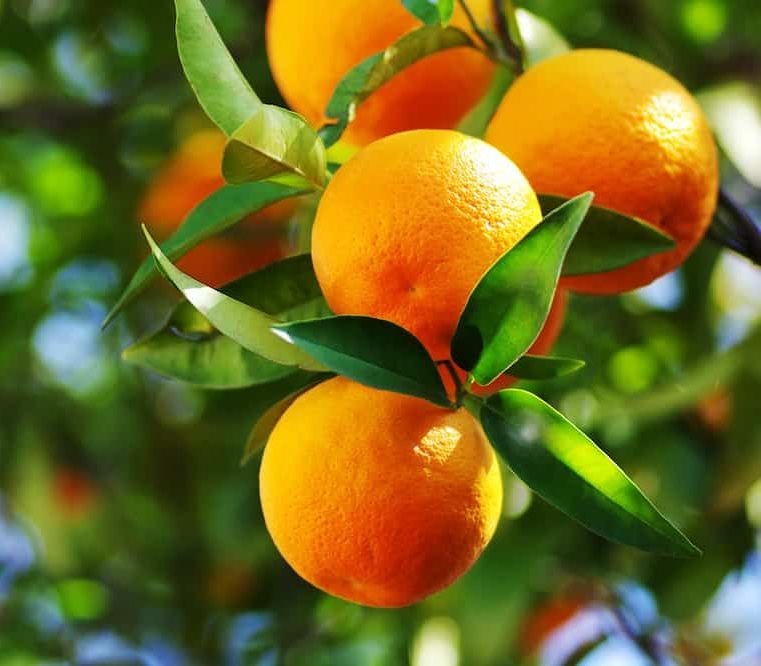
TRADE ANALYSIS
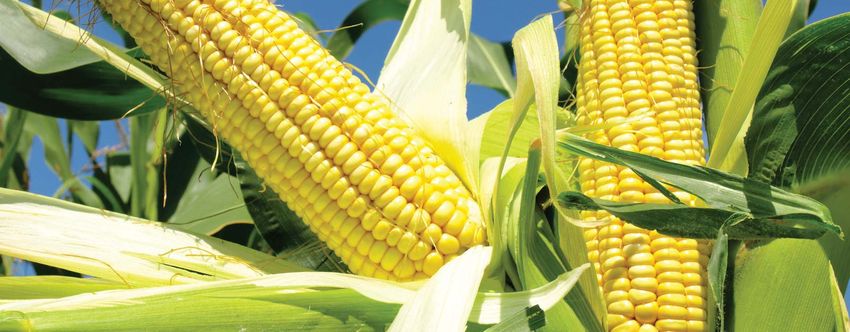
The rise of South African maize in the international markets
By Ms Fezeka Matebeni
The state of global maize production
Maize is one of the most important food crops in the The latest global production estimates indicates
world and, together with rice and wheat, provides at that the current harvest will reach a record high of 1
least 30 % of the food calories to more than 4.5 billion 192.3 million tons. Even country’s like South Africa is
people in 94 developing countries (Shiferaw et al., expecting a bumper harvest on maize underpinned
2011). The role of maize for human consumption, by good weather. Internationally, countries such
expressed in terms of the share of calories from all as USA, Brazil, China, Ukraine and Argentina are
staple cereals, varies significantly across regions. expecting good harvest (USDA, 2021). The positive
Maize is also a key ingredient in animal feed and world maize production growth is fuelled by good
is used extensively in industrial products, including yields with a global average measured at 179.5
biofuels. Maize is currently produced on nearly 100 bushels per acre. The good yields are underpinned
million hectares in 125 developing countries and by generally good weather in many regions
is among the three most widely grown crops in 75 producing maize. Table 1 shows that state of maize
countries (FAOSTAT, 2010). production in the world.
Table 1: Supply and demand of maize (million tons)
World Opening stocks Production Imports Total supply
2019/20 est. 326.2 1,124.8 174.2 1,451.0
2020/21 f’cast 296.8 1,140.1 185.3 1,436.8
2021/22 proj. 271.2 1,192.3 183.9 1,463.5
(268.2) (1192.6) (186.8) (1460.9)
Source: IGC (2021)
Table 2 shows maize consumption around the globe. The actual human (food) consumption of maize is
somewhat lower than the figures for industrial and feed usage, which could be due to waste from the milling,
by removing some of the outer layers of bran, which is generally used as animal feed. Maize is a staple in
the African continent, where the consumption ranges from 52 to 328 g/person/day and the continent of the
Americas where the highest consumption has been 267 g/person/day in countries such as Mexico. Of the
total 1199.3 million tons produced in 2021/2022 season, the animal feed will account for 716.9 million tons,
followed by industrial and food use at 307.7 and 132.4 million tons, respectively
6 TRADE PROBE ISSUE 85 - MAY 2021
TRADE ANALYSIS

Table 2: World consumption of maize
 World        Use (million tons)
              Food                       Industrial                  Feed                       Total
 2019/20      129.2                      293.4                       692.2                      1,154.2
 2020/21      131.1                      299.5                       695.7                      1,165.6
 2021/22      132.4                      307.7                       716.9                      1,199.3
Source: IGC (2021)

South African maize status quo
The Crop Estimates Committee (CEC), (NAMC, 2021) reported that the South African maize will improve
to 17.6 million tons which is larger than the previous season. The latest estimates released in June 2021, is
1% higher than the previous crop estimates reported in April 2021. The country is set to hit another bumper
harvest at the back of good weather and increased area under plantation.

In terms of maize price, the producer price of yellow and white maize for March 2021 was R3 323/ton and
R3 222/ton, respectively, compared with R3 128/ton and R2 658/ton, respectively, for March 2020 (SAFEX,
2021). The increase in prices can be attributed to the increased international maize prices due to higher
demand, especially from China.

                                         TRADE PROBE ISSUE 85 - MAY 2021                                    7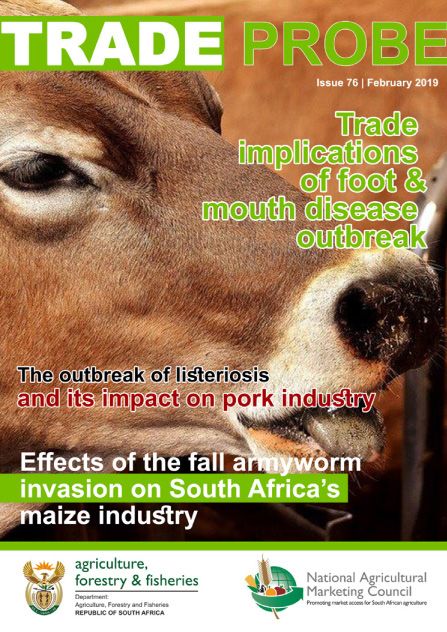
TRADE ANALYSIS

Figure 1: South African maize prices
Source: SAFEX (2021)

Africa’s largest maize producer is once again set to regain its status as a net exporter of maize. Maize is the
largest locally produced field crop and the most important source of carbohydrates in the SADC region for
animal and human consumption. The increasing maize production in South Africa has enable the country to
increase it exports to the region (e.g. SADC) and into new markets in Asia. The increasing demand for maize
in Asian countries such as China is expanding the South Africa maize footprint.

Conclusion
Maize is an important crop that provides nutritional value for both humans and animals across the globe.
The constantly growing demand internationally is opening new market opportunities for South Africa and
other maize producing countries in the region. In South Africa, maize is staple food that constitute a large
weight in the food basket and it is important that government increased its support to the industry to expand
production.

Author: Ms Fezeka Matebeni is an economist under
the Agro- Food Chain Unit at the National Agricultural
Marketing Council. She can be contacted at
fmatebeni@namc.co.za or (012) 341 1115.

8                                                  TRADE PROBE ISSUE 85 - MAY 2021
TRADE ANALYSIS
An analysis of the South African aquaculture market and opportunities
								                                                                                            By Thabile Nkunjana

Broadly, aquaculture is the farming of aquatic              While domestic fish production has improved
animals such as finfish, crustaceans and molluscs,          over time (see Figure 2), it is still overwhelmingly
to mention a few, and aquatic plants using or within        below the industry’s full potential. The country
freshwater, seawater, brackish and inland saline            remains a net importer for aquaculture products
water. Nonetheless, the scope of this article will          such as Salmo trutta and other as reported by the
be limited to aquatic animals, largely tilapia. From        International Trade Centre (ITC, 2021) data. Part of
a global perspective, aquaculture production has            the industry’s underperformance can be linked to
rapidly increased over the past 28 years, recording         constraints such as limited access to water, under-
an increase of more than 527 %, according to the            technology development appropriate for specific
Food and Agriculture Organization (FAO) of the              species like trout, which constitute the largest share
United Nations. This increase is in response to a           of freshwater production (FAO, n.d.), and high
significant rise in fish consumption globally. In 2018,     transactional costs, to mention a few.
inland aquaculture, i.e. rivers, lakes and fish farm
production, accounted for at least 62 % of the farmed       Domestic market at a glance
food fish (FAO, 2021). About 89 % of farmed aquatic         South Africa’s aquaculture is generally not a big
fish production between 2000 and 2018 originated            market for various reasons. Firstly, fish harvesting
from China, India, Indonesia, Vietnam, Bangladesh           and/or production previously has been dominated
and Egypt.                                                  by the coastal areas, meaning that fish consump-
                                                            tion could have been more concentrated in these ar-
Historically, the aquaculture industry is one of the        eas to a larger extent, hence the market. Secondly,
oldest sectors in South Africa, beginning in the            most South Africans (largely black) are not fish-eat-
1670s in the Western Cape and Eastern Cape                  ing households, which might be prevalent in rural
according (FAO, n.d.). Since then, the industry grew        provinces. As a result, consumption is not reflected
significantly until 1990, when it stabilised, before        in the country’s population; thus, fish farming busi-
picking up again in 2018. Griffiths et al. (2010) stated    nesses can be unsustainable if not well positioned
that South Africa has a relatively small aquaculture        in the market. However, this trend is increasingly
industry made up of abalone, mussels, oysters               shifting due to rising incomes and rising positive
and prawns. In recent years, a rise in freshwater/          perceptions of fish consumption. As a result, fish
brackish fish farming has also been observed,               production started increasing in 2018 (see Figure
especially trout, tilapia, catfish and carp. Tilapia or     2. Additionally, the rising population in big cities and
saltwater tilapia has noticeably increased mainly           townships is adding to this growing market.
due to its traits, including its high breeding abilities
and fast growth compared to other species.

                                                                    Author: Mr. Thabile Nkunjane is an Junior economist
                                                                    under the Agro-Food nit at the National Agricultural
                                                                    Marketing Council. He can be contacted at
                                                                    tnkunjane@namc.co.za or (012) 341 1115.

                                             TRADE PROBE ISSUE 85 - MAY 2021                                               9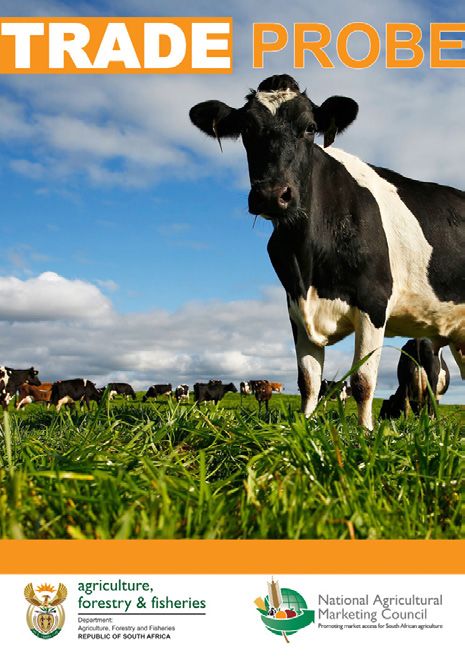
TRADE ANALYSIS

Figure 2: South Africa’s aquaculture production
Source: FAO (n.d.)

The Sub-Saharan Africa (SSA) region is said to           Namibia increased their exports by 488 % and 155
be consuming much lower quantities of fish when          %, respectively. For imports, Rwanda increased its
compared to the rest of the world. The FAO states        tilapia imports by 5 050 % (from 2 tons in 2014 to
that SSA, on average, only consumed around 8.9 kg        103 tons in 2019), followed by Zambia at 41 500
of fish per capita compared to an estimated 20.5 kg      % (from 20 tons in 2014 to 8 320 tons in 2019),
consumed across the globe in 2018.                       Namibia at 292 % (from 26 tons in 2014 to 102 tons
                                                         in 2019), and Malawi at 240 % (from 125 tons in
Figure 3 presents tilapia (030271) trade across          2014 to 426 tons in 2019). South Africa was the only
Africa between 2012 and 2019. Even though various        country with data for 2020 available from ITC when
aquaculture species are produced across the              this article was written. The country’s tilapia exports
region, this section will only focus on the trade in     increased by 8 950 % between 2012 and 2020, from
tilapia. A general picture is that tilapia consumption   30 tons in 2012 to 2 715 tons in 2020. Malawi was
and production are significantly growing in Africa.      the largest market destination for tilapia exports from
Between 2012 and 2019, for example, imports grew         South Africa, with over 2 000 tons during the 2020
by 15 561 % (from 60 tons in 2012 to 9 397 tons          marketing season, which is in line with the FAO’s
in 2019), while exports grew by 6 736 % (from 138        predictions on the rising fish demand in Africa.
tons in 2012 to 9 435 tons in 2019). Uganda and

10                                         TRADE PROBE ISSUE 85 - MAY 2021
TRADE ANALYSIS
Figure 3: Tilapia (030271) trade across Africa between African countries
Source: Trade Map, 2021
Concluding remarks
Globally, the total fish trade has noticeably increased Aquaculture is expected to rise by 48 % in Africa
over the past two decades, registering an increase during the next decade, driven by demand and
of 38 % in value terms to US$164 billion. By 2030, capacity-building across the region. While factors
aquaculture production is expected to increase such as water might limit South Africa aquaculture
to 109 million tons from 26 million tons in 2018; production to a certain degree, and because the
this represents an increase of 32 % (FAO, 2021). country is not necessarily a fish-eating country
Domestically, there is no precise data that can be compared to other African countries, the SSA as a
used to draw a clear picture of fish consumption region presents a good opportunity for fish farmers
and production, but there are some glimpses of a in South Africa. Moreover, developed parts of the
positive trend. From the production point of view, world such as the European Union, North America
it’s clear from Figure 2 that domestic fish production and strong fish consuming countries such as Japan
is rising and that exports, especially for tilapia, can continue to increase their consumption demand. For
be linked to this. Even though developed countries South African fish farmers to tap into this market,
dominate global fish imports, developing countries proper support to the local aquaculture industry is
are steadily showing an increasing trend. required, especially if it wants to increase its export
share to the rising African market. While the sector
barely makes headlines, it has the potential to create
job opportunities and contribute to the country’s
GDP.
TRADE PROBE ISSUE 85 - MAY 2021 11TRADE ANALYSIS
Making AGOA work for Africa: Untapped potential
By Lucius Phaleng
The African Growth and Opportunity Act (AGOA) states to fully benefit from the deal. The most direct
offers duty-free access to the largest market in the path to improving trade linkages is to address non-
world and has the potential to be a major driving tariff barriers to trade, of which two are particularly
force in African development. Thus far, however, it important. Firstly, African companies need expanded
has failed to live up to its potential. AGOA has seen assistance in understanding and navigating the
numerous success stories since its commencement bureaucracy involved in exporting to the US,
in 2001 – such as the growth of automotive exports including assistance ranging from understanding
from South Africa to the US – but the broader picture paperwork and labelling requirements to meeting
has been disappointing. US imports from Africa difficult sanitary and phytosanitary rules. Support
continue to be dominated by energy commodities, should be forthcoming from both the US and
which account for 88 % of AGOA (excluding South African countries. Secondly, rules of origin remain
Africa) exports to the US. In terms of African export restrictive under AGOA. Rules of origin set minimum
competitiveness, textile commodities appears to requirements on how much local value must be
the most prospering export commodity from Africa. added to a product exported to the US. While AGOA
Even where the deal does grant a tariff advantage, uses relatively liberal rules, they remain challenging
African companies must still grapple with complex in the unique context of African economies. Least
standards and rules of origin that often discourage developed African countries with weak local
otherwise competitive producers from exporting. manufacturing capacity and low labour costs (which
artificially suppress the nominal value add) may
The weak performance should not only raise struggle to qualify for duty-free access to the US
questions about the importance of AGOA but also market, despite substantially transforming inputs.
serve to highlight how underutilised the preferences The need for extensive paperwork proving the origin
remain. The current legislation expires in September and value of inputs may encourage some exporters
2025 and, while renewal of the AGOA is yet to to avoid doing business with more informal firms.
be determined by trading partners, it will be of Continued efforts to build accommodative rules of
interest to see if the offer of non-reciprocal access origin could help give AGOA countries a fair chance
is maintained beyond the current regime. African at competing with other nations with preferential
countries and the US must seize the opportunity market access, such as those involved in the Trans-
while it remains, maximising the untapped potential Pacific Partnership (TPP).
of AGOA preferences. A comprehensive strategy
should involve four pillars: core renewal of AGOA; AGOA sector data: Agriculture
assistance in overcoming non-tariff barriers to The agricultural sector forms one of the most
entering the US market; infrastructure development important economic activities in Africa. While much
to boost competitiveness; and planning around a of agricultural production is subsistence based or
rapidly evolving global trading system. for local consumption, there has been strong growth
in agricultural products being exported globally.
Addressing non-tariff barriers to trade Africa’s international agricultural exports include
The recent AGOA renewal itself is not enough. To citrus products, grains, nuts, fish, tobacco, cocoa,
make AGOA work, support and co-operation beyond coffee, beverages, sugar, vegetables, fruit and many
tariffs are necessary for both the US and African other agriculture categories. These products can be
12 TRADE PROBE ISSUE 85 - MAY 2021TRADE ANALYSIS
found on shelves in all corners of the world and are used as inputs in further processed goods. In terms of US
exports, AGOA beneficiaries exported a combined US$ 1944.7 million worth of agricultural products during
2020, lower by US$ 25.68 million as compared to 2019 values. However, most trade continues under normal
tariff relations, either because products do not qualify under AGOA/GSP or because products are already
subject to low or no duties when entering the US. Leading products exported under AGOA/GSP preference
are citrus fruit (mainly oranges and mandarins), grapes, nuts (including macadamias), fresh vegetables,
cassava and peppers.
Conclusion
The US’ commitment to supporting African development through trade must be applauded, but trade
is about more than tariffs. A comprehensive AGOA, working beyond preferential market access, can help
the bill live up to its potential. AGOA preferences and a streamlined system of rules and regulations will
assure good access to the US market, but in order to take advantage of this, African companies need a
base level of structural competitiveness. Arguably, the key factor holding back improved US-Africa trade is
the lack of an environment conducive to the competitive production of those goods the US wants to buy.
This competitive deficit has a wide range of causes, not all of which are easy to address. The US’ current
programmes towards African infrastructure development should be applauded, most notably the Power
Africa initiative. Power Africa strategically targets the biggest barrier to creating a predictable, productive
environment in Africa: the energy deficit.
Author: Mr Lucius Phaleng is an economist under
the Trade Research Unit at the National Agricultural
Marketing Council. He can be contacted at lphaleng@
namc.co.za or (012) 341 1115.
TRADE PROBE ISSUE 85 - MAY 2021 13TRADE OPPORTUNITIES
Market analysis for sisal (HS: 560721)
By Lindikaya Myeki
Background
The growing calls for adopting green economy practices imply that natural fibres are highly likely to
receive greater attention. Natural fibres offer the potential to deliver greater added value, sustainability
and renewability, and lower costs, especially in the automotive industry, which presents an opportunity to
establish and strengthen the industry value chains that have been neglected for a long time. These value
chains include, amongst others, hemp and sisal. This article focuses on the market analysis for sisal - binder
or baler twine, of sisal or other textile fibres of the genus agave (HS code: 560721).
.
Market analysis: Binder or baler twine, of sisal or other textile fibres of the genus agave (HS Code:
560721)
Table 3 shows the top 10 global exporters of sisal in 2019, expressed in value terms and measured in
thousand USD. The world value of exports was at US$ 54 294 thousand and the leading (top 10) exporters
accounted for 87 % of the market share of world exports of sisal. Topping the list was Brazil at 49.3 %,
followed by Portugal at 18.1 % and Kenya at 4.8 % of the world’s market share. Other countries making
the list of the top 10 world exporters were the United Kingdom (US$ 2 543 thousand), Tanzania (US$ 1 236
thousand) and China (US$ 1 051 thousand).
Table 3: World’s leading exporters of sisal (HS Code 560721): 2019
Exporters Value exported in 2019, in USD thou- Share in world exports, %
sands
World 54294 100
Brazil 26764 49.3
Portugal 9842 18.1
Kenya 2612 4.8
United Kingdom 2543 4.7
Tanzania 1236 2.3
China 1051 1.9
United States of America 881 1.6
Thailand 838 1.5
Belgium 781 1.4
Russian Federation 777 1.4
Source: Trade Map (2019)
Table 4 presents the list of the top 10 leading importers of sisal in 2019, expressed in value terms. The world
value of imports amounted to US$ 73 572 thousand. Leading the list was the United States of America,
France and the Netherlands, accounting respectively for 41.9 %, 10.1 % and 9.2 % of the world’s market
share. The rest of the countries forming the top 10 leading importers of sisal includes Myanmar (US$ 3 715
thousand), Portugal (US$ 3 166 thousand), Canada (US$ 2 318 thousand) and others.
14 TRADE PROBE ISSUE 85 - MAY 2021TRADE OPPORTUNITIES
Table 4: World’s leading importers of sisal (HS Code 560721): 2019
Importers Value imported in 2019, in USD Share in world imports, %
thousands
World 73572 100
United States of America 30829 41.9
France 7462 10.1
Netherlands 6754 9.2
Myanmar 3715 5
Portugal 3166 4.3
Canada 2318 3.2
Germany 2002 2.7
Nigeria 1696 2.3
Japan 1580 2.1
Belgium 962 1.3
Source: Trade Map, 2019.
Table 5 lists the top five leading export destinations for South African sisal in 2019, expressed in value terms
and measured in thousand USD. The first observation is that South Africa exports its sisal to one African
country, namely Mozambique, commanding the largest market share (60.6 %), followed by Italy (28.8 %) and
China (7.6 %). Other countries on the top five list of sisal export destinations for South Africa include Areas
Nes and the United States of America, with an export market share of 1.5%.
Table 5: Top five export markets for South Africa’s Sisal (HS Code 560721): 2019
Exporters Imported value Share in world imports, %
World 66 100
Mozambique 40 60.6
Italy 19 28.8
China 5 7.6
Area NES 1 1.5
United States of America 1 1.5
Source: Trade Map, 2019
Table 6 presents import markets for South Africa sisal in 2019. The first observation is that South Africa
imports a large quantity of sisal (HS: 560721), which can be attributed to a wide range of relatively high local
production costs and low world market prices. Botswana topped the list with a largest market share of 31.9
%, followed by Namibia (28.7 %), Zambia (20.7 %) and Eswatini (7.2 %). Other countries making the list of
top 10 import markets for South African sisal were Mozambique, Lesotho, Zimbabwe, DRC, and Area NES.
TRADE PROBE ISSUE 85 - MAY 2021 15TRADE OPPORTUNITIES
Table 6: Top ten import markets for South African sisal (HS Code 560721): 2019
Exporters Exported value Share in SA’s exports, %
(in USDA’ million)
World 637 100
Botswana 203 31.9
Namibia 183 28.7
Zambia 132 20.7
Eswatini 46 7.2
Ship stores and bunkers 45 7.1
Mozambique 10 1.6
Lesotho 8 1.3
Zimbabwe 4 0.6
DRC 2 0.3
Area NES 2 0.3
Source: Trade Map, 2019
Author: Mr Lindikaya Myeki is an economist under the
Smallholder Unit at the National Agricultural Marketing
Council. He can be contacted at Lindikaya@namc.
co.za or (012) 341 1115.
16 TRADE PROBE ISSUE 85 - MAY 2021TRADE OPPORTUNITIES
SACU trade analysis and its potential
By Lucius Phaleng
The Southern African Customs Union (SACU( is a customs union with a common external tariff applicable to
imports outside the common customs area irrespective of the destination. The five-member states of SACU –
Botswana, Lesotho, Namibia, South Africa and Swaziland – continue to show substantial differences in levels
of economic development. Botswana and South Africa are classified as upper-middle-income countries, while
Namibia and Swaziland are considered lower-middle-income countries, and Lesotho is the least developed
country. Nonetheless, SACU countries face common challenges, notably unemployment, income inequality,
poverty, and HIV/AIDS. Since 2003, SACU economies have collectively expanded at an average annual
rate of about 4 % in real terms. In some SACU countries, the growth performance has been somewhat
inconsistent, mainly reflecting infrastructure constraints, electricity supply shortages, cyclical mining output,
exchange rate adjustments, and the impact of the global financial crisis.
SACU’s external trade relations • SACU also has a Preferential Trade Agreement
SACU countries are members of the Southern with the Common Market of the South
African Development Community (SADC) and have (MERCOSUR); its members are Argentina, Brazil,
preferential trade agreements with the European Paraguay and Uruguay. This agreement
Free Trade Association (EFTA) and the Southern came into force in April 2016.
Common Market (MERCOSUR). Swaziland is also • SACU members (along with Mozambique) are
a member of the Common Market for Eastern and parties to the Economic Partnership Agreement
Southern Africa (COMESA). SACU countries are (EPA) with the European Union, which has been
eligible for non-reciprocal preferential treatment provisionally applied since October 2016. In 2017,
under the Generalized System of Preferences (GSP) the EU accounted for 27 % and 21 % of SACU’s
and the US African Growth and Opportunity Act imports and exports from the rest of the world.
(AGOA). Some SACU countries have bilateral trade Germany, the UK and Italy are the top source
agreements in place. To further harmonise trade markets for products imported by SACU. Germany,
policy, SACU members have agreed to negotiate Belgium and the UK are the top destination
new preferential trade agreements as a group. They markets for products exported by SACU.
are finalising negotiations on economic partnership • SACU has a Trade, Investment and Development
agreements with the European Commission (EC). Cooperative Agreement with the United
The SACU external trade agreement is summarised States (US) to foster trade, investment and
below. development, which came into force in July 2008.
• In addition, SACU countries are currently all eligible
• SACU has a free trade agreement (FTA), which beneficiaries of the African Growth and Opportunity
came into force in May 2008, with the European Act (AGOA). AGOA is a US legislation that enhances
Union Free Trade Association (EFTA) states market access for sub-Saharan African countries.
– Norway, Switzerland, Lichtenstein and • SACU is currently negotiating an FTA with India,
Iceland. The FTA includes bilateral side the African Continental Free Trade Area (AfCFTA)
agreements between SACU and all EFTA and the Tripartite Free Trade Area (TFTA).
states except Lichtenstein on agriculture.
TRADE PROBE ISSUE 85 - MAY 2021 17TRADE OPPORTUNITIES SACU’s tariff profile SACU countries have a single customs territory with no customs duties between them. They apply a common external tariff (CET) on imports from non-SACU countries. Duties applied on imports differ depending on the origin/source and type of product. SACU countries apply Most Favoured Nation (MFN) tariffs on all products coming into the customs union, except for products originating from the EU, EFTA, SADC and MERCOSUR, which are charged preferential duties following their respective trade agreements with SACU. SACU’s highest MFN applied duties are levied on tobacco and clothing products. The ad valorem equivalent MFN applied tariff for unstemmed and unstripped tobacco is 142.77 %, and for stemmed and stripped tobacco, it is 111.36 %. The MFN applied tariff on clothing ranges between 40 % and 45 %, except for second-hand clothing. The same duty rates are applied to all imports of sugar and second-hand clothing regardless of their origin. A specific duty of 213.1c/kg is applied on sugar imports and 60 % or 2500c/kg for second-hand clothing imports. The highest average MFN applied tariffs are for knitted clothes (41.3%); non-knitted clothes (40%); other clothing (28.7%); carpets (26.6%); leather products (26.4%); umbrellas (25.8%); and footwear (22.2%). I n the Uruguay Round, South Africa, on behalf of SACU countries, committed itself to apply tariff quotas to a range of agricultural products, under the minimum market-access commitments, at maximum tariffs of 20 % of the bound rates. Products subject to the commitments include animal products, potatoes, vegetables, fruits, cereals, coffee, tea, oilseeds, sugar, food preparations, wine and spirits, vinegar, tobacco, and cotton. Initial quotas are expected to increase for, amongst other things, the meat of sheep, fresh milk and cream, cheese, eggs, certain cereals, potatoes and sugar. 18 TRADE PROBE ISSUE 85 - MAY 2021
TRADE OPPORTUNITIES

Table 7: Tariff bindings in SACU, post-Uruguay Round (per cent)
 Description                      No. of       Average Maximum Fully bound         Partially   Unbound
                                  tariff lines                                     bound
 All products                     7,817        20.9    597.0    96.1               0.1         3.9
 HS 01 24                         913          46.8    597.0    82.4               0.0         17.6
 HS 25 97                         6,904        18.1    185.0    97.9               0.1         2.0
 WTO agriculture                  846          43.5    597.0    99.5               0.0         0.5
  - Animals and products thereof 96            44.8    160.0    100.0              0.0         0.0
  - Dairy products                20           93.7    96.0     100.0              0.0         0.0
  - Coffee and tea, cocoa, sugar 178           54.0    597.0    99.4               0.0         0.6
 etc.
  - Cut flowers, Plants           44           10.6    60.0     100.0              0.0         0.0
  - Fruit and vegetables          182          30.7    99.0     100.0              0.0         0.0
  - Grains                        16           30.8    72.0     100.0              0.0         0.0
  - Oilseeds, fats and oils and   75           49.0    81.0     100.0              0.0         0.0
 their Products
  - Beverages and spirits         49           145.2   597.0    100.0              0.0         0.0
  - Tobacco                       13           51.7    54.0     100.0              0.0         0.0
  - Other agricultural products,  173          16.9    72.0     98.3               0.0         1.7
 n.e.s.
Source: WTO Secretariat, based on South Africa’s Uruguay Round Schedule XVII.

Non-tariff barriers such as (seasonal) import quotas and prohibitions, or additional duties on imports of
certain agricultural products from all countries, including other SACU members, aim to encourage domestic
production of certain agricultural goods. Botswana, Lesotho, Namibia and Swaziland apply the anti-dumping,
countervailing, and safeguard measures determined by South Africa, a leading initiator of anti-dumping
actions among WTO members. Botswana, Lesotho, Namibia and Swaziland are in the process of establishing
their own legal and institutional framework to enable them to initiate trade remedies. Some SACU countries
have adopted South Africa’s regimes in the areas of standards, technical regulations, and SPS measures.
Some SACU countries apply export taxes (on rough diamonds by Namibia and South Africa; on sugar by
Swaziland). Botswana maintains a statutory export monopoly on beef exports.

                                        TRADE PROBE ISSUE 85 - MAY 2021                                  19
TRADE OPPORTUNITIES Trade issues faced by SACU countries states, in general, face significant regulatory • The logic of allocating customs revenue based constraints that increase the time and cost of doing on intra-SACU imports is technically problematic business. These costs make it difficult for SACU and complicated. Tariff revenue distribution countries to compete internationally as exporters is quite peculiar as it requires monitoring and and for inward investment and may encourage keeping on intra-SACU trade, which necessitates the development of inward-looking businesses border controls within a customs union. There and value chains. The extent to which barriers in has also been a problem related to the validity one SACU country may impede firms’ growth and of intra-SACU trade data as reported by some international competitiveness in other member members as a source of conflict. An increase states may require further consideration. in intra-SACU imports claimed by any member • SACU countries, with the exception of South Africa, reduces the revenue share of all other members. have a narrow export base. The principal policy This basis of customs revenue distribution imperative remains diversification away from does not help develop economic co-operation their key export products (diamonds and other and integration within the customs union. minerals in Botswana and Namibia, textiles in • South Africa is the dominant economy within the Lesotho, and sugar in Swaziland). Some labour- SACU region and the primary destination market intensive manufacturing activities, particularly for BLNS exports. Any value chains that are textiles and clothing, have been seriously affected developed in the region will, in all likelihood, by increased competition in foreign markets. depend on access to the South African market • Services play a crucial role in the diversification and will be heavily influenced by the purchasing of the SACU economies. Export opportunities, decisions of South African firms and consumers. however, remain largely untapped by SACU (with It is, therefore, necessary to explore the extent to the exception of South Africa). In tourism, for which firms in the BLNS are able to link into the example, constraints in infrastructure, marketing supply chains of downstream businesses in South and promotion, finance and lack of skilled labour Africa and the main barriers to such trade. It is also have impeded the development of the subsector. important to consider the dependence of firms Further liberalisation and investment in services in the BLNS on inputs (including services) from should generally improve the efficiency of other South Africa and their ability to source inputs from economic activities and the competitiveness of elsewhere, including other preferential markets. SACU’s exports, especially by reducing costs • The Ease of Doing Business rankings suggest for telecommunications, transport and energy. that firms in SACU member 20 TRADE PROBE ISSUE 85 - MAY 2021
TRADE OPPORTUNITIES

Threats to the future existence of SACU
• Although reference is made to its impact on the revenue pool, the international financial crisis lies in its
  impact on the fiscal position of South Africa. By calling for a review of the revenue sharing formula, the
  South African treasury is signalling its distress to the BLNS states.
• The EPA negotiations have resulted in some countries signing up to the interim agreements and South
  Africa trading under the TDCA and, once fully implemented, this will result in the operation of the TDCA
  external tariff as well as the IEPA tariff, effectively killing the SACU CET.
• The current impetus in South Africa is to change the revenue-sharing formula to a development format.
  While the desire to do so on the part of South Africa is understandable and is probably driven by a desire for
  a more equitable revenue-sharing formula, this would seriously undermine the budgets of the BLNS states.
• The push towards stronger economic relations, based on economies of scale, between South Africa and
  Angola as an alternative to SACU; and
• The attempts to include Angola and Mozambique in the current arrangement would further complicate the
  revenue sharing formula and face opposition from the BLNS states.

                                           TRADE PROBE ISSUE 85 - MAY 2021                                    21
TRADE OPPORTUNITIES
South Africa has positive prospects to further export grapes, wine,
oranges and nuts
By Onele Tshitiza
The potential for agriculture to contribute to the elasticities and progressive tariffs. The difference
economic growth of developing countries is well between export potential and actual exports is
recorded and South Africa is not an exception. untapped potential, which means an opportunity
Agriculture, forestry and fisheries increased by to export if barriers are overcome. The tool is not
13.1% in real GDP in 2020 compared to 2019 without limitations and is therefore not to be isolated
(StatsSA, 2020), although the overall real GDP had from other factors such as cost of export promotion
declined by 7% in South Africa. The increase in and the added value that could be realised from
real GDP within agriculture can be attributed to the marketing and branding, direct investment and other
bumper maize and favourable export prices in the sector strategies. It is therefore limited to market
top exported horticultural products (BFAP, 2020). access and trade data and more research may be
The growth is despite the global pandemic, although needed to make well-informed decisions on whether
its impact on some producers is not taken lightly. to export or diversify. At the basic level, other factors
When production is in excess and export market on the domestic side might have a bigger impact,
conditions are favourable, the country can maximise such as production which would determine the
on existing markets as well as seek to infiltrate new country’s ability to export larger volumes, which
ones. South Africa’s horticultural industry is known interacts with other factors along the value chain.
for its export orientation, where in most industries,
over 60% of production is exported to trading According to ITC data, South Africa has the most
partners. This article seeks to evaluate whether potential to export all of its products, including
there is still room for South Africa to explore new agriculture to China, Germany, the United Kingdom
markets or increase the market share in existing (UK) and the United States. This may be in line
ones for agricultural commodities using trade data. with the trade relations that South Africa already
has with these countries and their demand for the
The International Trade Centre (ITC) calculates the products that South Africa produces or the potential
value of a country’s export potential for a product of products that South Africa is not yet producing.
into a certain market by considering supply and It might also be influenced by South Africa’s limited
demand factors, as well as the bilateral easiness of infrastructure to process its raw materials such as
trade. Supply and demand are said to be projected precious stones and minerals to finished products,
using GDP and population forecasts, demand as well as the high labour costs to achieve the same
22 TRADE PROBE ISSUE 85 - MAY 2021TRADE OPPORTUNITIES
level of production. When all products produced by China has the largest untapped potential for three
South Africa are considered, gold has the largest of the commodities. South Africa has increased
value of untapped potential of all, followed by motor its exports of oranges to China in recent years
vehicles, ferro-chromium, diamonds and so on. The as market access through coordination between
focus of this article however will be on agricultural government bodies and industry has opened up.
commodities. In terms of their untapped potential The untapped potential for South Africa in China is
among all exported products, fresh grapes and fresh quite large relative to the potential export because
or dried oranges rank as 10th and 11th respectively, the value of our actual exports is relatively small for
while apples are in the 14th spot, maize (15th), all the products. This might be in relation to some
wine of fresh grapes (16th) and nuts not else where barriers such as food standards and dominance of
specified (17th). Mining and agricultural products at the market by other countries. Germany is also a
their raw states therefore seem to present export great market to explore for the three products as we
opportunities for South Africa. have not utilised all the potential. There is a greater
potential for grapes and wine of fresh grapes in the
Commodities with the largest export potential U.S., while oranges are almost at their potential
Table 8 focuses on South Africa’s bilateral trade with peak, with US$8 million remaining of US$ 43.7
the four countries with which South Africa has the million. Interesting is how we have almost utilised
largest potential, together with the commodities that 50% of the potential export in the United Kingdom
still have room to be exported into these countries, for wine, nuts nes and dried grapes. This shows how
measured in million US$. Commodities are ranked South Africa might be benefiting from the bilateral
according to their remaining untapped potential per relations which have been built over the years with
country. The red numbers are the values of untapped the UK. South Africa’s production of maize, citrus
potential into the four countries. The difference and grapes has been increasing in the last two
between the export potential and untapped potential years and estimates reveal that we can expect an
is what South Africa’s exports are currently worth. increase in these commodities this season. In the
From the table, we can see that South Africa still long-term, as production improves, new markets
has the potential to increase its market share in and an increase in existing markets is going to be
fresh and dried oranges, wine, fresh grapes, dried vital for industries to diversify their markets.
grapes and nuts not elsewhere specified (nes).
Author: Ms.. Onele Tshitiza is an economist under
the Trade Research Unit at the National Agricultural
Marketing Council. She can be contacted at
otshitiza@namc.co.za or (012) 341 1115.
TRADE PROBE ISSUE 85 - MAY 2021 23TRADE OPPORTUNITIES
Table 8: Countries that South Africa has untapped export potential with and its products.
Markets Commodities Potential export and untapped
potential remaining (in million
US$)
China Fresh or dried oranges 194.9
105.8
Wine of fresh grapes 124.8
95.5
Fresh grapes 110.6
91.0
Germany Fresh or dried oranges 115.9
93.4
Nuts not elsewhere specified (nes.) 102.6
86.1
Fresh grapes 154.6
78.8
United States Fresh grapes 71.9
69.8
Wine of fresh grapes 102.1
60.6
Fresh or dried oranges 43.7
8.0
United Kingdom Wine of fresh grapes 91.7
44.5
Nuts nes. 14.6
7.6
14.5
7.1
Source: ITC (2021)
Conclusion
Although export potential does not give the full picture enough for countries or producers to grow the market
share in existing markets and tap into new markets, it gives a starting point o further investigate the prospect
of such a venture. Trade data from the ITC shows that South Africa has the potential to still realise a large
value from exporting oranges, wine, grapes and wine to China, Germany, the United States and the United
Kingdom. The country already has trade agreements with these countries, which makes it possible to trade
with them, however further exploration is needed to assess what factors are inhibiting the country from
expanding in these countries. With the growth of South Africa’s production, it will become important for
stakeholders to increase their market share in existing markets and also enter new markets to fully realise
the value of their output. Coordination between government and private actors to meet the requirements of
these markets will become important, together with holistic export promotion activities.
24 TRADE PROBE ISSUE 85 - MAY 2021TRADE NEWS
AfCFTA is a key instrument in post-COVID-19 recovery
The Deputy Minister of Trade, Industry and Competition, Mr Fikile Majola, says that South Africa
must look beyond its borders to accomplish the task of inclusive economic growth and job creation
in the wake of the COVID-19 pandemic. He delivered the main address at the virtual Africa Day
commemoration of the National Council of Provinces (NCOP). Majola says it is critical to move with
speed towards building a strong foundation for Africa’s inclusive economic growth, and the African
Continental Free Trade Area (AfCFTA) provides the platform to advance this core objective. The 13th
Extra-Ordinary Summit of the African Union Heads of State and government on the AfCFTA held
on 5 December 2020 provided the legal basis for the operationalisation of preferential trade from
1 January 2021, and this has been a significant step towards the realisation of a socio-economic
integrated continent.
The AfCFTA will create the largest free-trade area in the world by a number of countries participating
and will connect 1,3 billion people across 55 countries with a combined GDP valued at U$ 3,4 trillion.
However, to make this a reality, significant policy reforms and trade facilitation measures are also
necessary. Majola says one of the instructive lessons learned from the COVID-19 pandemic is that
economic resilience and self-sufficiency are critical. He says that given that many African countries
do not have the means to cushion themselves against the resultant economic devastations, building
up industrial capabilities, trade, and supply chains across African countries is important. “Our country
accounts for approximately a quarter of intra-trade in the continent and will benefit massively from
driving the consolidation of Africa’s integrated market. The creation of capacity to produce PPE in
the fight against COVID-19 has also given South Africa the opportunity to become a supplier to the
SACU communities and broader African continent,” Majola said. The importance of African trade
in South Africa’s overall trade continues to grow. In 2019, 27 % of South Africa’s world exports
and 12 % of world imports were intra-Africa. South Africa continues to record a large trade surplus
with the rest of Africa, exporting mainly mineral products, machinery, chemicals, and iron and steel
products, accounting for over 50 % of its total exports. South Africa’s exports into Africa grew from
about R9 billion in 1994 to over R340 billion by 2019. Considering that in 2019 Africa imported about
R8 trillion worth of goods, South Africa’s share of global exports into Africa is still relatively small,
but this is bound to change with the implementation of the AfCFTA. Majola told the members of the
NCOP that the continent’s full potential would remain unfulfilled unless efforts are made to address
the challenges of poor infrastructure, small and fragmented markets, under-developed production
structures and inadequate economic diversification.
Link: DTIC (http://www.thedtic.gov.za/afcfta-is-a-key-instrument-in-post-covid-19-recovery/)
TRADE PROBE ISSUE 85 - MAY 2021 25TRADE NEWS
The African Continental Free Trade Agreement (AfCFTA): What
has South Africa actually offered Africa?
In early 2021, the AfCFTA became a reality, albeit an agreement with many details still to be
finalised. The objective for this trade brief is to examine the African Continental Free Trade
Area (AfCFTA) tariff offer by South Africa (actually, this is the Southern African Customs
Union (SACU) offer, since SACU makes a collective offer as a customs union) and assess
that schedule against the imports into South Africa from non-SACU Africa during the 2019
year. Many complications in this process have necessitated this trade brief being an initial and
incomplete analysis, but it gives some perspective on what South Africa (SACU) offers under
the AfCFTA. Since South Africa is by far the largest economy in SACU, South Africa’s imports
account for the dominant share of SACU’s imports. For these reasons, the focus in this trade
brief is on South Africa, its imports from African countries, and the tariff offer that South Africa
(SACU) has tabled in the AfCFTA negotiations in December 2020.
Link: TRALAC (https://www.tralac.org/publications/article/15221-the-african-continental-free-trade-
agreement-afcfta-what-has-south-africa-actually-offered-africa.html)
26 TRADE PROBE ISSUE 85 - MAY 2021TRADE NEWS
Making the AfCFTA and the RECs’ work
The Regional Economic Communities (RECs) are the official pillars of the African Economic
Community (AEC). The AEC Treaty (the Abuja Treaty) came into force in May 1994, and it provides
for the AEC to be set up through a gradual process, through co-ordination, harmonisation, and
progressive integration of the activities of the RECs. There have not been official assessments
as to how this formula has worked and how the RECs have advanced the arrival of the AEC.
The UN’s Office of the Special Advisor on Africa (OSAA) has issued a document dealing with
developments up until 2015, which describes the role of the RECs in the future tense and also
ascribes to their responsibility for peacekeeping: “Beyond their role in peace and security, RECs
have the immense challenge of working with governments, civil society and the AU Commission
in raising the standard of living of the people of Africa and contributing towards the progress and
development of the continent through economic growth and social development. The RECs will
be highly essential and instrumental for the effective implementation, financing, monitoring and
evaluation of Agenda 2063 and its flagship programmes, at particularly the regional levels.” In
terms of the AfCFTA Agreement (adopted in 2018), the RECs’ Free Trade Areas are now also
the building blocks of the AfCFTA.[3] Is this a new function or a continuation of an old one?
The AfCFTA instruments do not answer this question, and it does not seem to require a new
explanation. However, the AfCFTA Agreement does provide important clarifications: the AfCFTA
introduces parallelism, the acquis, and says expressly that REC Free Trade Areas (FTAs) are
“building blocks for the AfCFTA”[4] that do not require them to become CUs in the process. The
only reference to a customs union appears in the list of General Objectives, which includes “to
lay the foundation for establishing a Continental Customs Union at a later stage”.[5]
Link: TRALAC (https://www.tralac.org/blog/article/15233-making-the-afcfta-and-the-recs-work.html)
TRADE PROBE ISSUE 85 - MAY 2021 27You can also read