Critical Influences of Particle Size and Adhesion on the Powder Layer Uniformity in Metal Additive Manufacturing
←
→
Page content transcription
If your browser does not render page correctly, please read the page content below
Critical Influences of Particle Size and Adhesion on the Powder Layer
                                                                Uniformity in Metal Additive Manufacturing

                                                  Christoph Meiera,b,∗, Reimar Weissbacha,b , Johannes Weinberga,c , Wolfgang A. Wallb , A. John Harta,∗
                                         a Mechanosynthesis    Group, Department of Mechanical Engineering, Massachusetts Institute of Technology, 77 Massachusetts Avenue, Cambridge,
                                                                                                          02139, MA, USA
                                              b Institute for Computational Mechanics, Technical University of Munich, Boltzmannstrasse 15, 85748 Garching b. München, Germany
                                                                             c M.I.T. Lincoln Laboratory, 244 Wood Street, Lexington, 02420, MA, USA
arXiv:1804.06822v2 [cs.CE] 25 May 2018

                                         Abstract
                                         The quality of powder layers, specifically their packing density and surface uniformity, is a critical factor influencing
                                         the quality of components produced by powder bed metal additive manufacturing (AM) processes, including selective
                                         laser melting, electron beam melting and binder jetting. The present work employs a computational model to study
                                         the critical influence of powder cohesiveness on the powder recoating process in AM. The model is based on the
                                         discrete element method (DEM) with particle-to-particle and particle-to-wall interactions involving frictional contact,
                                         rolling resistance and cohesive forces. Quantitative metrics, namely the spatial mean values and standard deviations
                                         of the packing fraction and surface profile field, are defined in order to evaluate powder layer quality. Based on
                                         these metrics, the size-dependent behavior of exemplary plasma-atomized Ti-6Al-4V powders during the recoating
                                         process is studied. It is found that decreased particle size / increased cohesiveness leads to considerably decreased
                                         powder layer quality in terms of low, strongly varying packing fractions and highly non-uniform surface profiles.
                                         For relatively fine-grained powders (mean particle diameter 17µm), it is shown that cohesive forces dominate gravity
                                         forces by two orders of magnitude leading to low quality powder layers not suitable for subsequent laser melting
                                         without additional layer / surface finishing steps. Besides particle-to-particle adhesion, this contribution quantifies the
                                         influence of mechanical bulk powder material parameters, nominal layer thickness, blade velocity as well as particle-
                                         to-wall adhesion. Finally, the implications of the resulting powder layer characteristics on the subsequent melting
                                         process are discussed and practical recommendations are given for the choice of powder recoating process parameters.
                                         While the present study focuses on a rigid blade recoating mechanism, the proposed simulation framework can be
                                         applied to and the general results can be transferred to systems based on alternative recoating tools such as soft
                                         blades, rakes or rotating rollers.
                                         Keywords: Adhesion, Metal Powders, Additive Manufacturing, Recoating Process Simulation, Layer Uniformity

                                         1. Introduction

                                         Among the manifold of existing additive manufacturing (AM) processes, selective laser melting (SLM) of metals
                                         has attracted much scientific attention because it offers near-net-shape production of near-limitless geometries, and
                                         eventual potential for pointwise control of microstructure and mechanical properties (Gibson et al., 2010). However,
                                         the overall SLM process is complex and governed by a variety of (competing) physical mechanisms. A sub-optimal
                                         choice of process parameters might lead to deteriorated material properties or even to failure of the part already during
                                         the manufacturing process (Das, 2003; Kruth et al., 2007). For that reason, a multitude of experimental and modeling
                                         approaches have been conducted in recent years in order to gain further understanding of the underlying physical
                                         mechanisms and ultimately to optimize the process and the properties of the final part.

                                            ∗ Correspondingauthors
                                             Email addresses: meier@lnm.mw.tum.de (Christoph Meier), ajhart@mit.edu (A. John Hart)

                                         Preprint submitted to Journal of Materials Processing Technology                                                               May 28, 2018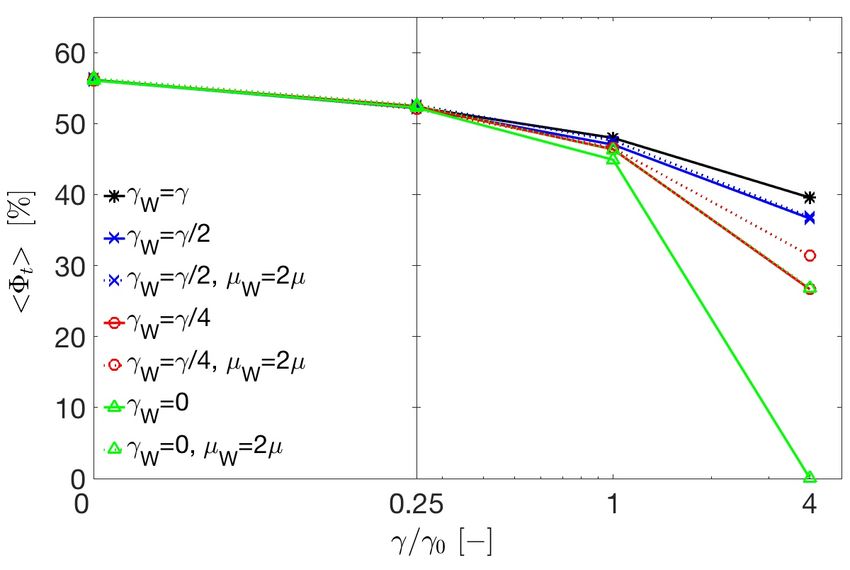
Depending on the considered lengths scales, existing experimental and modeling approaches can typically be classified
in the three categories macroscopic, mesoscopic and microscopic (Meier et al., 2018a). Macroscopic approaches com-
monly aim at determining spatial distributions of physical fields such as temperature, residual stresses or dimensional
warping on part level. In one of the pioneering works in this field, Gusarov et al. (2007) solved the thermal problem of
the SLM process based on a previously developed radiation transfer model for laser energy absorption (Gusarov and
Kruth, 2005). Hodge et al. (2014) extended this procedure to a coupled thermo-(solid-)mechanical analysis employ-
ing a (homogenized) elasto-plastic constitutive law accounting for thermal expansion and consolidation shrinkage.
Denlinger et al. (2015) supplemented the contributions discussed so far by allowing for residual stress relaxation. In
order to improve computational efficiency, Riedlbauer et al. (2016) applied adaptive mesh refinement strategies, while
Zaeh and Branner (2010) considered a simplified process model based on equivalent thermal loads applied to several
powder layers at once. Mesoscopic approaches commonly predict resulting melt pool and part properties such as melt
track stability, surface quality or layer-to-layer adhesion as well as creation mechanism of defects such as pores and
inclusions having their origin on the mesoscopic scale of individual powder particles. Khairallah and Anderson (2014)
proposed a model of this type based on the finite element method (FEM) considering viscous, gravity and surface ten-
sion forces, which has been extended by Khairallah et al. (2016) to also account for the effects of recoil pressure in the
evaporation zone below the laser beam, Marangoni convection, as well as evaporative and radiative surface cooling.
There is a range of alternative discretization schemes such as the finite difference method (FDM), see e.g. Lee (2015),
the finite volume method (FVM), see e.g. Qiu et al. (2015), or the Lattice-Boltzmann method (LBM), see e.g. Körner
et al. (2011), that have been utilized in the context of mesoscopic models for the SLM process. Last, microscopic
approaches consider the evolution of the metallurgical microstructure involving the resulting grain sizes, shapes and
orientations as well as the development of thermodynamically stable or unstable phases. In this context, Gong and
Chou (2015) applied a phase field model in order to study the solidification and growth of primary β-phase grains
during the processing of Ti-6Al-4V. As alternative to the mentioned phase field model, Rai et al. (2016) proposed a
microscale model based on a cellular automaton (CA) scheme. The majority of existing approaches on the macro-,
meso-, and microscale relates the mentioned process outcomes (e.g. residual stresses, surface quality, metallurgical
microstructure etc.) with typical input parameters such as laser beam power and velocity, powder layer thickness,
hatch spacing or scanning strategy, typically with the final goal to derive process maps (Thomas et al., 2016).

Very recently, the importance of the primary input parameter powder feedstock has been underlined by political, sci-
entific and industrial leaders in the field of AM technologies (King, 2017). In fact, there are several works that have
studied (the influence of) the powder feedstock, which is characterized by mechanical, thermal, optical and chemical
properties on the surface of individual powder particles, by morphology, granulometry and resulting flowability of
bulk powder, and, eventually, by the resulting packing density, surface uniformity and effective thermal and mechan-
ical properties of the deposited powder layer. Herbert (2016) gives an overview of important metallurgical aspects
in the different stages of powder handling / treatment during the SLM process, i.e. in the sequence from powder
storage, to spreading in the machines, to melting, solidification, and post-processing. Tan et al. (2017) extends this
overview to more general aspects with a special focus on the influence of powder morphology and granulmetry. In
the context of powder feedstock modeling, Gusarov (2008) studied the problem of laser energy absorption in pow-
der beds based on a (homogenized) continuum model for the radiation transfer problem while Boley et al. (2015)
approached the same problem on the basis of a ray tracing scheme and a (discrete) powder bed model resolving indi-
vidual particles. Unfortunately, only very few contributions have studied the interplay of the aforementioned powder
particle, bulk and layer properties during the powder recoating process in metal additive manufacturing (see e.g. the
experimental study of particle size segregation by Whiting and Fox (2016)). More specifically, very few modeling
and simulation approaches of the powder recoating process in metal additive manufacturing can be found in the lit-
erature. For example, Herbold et al. (2015) demonstrated that DEM simulations can reproduce realistic powder beds
in terms of size-segregation and packing distributions and modeled different practically relevant blade geometries. In
the recent work by Mindt et al. (2016), the influence of the blade gap on the resulting powder layer has been inves-
tigated. Their work has shown that small blade gaps in the range of the maximal powder particle diameter or below
might lead to a considerably decreased packing density. Haeri (2017) investigated the influence of different recoating
device geometries. While the studies were based on polymer materials, a transferability of general results to metal
powders was claimed by the author of this study. Also Gunasegaram et al. (2017) presented a general framework for
the simulation of powder recoating / raking processes in metal AM. The mentioned models are based on the discrete
                                                            2
element method (DEM) and typically account for (visco-) elastic normal contact, sliding friction as well as rolling
friction interaction between spherical particles. Even though its importance has already been discussed by Herbold
et al. (2015), cohesive effects within the powder have not been considered in any of these pioneering simulation works.

Considering that volume forces such as gravity decrease cubically with particle size while typical adhesive forces
decrease linearly with particle size confirms the well-known observation that the cohesiveness of bulk powder in-
creases with decreasing particle size (Walton, 2008). Typical (adhesive) surface energy values measured for metals
as well as typical powder particle size distributions applied in metal additive manufacturing suggest that adhesion
might be an important factor governing the flowability of bulk powder (Herbold et al., 2015). There are indeed mod-
eling approaches, where cohesive effects have successfully been taken into account in DEM-based powder recoating
studies, however, to the best of the authors’ knowledge, only for non-metallic materials so far. For example, Parteli
and Pöschel (2016) studied the spreading of non-spherical, polymeric particles and confirmed the well-known, yet
counter-intuitive, effect that powder mixtures containing smaller particle species might result in lower effective pack-
ing densities due to cohesion-induced particle clustering (Walton et al., 2007). Since the underlying physical mech-
anisms as well as the magnitude of cohesive effects (and also of other material properties) are crucially different for
(conductive) metallic powders and non-metallic powders, it is questionable if results gained for the latter class of
materials can directly be transferred to powders relevant for metal additive manufacturing.

Since surface energies of a given material combination can easily vary by orders of magnitude as consequence of
surface roughness and potential surface contamination / oxidation, it is essential to calibrate the employed model by
experimentally characterizing the considered powders in terms of effective surface energy values. In the authors’
recent contribution, Meier et al. (2018b) determined for the first time an effective surface energy value for the con-
sidered class of metal powders, which will be employed in the present study. Moreover, also the importance of
consistently considering adhesive particle interactions has been demonstrated by Meier et al. (2018b) by comparing
the bulk powder behavior predicted by models with and without adhesive force contributions. This important result
motivates the present work, representing the first numerical study of powder recoating processes in metal additive
manufacturing based on a cohesive powder model. Thereto, proper metrics, namely the spatial packing fraction and
surface profile field will be defined, in order to analyze the characteristics of powder layers in terms of mean values
and standard deviations in these metrics. The focus of the present studies lies on the influence of powder cohesiveness,
which essentially depends on the magnitudes of surface energy and mean particle size within the considered plasma-
atomized Ti-6Al-4V powder. Consequently, the powder recoating process will be analyzed for three different powder
size classes, i.e. three different classes of powder cohesiveness. Out of these three powder size classes, the most
fine-grained powder with a mean particle diameter of 17µm is characterized by cohesive forces that dominate gravity
forces by two orders of magnitude. It is demonstrated that the resulting powder layers are of low quality in terms of
the previously defined metrics and not suitable for subsequent laser melting without additional layer / surface finishing
steps. Moreover, the influence of mechanical bulk powder material parameters, nominal layer thickness, blade veloc-
ity as well as particle-to-wall adhesion is quantified, and the interplay of these parameters with bulk powder cohesion
is analyzed. Eventually, possible implications of the resulting powder layer characteristics on the subsequent melting
process are briefly discussed and practical recommendations are given for the choice of powder recoating process
parameters. These discussions are carried on with having the SLM process in mind, but the presented results are also
valid for other representatives of metal-fusion based additive manufacturing processes, and might, in general, have
relevance for all kinds of recoating and packing processes of micron-scale powders.

The remainder of this article is structured as follows: Section 2 briefly recapitulates the essentials of the cohesive
powder model proposed by Meier et al. (2018b) and the choice of model parameters. In Section 3, this model is
employed in order to analyze the influence of powder cohesiveness and other powder material and process parameters
on the resulting powder layer quality. Finally, these results and implications on the subsequent melting process are
discussed in Section 4, before a summary of the present contribution and a brief outlook on future research work is
given in Section 5.

                                                           3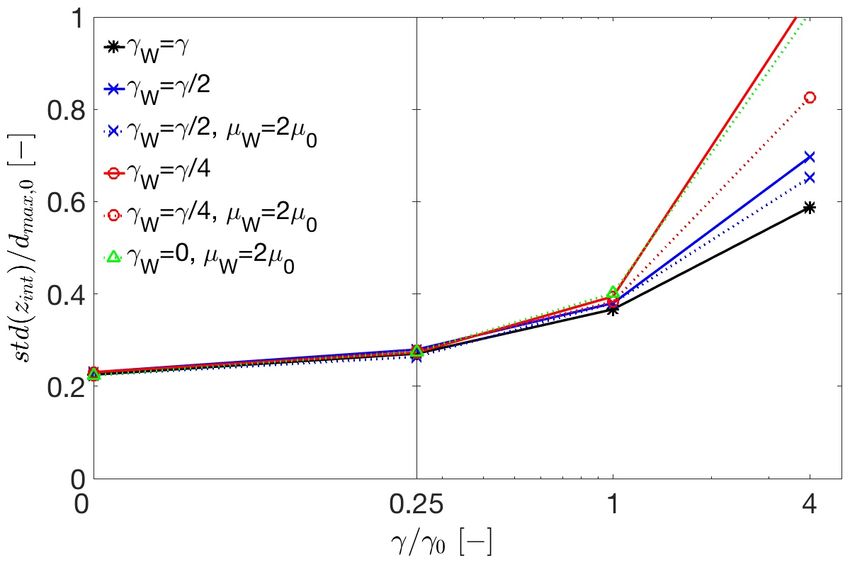
2. Cohesive powder model and choice of parameters

In the recoating simulations conducted throughout this work, plasma-atomized Ti-6Al-4V powders with different size
distributions are considered. According to the SEM images in Figure 1, individual powder particles can be described
as spherical particles in good approximation. The cohesive powder model proposed by Meier et al. (2018b) relies on
the discrete element method (DEM), going back to Cundall and Strack (1979), more precisely on the so-called ”soft
sphere” model, in order to model the bulk powder on the level of individual powder particles in a Lagrangian manner.
In general, the equations of motion of an individual particle are given by the balance of linear and angular momentum:

                                                                     X
                                                                               ij    ij    ij
                                                (m r̈G )i = mi g +           (fCN + fCT + fAN ),                                         (1a)
                                                                     j
                                                                     X
                                                       (IG ω̇)i =        (miRj + rCG
                                                                                  ij    ij
                                                                                     × fCT ).                                           (1b)
                                                                     j

Here, m = 4/3πr3 ρ is the particle mass, IG = 0.4mr2 is the moment of inertia of mass with respect to the particle
centroid G, r is the particle radius, ρ is the mass density, rG is the particle centroid position vector, g is the gravita-
tional acceleration, and ω represents the angular velocity vector. The notion (...)     ˙ represents the first time derivative.
Moreover, a velocity verlet time integration scheme is applied to discretize equations (1) in time. The right-hand side
of (1) summarizes the forces and torques resulting from an interaction with neighboring particles j considering normal
                                 ij       ij                    ij
and tangential contact forces fCN   and fCT  , adhesive forces fAN  , rolling resistance torques miRj as well as the torques
                                                                   ij
resulting from the tangential contact forces. In this context, rCG     := rCi j − rGi represents the vector from the centroid
of particle i to the point of contact with particle j. For the specific force laws underlying these interactions and the
choice of model parameters, the interested reader is referred to Meier et al. (2018b). Only the modeling parameters
most relevant for the present study, will briefly be repeated in the following.

Figure 1: SEM Images of employed plasma-atomized Ti-6Al-4V powder as typical for metal additive manufacturing processes, Meier et al. (2018b).

The time step size ∆t of the employed (explicit) velocity verlet time integration scheme has been chosen according to
a critical step size estimate given by the following relation (O’Sullivan and Bray, 2004)
                                                                   r
                                                                     mmin
                                                 ∆t ≤ ∆tcrit = 0.2        ,                                       (2)
                                                                      kN

with mmin := mini (m) representing the minimal mass across all particles. While a finite element discretization has
been chosen to represent rigid walls, the modelled particle size distribution is considered to be of log-normal type
with parameters fitted to the material certificate of the employed powders. Specifically, the particle diameter distribu-
tion of the reference powder considered throughout this work is specified by 10%, 50% and 90% percentiles according
                                                                         4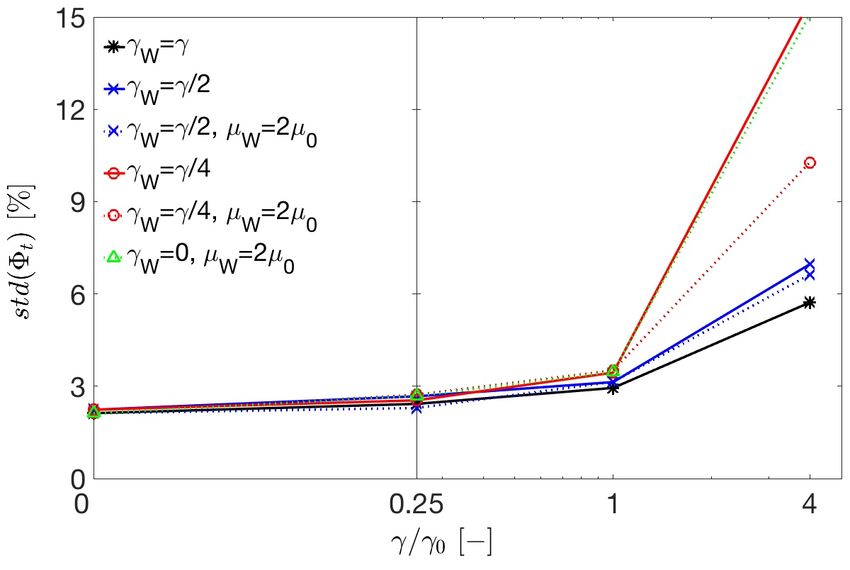
to D10 = 20µm, D50 = 34µm and D90 = 44µm, representing a typical medium-sized powder for AM applications
with mean particle diameter d̄ = 34µm. After fitting the employed log-normal distribution to these specifications, the
range of particles sizes considered in the model has been limited to lie within D10 and D90, i.e. very small particles
below dmin = 20µm as well as very large particles above dmax = 44µm have not been considered for reasons of com-
putational efficiency. The density of the Ti-6Al-4V particles is ρ = 4430kg/m2 , and the Hamaker constant required
for the adhesion force law has been taken as A = 40 · 10−20 J (Israelachvili, 2011).

Meier et al. (2018b) calibrated the surface energy value required to calculate the adhesive interaction forces of the
employed model for the considered Ti-6Al-4V powder by fitting experimental and numerical AOR values, leading to
γ0 = 0.1mJ/m2 . In order to analyze the influence of adhesion on the actual powder recoating process, the simulation
of this process will not only be carried out for the parameter choice γ = γ0 , but also for γ = 4γ0 , γ = 0.25γ0 and γ = 0.
The stiffness/penalty parameter kN of the contact model has been chosen such that the expected maximal relative pen-
etrations cg between contacting particles lie below 2.5% (Meier et al., 2018b). Concretely, a value of kN = 0.05N/m
has been applied in all simulations with surface energies γ ≤ γ0 , whereas the increased value kN = 0.2N/m has been
employed in all simulations with surface energy γ = 4γ0 . Moreover, the friction coefficient and the coefficient of
restitution for particle-to-particle and particle-to-wall interaction have been chosen as µ = 0.4 and cCOR = 0.4 in the
present study. Throughout this work, the notation particle-to-wall interaction includes all interactions of particles with
surrounding solid components and walls. Specifically, it includes the interaction between particles and recoating blade
(particle-to-blade interaction) as well as the interaction between particles and the bottom / side walls of the powder
bed (particle-to-substrate interaction). Since only the surface energy value of the employed model has been calibrated
on the basis of bulk powder experiments by Meier et al. (2018b), verification simulations based on varied parameter
values will be conducted in Section 3.2 in order to assess the sensitivity of the resulting powder layer characteristics
with respect to the aforementioned parameter choice. In accordance to the results by Meier et al. (2018b), it will turn
out that the variation of these parameters (within a reasonable range) will typically have considerably lower influence
on the resulting powder layer characteristics than variations of the surface energy, which lies in the focus of this work.

All simulation results presented in this work rely on a software implementation of the proposed DEM formulation in
the in-house code BACI, a parallel multiphysics research code with finite element, particle and mesh-free functional-
ities, developed at the Institute for Computational Mechanics of the Technical University of Munich (Wall, 2018).

3. Recoating simulations
In this section, the powder recoating process in powder-fusion based metal additive manufacturing will be simulated.
A special focus will lie on the influence of adhesion on the spreadability of the metal powder and the resulting powder
layer characteristics. Besides the actual surface energy γ = γ0 = 0.1mJ/m2 of the considered medium-size powder
(mean particle diameter d̄ = 34µm =: d0 ) as determined by Meier et al. (2018b), also the variations γ = γ0 /4 and
γ = 4γ0 will be investigated. As shown by Yang et al. (2003), the characteristics (e.g. packing fraction, coordination
number, surface uniformity) a layer of cohesive powder takes on in static equilibrium, can in good approximation be
formulated as function of the dimensionless ratio of adhesive (pull-off) and gravity force, which scales quadratically
with the particle diameter according to Fγ /FG ∼ γ/(ρgd2 ). Thus, the increase / decrease of surface energy γ by a fac-
tor of 4 is equivalent to the decrease / increase of particle size d by a factor of 2, which allows to evaluate the influence
of powder particle size on powder bed quality (see Section 3). Specifically, the variations γ = γ0 /4 and γ = 4γ0 are
equivalent to increasing / decreasing the mean particle diameter from d̄ = d0 = 34µm to the values d̄ = 2d0 = 68µm
and d̄ = d0 /2 = 17µm, respectively. Meier et al. (2018b) confirmed this equivalence by comparing funnel simulations
of the variants γ = γ0 , γ = γ0 /4 and γ = 4γ0 (mean particle diameter d̄ = d0 = 34µm in all simulations) with the
experimental bulk powder behavior of the considered medium-sized Ti-6Al-4V powder (d̄ = d0 = 34µm) as well
as of a more coarse-grained and a more fine-grained powder fulfilling the scalings d̄ = 2d0 and d̄ = d0 /2 in good
approximation (identical surface energy γ = γ0 assumed for all three powders employed in the experiments).

In addition to the three cases γ = γ0 , γ = γ0 /4 and γ = 4γ0 , also the (theoretical) case of vanishing adhesion γ = 0,
i.e. the model with no adhesion, will be investigated. As discussed above, the equivalence of increased / decreased
                                                             5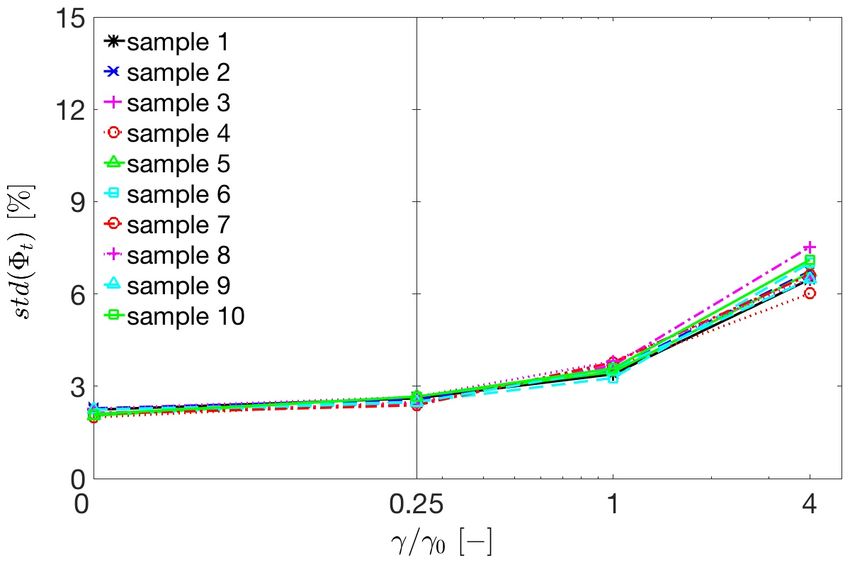
adhesion and decreased / increased particle size can be motivated by the dimensionless adhesion-to-gravity force ratio
Fγ /FG , which is identical in both cases. For clarity, the force ratios considered in this section (calculated for the
scenario of two contacting particles with diameter d̄) as well as the associated equivalent surface energies and mean
particle diameters are plotted in Table 1. Again, the variation of surface energy at constant particle size d̄ = d0 (first
line of Table 1) represents the simulation strategy employed in the present work, whereas the variation of mean par-
ticle size at constant surface energy γ = γ0 (second line of Table 1) rather equals a typical experimental approach.

                      d̄ = d0 ,         γ/γ0 :      0                0.25             1                4
                      γ = γ0 ,          d̄/d0 :     ∞                2                1                0.5
                                      Fγ /FG :      0                3.25             13               52

                   Table 1: Surface energies and equivalent mean particle diameter and adhesion-to-gravity force ratios.

From Table 1, it becomes obvious that the cases γ = γ0 and γ = 4γ0 are characterized by adhesion forces that are one
to two orders of magnitude higher than the gravity forces. In this regime, the cohesiveness of the powder is expected
to have considerable influence on the characteristics (e.g. packing fraction) of the powder layer (Yang et al., 2003).

                    (a) Simulation model for the powder recoating process in metal AM: Initial configuration, γ = γ0 .

                        (b) Intermediate configuration of powder recoating process simulation for the case γ = γ0 .

                         (c) Intermediate configuration of powder recoating process simulation for the case γ = 0.

            Figure 2: Different configurations of the employed simulation model for the powder recoating process in metal AM.

The geometry of the powder recoating model in its initial configuration is shown in Figure 2(a). First, a global Carte-
sian coordinate frame is defined, with the x-axis pointing in recoating direction, and the z-axis representing the build
platform normal direction (see Figure 2(a)). In order to generate the illustrated powder particle configuration, pow-
der particles with random size distribution are initially placed on a Cartesian grid. Under the action of gravity, the
                                                                    6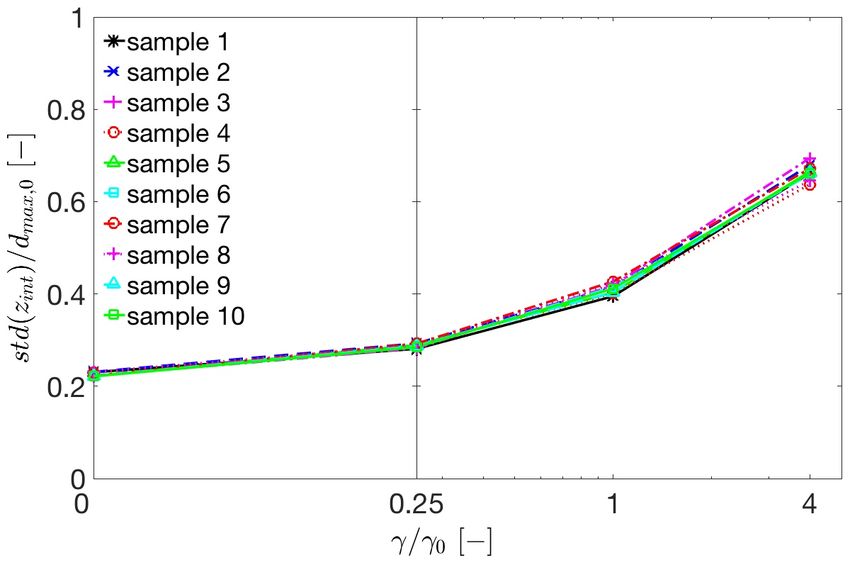
particles fall down and finally settle in a static equilibrium configuration similar to Figure 2(a). Especially for cohe-
sive powders, a realistic gravity-driven initial arrangement of the particles is important, since this first step already
models a possible pre-compaction (due to gravity and inertia forces), which determines the subsequent bulk powder
behavior. After the particles have settled, a defined amount of powder is provided for the recoating process by driving
the platform of the powder reservoir upwards. Subsequently, the recoating blade is driven from the left to the right
with a defined, constant velocity VB to finally spread the powder across the bottom of the powder bed, also denoted as
substrate in the following. The standard blade velocity is chosen as VB = V0 = 10mm/s, unless stated otherwise. In
this low velocity regime, inertia effects can be neglected and the spreading process can be considered as quasi-static.
On the one hand, this strategy helps to isolate the effects under consideration (e.g. adhesion, layer thickness etc.) from
the potential influence of inertia effects. On the other hand, it provides an upper bound for the achievable powder layer
quality, which typically decreases with increasing spreading dynamics (Mindt et al., 2016; Parteli and Pöschel, 2016).
In Section 3.5, the influence of blade velocity will be investigated separately at otherwise fixed process parameters.

In the present setup, the nominal powder layer thickness t0 is defined as the vertical distance from the bottom of the
powder bed to the upper edges of the left / right powder bed boundaries. There is a defined gap of dmin /2 = 10µm
between the lower edge of the recoating blade and these two upper edges of the left / right powder bed boundaries,
which leads to a better agreement of nominal layer height t0 and real mean layer height t. The powder bed dimensions
in x- and y-direction are fixed to 5x1mm, and periodic boundary conditions are applied in y−direction. While different
layer thicknesses t0 = dmax,0 , 2dmax,0 , 3dmax,0 , 4dmax,0 will be investigated in Section 3.4, all remaining studies are
based on a fixed layer thickness of t0 = 3dmax,0 . In order to still guarantee for a small gap between recoating blade
and the largest powder particles in the worst case t0 = dmax,0 , the ”nominal” maximal particle diameter dmax,0 = 50µm
has been chosen slightly larger than the ”actual” maximal particle diameter dmax = D90 = 44µm (see Section 2). The
present work will exclusively focus on stiff / rigid recoating blades of rectangular shape as illustrated in Figure 2. The
analysis of alternative recoating tools such as soft / compliant blades, rakes or rollers is subject to future studies.

Figures 2(b) and 2(c) show intermediate configurations of the recoating process for the adhesion values γ = γ0 and
γ = 0, respectively. Accordingly, the consideration of adhesion leads to a more realistic bulk powder behavior with-
out particles rolling across the bottom of the powder bed. Further, it leads to a less uniform / smooth powder layer
surface, to rather irregular and steeper slopes of the powder pile, to powder particles that stick to the recoating blade,
and also to avalanching effects of cohesive powder agglomerates during the spreading process. These observations are
well-known from experimental studies of the powder recoating process (Ebert et al., 2003; Tan et al., 2017; Yablokova
et al., 2015), and shall in the following be studied and quantified numerically. Therefore, two proper powder layer
metrics will be defined in the subsequent section.

3.1. Metrics for powder bed characterization
Before studying different powder layer configurations, proper metrics need to be defined to quantify and assess the
layer characteristics. Throughout this work, two metrics, namely the surface profile and the packing fraction of the
powder layer, will be employed for this purpose (see Figure 3). In order to measure the surface profile, vertical lines
/ rays are defined on a Cartesian grid with resolution ∆S R in the xy-plane. For each ray, all intersection points with
neighboring particles are determined, and the maximal z-coordinate of these intersection points is taken as surface
profile height z at this xy-position. If no intersection point with neighboring particles exists, the z-coordinate of the
bottom of the powder bed is taken. In a second step, a coarser Cartesian grid with resolution ∆S R,int > ∆S R is in-
troduced, and the integrated / filtered surface profile height z j,int is defined for each 2D segment j on this coarser
grid as the maximal profile height of all rays i within this segment, i.e. z j,int := maxi (zi, j ) (see Figure 3(a)). In this
context, the mean surface profile height is defined as t :=< z j,int >. Here and in the following, the operators < ... >
and std(...) represent the mean and the standard deviation of a (discrete) spatial field. As second metric, the particle
packing fraction is considered. In order to also analyze spatial variations of the packing fraction in the sense of a 2D
xy-field, a further Cartesian grid with resolution ∆PF is introduced, and the local packing fraction value within each
3D bin spanned by the 2D segment j on this grid and the nominal powder layer thickness t0 is defined as the ratio
of particle volume to bin volume, i.e. Φt0, j := V p, j /(t0 ∆2PF ). Equivalently, the packing fraction can also be defined
within a powder layer volume confined by the (actual) mean powder layer thickness t, i.e. Φt, j := V p, j /(t∆2PF ). Certain
                                                              7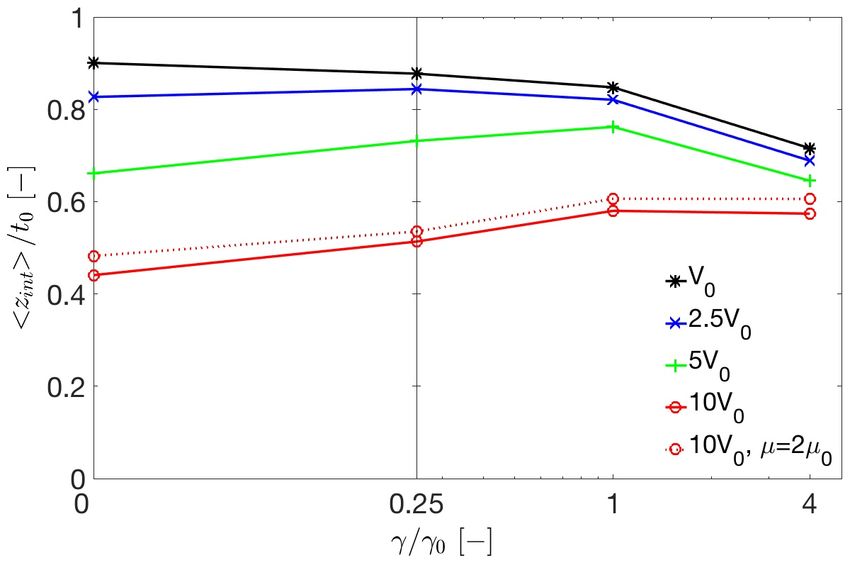
process parameter choices (see e.g. Section 3.5) may lead to a considerably decreased mean layer height t going along
with an (almost) unchanged packing fraction level. Under such circumstances, the (frequently employed) definition
Φt0 based on the nominal layer height t0 would lead to a considerably distorted result. Therefore, the definition Φt
will be preferred throughout this work. The accumulated particle volume within one bin is calculated via numerical
integration (in order to account for the volume of particles cut by the bin walls with sufficient accuracy) based on a
simple voxel strategy with cubical volume elements of side length ∆V . This volume discretization length has to be
small compared to the smallest particle diameter dmin to ensure sufficient integration accuracy. In the present study,
this (purely numerical) parameter has been taken as ∆V = dmin /8 = 2.5µm resulting in relative packing fraction errors
in the range of 0.1%.

                     (a) Definition of surface profile.                              (b) Definition of packing fraction.

                  Figure 3: Schematic diagrams for the definition of surface profile and packing fraction of powder layer.

In the following, the definition of these two metrics shall briefly be motivated. The grid with resolution ∆PF has been
introduced to enable the calculation of a spatial packing fraction field Φ(x, y), which in turn allows to quantify the
variation of the packing fraction across the powder bed. It is important to note that the choice of the resolution / bin
size ∆PF crucially influences the resulting packing fraction variation. From Figure 3(b), it becomes obvious that a
maximal variation between the values Φ = 1 and Φ = 0 might result for very small bin sizes ∆PF /dmin  1 even
if a perfectly uniform packing is considered. Thus, the relation ∆PF /dmin > 1 can be regarded as minimal required
for the bin size. On the other hand, when the bin size approaches the dimensions of the powder layer, the variation
decreases to zero independent of the actual powder bed characteristic. Consequently, this bin size should be motivated
physically, i.e. in dependence on the question that has to be answered by the metric packing fraction variation. In
the present study, the bin size has been set to ∆PF = 100µm, which is in the range of a typical laser beam diameter
employed in SLM processes. This choice can be justified as follows: On the one hand, packing fraction variations
on smaller length scales are only of secondary interest, since these might be homogenized by the highly dynamic
material flow within the melt pool. On the other hand, variations on the length scale of the laser beam diameter and
above might indeed lead to an off-set of adjacent melt tracks and should be resolved by a reasonable metric.

Throughout this work, the variation of the surface profile height will be considered as metric for surface uniformity
and denoted as surface roughness of the powder layer (in contrast to the surface roughness of individual powder parti-
cles due to surface asperities on the nanoscale). The integrated approach of measuring surface roughness as described
above can mainly be motivated by three arguments. First, measuring the surface profile only on the basis of the rays
i without the subsequent integration / filter step accross the segments j is equivalent to a mechanical measurement of
the surface profile with a vertical rod of vanishing diameter. On the other hand, the proposed approach is equivalent to
mechanically measuring the surface profile with a rod of finite thickness ∆S R,int , leading to a limited / finite resolution
of the surface roughness, which is equivalent to common (non-mechanical) approaches of experimental surface profile
characterization (Neef et al., 2014). Second, a minimal / optimal surface roughness is achieved if the particles are

                                                                     8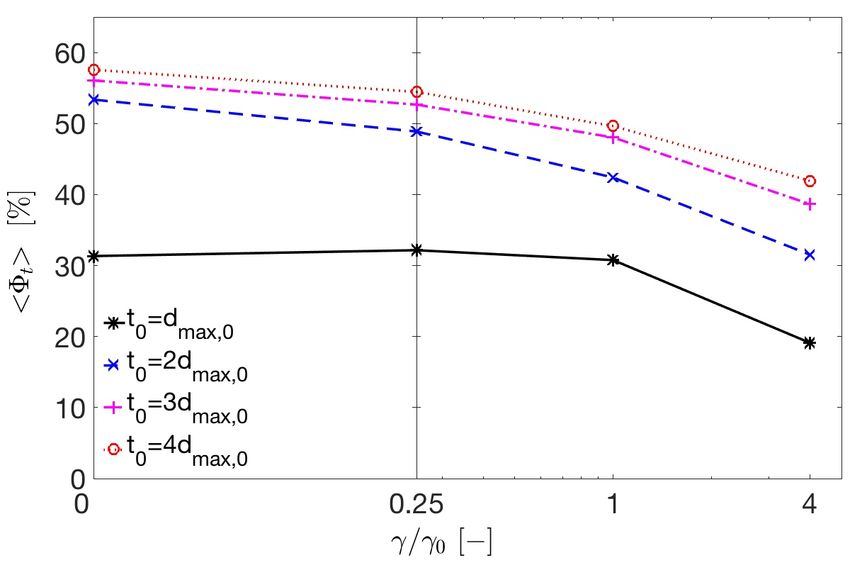
(a) Low SR, High PF.                  (b) Low SR, Low PF.                 (c) High SR, High PF.                (d) High SR, Low PF.

 Figure 4: Examples for powder particle configurations leading to low / high surface roughness (SR) as well as high / low packing fraction (PF).

arranged on a regular grid in a manner as shown in Figure 4(a). The proposed metric naturally assigns a minimal
surface roughness value of zero to this optimal configuration. Third, and most important, the proposed metric leads
to a pure surface characterization and isolates the effects of surface roughness and packing fraction, with the latter
representing a metric of volumetric powder characterization. This can be explained by considering the four different
particle configurations illustrated in Figure 4. In realistic powder beds, there is always a (comparatively high) number
of rays reaching the substrate without intersecting any particle. This effect would lead to surface roughness values,
if only defined via ”unfiltered” rays, that is strongly dependent on the powder layer thickness. The thickness of the
powder layer should, however, not influence the value of a properly defined metric for surface characerization. More-
over, this effect would e.g. also lead to considerably different surface roughness values between the configurations
in Figures 4(a) and 4(b), which actually rather differ in packing fraction than in surface uniformity. Specifically, the
proposed definitions of (filtered / integrated) surface roughness and packing fraction allow to distinguish and isolate
distinct configurations as illustrated in Figures 4(a) to 4(d). In practice, this can be very useful since packing fraction
(variations) can e.g. be associated with thermal conductivity (variations) in the powder bed (Gusarov et al., 2003;
Lechman et al., 2013), the effective / integrated absorptivity across the powder layer thickness with respect to incident
laser energy (Boley et al., 2015; Gusarov, 2008), or shrinkage and resulting layer height (variations) of the solidified
material. On the other hand, surface roughness in the sense of layer height non-uniformity on the length scale of
individual particles might lead to an inhomogeneous energy supply resulting in local overheating / evaporation or
partly molten particles / inclusions, and to an increased tendency of particles on the top of local surface elevations to
be dragged away by the gas flow in the build chamber (Matthews et al., 2016; Zhirnov et al., 2018).

In order to avoid the undesirable influence of boundary effects, the statistical powder bed evaluation will only be
conducted within an area of 3x1mm at the center of the powder bed. In Figure 5, the spatial fields of packing fraction
Φ(x, y) (top row) and surface profile zint (x, y) (bottom row) are plotted for a cohesive powder (γ = γ0 , left column)
and a non-cohesive powder (γ = 0, right column). Accordingly, the cohesive powder results in a decreased powder
bed quality characterized by an increased spatial variation of packing fraction and surface profile height. Moreover,
it appears that the corresponding mean values are lower for the cohesive powder. In the following sections, these
observations will be quantified numerically for different choices of the process parameters. Finally, it shall be noted
that throughout this work, only ”first-layer” simulations are conducted, which helps to reduce the complexity in
interpreting results and to isolate the parameters under consideration from potential effects due to interaction with
previous powder layers. However, the important case of powder being spread on (molten and) solidified material
of the previous layer will be mimicked by analyzing varied interaction parameters (e.g. surface energy, friction
coefficient) between powder and substrate (see Section 3.6).

3.2. Sensitivity with respect to stochastic variation in powder size distribution
As already stated above, the powder particle size distribution is modeled as a log-normal distribution. In this section,
the sensitivity of the resulting powder layer characteristics with respect to different numerical / stochastic realizations
                                                                       9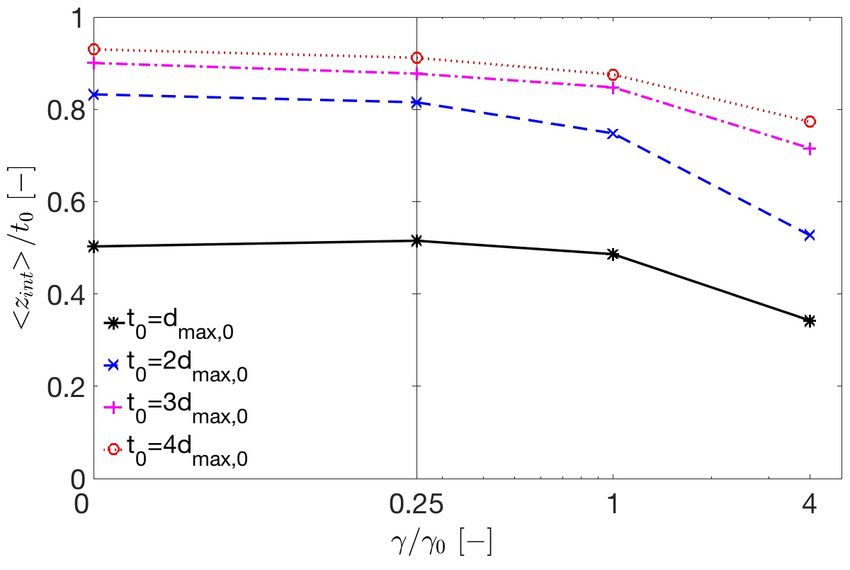
(a) Packing fraction Φ(x, y) of the case γ = γ0 .                              (b) Packing fraction Φ(x, y) of the case γ = 0.

          (c) Surface profile zint (x, y) of the case γ = γ0 .                           (d) Surface profile zint (x, y) of the case γ = 0.

          Figure 5: Spatial packing fraction Φ(x, y) and surface profile zint (x, y) fields for the cases γ = γ0 and γ = 0 (t0 = 3dmax,0 ).

of this (fixed) log-normal distribution (i.e. when taking different powder samples of the same size class) will be in-
vestigated. Figure 6 illustrates the mean values and standard deviations of the packing fraction Φt (x, y) and surface
profile height zint (x, y) field for ten powder samples / numerical realizations of the considered powder particle size dis-
tribution. All in all, it can be concluded that the deviations between the individual curves are small and, consequently,
the sensitivity with respect to different powder samples is reasonably small as well. Assuming that the averaging
across different powder samples is equivalent to the averaging across an increased spatial domain, this observation
also confirms that the size of the representative powder layer volume has been chosen sufficiently large in this study.
Only in the range of the highest adhesion value γ = 4γ0 , the deviations between the different powder samples are
slightly increased, especially when considering the spatial variations of Φt (x, y) and zint (x, y) (bottom row). This ob-
servation might be explained by the presence of larger cohesive particle agglomerates, which would require a larger
representative volume to achieve similarly small deviations as for the non-cohesive powder. Since the variance across
the different powder samples is still reasonably small compared to the change in the considered metrics when compar-
ing different surface energy values, this effect will not be further analyzed in the following. However, if required, this
variance could easily be reduced by either considering a larger representative volume or by averaging results across
different powder samples.

Apart from the effect of different powder samples, the general trends exemplarily observed in Figure 5 can be con-
firmed: Increasing surface energy / cohesiveness leads to decreasing powder layer quality. Concretely, the mean pack-
ing fraction < Φt (x, y) > decreases from almost 60% to a value below 40%, and the mean layer height t :=< zint (x, y) >
decreases from 90% to approximately 70% of the nominal layer height t0 when increasing the surface energy from
γ = 0 to γ = 4γ0 . Similarly, the standard deviation of the packing fraction std(zint (x, y)) increases from 2.5% to 7.5%,
and the standard deviation of the surface profile height std(zint (x, y)) increases from approximately 20% to a value
above 60% of the (nominal) maximal particle diameter dmax,0 . In Section 3.4, these observations will be discussed in
further detail.

3.3. Sensitivity with respect to the choice of mechanical powder properties
While the employed surface energy value γ0 has been determined for the specific powder material based on a fitting of
numerical and experimental AOR measurements, standard values from the literature have been taken for other pow-
der material parameters such as the friction coefficient µ or the coefficient of restitution cCOR . Moreover, under the
                                                                        10
(a) Mean value of packing fraction field Φt (x, y). (b) Mean value of surface profile field zint (x, y).
(c) Standard deviation of packing fraction field Φt (x, y). (d) Standard deviation of surface profile field zint (x, y).
Figure 6: Mean value and standard deviation of Φt (x, y) and zint (x, y) as function of powder cohesiveness γ/γ0 for ten realizations of the powder
particle size distribution (t0 = 3dmax,0 ).
common assumption that global powder kinematics remain unaffected, the stiffness / penalty parameter kN has been
chosen by one to two orders of magnitude smaller than the Young’s modulus of Ti-6Al-4V (Meier et al., 2018b). The
following sensitivity analysis shall justify the choice of these parameters by comparing the powder layer characteris-
tics resulting from this standard parameter set and modified parameter values. Specifically, the friction coefficient and
the coefficient of restitution are increased by 50%, the stiffness parameter is increased by a factor of four. In all cases,
identical parameters are chosen for particle-to-particle and particle-to-wall interaction.
According to Figure 7, the sensitivity / uncertainty of the considered powder layer metrics with respect to these
parameters is again small compared to the increments between the different surface energy values. Moreover, also the
slightly increased deviations observed for the highest surface energy value γ = 4γ0 are in the range of the uncertainty
due to stochastic powder size variations as discussed in the last section. Consequently, the uncertainty in the choice
of these parameters seems to have no noticeable effect on the general statements made in the following sections.
3.4. Influence of powder layer thickness
In this section, the influence of the powder layer thickness will be investigated. Figures 8 and 9 illustrate the
(top and side views of the) final powder layer configurations resulting from the nominal powder layer thicknesses
t0 = dmax,0 , 2dmax,0 , 3dmax,0 , 4dmax,0 (with nominal maximal powder particle diameter dmax,0 = 50µm) as well as from
the surface energy values γ = 0, γ0 /4, γ0 , 4γ0 .
11(a) Mean value of packing fraction field Φt (x, y). (b) Mean value of surface profile field zint (x, y).
(c) Standard deviation of packing fraction field Φt (x, y). (d) Standard deviation of surface profile field zint (x, y).
Figure 7: Mean value and standard deviation of Φt (x, y) and zint (x, y) as function of powder cohesiveness γ/γ0 for different choices of the parameters
µ, kN and cCOR (t0 = 3dmax,0 ).
According to Figure 8, a low powder layer thickness t0 = dmax,0 in the range of the maximal particle diameter leads
to rather sparse particle distributions, but not to continuous and homogeneous powder layers. Similar observations
have e.g. been made by Mindt et al. (2016). Only at the right end of the powder bed, where the powder bed edge
(not illustrated) induces shear forces onto the bulk powder, a slightly increased packing density can be observed (at
least for the less cohesive powders). With increasing nominal thickness t0 , the powder layer becomes increasingly
continuous. For the less cohesive powders γ = 0 and γ = γ0 /4 this state is already reached at t0 = 2dmax,0 , while the
more cohesive powders γ = γ0 and γ = 4γ0 require a layer thickness of t0 = 3dmax,0 and t0 = 4dmax,0 , respectively, in
order to end up with a continuous powder layer. It is well-known that increasingly cohesive powders are characterized
by lower packing fractions. Moreover, the particle agglomerates within highly cohesive powders are subject to higher
and stronger varying resistance forces when passing through the gap of the recoating blade, which, in turn, results
in less dense and rather irregular powder layers in the range of small blade gaps. Larger agglomerates that do not fit
through this gap are sheared off as long as the adhesion between the bulk powder and the substrate is high enough
to guarantee for stick friction. Eventually, Figure 9 visualizes how the surface roughness increases with increasing
cohesion / surface energy, which can partly be attributed to the presence of larger particle agglomerates, but also to
particles that are ripped out of the layer compound due to particle-to-blade adhesion. It has to be mentioned that the
2D projections employed in Figure 9 lead to an averaging effect in (the periodic) y-direction and, thus, to 1D surface
profiles that look smoother than the (actual) 2D surfaces are. This effect can easily be observed when comparing
the 2D projections in Figures 9(i) and 9(k) with the corresponding 3D plots in Figures 5(d) and 5(c), derived from
12(a) t0 = dmax,0 , γ = 0. (b) t0 = dmax,0 , γ = γ0 /4.
(c) t0 = dmax,0 , γ = γ0 . (d) t0 = dmax,0 , γ = 4γ0 .
(e) t0 = 2dmax,0 , γ = 0. (f) t0 = 2dmax,0 , γ = γ0 /4.
(g) t0 = 2dmax,0 , γ = γ0 . (h) t0 = 2dmax,0 , γ = 4γ0 .
(i) t0 = 3dmax,0 , γ = 0. (j) t0 = 3dmax,0 , γ = γ0 /4.
(k) t0 = 3dmax,0 , γ = γ0 . (l) t0 = 3dmax,0 , γ = 4γ0 .
(m) t0 = 4dmax,0 , γ = 0. (n) t0 = 4dmax,0 , γ = γ0 /4.
(o) t0 = 4dmax,0 , γ = γ0 . (p) t0 = 4dmax,0 , γ = 4γ0 .
Figure 8: Resulting powder layers for different layer thicknesses t0 and surface energies γ: Top view on powder bed.
13(a) t0 = dmax,0 , γ = 0. (b) t0 = dmax,0 , γ = γ0 /4.
(c) t0 = dmax,0 , γ = γ0 . (d) t0 = dmax,0 , γ = 4γ0 .
(e) t0 = 2dmax,0 , γ = 0. (f) t0 = 2dmax,0 , γ = γ0 /4.
(g) t0 = 2dmax,0 , γ = γ0 . (h) t0 = 2dmax,0 , γ = 4γ0 .
(i) t0 = 3dmax,0 , γ = 0. (j) t0 = 3dmax,0 , γ = γ0 /4.
(k) t0 = 3dmax,0 , γ = γ0 . (l) t0 = 3dmax,0 , γ = 4γ0 .
(m) t0 = 4dmax,0 , γ = 0. (n) t0 = 4dmax,0 , γ = γ0 /4.
(o) t0 = 4dmax,0 , γ = γ0 . (p) t0 = 4dmax,0 , γ = 4γ0 .
Figure 9: Resulting powder layers for different layer thicknesses t0 and surface energies γ: Side view on powder bed.
the same numerical simulations. A similar ”artificial smoothing effect” also occurs in approaches that apply such a
projected 1D surface profile for the statistical evaluation of the surface profile / roughness (Parteli and Pöschel, 2016).
In order to avoid this undesirably smoothing of the surface roughness, the real 2D surface profiles (see Figure 5) are
employed for statistical evaluation throughout this work.
Figure 10(a) illustrates the mean packing fraction < Φt (x, y) > for the different powder layer thicknesses. It is well-
known that the packing fraction in cohesive powders decreases with increasing adhesion forces between the particles,
which hinders the gravity-driven settling of the particles (Walton, 2008; Yang et al., 2003). This effect can also be
observed in Figure 10(a). Moreover, the packing densities increase with increasing layer thickness since the particles
can increasingly arrange in an optimal manner and the relative influence of (negative) boundary effects at the bottom
and the top of the powder layer decreases. The difference between the cases t0 = 3dmax,0 and t0 = 4dmax,0 is already
very small, and, thus, the layer thickness t0 = 3dmax,0 can already be considered as reasonably close to the optimum.
Obviously, the extreme case t0 = dmax,0 does not lead to a continuous powder layer and, thus, results in a very low
packing density. This discontinuous powder layer leads to non-representative standard deviations of the fields Φt (x, y)
and zint (x, y). Thus, for reasons of better comprehensibility, this case will not be considered in the subsequent standard
deviation plots.
According to Figure 10(c), the associated standard deviation std(Φt (x, y)) of the packing fraction field increases with
increasing powder cohesiveness. This behavior might be explained by the following two arguments: First, with in-
creasing cohesiveness, particle agglomerates become larger compared to the bin size underlying the packing fraction
14(a) Mean value of packing fraction field Φt (x, y). (b) Mean value of surface profile field zint (x, y).
(c) Standard deviation of packing fraction field Φt (x, y). (d) Standard deviation of surface profile field zint (x, y).
Figure 10: Mean value and standard deviation of Φt (x, y) and zint (x, y) as function of powder cohesiveness γ/γ0 for different nominal layer
thicknesses t0 .
calculation, which results in less packing fraction averaging across individual bins. Second, surface roughness in-
creases with increasing adhesion (see below), and these surface profile variations between minimal and mean layer
height (chosen as upper bound of the bins) also lead to packing fraction variations. The decreasing influence of these
surface effects with increasing layer thickness is one reason, why also the packing fraction variations decrease with
increasing layer thickness. A second reason why packing fraction variations decrease with increasing layer thickness
- and why this effect is more pronounced in the regime of high surface energies - is the increasing ratio of bin height
/ volume to the size of powder particles / agglomerates when increasing the layer thickness, which again leads to an
increased averaging effect.
Figures 10(b) and 10(d) visualize the mean surface profile height t :=< zint (x, y) > as well as the associated standard
deviation std(zint (x, y)), i.e. the surface roughness. Accordingly, the surface roughness increases with the cohesiveness
of the powder. This observation can partly be attributed to the presence of larger particle agglomerates, but also to
particles that are ripped out of the layer compound near the surface due to particle-to-blade adhesion. Since the height
of surface asperities is naturally bounded by the lower edge of the recoating blade, this higher surface roughness in
turn leads to a decreasing mean value t of the surface profile when increasing the surface energy (see Figures 10(b)).
According to Figure 10(b), the ratio of mean layer height t to nominal layer height t0 increases with increasing nomi-
nal layer height between t0 = 2dmax,0 and t0 = 4dmax,0 . However, this effect can mainly be attributed to the increasing
factor t0 used for normalization. For comparison, Figure 11(b) represents the relative error (t − t0 )/dmax,0 between real
15(a) Alternative definitions of mean packing fraction (t0 = 4dmax,0 ). (b) Relative error in mean surface profile height t :=< zint (x, y) >.
Figure 11: Alternative metrics for evaluation of mean packing fraction and surface profile height for different nominal layer thicknesses t0 .
and nominal layer height normalized with the constant factor dmax,0 , and suggests that this error is almost independent
of the nominal layer thickness t0 . The same observation can be made for the standard deviation of the surface profile
in Figure 10(d). It is interesting to realize that for layer thicknesses of t0 = 2dmax,0 and above only the relative
deviations between the real and nominal surface profile depend on the nominal layer thickness t0 , but not the absolute
deviations. In other words: Even though the nominal thicknesses t0 = 3dmax,0 and t0 = 4dmax,0 lead to (comparatively)
continuous powder layers with only a few blank spots on the substrate, these powder layers comprise a top region of
height 2dmax,0 with similar characteristics as the discontinuous powder layer resulting from the choice t0 = 2dmax,0 .
At the end of this section, alternative definitions of the mean packing fraction < Φ(x, y) > based on different represen-
tative volumes and the case t0 = 4dmax,0 (see Figure 11(a)) shall be discussed and compared to the results presented
above. As expected, the alternative definition < Φt0 (x, y) > considering the entire nominal powder layer volume of
height t0 leads to a lower mean packing fraction than the variant < Φt (x, y) > limited by the real mean layer height t.
With increasing relative deviation between the real and nominal layer thicknesses t and t0 (e.g. in the range of small
nominal layer thicknesses t0 or high blade velocities VB , see Section 3.5), the alternative (and frequently employed)
metric < Φt0 (x, y) > increasingly underestimates the actual packing fraction values within the powder layer, and is con-
sequently less suitable for powder layer characterization. In addition to the two metrics < Φt (x, y) > and < Φt0 (x, y) >,
also mean packing fractions calculated for powder sub-layers limited by the z-coordinate intervals z ∈ [0; dmax,0 ] (bot-
tom layer close to the substrate), z ∈ [dmax,0 ; 2dmax,0 ] and z ∈ [2dmax,0 ; 3dmax,0 ] are presented in Figure 11(a) (even
for the case γ = 4γ0 , the z-coordinate z = 3dmax,0 is below the coordinate associated with the mean layer height
< zint > |γ=4γ0 ≈ 3.1dmax,0 , see Figure 11(b)). For the non-cohesive case γ = 0, the aforementioned boundary effect of
reduced packing fraction at the bottom of the powder layer can observed: While the upper layers z ∈ [dmax,0 ; 2dmax,0 ]
and z ∈ [2dmax,0 ; 3dmax,0 ] have almost identical packing fractions (of approximately 62 %) above the mean value
< Φt (x, y) > (approximately 58 %), the bottom layer z ∈ [0; dmax,0 ] shows a reduced packing fraction (of approximately
56 %). Obviously, the surface roughness in the top layer z ∈ [3dmax,0 ; t] (not shown in Figure 11(b)) must lead to an
even smaller packing fraction to end up with the mean value < Φt (x, y) > across the entire layer thickness z ∈ [0; t].
With increasing powder cohesiveness, this behavior changes: For the case γ = 4γ0 , powder layer depressions due to
surface roughness reach deep into the layer z ∈ [2dmax,0 ; 3dmax,0 ] (third from the bottom) resulting in lower packing
fractions than in the very bottom layer z ∈ [0; dmax,0 ]. This observation can easily be verified by subtracting the stan-
dard deviation of the surface profile height (std(zint )|γ=4γ0 ≈ 0.6dmax,0 , Figure 10(d)) from the corresponding mean
value (< zint > |γ=4γ0 ≈ 3.1dmax,0 , see Figure 11(b)), which yields a value of zint = 2.5dmax,0 ∈ [2dmax,0 ; 3dmax,0 ]. All
in all, the sub-layer z ∈ [dmax,0 ; 2dmax,0 ] is least biased by boundary effects on the top and bottom of the powder bed,
and, thus, the resulting packing fraction is closest to packing fraction values measured for larger bulk powder volumes.
For comparison, the packing fraction has also been determined for the bulk powder in the powder reservoir after the
16initial, gravity-driven settling (see e.g. Figure 2(a)). The corresponding results of the four cases γ = 0, γ0 /4, γ0 , 4γ0
are plotted in Figure 11(a) as well. Accordingly, mean packing fraction values of approximately < Φ > |γ=0 = 62%
and < Φ > |γ=4γ0 = 54% result for the initial powder configuration and the surface energies γ = 0 and γ = 4γ0 , respec-
tively, while the corresponding values within the (densest) sub-layer z ∈ [dmax,0 ; 2dmax,0 ] of the recoated powder are
< Φ > |γ=0 = 61% and < Φ > |γ=4γ0 = 46% (see Figure 11(a)). Two conclusions can be drawn from these deviations:
First, the packing fractions determined for the bulk powder after gravity-driven settling are still higher than the (max-
imal) values prevalent in the recoated powder layer. For the case γ = 4γ0 , this difference is considerable (reduction
from 54% to 46%). This might be explained by remaining surface roughness effects that still influence the resulting
packing fraction, even for the sub-layer z ∈ [dmax,0 ; 2dmax,0 ] with maximal packing fraction. Moreover, also a reduced
level of compression forces (as compared to the gravity-driven powder settling) as well as the presence of shear and
tension forces during the recoating of cohesive powders can explain this loosening of the powder packing during re-
coating. Second, the drop of packing fraction from 62% to 54% when increasing the adhesion-to-gravity force ratio
Fγ /FG from 0 to approximately 50 (which represents the case γ = 4γ0 ) is in very good agreement with corresponding
results by Yang et al. (2003) (see Figure 4 of this reference evaluated for a particle diameter of d = 65µm, which yields
a ratio Fγ /FG ≈ 50), despite the slightly different system parameters chosen in this reference (i.e. smaller friction
coefficient, uni-sized powder instead of size distribution). This result serves as further verification of the present mod-
eling approach and the general strategy of analyzing dimensionless adhesion-to-gravity force ratios. Moreover, this
conformity of results also suggests that the differing parameters of the two approaches (friction coefficient, specific
particle size distribution) play only a secondary role compared to the adhesion-to-gravity force ratio (determined on
the basis of the mean particle size).
Finally, it shall again be emphasized that the packing fraction values determined for thin powder layers might be
strongly influenced by boundary effects on the bottom and the top of the powder layer. For example, only slight
changes in the representative volume considered for packing fraction calculation can readily lead to drastically dif-
ferent results. These effects need to be taken into account when comparing different packing fraction values stated in
the literature. Throughout this work, the packing fraction < Φt (x, y) > defined across the mean layer height z ∈ [0; t]
will be applied. On the one hand, this definition avoids deterioration of packing fraction results for powder layers of
reduced thickness t (see e.g. Figure 13(c)) as it would be the case for the variant < Φt0 (x, y) >. On the other hand, it
does include boundary effects on the bottom and top of the powder layer, which are typical for the thin powder layers
employed in metal AM and relevant for the subsequent melting process.
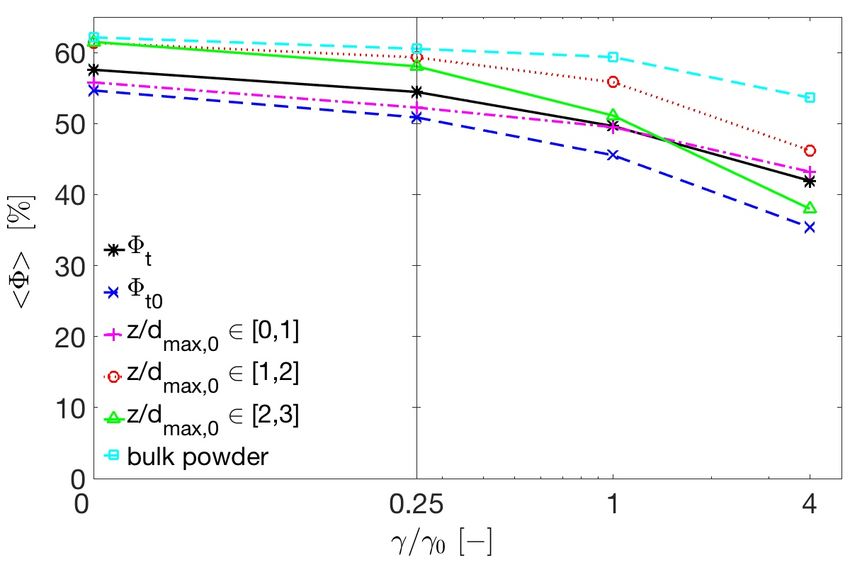
3.5. Influence of blade velocity
While so far only the ideal case of quasi-static powder spreading has been considered, this section will focus on the in-
fluence of spreading velocity. It is known from existing experimental (Meyer et al., 2017) and numerical (Mindt et al.,
2016; Parteli and Pöschel, 2016) studies that increased blade velocity typically deteriorates the powder layer quality.
Here, this deterioration will be quantified by means of the proposed metrics as illustrated in Figure 12. Thereto, the
four different blade velocities VB = V0 , 2.5V0 , 5V0 and 10V0 will be investigated. A special focus will lie on the
influence of adhesion.
Among the four metrics in Figure 12, the highest sensitivity with respect to blade velocity can be observed for the
mean layer height (Figure 12(b)). It is characterized by two effects: First, the mean layer height t =< zint (x, y) >
decreases drastically with increasing blade velocity. For VB = 10V0 and γ = 0, the mean layer height is less than half
of the nominal layer height t0 . Second, the effect of increased blade velocity decreases with increasing adhesion. For
blade velocities VB ≥ 5V0 , the mean layer height even increases when increasing the adhesion from γ = 0 to γ = γ0 .
This observation shall be explained by means of Figure 13 visualizing an intermediate and the final configuration of
the recoating process for the cases γ = 0 and γ = γ0 . By comparing Figures 13(a) and 13(c), it becomes obvious
that the layer thickness of the non-cohesive powder further decreases with time at local positions that have already
been passed by the recoating blade. This means that the momentum induced by the recoating blade is high enough to
sustain the powder flow for some time even though the blade has already passed the considered location. Increasing
adhesion reduces the flowability of the powder, i.e. the powder sticks together and to the substrate, which in turn
reduces the post-flow of powder as well as the resulting layer thickness reduction. While it is typically claimed that
17You can also read