Towards Easy Comparison of Local Businesses Using Online Reviews
←
→
Page content transcription
If your browser does not render page correctly, please read the page content below
Eurographics Conference on Visualization (EuroVis) 2018                                                                               Volume 37 (2018), Number 3
J. Heer, H. Leitte, and T. Ropinski
(Guest Editors)

          Towards Easy Comparison of Local Businesses Using Online
                                Reviews

                        Yong Wang1 , Hammad Haleem1 , Conglei Shi2 , Yanhong Wu3 , Xun Zhao1 , Siwei Fu1 and Huamin Qu1
                                                         1 the   Hong Kong University of Science and Technology, China
                                                                               2 Airbnb Inc., USA
                                                                             3 Visa Research, USA

        Abstract
        With the rapid development of e-commerce, there is an increasing number of online review websites, such as Yelp, to help
        customers make better purchase decisions. Viewing online reviews, including the rating score and text comments by other
        customers, and conducting a comparison between different businesses are the key to making an optimal decision. However,
        due to the massive amount of online reviews, the potential difference of user rating standards, and the significant variance
        of review time, length, details and quality, it is difficult for customers to achieve a quick and comprehensive comparison.
        In this paper, we present E-Comp, a carefully-designed visual analytics system based on online reviews, to help customers
        compare local businesses at different levels of details. More specifically, intuitive glyphs overlaid on maps are designed for
        quick candidate selection. Grouped Sankey diagram visualizing the rating difference by common customers is chosen for more
        reliable comparison of two businesses. Augmented word cloud showing adjective-noun word pairs, combined with a temporal
        view, is proposed to facilitate in-depth comparison of businesses in terms of different time periods, rating scores and features.
        The effectiveness and usability of E-Comp are demonstrated through a case study and in-depth user interviews.
        CCS Concepts
        •Human-centered computing ! Information visualization; Visualization design and evaluation methods;

1. Introduction                                                                             distribution [HPZ06]. Also, it lacks the temporal details of cus-
                                                                                            tomer reviews [GS12,WH08] and other important information. For
Numerous customer review websites or e-commerce platforms                                   example, how do the customer evaluations for a selected business
(e.g., Yelp, TripAdvisor and Airbnb) have been launched recently.                           entity evolve with time (e.g., good evaluations in the past but bad
All of them allow users to post reviews for restaurants, shops, ho-                         ratings in the recent, or vice versa)? What is the main difference be-
tels, etc., which are called local businesses in this paper. These                          tween two businesses with exactly the same rating? Customers of-
reviews, usually consisting of both a numerical rating and a text                           ten check the review text to get more details of previous customers’
description, have a strong influence on the purchase decision of                            opinion. Unfortunately, there are usually many reviews for single
customers [FM14,YLG09]. The online reviews have become a ma-                                local business and the large volume of review text leads to infor-
jor resource to help customers make a purchase decision in many                             mation overload [BAC12]. Moreover, customers have to compare
application scenarios, for example, finding a good restaurant for                           various business features revealed in the review texts by memory.
an important celebration [Nie], choosing a professional barbershop                          These factors make it difficult to conduct an efficient review sum-
for a stylish haircut [Mor11] or booking a suitable hotel for a dis-                        mary and reliable comparison of local businesses.
tant trip [GY08]. In most cases, there would be many candidates
for a specific type of service or products, satisfying the customer
requirements. Customers need to read online reviews to compare                                 Prior research work mainly uses review text to summarize cus-
them and make an optimal choice.                                                            tomer opinions [YNTT11b, WZG⇤ 14, WWL⇤ 10]. They either use
                                                                                            traditional word clouds showing single words with most frequency
  However, it is not an easy task to use existing online reviews to                         or abstract the review sentiments into an augmented scatterplot to
make a quick comparison. Most review websites calculate an aver-                            show the review content. However, their major focus is to provide
age rating for each business entity from all the customers’ ratings.                        a review summary for individual business and lack detailed context
Such an average rating provides an indication about customers’                              (as will be discussed in Section 6.3). Thus, they are not suitable
overall assessment to some extent, but the average rating score does                        for detailed comparison between different businesses. Opinion Ob-
not necessarily reveal the true business quality due to its bimodal                         server [LHC05] compares review sentiment of two businesses us-

 c 2018 The Author(s)
Computer Graphics Forum c 2018 The Eurographics Association and John
Wiley & Sons Ltd. Published by John Wiley & Sons Ltd.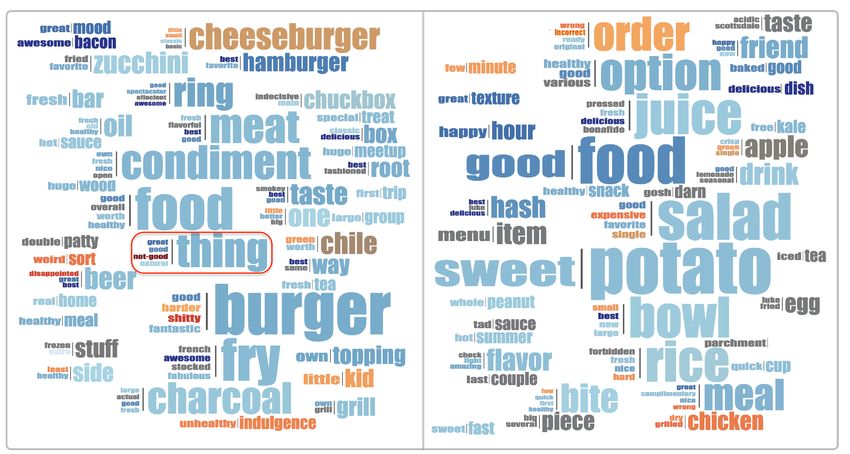
Y. Wang et al. / Towards Easy Comparison of Local Businesses Using Online Reviews

ing the basic bar charts, but it is still unable to provide users with      tion is often used to enhance visual comparisons [Gle18, HVW08,
deep insights about the difference between them.                            SMDS14].
   In this paper, we present E-Comp, a visual analytics system, to             In this paper, we use side-by-side comparison and enable inter-
help customers quickly compare local businesses, where both the             actions to compare different aspects of local businesses.
numerical rating and review text are considered. Based on our in-
terview with end users, we divide the whole comparison of local
                                                                            2.2. User Review Visualization
businesses into two stages: preliminary comparison and detailed
comparison. Preliminary comparison aims at quickly selecting the            Visual analysis of user reviews can facilitate an overall understand-
interested businesses from all the choices and detailed compari-            ing about the products or services and has been extensively re-
son supports revealing insightful differences between them. An in-          searched in recent years. For example, visual analytics has been
tuitive glyph is designed to encode the most important features             applied to analyzing user reviews of devices [LHC05, OHR⇤ 09],
for preliminary comparison, including customer number, average              hotels [WWL⇤ 10], films [BML17]. They mainly extracted dif-
rating, each rating percentage, business similarity and price. For          ferent features of the products or services from the reviews and
detailed comparison, we propose a novel augmented word cloud                further visualize those features to provide an overall understand-
showing grouped adjective-noun word pairs, to support an easy               ing of the reviews. Other researchers often focused on visualizing
comparison of different aspects of local businesses. Considering            review text, where word clouds combined with sentiment analy-
that different customers may have significantly different criteria          sis [KPK17] are usually used. Yatani et al. [YNTT11b] visualized
when rating the businesses, we propose using the rating difference          user reviews by showing a word cloud consisting of adjective-noun
by the common customers who rated both businesses to gain more              word pairs. Similarly, Wang et al. [WZG⇤ 14] arranged semanti-
reliable comparison through a grouped Sankey diagram. Interac-              cally similar words close to each other in the word cloud. Compare
tive comparison of the temporal distribution of reviews is also en-         Cloud [DES⇤ 15] visualized words of text corpora to compare me-
abled, helping users quickly understand the temporal evolution of           dia frames. Prefix tag clouds [BLPW13] used a prefix tree to group
the customer reviews. The major contributions of this paper can be          different word forms and visualized them as a word cloud. The re-
summarized as follows:                                                      cently proposed SentenTree [HWS17] linked words based on their
                                                                            co-occurrence to provide more semantic meanings. These methods
• An interactive visualization system to help customers conduct
                                                                            can give users a basic overview of the review content, but are diffi-
  preliminary and detailed comparisons of local businesses.
                                                                            cult to support detailed comparison and provide deep insights about
• An intuitive glyph design to support a fast selection of local
                                                                            the reviews.
  business candidates and a novel augmented word cloud showing
  adjective-noun word pairs to enable detailed comparison.                    Inspired by [YNTT11b], we propose an augmented word cloud
• A case study and in-depth user interviews to demonstrate the              design to show grouped adjective-noun word pairs, enabling better
  effectiveness and usability of the proposed method.                       comparison between local businesses through user reviews.

                                                                            2.3. Opinion Extraction
2. Related Work
                                                                            Opinion extraction, also called opinion mining or sentiment anal-
The related work of this paper can be categorized into three groups:        ysis, aims at summarizing the opinions expressed in the text,
visual comparison, review visualization and opinion extraction.             which has attracted lots of attention in the text mining field. Sev-
2.1. Visual Comparison                                                      eral comprehensive surveys about opinion extraction and summary
                                                                            can be found in [KGSZ11, BHML16]. More specifically, Hu and
Visual comparison is a typical and fundamental visualization                Liu [HL04] summarized opinions from review text by extract-
task [Gle18, KH13], which aims at understanding the similarity or           ing the product features and further identifying opinions. Yu et
difference between data. According to Gleicher et al. [GAW⇤ 11],            al. [YHSZ16] proposed a phrase-based approach for summariz-
visual comparison can generally be classified into three comple-            ing reviews. Yatani et al. [YNTT11a] obtained the adjective-noun
mentary categories: 1) spatial and temporal juxtaposition (e.g.,            word pairs to show the opinions in review text. Other researchers
side-by-side comparison), 2) superposition (i.e., overlay), and             tried to extract opinions through sentiment analysis [PL08]. In ad-
3) explicit encoding of the difference (i.e., visually displaying           dition, many excellent natural language processing (NLP) libraries
the similarities and differences). These three basic methods and            are published (e.g., NLTK [nat], TextBlob [Lor17]), allowing gen-
combinations of them have been widely used in many applica-                 eral users to process text data and extract opinions.
tions [SWL⇤ 14, WSA⇤ 16, SMDS14]. Juxtaposition places the ob-
jects side-by-side to support comparison between them [GLG⇤ 13,                In this paper, we use the NLP libraries to analyze review text and
NSH⇤ 18, KPBG13, ZWC⇤ 18]. Superposition shows the objects to               extract adjective-noun word pairs. But different from [YNTT11a],
be compared in the same space to investigate the differences be-            we further classify the word pairs into several semantically mean-
tween data, which is especially useful when the spatial location is         ingful categories and group the word pairs with common noun word
a key component of the comparison [WDSC07]. When the differ-                to facilitate the comparison between local businesses.
ence between objects can be explicitly computed, explicit encod-
ing can be a good choice for visual comparison, which has been              3. Requirement Analysis and Data Model
applied in many applications including TACO [NSH⇤ 18], Graph-
Diaries [BPF14] and AmbiguityVis [WSA⇤ 16]. Besides, interac-               In this section, we summarize the design requirements and basic
                                                                            tasks. The dataset used in this paper is also introduced.

                                                                                                                                                c 2018 The Author(s)
                                                                               Computer Graphics Forum c 2018 The Eurographics Association and John Wiley & Sons Ltd.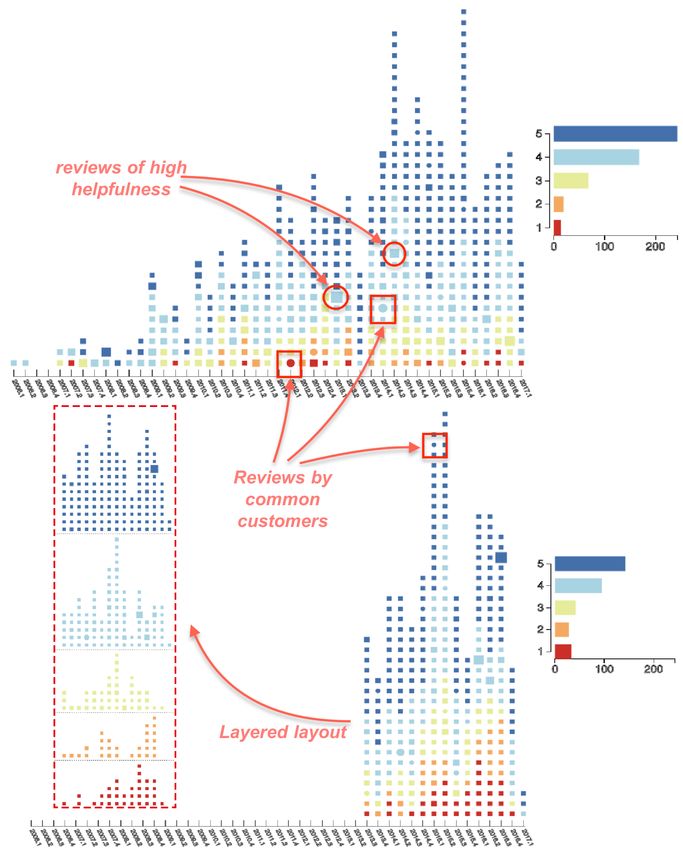
Y. Wang et al. / Towards Easy Comparison of Local Businesses Using Online Reviews
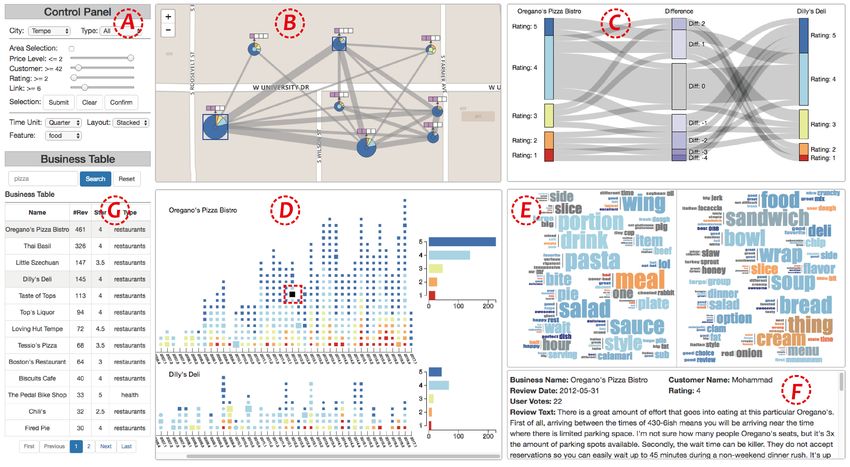
Figure 1: The user interface of E-Comp. (A) Control panel allows users to filter the data and change other views. (B) Map view shows glyphs
encoding the basic attributes of local businesses, where the selected businesses are marked with a blue rectangle. (C) Common customer
comparison view shows the rating difference of common customers. (D) Temporal view visualizes the temporal trend of reviews and encodes
the helpfulness of individual reviews through the rectangle or circle size. (E) Augmented word cloud view compares the adjective-noun word
pairs with high frequency for one feature dimension in the review text. (F) Detailed review text view shows the details of the selected review
(the dotted red rectangle) in Temporal View. (G) Business table lists the local businesses in the selected region.
3.1. Design Requirements and Tasks back, we also investigated prior studies on online reviews. Based
on these, we compiled a list of design requirements:
To better understand the user requirements when reading online re-
views to compare local businesses, we conducted user interviews R1 Quick overview for filtering potential candidates. As sug-
with four participants (1 female, age: 22 to 29). They are postgrad- gested by participants, the first step of finding an optimal lo-
uate students or research staff in a university and have an experi- cal business is to select several potential candidates satisfying
ence of at least four years in using online reviews for making pur- customers’ basic requirements by using features like price, lo-
chase decisions. We asked them about the major procedures and cation and other customers’ review rating. For the review rat-
important review features they will use to compare businesses. We ing, they mainly use the average rating score, the ratio of good
also encouraged them to report their expected requirements for a and bad ratings, and the total review number (indicating the
review-based business comparison tool. According to their feed- popularity of a local business) for quick filtering. Prior stud-
back, when using online reviews for purchase decision-making, ies [LHC05, DFAG13] also confirm the importance of quick
their exploration of using online reviews for purchase decision- summary of online reviews. However, in most existing online
making usually includes two stages: preliminary comparison to review platforms, users need to browse a long list of businesses
select candidates and detailed comparison to make a final decision. and sometimes switch between the basic information pages of
In the preliminary comparison, they mainly use the basic informa- the interested businesses, which is not convenient for quick se-
tion of businesses, e.g., average rating score, percentage of each lection of candidates.
level of ratings, location and price, to select a few candidates. For R2 Reliable comparison between businesses. Due to the large vol-
the detailed comparison, all the participants mainly rely on the de- ume of online reviews, the participants said that they usually are
tailed ratings and review texts. However, the overwhelming volume not able to read enough reviews quickly before making a pur-
of user reviews hinders them from gaining a quick understanding of chase, which makes their decisions probably biased. Also, differ-
the overall reviews, which is consistent with prior studies [BAC12]. ent customers may have quite different rating criteria and pref-
The majority of the participants instead choose to read only several erence, making them not as reliable as expected. Therefore, a
latest reviews, though it is probably biased and unreliable. Thus, comprehensive and reliable comparison of online reviews facili-
they would highly appreciate it if a tool supporting reliable and fast tates more accurate decision making [MS10].
comparison of local businesses is available. Besides the user feed- R3 Temporal analysis of user reviews. Prior work [GS12, WH08]
c 2018 The Author(s)
Computer Graphics Forum c 2018 The Eurographics Association and John Wiley & Sons Ltd.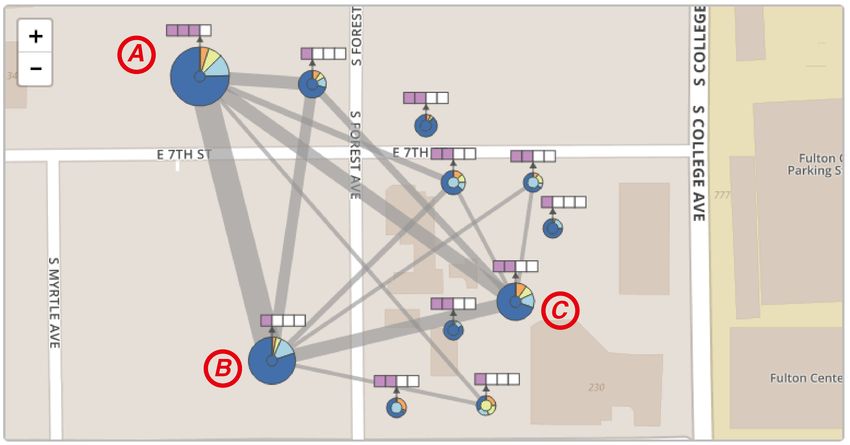
Y. Wang et al. / Towards Easy Comparison of Local Businesses Using Online Reviews

   has studied the temporal evolution of online reviews. The tem-
   poral analysis supports a deep understanding of the dynamic
   changes such as the overall trend of user rating [WH08] and
   the dynamic influence of online reviews on user purchase behav-
   iors [Cad15]. Our interview participants also showed interest in
   similar questions: Is the business receiving more and more good
   reviews or just the opposite? What is the difference between re-
   cent reviews and older reviews? Answering these questions re-             Figure 2: Visual design for the glyph overlaid on the map. (a) A
   quires a temporal analysis of reviews.                                    radar-diagram based glyph design, (b) a bar-chart based glyph de-
R4 Insightful details of important features. Our participants re-            sign, (c) a pie-chart based glyph design.
   ported that they are usually interested in the important features
   of local businesses. For example, for a restaurant, they may care
   about the price, food taste, service and environment. Extracting          by using the ratings from common customers, Temporal View vi-
   the important features from online reviews is also emphasized in          sualizes and compares the temporal distributions of customer rat-
   prior studies [DFAG13,HL04]. Manually reading all the reviews             ings, and augmented word cloud view is proposed to help customers
   to gain insights is time-consuming. Automatically providing in-           quickly understand the major characteristics of local businesses.
   sightful details of important features would greatly help the pur-
                                                                             5. Preliminary Comparison
   chase decision making.
R5 Detailed review exploration on demand. The participants said              This section introduces the visual designs for preliminary compar-
   that they usually read some reviews carefully to gain more de-            ison.
   tails, especially those reviews with high helpfulness. It helps
                                                                             5.1. Glyph-based Visualizations
   confirm the exploration findings by them.
R6 Intuitive visual designs. The target users of the proposed sys-           According to R1, one fundamental task of using online reviews to
   tem are general customers with no background knowledge of vi-             make a purchase decision is to quickly select the potential local
   sualization. Therefore, intuitive visual designs would be more            businesses. Customers usually do filtering based on the factors like
   desirable than complex designs that probably confuse users.               average ratings, percentages of good/bad ratings, popularity indi-
                                                                             cated by the number of existing reviews and the price level, which
 3.2. Data Abstraction                                                       are also used for preliminary comparison in this paper. Considering
                                                                             the advantages of glyphs in conveying the overall information of
 We mainly use the Yelp dataset [yel]. It contains 4.1 million re-
                                                                             multiple attributes [War08], we chose to design intuitive glyphs to
 views for 144 thousand local businesses in 11 cities across 4 coun-
                                                                             show these essential features (R6). We proposed a pie-chart based
 tries, where we extracted the review data in three cities: Toronto,
                                                                             glyph, as shown in Figure 2c. Considering that area is an effective
 Las Vegas and Tempe. Each review contains both a numeric rating
                                                                             visual channel in pie chart [SK16, BEW16], we use the outer circle
 ranging from 1 to 5 and review text. Other information about the
                                                                             area to indicate the total number of customer reviews. Each sector
 review, including the actual time, the corresponding information of
                                                                             of the pie chart encodes the review number of each rating level.
 businesses and customers and the helpfulness votes, are also pro-
                                                                             The inner circle has fixed area and its color represents the average
 vided. The detailed business information includes its name, loca-
                                                                             rating of all the customers. The upper bar shows the price level of
 tion, average rating, city, etc. The proposed system is mainly tested
                                                                             a business, which can be gained from the Yelp review dataset.
 by comparing Yelp restaurants using online reviews, but it is not
 limited to restaurants and can also applied to other applications              Alternative design: Before finalizing the glyph design, we also
 such as different shops.                                                    considered the radar-diagram based glyph (Figure 2a) and bar chart
                                                                             based glyph (Figure 2b). Bar charts are commonly seen and can fa-
 4. System Overview                                                          cilitate the direct estimation of the absolute number of reviews at
                                                                             each rating level. However, the bar chart based glyph is not able
 We name the proposed visual analytical system E-Comp, since its
                                                                             to clearly visualize the percentage of good/bad ratings and the total
 design goal is to support Easy Comparison of businesses on E-
                                                                             number of reviews, which are the major features that customers use
 commerce platforms. We pre-processed the source review data of-
                                                                             for quick filtering of business candidates (as shown in Section 3.1).
 fline. The most important features for comparing local business, in-
                                                                             The radar-diagram based glyph suffers from the same problems
 cluding statistical features, common customers between local busi-
                                                                             with the bar chart based glyph. Moreover, it has been shown that
 nesses, temporal features and frequent word pairs, are first ex-
                                                                             the shape characteristics of radar diagram affect the accurate inter-
 tracted and stored in the database. Figure 1 shows the major user
                                                                             pretation of the underlying data [KHW09]. On the contrary, a prior
 interface of E-Comp. It has four carefully-designed visualization
                                                                             study [SL91] has demonstrated that pie chart has an advantage over
 views: Map View, Common-customer Comparison view, Temporal
                                                                             bar chart in displaying percentages and it has been successfully ap-
 View and Augmented Word Cloud View. Map View shows intuitive
                                                                             plied to showing the percentages in real applications [CLLT15].
 glyphs encoding statistical features of local business to help users
                                                                             The total number of the reviews is also directly revealed by the cir-
 conduct a preliminary comparison, i.e., finding the potential can-
                                                                             cle area of a pie chart. Taking all these factors into account, we
 didates. The remaining other three views supports detailed com-
                                                                             finally chose the pie-chart based glyph (Figure 2c).
 parison between local businesses: Common Customer Comparison
 View provides a more reliable comparison between local businesses              Color encoding: Initially, a sequential color scheme (bad rating:

                                                                                                                                                 c 2018 The Author(s)
                                                                                Computer Graphics Forum c 2018 The Eurographics Association and John Wiley & Sons Ltd.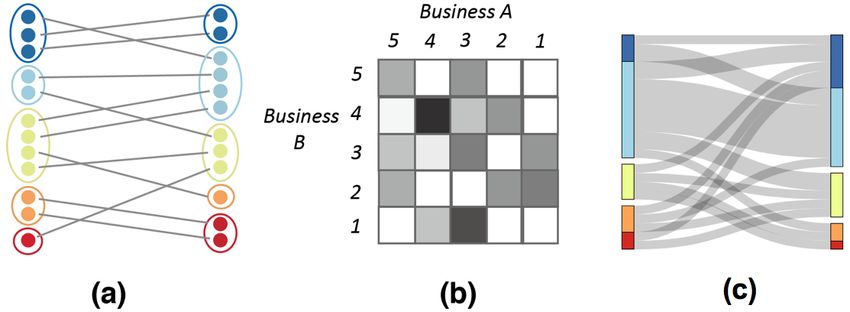
Y. Wang et al. / Towards Easy Comparison of Local Businesses Using Online Reviews

Figure 3: Color scheme for the rating. The diverging color scheme
is finally chosen to emphasize both the higher and lower ratings.

                                                                                         Figure 4: Alternative designs for common customer comparison:
light blue, good rating: dark blue) is chosen to show the number                         (a) bipartite graph, (b) matrix, (c) traditional Sankey diagram.
of reviews in each rating level. However, after checking with the
target users in the prototype stage, we found they usually regard a
three-star rating as a neutral review and are more interested in the                     is the inconsistency across user reviews [MS10, BAC12], as differ-
percentage of positive and negative ratings than the neutral rating,                     ent customers may have quite different personal preferences and
which is also confirmed in [MS10, PS80]. However, a sequential                           rating standards. Therefore, we choose the review ratings by com-
color scheme tends to emphasize only the positive ratings. There-                        mon customers to achieve a more insightful comparison, since the
fore, a diverging color scheme is finally chosen (Figure 3).                             rating standards of individual customers are relatively stable and
   Location information: The location information is also essential                      the rating difference by the same customer is able to reveal more
for preliminary comparison of local businesses, which is usually                         details of the two local businesses.
shown by drawing a label icon on the map in existing online shop-                           Considering the expressiveness of Sankey diagram in convey-
ping platforms. Instead, we proposed overlaying meaningful glyphs                        ing the data relationship [KBH06], we propose a Sankey-diagram
on the map, making the preliminary comparison more convenient.                           based design to visualize the difference of ratings by common cus-
                                                                                         tomers (Figure 1C). The left and right rectangles encode the five-
5.2. Encoding of Common Customers                                                        level ratings of two local businesses. The middle rectangles explic-
                                                                                         itly summarize the difference of ratings by each common reviewer,
The number of common customers between local businesses has
                                                                                         i.e., the left rating subtracted by the right one. To further facili-
been widely used in the recommendation systems for E-commerce
                                                                                         tate comparison of reviews by the same customers, we group the
applications [LSY03], as it indicates users’ common interest in sev-
                                                                                         ratings with a similar overall sentiment, where a review rating of
eral business items. Therefore, to help users easily find local busi-
                                                                                         three in the five-level ratings usually indicates a neutral evaluation,
nesses of their interest (R1), we add links between local businesses
                                                                                         while the rating above or below three can be regarded as positive
with the link width encoding the number of common customers.
                                                                                         or negative feedback, respectively. We use the same diverging color
Interactive filtering of the links is also supported to reduce the pos-
                                                                                         scheme discussed in Section 5.1 for showing the review ratings and
sible visual clutter when too many links are shown.
                                                                                         a sequential color scheme for showing the rating difference.

6. Detailed Side-by-side Comparison                                                         Alternative designs: Several alternative designs are also con-
                                                                                         sidered in the prototype stage. The bipartite graph (Figure 4a) is
The detailed comparison aims at further comparing the initially fil-                     the initial option for comparing two businesses, where the numer-
tered candidates to select the optimal one as the final choice. To                       ical ratings by common customers are directly shown. However, it
provide users with a reliable and comprehensive comparison be-                           has serious scalability issues with the increase of reviews. Also, it
tween local businesses using online reviews, we designed three                           is difficult to quickly understand the overall rating difference by
major views to achieve the design requirements discussed in Sec-                         common customers. Matrix (Figure 4b) is another possible visual
tion 3.1, including common customer comparison view, temporal                            design here, with the color opacity of each cell encoding the num-
view and augmented word cloud view.                                                      ber of corresponding common reviewers. But it is difficult to gain
   Due to the limited screen size, we need to make a trade-off be-                       an accurate understanding on the overall rating difference by com-
tween the details to show and the number of businesses to com-                           mon customers. The traditional Sankey diagram (Figure 4c) has
pare. Considering the preliminary comparison has already enabled                         better scalability than the bipartite graph, but viewers still need to
the quick filtering and selection of local businesses and it is im-                      manually compare each level of ratings side-by-side, which is not
portant to show reliable and comprehensive details in the detailed                       efficient especially when both businesses have similar rating distri-
comparison stage, we finally chose the side-by-side comparison to                        butions. Figure 1C shows exactly the same data with Figure 4c. But
compare two candidates, instead of comparing more businesses si-                         with the explicit encoding of rating difference in the middle column
multaneously.                                                                            of Figure 1C, users can more easily know which is relatively better
                                                                                         when compared with using Figure 4c.
6.1. Common Customer Comparison View
                                                                                         6.2. Temporal View
The design goal of common customer comparison view is to pro-
vide users with a more reliable and deeper comparison between                            Temporal information of reviews is also critical for comparing local
two local businesses (R2). Using all the customer reviews can re-                        businesses (R3), which, however, is not well conveyed by existing
veal the overall differences between local businesses to some ex-                        review visualization techniques. In this paper, we propose a tem-
tent. However, one possible risk of using all the customer reviews                       poral view to explicitly visualize the review variation along with

 c 2018 The Author(s)
Computer Graphics Forum c 2018 The Eurographics Association and John Wiley & Sons Ltd.
Y. Wang et al. / Towards Easy Comparison of Local Businesses Using Online Reviews
time, as shown in Figure 1d. Each review is encoded as a rectan- Traditional word clouds focus on visualizing the frequency and
gle or circle, where circles represent the reviews by the common sentiment of single words. But in most cases, single words do not
users of the selected businesses under comparison. To visualize the convey any contexts, which makes it difficult to know the opin-
overall trend of reviews and evolution of reviews in each rating ions of the reviews and further compare the businesses. For exam-
level, both stacked layout and layered layout are provided. Users ple, when viewing a word cloud consisting of only single words
can specify the layout mode through interaction. For the time unit, generated from the restaurant reviews, we are not able to know
users can also interactively specify it as either one quarter or one whether the word “good” means the restaurant has good service,
month, depending on their needs. good food or good ambiance. For the single word “pizza”, we are
also not able to know whether the pizza is delicious or not. Inspired
It is of great importance to inform users of the helpfulness of
by [YNTT11b], we show adjective-noun word pairs in a word cloud
each review, as many businesses have an overwhelming number of
to provide meaningful context. But instead of randomly positioning
reviews, making it time-consuming to read all the reviews. When
word pairs [YNTT11b], we group word pairs with the same noun
users are able to know which reviews are more helpful, they can
word into a cluster and carefully place the words to support more
focus on those important reviews to accelerate the review explo-
effective summary and comparison of reviews. Moreover, we clas-
ration. According to the comprehensive study by Mudambi and
sify the word pairs into different categories based on the aspects
Schuff [MS10], there are four major factors that affect the per-
they are describing about the local businesses. Users can interac-
ceived helpfulness of reviews: rating extremity, review depth (i.e.,
tively select the interesting category of word pairs to show, further
the word count of a review), helpfulness votes by other customers
benefiting an easy comparison of reviews.
and product type. Product type mainly moderates the effect of re-
view extremity on the review helpfulness. They further claimed that The generation of the augmented word cloud view consists of
reviews with extreme ratings are less helpful than reviews with word pairs extraction and classification and word pairs layout.
middle ratings for the so-called experience goods, which are de-
Word pairs extraction and classification: We use the part-of-
fined as products that are difficult to obtain information on prod-
speech (POS) tagger developed in NLTK [nat], a popular language
uct quality prior to purchase [MS10]. The local businesses in Yelp
processing library, to label the part of speech of each word in the re-
dataset belong to this category. Review depth and helpfulness votes
view text. Then, similar to [YNTT11b], we extract adjective-noun
have a positive effect on review helpfulness. Based on their study,
word pairs from each sentence by keeping the noun and the corre-
we propose a metric to show the helpfulness of reviews:
sponding adjective that modifies it. To accurately reflect customer
H = a · Re + b · Rd + g · Rv (1) opinions, we handled the negative expressions specially. For exam-
ple, when a review says “the food is not delicious”, we extracted
where Re , Rd and Rv are rating extremity, review depth and helpful- “not delicious food” rather than “delicious food” to preserve the
ness votes, respectively. a, b and g are the weights (a + b + g = 1). original opinions. A heuristic rule-based method is used here: we
Review depth and the number helpfulness votes can be directly ob- check if there are negative adverbs (e.g., “not”, “never”, “no”) be-
tained from the original data. Rating extremity in a five-level rating tween the noun and adjective words in a single sentence with a link-
scheme is calculated as the closeness to the neutral rating: ing verb (e.g., “is”, “are”). If yes, then keep the negative adverb in
Re = 3 |r 3| (2) the extraction result. Common abbreviations like “isn’t”, “aren’t”,
“can’t” in the reviews are also expanded to guarantee the accurate
where r refers to an individual review rating. All the three metrics detection of negative expressions. Furthermore, we conduct senti-
are normalized to [0, 1] by the maximum metric value for the se- ment analysis for each word pair by using NLTK.
lected local businesses. We empirically set a = 0.25, b = 0.25 and
To classify the adjective-noun word pairs to several categories
g = 0.5. We encode the helpfulness of reviews using the size of
following the interests of customers, we manually label a set of
each rectangle or circle.
representative words for each category, then calculate the similarity
To support detailed review exploration on demand (R5), we also between the input word pairs and labeled words of each category by
include a detailed review text view to show the details of an in- using word2vec [MSC⇤ 13]. Finally, we assign the word pairs to the
dividual review including business name, customer name, review category with the highest similarity. For the restaurant reviews in
date, rating, helpfulness votes by other customers and detailed re- Yelp dataset, we classify the word pairs into four categories: food,
view text, as shown in Figure 1f. Combining the detailed review price, service and ambiance, which are the four detailed aspects of
text view with the temporal view, where the review helpfulness is a restaurant that customers are generally interested in [DFAG13].
explicitly encoded as the size of rectangles and circles, the users
Word pairs layout: We propose to render the word pairs of dif-
can easily check the details of helpful reviews and gain a deep un-
ferent categories separately to provide a semantically meaningful
derstanding of local businesses efficiently.
summary and quick comparison. Users can interact with E-Comp
to choose the category of interest. In addition, we group word pairs
6.3. Augmented Word Cloud View
describing the same object together to further enhance the effective-
Review text represents the detailed evaluation of customers on a ness of visual summary and comparison of review text. As shown
business. To compare local businesses through review text more ef- in Figure 8, the adjective words describing the same noun word
ficiently and accurately, we propose a novel augmented word cloud are clustered and aligned vertically and sorted by their frequency.
to support insightful review summary and effective comparison be- The color of adjective words represents their word sentiment. Most
tween local businesses (R4). of the noun words have a neutral sentiment. To provide users with
c 2018 The Author(s)
Computer Graphics Forum c 2018 The Eurographics Association and John Wiley & Sons Ltd.Y. Wang et al. / Towards Easy Comparison of Local Businesses Using Online Reviews
more information about the user reviews, we calculate the senti-
ment value of the noun words as a weighted average of the senti-
ment values of all the adjective words modifying this noun word.
Blue, black and red are adopted to indicate the positive, neutral and
negative sentiments, respectively. The word size of noun words in-
dicates their overall word frequency. The adjective words modify-
ing the same noun word share the same size to make the less fre-
quent adjective words can also be viewed more clearly. The sum
of their sizes is equal to the size of the corresponding noun word, Figure 5: The map view showing the restaurants filtered by the user
reflecting their word frequency to some extent. in the local region around Arizona State University. Restaurants
A detailed description about rendering the augmented word A,B,C receive more reviews and share many common customers.
cloud can be summarized as follows:
1. Group all the word pairs with the same noun word and sort the 8.1. Case Study on Restaurant Comparison
adjective words based on the word frequency. When there are
more than four adjective words modifying a noun word, only the In this section, we report a real case of restaurant comparison that
top four adjective words are kept. was conducted by one of our interview participants in Section 8.2.
2. For all the clusters of adjective-noun word pairs gained from This participant had a travel plan to Tempe and would like to visit
Step 1, sort them by using the noun word frequency. his friends at Arizona State University (ASU), so he used E-Comp
3. For the sorted list of word pair clusters, render the clusters one to compare restaurants near ASU.
by one in descending order of the frequency of the noun word, Preliminary comparison: The participant first navigated to the
following a radial layout. The cluster with the highest frequency region around ASU. After viewing the overall distribution of
of the noun word is positioned near the center. restaurants, he brushed on an interesting region with more restau-
4. Collision detection is performed to check whether the current rants. Then all the restaurants will be visualized as glyphs and the
word pair cluster has spatial overlap with previously placed clus- links between them indicate the number of common customers, as
ters. When collision exists, the current word pair cluster is moved shown in Figure 5. He may also use the sliders to filter out the
to the next position following the Archimedean spiral [Fei10] restaurants that obviously do not satisfy his requirements. From
until there is no collision. Figure 5, the participant easily noticed that Restaurant A receives
5. Repeat Steps 3 and 4 until either all the word pair clusters are good ratings from customers and is very popular, indicated by the
rendered or the predefined maximum cluster is reached. high percentage of dark blue and big size of the glyph. However,
7. Interactions its price bar shows that Restaurant A is a bit expensive for him.
The participants quickly noticed that Restaurants B and C shares
To allow users smoothly compare local businesses by leveraging a large number of common customers with Restaurant A, but are
the user reviews, E-Comp provides a set of intuitive interactions. much cheaper than Restaurant A. In addition, both of them also
Filtering. The control panel supports the filtering of local busi- have good ratings and popularity, which makes them perfect restau-
nesses with a certain price, rating level and the total number of rant candidates around that region. By hovering or clicking on the
customers. Users can brush on the map view to select interested re- glyphs, the participants can quickly know that Restaurants B and
gions and the local businesses of this region will be shown as glyphs C are called “The Chuck Box” and “Original Chopshop”, respec-
for preliminary comparison. Users can click a glyph to select a lo- tively.
cal business for detailed comparison or double click to delete an Detailed comparison: The selected two restaurants are very sim-
uninterested business. The links with a small width indicating less ilar regarding overall rating, popularity and price, making it diffi-
common customers in the map view can also be interactively re- cult to know which one is better. By clicking on the corresponding
moved. glyphs, the participant further checked their detailed differences.
Details on demand. Users can drag, zoom in/out in the map
From the common comparison view (Figure 6), the participant
view. They can switch the temporal view between stacked layout
could quickly know the rating difference between the common cus-
and layered layout to check the temporal details of customer rat-
tomers. For example, the leftmost and rightmost grouped bars in-
ings. Tooltips are supported for most visual elements of E-Comp to
dicate that Chuck Box and ChopShop received a similar number of
show the encoding details on demand.
4-star and 5-star ratings, but Chuck Box has more 1-star and 2-star
Linked exploration. Linked analysis across multiple views are ratings than ChopShop, indicating that ChopShop is relatively bet-
supported. When users select other interested businesses in the map ter than Chuck Box. The grouped bars in the middle show more
view. All the views for detailed comparison will be updated simul- details: about half of the common customers gave the same rating
taneously. Brushing on the temporal view triggers the selected re- for both restaurants and there also exist a similar number of com-
views to be shown in the augmented word cloud view. mon customers who prefer one restaurant to the other (the red dot-
ted rectangles in Figure 6). But there are more common customers
8. Evaluations who believe ChopShop is significantly better than Chuck Box, fur-
We evaluate the effectiveness and usability of E-Comp through both ther confirming that ChopShop is relatively better than Chuck Box.
a case study and in-depth user interviews. This is out of the participant’s initial expectation, since Chuck Box
c 2018 The Author(s)
Computer Graphics Forum c 2018 The Eurographics Association and John Wiley & Sons Ltd.Y. Wang et al. / Towards Easy Comparison of Local Businesses Using Online Reviews
ferent features of the selected restaurants. He compared the food
features of the two restaurants first, as shown in Figure 8. At first
glance, most of the word pairs for both restaurants are shown in
blue color, indicating the overall positive feedback on the food
for both restaurants. When looking at the cluster of adjective-noun
word pairs with high frequency, the participant quickly noticed that
the most representative food enjoyed by customers: Chuck Box has
“good burger”, “best hamburger”, “classic cheeseburger”, “awe-
some bacon” and “great beer”, etc., while ChopShop may be a per-
Figure 6: The common customer comparison view shows the dif- fect restaurant for vegetarians, since its previous customers enjoy
ference of the ratings by the common customers of Chuck Box and its “sweet potato”, “nice rice”, “good salad”, “delicious juice”, etc.
ChopShop. The top and bottom grouped bars marked in red dot- When focusing on the words in reddish color, the participant also
ted rectangles represent the common customers who give a better gained a quick understanding of the major negative comments on
rating to Chuck Box and ChopShop, respectively. the food. For instance, the beer at Chuck Box may be disappointing
(“disappointed beer”) and the sort of the food on the menu may be
weird or confusing (“weird sort”). The salad at ChopShop may be
expensive (“expensive salad”) and the waitress may give you the
wrong food order (“wrong order”). All these information is clearly
shown to support an easy comparison. The participant further com-
pared other features such as price, service and ambiance. By brush-
ing on the temporal view, he also compared their reviews posted
recently and the reviews of different rating levels.
Taking all the factors above into consideration, the participant
said that he could easily obtain an insightful difference between
the two restaurants and came to a conclusion that he may choose
ChopShop, because it receives more support from common cus-
tomers, becomes similarly popular with Chuck Box in a much short
time and it also has his favorite vegetable food.
8.2. In-depth User Interview
We also conducted in-depth user interviews to further demonstrate
the effectiveness and usability of E-Comp.
8.2.1. Study Design
We carefully designed the in-depth user interviews through recruit-
Figure 7: The temporal view shows the temporal trend of reviews. ing representative participants and proposing essential exploration
Top: Chuck Box, bottom: ChopShop. The stacked layout can be tasks and interview questions.
switched to a layered layout. The circles represent reviews by com-
Participants: We recruited 12 participants (2 female, age: 20 to
mon customers and the size of rectangle and circle encodes the
34 (mean:25.3)) from our university to take part in our in-depth
helpfulness of reviews.
interviews. They are either students or research staff with a research
background in business or engineering. All of them are familiar
is a bit more popular in terms of the number of total customers and with E-commerce and have at least three years’ online shopping
has a higher percentage of 5-star ratings. experience. To guarantee that the findings from the in-depth user
interviews are general for common users, none of the participants
Figure 7 provides the participant with a clear impression about has a background of visualization or HCI.
the temporal trending of user ratings. He immediately knew that
Apparatus and Procedures: We run E-Comp on a laptop con-
Chuck Box has received a continuously increasing number of cus-
nected to a 23-inch display with a 1920 ⇥ 1080 pixels resolution
tomers and ChopShop started its business about 7 years later than
and 60 Hz refresh rate. By using this, we conducted all the user
Chuck Box. Taking into account that both restaurants have a similar
interviews with each participant one by one. Each participant in-
number of total customers, it further confirms the relative advan-
terview took about 50 to 70 minutes. We first briefly introduced E-
tage of ChopShop. By switching to layered layout, the participant
Comp. Then we went through an example to explain the functions
was able to easily know the review trend of each rating level. The
and visual encoding of E-Comp. After that, we asked the partici-
participant could also brush a recent period to view the latest review
pants to freely explore the system and use it to compare businesses
details.
they are interested in. Considering the key steps of making pur-
To glean useful information from the review text, the partici- chase decisions, we selected the following tasks for participants to
pant further used the augmented word cloud view to compare dif- finish in their free explorations:
c 2018 The Author(s)
Computer Graphics Forum c 2018 The Eurographics Association and John Wiley & Sons Ltd.Y. Wang et al. / Towards Easy Comparison of Local Businesses Using Online Reviews
ison of local businesses, it is probably unfair and inappropriate to
conduct a strict comparison between them and E-Comp. Therefore,
we simply asked participants to try E-Comp and Yelp again and col-
lected their general comments about the usability and effectiveness
comparison between both systems for comparing local businesses.
8.2.2. Result
Overall, our in-depth user interviews demonstrate that E-Comp can
effectively help users conduct an easy comparison between local
businesses and it has good usability even for users who have no
Figure 8: The augmented word cloud view shows the clustered background knowledge in visualization or HCI.
adjective-noun word pairs of food feature. Left: Chuck Box, right: Effectiveness: Figure 9 shows that most participants can use E-
ChopShop. An example of negative expression (i.e., “not-good”) is Comp without difficulty to quickly compare different local busi-
shown in the cluster highlighted in a red rounded rectangle. ness, providing support for the effectiveness of E-Comp. For pre-
liminary comparison, all the participants agree that the designed
glyphs and links between them facilitate a quick comparison be-
tween local businesses (Q1), because the most important factors
for selecting businesses, such as the percentage of good/bad ratings,
average rating, popularity (i.e., the total number of reviews), price
and location, are intuitively encoded. The links between glyphs pro-
vide participants with explicit hints about the common customers
between businesses, accelerating the preliminary selection.
After preliminary comparison, the participants usually selected
two local businesses with good ratings, popularity and similar
prices. The participants commented that they appreciate the de-
tailed comparison functions of E-Comp, which are very helpful
Figure 9: The results of the post-study. User responded to Ques- for uncovering the detailed differences behind the overall similarity
tions 1-8 on a 5-point Likert scale, where 1 to 5 represent the diffi- of the local businesses. From common customer comparison view,
culty levels from “very easy” to “very difficult”. 11/12 participants agreed that they could discover some differences
between businesses that may be hidden in the overall ratings, as
shown in Q2 of Figure 9. For example, Participant 2 (P2) selected
two sushi restaurants with exactly the same average rating and a
T1 Find interesting local businesses with the preferable rating, price,
similar number of total customers, but the common customer view
location and popularity from the map view.
indicates that lots of their common customers gave a better rating to
T2 Find the difference of review ratings by common customers.
one restaurant than the other. P2 commented that such information
T3 Compare the temporal trend of review amount of the selected
is usually unable to gain by reading the original reviews.
business regarding both overall and different levels of ratings.
T4 Find the differences of the selected venues in terms of food, ser- Other participants’ feedback also confirmed that common cus-
vice, price and ambiance. tomer view provides a quick way to gain insights into the sub-
T5 Explore the major reasons that customers like or complain about tle differences between local businesses. All the participants could
a business from the high and low rating reviews. easily understand the temporal trend of both overall and each level
of ratings, as shown in Figure 9 Q3. The interactions in tempo-
We asked the participants to comment verbally during their ex-
ral view, especially the brushing and switching between stacked
ploration to collect more detailed user feedback. We kept observ-
and layered layout, are also enjoyed by many participants (e.g., P1,
ing the exploration process of each participant and wrote down their
P5, P6, P12), as they facilitate exploring reviews within the period
major operations and comments. After participants finished the free
and rating level of interest. With the augmented word cloud view,
exploration, we interviewed each participant about their general
most participants (10/12) said that they could gain a quick sum-
comments on E-Comp, including the advantages and possible lim-
mary about the major characteristics of each business in different
itations, and the helpfulness of E-Comp in facilitating local busi-
feature dimensions, as shown in Q4 of Figure 9. P5 and P7 explic-
ness comparison. A post-study questionnaire was also conducted
itly pointed out that the grouped adjective words, combined with
to collect detailed feedback on the effectiveness and usability of E-
the color-encoded sentiment, provide them with enough context to
Comp, where eight questions were asked (Table 1). The participants
quickly understand the review opinions in the original review text.
responded to each question on a 5-point Likert scale (1=very easy,
All the participants (Q5 of Figure 9) confirmed that the helpfulness
5=very difficult) and provided the main reasons for their response.
encoded by the size of rectangles and circles of temporal view is
It is also interesting to further compare E-Comp with existing re- useful for them to focus on the reviews with more helpful infor-
view platforms. However, since the existing review platforms (e.g., mation. E-Comp provides them with a convenient way to check the
the Yelp website) usually do not support an explicit visual compar- review details by simply clicking on the rectangle or circle. Taking
c 2018 The Author(s)
Computer Graphics Forum c 2018 The Eurographics Association and John Wiley & Sons Ltd.Y. Wang et al. / Towards Easy Comparison of Local Businesses Using Online Reviews
Table 1: The post-study questions. Q1-6 are focusing on assessing the effectiveness of E-Comp in facilitating an easy comparison of local
businesses and Q7-8 evaluate its usability.
Q1 Is it easy for you to do preliminary comparison and quick selection of business candidates by viewing the glyphs and links on map view?
Q2 Is it easy for you to recognize the differences of local businesses that may be hidden in the overall rating?
Q3 Is it easy for you to quickly understand the differences of temporal trend of overall and individual ratings?
Q4 By using the augmented word cloud view, is it easy for you to compare the basic features of two businesses?
Q5 Is it easy to for you to find out the relatively more helpful reviews and check the details of them?
Q6 Overall, is it easy for you to compare different local businesses, especially when compared with reading the original review text?
Q7 Is it easy for you to learn to use E-Comp?
Q8 Is it easy for you to understand the overall visual designs of E-Comp?
all these factors into consideration, all the participants evaluated E- exploration. The case study and in-depth user interviews using Yelp
Comp as an excellent tool for facilitating the comparison between dataset demonstrate the great effectiveness and usability of E-Comp
different businesses, especially when compared with the way of for supporting easy comparison of local businesses. However, there
reading the original reviews to do a comparison (Q6 of Figure 9). are still several aspects that need further discussion.
Usability: Q7-8 of Figure 9 indicate that there is no difficulty Other applications and users. We use the restaurant reviews to
for the general users to learn to use E-Comp and most of the par- demonstrate the effectiveness and usability of E-Comp. But it can
ticipants can easily understand the visual designs (R6). The user also be applied in other local businesses like shops, fashion retailers
feedback also shows the interactions integrated in E-Comp are gen- and local services (e.g., barbershops, health clinics and gyms), as
erally smooth and helpful for the comparison. To sum up, these the metadata is exactly the same. Moreover, E-Comp can be easily
feedback demonstrates the good usability of E-Comp. extended to the review comparison of products in online shopping,
E-Comp vs. Yelp: Overall, the participants’ feedback shows that where the only difference from local businesses is that the location
E-Comp has an advantage over Yelp in supporting an easy compari- information (the map of Figure 1B) is not necessary. Apart from
son of local businesses. When using the Yelp website, they can only the general customers, E-Comp can also be used for other users like
rely on the summary features like price, average rating and the to- restaurant managers, shop owners, etc., when they want to compare
tal review number to filter candidates. For the detailed comparison, their establishment with other business competitors.
they need to read the review text and check back and forth to do a Scalability. E-Comp focuses on the preliminary comparison be-
comparison, which is not efficient. The feedback further confirms tween tens of local businesses and detailed comparison between
the necessity of a review comparison tool and our design require- two candidates. This design choice conforms to the reported gen-
ments in Section 3.1. Contrarily, E-Comp explicitly supports both eral exploration procedures of customers in Section 3.1 and strikes
preliminary and detailed comparisons, facilitating the comparison a balance between the details to be shown and the potential visual
of local businesses. The advantage of Yelp, as mentioned by many clutter resulting from the limited screen space. Therefore, E-Comp
participants (e.g., P2, P3 and P7), is that Yelp also shows other in- is not suitable for comparing hundreds of local businesses or even
formation like food images, restaurant images and user profiles. all the local businesses in a whole city due to the visual clutter.
Limitations and Suggestions: Despite all the positive feedback Desktop system vs. mobile program. Currently, E-Comp is de-
above, our participants also pointed out several limitations of E- signed as a desktop-based system to help customers easily make a
Comp and offered suggestions. For example, P5 suggested support- purchase decision in many situations, such as finding a good restau-
ing collision detection between glyphs in the map view to avoid rant for an important celebration or booking a suitable hotel for a
occlusion of glyphs, which has been implemented in the latest pro- distant trip. However, with the wide use of smart mobile phones, a
totype of E-Comp. P10 suggested that E-Comp can also benefit mobile version of E-Comp will also benefit the general customers.
business owners, as they can use E-Comp to analyze reviews and
improve their own business. P3 and P7 mentioned that it would be In future work, we will try to further improve E-Comp, for
interesting if the posted images by customers can also be analyzed example, building a mobile version of E-Comp and enhancing
in E-Comp, which have been left for future work. the word cloud view by considering the perceptual biases in font
size [ACS⇤ 17]. In addition, we plan to further analyze the images
contained in the online reviews along with review text and ratings
9. Discussion and Conclusion to compare local businesses comprehensively. Moreover, we will
In this paper, we have presented E-Comp, a visual analytics system apply E-Comp to more real datasets to further examine the effec-
to facilitate the comparison between local businesses by using on- tiveness and usability of E-Comp.
line reviews. We designed novel glyphs, which are overlaid on the
map, to support better preliminary comparison. Detailed compar-
Acknowledgments
ison is achieved through carefully-designed visual encoding from
the perspective of rating differences by common customers, tem- The authors would like to thank the anonymous reviewers for their
poral evolution of reviews and detailed features in the review text. helpful comments and suggestions. This research was supported in
E-Comp also supports rich interactions, allowing for flexible visual part by HK RGC GRF 16208514.
c 2018 The Author(s)
Computer Graphics Forum c 2018 The Eurographics Association and John Wiley & Sons Ltd.You can also read