North West Leicestershire Economic Growth Plan Evidence Base 2019 2021 - January 2019
←
→
Page content transcription
If your browser does not render page correctly, please read the page content below
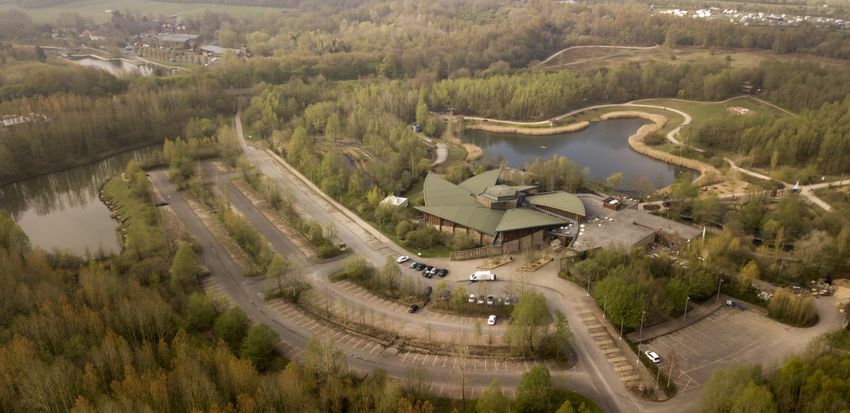
North West Leicestershire
               Economic Growth Plan
               Evidence Base 2019 - 2021

January 2019
1 North West Leicestershire
    1.1 North West Leicestershire sits at the axis of      this may have on our residents, businesses and
        the Midlands, strategically located 25 miles        future funding.
        from Birmingham, Derby, Leicester and            1.4 North West Leicestershire District Council
        Nottingham. The district is at the centre of         (NWLDC) is keen to ensure that opportunities
        the national transport network, hosting East         are realised so that our growth potential
        Midlands Airport, the M1 corridor and main           can be fully grasped. At the same time we
        line rail services provided at East Midlands         also recognise that a number of challenges
        Parkway. The A42/M42 and the A50 provide an          need to be addressed, in particular access to
        important east / west connection.                    areas of new opportunity, making sure that
    1.2 It is an area primed for economic growth,           local residents have the skills that businesses
        particularly having development prospects            need to be successful and maximising the
        that are of national and international               economic impact of visitor spending in the
        significance. Our location has proved to be          area.
        a major attraction to inward investors and       1.5 This Economic Growth Plan sets out how
        developers and our indigenous businesses             NWLDC, working with partners, will work to
        are growing strongly after the economic              stimulate growth within our local economy.
        slowdown. We have an experienced                     We already have a strong track record of
        workforce, excellent natural environment             partnerships - internally within the district,
        (including being at the heart of the National        across the wider county and region and
        Forest) and have areas of attractive and             nationally. The plan sets out our ambitions but
        accessible countryside.                              is also realistic about where the public sector
    1.3 Delivering economic growth is critical to           can make a difference and where our limited
        the wellbeing and prosperity of the district’s       resources will be best applied. The plan runs
        population. We must be aware of the                  from 2019-2021.
        uncertainty to the local and national economy
        in light of EU brexit and the unknown impact
2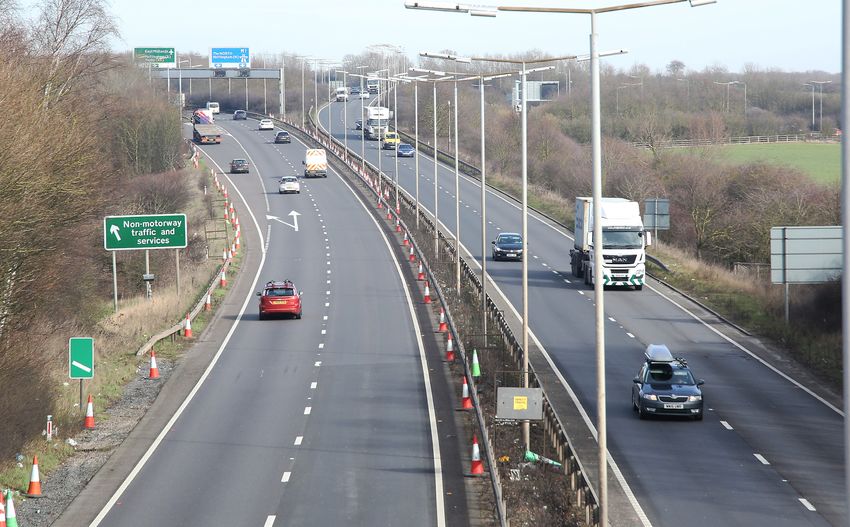
2 Background to the
 Growth Plan
2.1 The 2014 North West Leicestershire Growth
    Plan identified growth priorities for North West
    Leicestershire up until 2018 and was prepared
    in consultation with partners to coincide
    with the production of the Leicester and
    Leicestershire Strategic Economic Plan (SEP).
    Both the original growth plan and the SEP
    used the same structure, based on making the
    most of the areas strongest assets in terms of
    people, place and business and ensured that
    these three gears of the economy function
    effectively together.
2.2 Using these gears, this refreshed growth
    plan sets out a long-term strategy for the
    growth of the local economy. It is necessary
    to realise that the plan will be influenced by
    the Government’s Industrial Strategy and the
    emerging Local Industrial Strategy (LIS) which
    is currently being prepared by the Leicester
    and Leicestershire Enterprise Partnership.
2.3 The emerging LIS is underpinned by a
    prospectus which identifies a series of priority
    sectors. Even though not all of the key
    growth areas identified within LIS prospectus
    are relevant priorities to the North West
    Leicestershire area, the district has a significant
    role to play in delivering Leicestershire’s
    planned growth. Therefore it is essential that
    the policy context for the growth plan in
    addressing local priorities is consistent and
    supportive of the wider growth agenda.

                                                          3
3 Strategic Context
    3.1 Partners across Leicester and Leicestershire        • Developing and supporting the global cargo
        have been working with the Leicester and               capability and potential Free Trade Zone at East
        Leicestershire Enterprise Partnership (LLEP)           Midlands Airport.
        over the past year to develop a Local Industrial     • Within the Enabling Sector Growth ambitions
        Strategy, which will set out the area’s priorities     there are aspirations to invest in towns for the
        in the period up to 2030, to grow the economy          future, making them attractive to investors who
        and deliver the ambitions of the national              are looking to locate here, visitors to the area
        Industrial Strategy and the Midlands Engine            and, more importantly to be the hub for local
        ‘Vision for Growth’.                                   residents, to develop high quality incubator
    3.2 The LIS prospectus states “Our place generates        and grow-on space adjacent to town centres
        nearly £23.5billion GVA (Gross Value Added)            providing spaces for our SMEs to grow and
        per annum and we are home to 42,400                    innovate: and to support our networks of rural
        businesses providing 485,000 jobs for our              businesses to underpin our heritage and wider
        people. Our ambition is to be the most                 economy through tourism, art and culture and
        productive economy in the Midlands by                  local food and drink production.
        2030 contributing at least £30billion each           3.6 This plan will need to be considered in the
        year to the UK economy. We have one of the               context of other important national, regional
        youngest and fastest growing populations                 and local strategies/plans. A list of relevant
        in the country and our ambition is to build              strategies can be found in Appendix B of this
        187,000 new homes by 2050.”                              report.
    3.3 To meet this vision the LLEP will focus on
        supporting sectors of high value productivity
        to generate fast growth and also those
        industries that need support to make them
        more productive.
    3.4 The LIS identifies five Priority growth sectors
        together with investment in enabling
        infrastructure. The priority growth sectors are:
    • Space technologies
    • Life sciences – health and medical technologies
    • Advanced manufacturing and engineering
    • Advanced logistics
    • Textiles – design and manufacturing
    3.5 The LIS prospectus provides an overarching
        framework for a number of programmes,
        including:
    • Developing an East Midlands Manufacturing
      Zone pilot to reduce planning restrictions and
      stimulate investment within the sector linked to
      an International Free Trade Zone.
    • Developing a Logistics Institute of Technology to
      supply the technical skills required to improve
      productivity within the sector.

4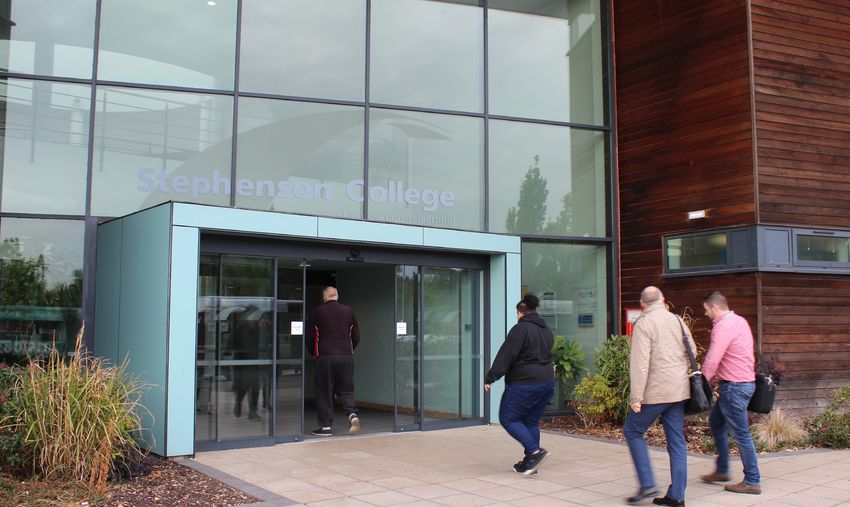
4 People
     Demographics                                                                 4.3 In terms of jobs density, the district performs
                                                                                      extremely well. This measures the level of jobs
     4.1 North West Leicestershire covers 279 sq km                                  per resident aged between 16 – 64 years and
         and in 2017 had a resident population of                                     North West Leicestershire has the third highest
         100,109, which is expected to rise by around                                 proportion (0.99) in the whole of the East
         15% by 2039 . In the past 10 years the district’s                            Midlands – meaning that there is practically
         population has increased by 9.4% - at a faster                               one job available for every resident aged
         rate than the East Midlands Region (8.3%) and                                16 – 64. Only Northampton and Nottingham
         for Great Britain (7.7%) over the same time                                  have a higher ratio. This illustrates the vibrant
         period. Nearly 62% of the population are of                                  employment situation and reflects the
         working age . Almost half of the population                                  location of the district.
         live in the two main towns in the district,                              4.4 T he district has performed extremely well in
         Coalville (34,575) and Ashby de la Zouch                                     the 2018 Grant Thornton ‘Vibrant Economy
         (12,370). Other key settlements include Castle                               Index’ study. This study measures ‘economic
         Donington, Ibstock, Kegworth and Measham.                                    successes.’ North West Leicestershire ranked
                                                                                      in the top 20 percent nationally of all local
     Economic activity rates                                                          authority areas in terms of prosperity.
                                                                                  4.5 In the past, unemployment within North West
     4.2 Economic activity rates for all people in the                               Leicestershire has generally been slightly
         district stands at 85.5% – far higher than both                              higher than the rate across Leicestershire.
         the East Midlands (77.9%) and Great Britain                                  However, in the past year the Jobseeker’s
         (78.4%). For men the economic activity rate                                  Allowance claimant count has dropped
         is 94%, considerably higher than for women                                   below the county average and currently
         (76.9%). For both men and women, North                                       0.2% of the working age population are on
         West Leicestershire’s economic activity rates                                Jobseeker’s Allowance. The claimant rate is
         out-perform both the regional and national                                   now significantly lower than the regional and
         average.                                                                     national average as presented in Chart 1.

     Chart 1 - Proportion of resident population on Jobseeker’s Allowance
                                                                       Chart Title
                                    4.5
                                    4.0
                                    3.5
                                    3.0
% of residents population 16 - 64

                                    2.5
                                    2.0
                                    1.5
                                    1.0
                                    0.5
                                    0.0
                                          2008   2009   2010    2011   2012      2013    2014     2015    2016     2017    2018

                                                               NWL       Leics           E Mids          GB

      Source: Nomis: ONS Data relates to September of each year. November 2018

                                                                                                                                          5
4 People
    4.6 There remain pockets of higher claimant rates        outperforms the county, region and national
        and lower economic activity across the district,      averages. Most of this decline will be due to
        especially in the wards of Blackfordby, Ashby         the increased age at which claimants now
        Woulds, Castle Donington and Castle Rock.             have to be to be recorded as NEET (not in
        But rates are still relatively low compared to        education, employment or training). Therefore
        regional and national figures.                        the number of NEETs has dropped significantly
    4.7 With changes to the benefits system – moving         across the country.
        some residents onto Universal Credit – it          4.9 Longer term unemployment (12 months plus)
        means that there are distortions in many of the        remains in line with the county average of
        statistics around the number of unemployed.            0.1% and below the East Midlands (0.3%) and
        In October 2018 there were 760 people in               GB (0.4%). With the age increase in claimants
        North West Leicestershire claiming Jobseeker’s         there has been a fall in the number of NEETs,
        Allowance and Universal Credit. This gives a           but even though the numbers are low, they
        rate of 1.2% - in line with Leicestershire as a        do need specialist support from agencies such
        whole but significantly lower than the East            as Prince’s Trust and Supporting Leicestershire
        Midlands (1.8%) and Great Britain (2.3%).              Families.
        Historical comparisons are unreliable because      4.10 The number of Jobseeker’s Allowance
        of the way data is collected following changes          claimants who have been unemployed
        to the benefit system.                                  over 12 months has fallen from a peak in
    Young people                                                September 2012 from 435 down to 40,
                                                                recorded in September 2018. The long term
    4.8 The Jobseeker’s Allowance youth claimant               unemployed represent 32.5% of all of North
        count across North West Leicestershire, aged            West Leicestershire’s Jobseeker’s Allowance
        18-24 years, is 0.1%. This is in line with the          claimants. This is a higher percentage of all
        county average and lower than both the                  claimants than in 2012 (28%). This trend is
        regional (0.7%) and national (0.6%) averages.           also reflected at county, regional and national
        Youth unemployment has fallen sharply                   level – perhaps emphasising the need for
        across the district, falling from 560 to 5, from        even more assistance for the long term
        its peak in 2011 to September 2018 . This fall          unemployed.

6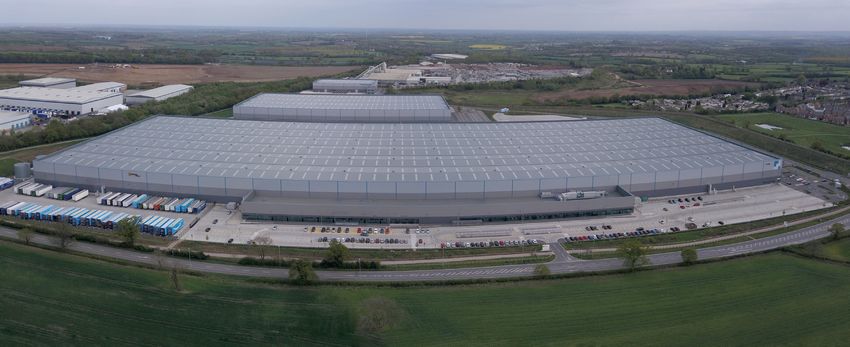
4 People
Skills and qualifications
4.11 In the past, a major challenge for North West    4.1291.5% of the resident population aged
     Leicestershire has been the level of skills and        16-64 years have at least an NVQ1 or
     qualifications attainment within the local             higher qualification – again higher than
     workforce and the ability of local labour              Leicestershire (90.3%), East Midlands (83.6%)
     to compete. However, in the past three                 and Great Britain (85.4%). There are no
     years, according to the Office of National             statistics for those with no qualifications in
     Statistics Annual Population Survey 2017, the          North West Leicestershire as the 2017 sample
     percentage of the working age population               size of this group was too small to be reliable.
     with an NVQ4 or above has increased at an         4.13 Anacdotally, it is often suggested that there
     amazing rate – to stand at 43.5% in 2017.              is mismatch between the skills requirements
     This compares with only 22% in 2004. In                of employers and the skills of young people
     2014 the figure still only stood at 28.0% and          leaving education. Gaps between potential
     in the following three years the figures have          employees and businesses needs to be filled.
     increased year on year. The figure of 43.5%            Businessses need to engage with young
     for North West Leicestershire compares                 people directly, and through their education
     more favourably than Leicestershire (36.2%),           providers, parents and carers to help inform
     the East Midlands (32.1%) and Great Britain            the career choices and career pathways of
     (38.2%). This rise could be due to an increase         the future workforce at an early stage.
     in higher skilled employment opportunities
                                                       4.14 NWLDC, working in partnership with the
     and an influx of higher qualified individuals
                                                            LLEP, the Employment Hub and local schools
     moving into the area as new housing comes
                                                            and colleges is committed to improve the
     forward, as well as local residents aspiring to
                                                            information available on local growth sectors
     better employment.
                                                            both now and in future years and to improve
                                                            the links between businesses and the
                                                            education sector.

                                                                                                               7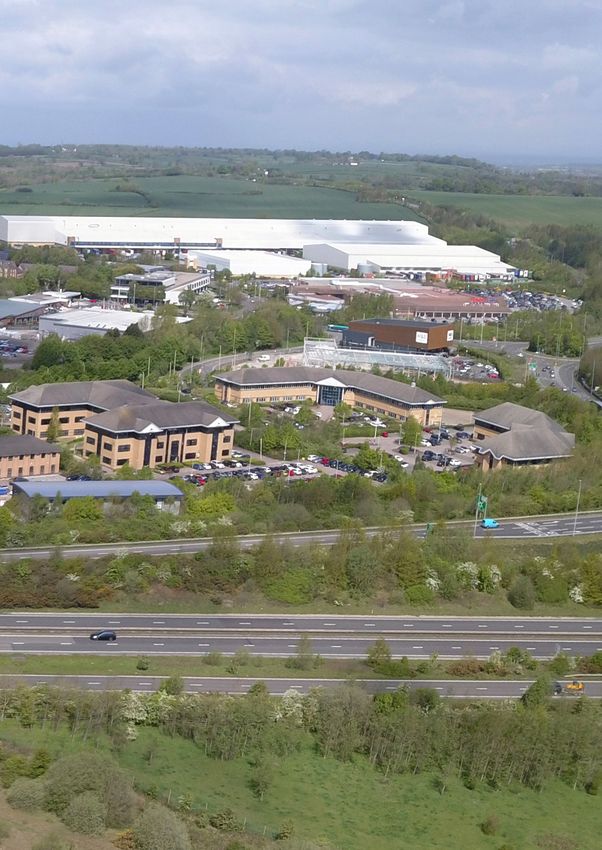
Earnings
    4.15 Workplace average hourly pay for jobs
         in North West Leicestershire is below the
         Leicestershire, regional and national averages
         and also compares unfavourably for residence-
         based earnings. Resident based hourly pay for
         women is lower than the county and region,
         although it has increased sharply over the
         past two years, whereas average gross hourly
         pay for men has fallen (whilst increasing
         in Leicestershire) as presented Table 1. It is
         important to support activity that allows
         residents to access some of the higher paid
         employment in the district.

    Table 1 - Median hourly pay by workplace and residence
                                                    Workplace (2017)              Residence (2017)
                                              Men         Women    Total      Men     Women       Total
                                               £            £        £         £        £           £
     North West Leicestershire               12.91         11.74   12.37     14.70      11.39     13.00

     Leicestershire                          13.23         11.44   12.67     14.56      12.31     13.52

     East Midlands                           13.08         11.30   12.46     13.54      11.74     12.91

     Great Britain                           14.56         13.17   13.99     14.56      13.18     14.00

    Source: Nomis (2018 Annual Survey of Hours and Earnings)

    Key objectives:
    • Help new and existing businesses to recruit local                  work experience opportunities within the
       people. For example, by continuing to work with                    organisation
       the SEGRO Logistics Park employment group                       • Promote the employment and training
    • Work with partners to ensure that the workforce                    opportunities provided by partner organisations,
      needs of businesses are met and help to raise skill                 such as the Leicester Employment Hub, to
      levels and productivity                                             support those furthest from the labour market
    • Encourage local businesses to become Disability                    into employment
       Confident Employers and to adopt a more open                    • Promote workplace health interventions and
       recruitment policy so that those furthest from                     countywide sport and leisure initiatives to
       the labour market can access employment                            ensure that employees and employers are aware
       opportunities                                                      of the benefits of health and wellbeing in the
    • Work with partners to ensure young residents can                   workplace and the impact this has on increased
      access careers advice and relevant information                      productivity
      on future employment opportunities with local                    • Work with the Supporting Leicestershire
      companies in key growth sectors                                    Families team to continue to provide support to
    • Assist the LLEP and other partners to facilitate                  vulnerable families in North West Leicestershire
       relationships between local businesses and                        with a particular focus of assisting people into
       schools and colleges. This will ensure that future                employment
       employment needs are met and opportunities are                  • Ensure that current and future employment
       highlighted, particularly in growth sectors.                       opportunities from both the construction and
    • Develop and enhance NWLDC’s apprenticeship                         implementation phases of Hs2 are promoted
       programme and provide volunteering and                             locally.

8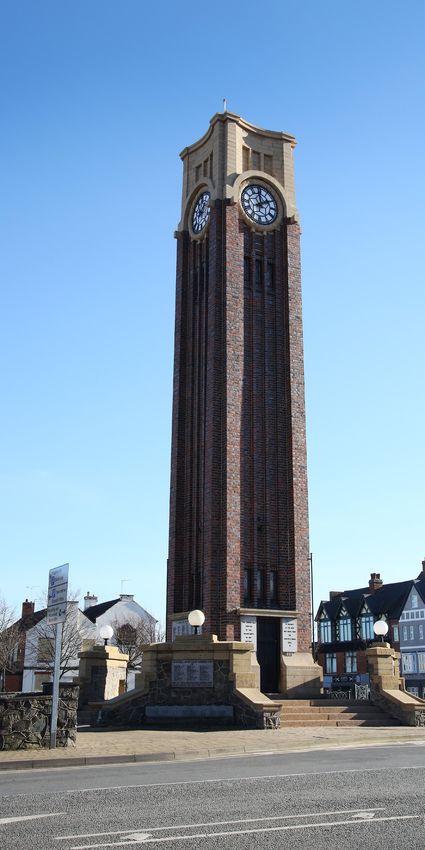
5 Place
5.1 Our location and environment has been a                   26,699 commuters traveling in. This makes a
    considerable driver for the economy of North               net inflow of 7,453.
    West Leicestershire, be that in terms of natural        5.8 The economic, physical and social profile of
    resources, natural assets and the location of               an area is the result of generations of activity
    strategic national and international transport links.       and can have differing imprints in different
5.2 The district lies at the heart of the National             communities. Whilst the profile may change
    Forest which is rapidly developing as a tourism             rapidly as industries decline and new activities
    destination. It contains a number of leisure                come in, the sense of place can be more
    and visitor attractions and facilities such as              resistant to change. For Ashby, with an ancient
    Donington Race Circuit, the 1620s House                     castle and a home in the history books, it is
    at Donington le Heath, Moira Furnace, the                   rather different to Coalville, which as the name
    Conkers Visitor Centre, Ashby Castle and the                implies, developed rapidly in response to
    National Forest Youth Hostel.                               massive industrialisation. The present legacy is
5.3 Much of the district remains rural in character            therefore a complex patchwork and in planning
    with some attractive countryside. The principal             for growth, place matters.
    town is Coalville and smaller settlements are           5.9 New development relies on the timely provision
    found at Ashby de la Zouch, Castle Donington,               of infrastructure and investment – this includes
    Ibstock, Kegworth and Measham.                              essential utility services, as well as a host of
5.4 Coalville, as the main retail centre, is changing          other factors including access to transport,
    with the combination of private sector                      schools, open space, community and health
    and public sector investment on projects                    and leisure services. Preserving the best of the
    such as improving the public realm, the                     past and addressing deficiencies to develop
    redevelopment of key sites such as the former               new amenities will be an important element
    bus depot and the former police station.                    in successfully planning for growth. The North
    NWLDC is also investing in a number of                      West Leicestershire Local Plan, adopted in
    strategic assets in the town centre.                        2017, provides the local planning framework to
                                                                coordinate future investment. A review of this
5.5 North West Leicestershire is located in the                plan is currently underway.
    centre of England, on the western boundary of
    the East Midlands within close proximity to the         5.10 Of major significance to North West
    major cities of Birmingham, Leicester, Derby                 Leicestershire is the development at the
    and Nottingham. It has excellent strategic                   East Midlands Gateway by SEGRO. The
    motorway links but no rail passenger services.               development will create a Strategic Rail
    HS2 is due to run right through the district,                Freight Interchange (SRFI) and provide
    following the A42, but there will be no stops                nationally significant new rail and road
    within the district.                                         connected large-scale distribution and storage
                                                                 facilities alongside the expansion, occurring
5.6 The location of regional and nationally                     at East Midlands Airport such as UPS and DHL.
    significant activities at East Midlands Airport              These projects, currently under construction,
    (EMA) and Castle Donington, inevitably means                 will likely pull in employees from a very wide
    that more people commute into the district                   catchment, and it is a balancing act to ensure
    than leave it to find work. EMA handles over                 that these businesses attract the right calibre
    4.8 million passengers a year; it is a significant           of staff whilst ensuring opportunities are
    UK passenger airport serving over 90                         available to local people. HS2 will run close to
    international and domestic destinations. East                both SEGRO Park and East Midlands Airport
    Midlands Airport is also the UK’s busiest for                and there will be a major HS2 hub at Toton – a
    dedicated air cargo traffic.                                 few miles to the north of the district.
5.7 With such accessible road links the district sees
    a large flow of both inbound and outbound
    commuters with 19,246 residents commuting
    outside of the district for employment but
                                                                                                                    9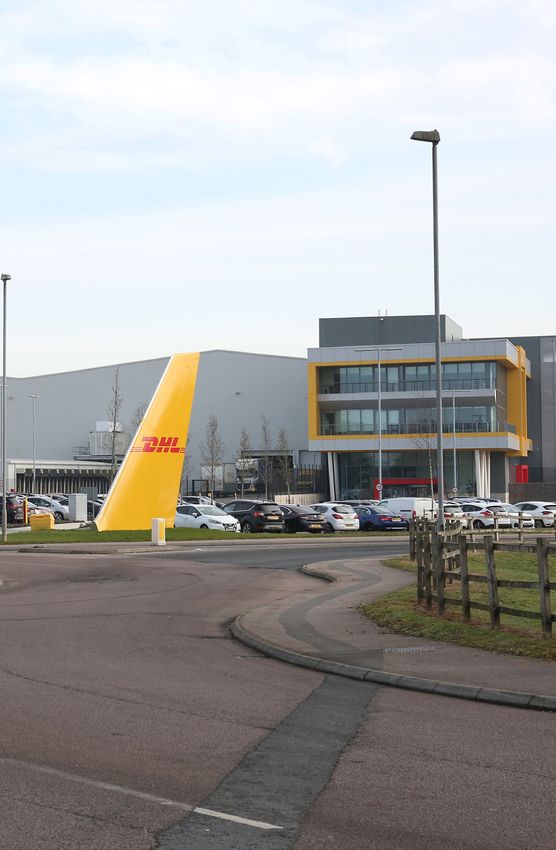
5 Place
     5.11 The Economic Growth Plan also recognises                critically linked to investment in developing
          the porous boundaries we have and the                    key transportation corridors. Within the district
          importance of working with neighbouring                  the A511 Growth Corridor and the cluster of
          areas to support growth that can be mutually             freight and logistics-related activity at the East
          beneficial. There are six key strands to our             Midlands Enterprise Gateway represent major
          work on Place:                                           opportunities. It is important we work with
     • Employment land and premises                                partners to secure the required public and
                                                                   private investment to develop and accelerate
     • Housing                                                     such investment in infrastructure.
     • Low carbon                                              5.16 The adopted Local Plan includes provision for
     • Connectivity                                                 additional land for employment purposes. It
                                                                    also acknowledges that there is a shortage
     • Town and local centres
                                                                    of land for employment purposes when
     • Visitor attractions                                          compared to the HEDNA (2017). A review
                                                                    of the Local Plan has commenced and will
     Employment land and premises                                   address this shortfall.
     5.12 Ensuring an adequate range of choice of             5.17 As the Economic Growth Plan is
          land and premises in areas where the market               implemented, the need for specialist
          wishes to invest is a fundamental requirement             provision such as incubation centres and
          of any plan to promote growth. The district               other managed workspace should be
          benefits from a wide range of existing                    explored. Earlier in 2018, Leicestershire
          provision from older industrial estates to                County Council gained planning permission
          new employment parks. For example, there                  for a range of high spec industrial units,
          are modern mixed-use premises at Ivanhoe                  partly funded by the LLEP, at Vulcan Court
          Business Park in Ashby, a mixed-use older                 Coalville. This development will encourage
          development on Westminster Industrial                     more knowledge-intensive activity and
          Estate at Measham and Bardon Industrial                   build greater diversity and resilience in the
          Estate adjacent to the M1 which encompasses               economy. The incubation of knowledge-
          warehousing, industry and offices.                        intensive activity could create potential
                                                                    partnerships with colleges and universities.
     5.13 Furthermore, there are examples of reuse of
          historical properties for commercial purposes
          such as Donington Hall, which is home
          to the corporate headquarters of Norton
          Motorcycle Company, and the former Mantle
          Lane railway sheds in Coalville that now form
          the Springboard Centre housing over 70
          start-up businesses.
     5.14 Alongside all this are specialist facilities such
          as the air freight depot at East Midlands
          Airport and the rail freight interchange at
          SEGRO Logistics Park, which is currently
          under construction at the East Midlands
          Gateway. Mountpark – home to Amazon,
          Eddie Stobarts and Pharmacy 2U has also
          been developed in the past two years.
     5.15 The district has a number of key areas which
          look to accelerate infrastructure projects and
          programmes in order to achieve benefits
          of economic growth. These location are

10
5 Place
Housing Low carbon
5.18 The adopted Local Plan makes provision for 5.26 Low carbon technologies and the push to
significant housing growth over the next 13 reduce carbon emissions are never far from
years. This can be a stimulus to growth through the news, and over the coming decades,
both the construction jobs created and the developments in low-carbon technologies will
increase in local purchasing power from new create many new jobs and necessitate large
residents moving into to these new homes. investment and changes in infrastructure.
5.19 A key housing development will be that 5.27 T he importance of a sustainable low carbon
at south east Coalville, where planning economy is vitally important today and
permission has been granted for 3,500 for future generations. At the heart of the
dwellings and development has commenced. National Forest, NWLDC is committed to
This will provide a significant boost to the ensuring that growth is sustainable and in
local purchasing power and can provide balance with the local environment. Since
a catalyst for investment in town centre 2003 more than 20 wind turbines have
regeneration. received planning permission and the
5.20 Across the district the build rate for housing district is now home to a number of solar
has significantly increased over the last five farms.
years and this has helped to release funding 5.28 Since the 2014 Growth Plan, NWLDC has
for local infrastructure improvements. delivered a number of initiatives to help
5.21 NWLDC is working with the other improve the sustainability of council-owned
Leicestershire authorities on the assets.
development of a Strategic Growth Plan, 5.29 In 2014 NWLDC conducted a pilot project to
which will provide a planning framework investigate the options available for using
for the period up to 2050 which includes renewable energy systems on its social
ambitious housing provision. housing stock. Twelve properties were fitted
5.22 Current evidence has identified a need for with renewable technology including solar
new affordable housing of 194 homes each thermal, solar, photo-voltaics, biomass and
year between 2011 and 2036 to meet both air- source heat pumps. The pilot examined
existing need and future demand. the opportunities for the delivery of large
scale installations across the council’s
5.23 The majority (around 80%) of this need is for housing and the advantages to its tenants
rented accommodation with the remaining from the provision of renewable energy.
20% representing low cost housing ownership.
5.30 In 2018 NWLDC embarked on a programme
5.24 As well as being a direct developer of to convert homes in off-gas areas heated
affordable housing, NWLDC also works by solid fuel appliances to air-source
with Registered Providers (such as Housing renewable heating. At the time of writing,
Associations), Homes England and private 170 properties have been converted to
developers to maximise the provision of renewable energy with plans for all 300 off-
affordable housing within the district. gas solid fuel properties to have renewable
5.25 Recognising the link between housing and heating by 2020.
access to jobs, NWLDC recently amended 5.31 In November 2017 NWLDC issued Flexible
its allocations policy to award a degree of Eligibility Statement of Intent (SOI) as part
priority for those who need to move because of the government’s Energy Company
they cannot access available jobs from their Obligation (ECO). The SOI sets out local
current home. criteria for North West Leicestershire
which aims to target funding for energy
efficiency measures such as loft and cavity
wall insulation to those most in need. 118
households have had energy efficiency
improvements through the scheme. 115 Place
5.32 Since October 2015 NWLDC has run a will require a co-ordinated programme
local collective switching scheme aimed at between the Highways Agency, Midlands
supporting people to get a better deal on Connect, the local highways authority and
their gas and electricity. The scheme uses NWLDC.
collective buying to secure competitive 5.37 Other potential connectivity issues include:
tariffs for those who register and offers a no-
obligation personalised offer. It is focused on • Congestion on motorway / trunk routes,
those households who do not have access notably at key junctions
to the internet or who would otherwise • Whilst the proposed HS2 line delivers limited
struggle to compare the market. Currently benefit to the district, there is an opportunity
179 people have switched supplier through to ensure improved connectivity to the
the scheme with total savings of £46,639 and proposed East Midlands Hub Station at Toton
average annual savings of each person who
• There are no passenger rail services in North
has switched of £260.
West Leicestershire although a freight-only
5.33 I n 2018 the Leicester and Leicestershire rail line currently connects Leicester with
Enterprise Partnership launched the Energy Burton on Trent via Coalville and Ashby
Infrastructure Strategy. NWLDC will work
• The area is heavily reliant on car-borne
with the LLEP to support local businesses to
transport as a means of getting to work.
increase efficiency and to aspire to be at the
Public transport and other sustainable modes
forefront of developments in low carbon
(cycling, walking, car share etc.) could be
infrastructure.
improved to allow more local residents to
Connectivity connect to job opportunities within and
outside the district boundaries.
5.34 Despite its excellent location and the
5.38 For many years there have been calls for
external connectivity opportunities
the re-opening of the former Ivanhoe Line
regionally, nationally and globally, there
(often referred to as the National Forest
remain a number of challenges to be tackled
Line) operating between Burton on Trent
in relation to connectivity. Businesses
and Leicester encompassing the areas of
with major transportation and logistics
Moira, Ashby de la Zouch and Coalville.
requirements are drawn to areas with
The cost of reopening the line has meant
excellent transport connections, to major
that this has not been viewed as a feasible
urban areas, to a locally available and
option. However, the introduction of a new
competitive labour force and to competitive
rail passenger service remains a long-term
land values.
ambition. With new housing developments
5.35 In light of the extension of the core logistics along the route of the line, the proposed
and advanced manufacturing corridor viability of reopening the line may be
along the M1, it will be important to improved.
ensure that there is an appropriate supply
5.39 Developing high speed broadband
of development sites in order to take
connectivity is also a major priority for the
advantage of a reduction in journey times
district and we continue to work closely
through Highways Agency investment in the
with Leicestershire County Council to
Motorway. During the past two years the M1
ensure investment is made in the digital
between Junction 24 (which serves SEGRO
connectivity, notably in rural areas. Many of
Logistics Park) and Junction 25 has been
our more rural communities are missing out
upgraded to SMART motorway status.
on connectivity to high speed broadband
5.36 The existing opportunities for multi-modal and the benefits that this brings.
freight around East Midlands Airport and
at the SEGRO Logistics Park are evident.
However, the connectivity serving these
assets could still further be improved. This
125 Place
Town and local centres
5.40 Investment in our town and local centres
is a major component in improving their
attractiveness, both for local people wishing
to live there and investors committing
resources to economic growth. Local place
planning will help to coordinate investment
and make the greatest impact. The current
Building Confidence in Coalville programme
has seen large scale investment by NWLDC
and the private sector to bring schemes
forward. Projects such as the former police
station, affordable housing to replace and the
proposed regeneration of both Marlborough
and Memorial Squares, will make a
tremendous difference to the town.
5.41 In addition, the conversion of the former
bus depot into a distinctive character
commercial building also enhances the
programme. Investment in town centre
regeneration in Coalville, with the aim to
improve retail and leisure amenities and
develop a more distinctive identity, is at the
centre of Building Confidence in Coalville.
Coalville town centre has been designated
as a conservation area with the aim of
regenerating the town through conservation.
5.42 The Ashby Project, encompassing the private
and public sector, has also invested in the town
of Ashby de la Zouch with the regeneration
scheme that saw the design and delivery of new
car parking provision as well as new public art
in the North Street area of the cultural quarter.
135 Place
Visitor attractions • Over 100 pubs, restaurants and bars, tea rooms,
coffee houses and farm shops
5.43 The business of tourism in the North West • Over 15 unique visitor attractions
Leicestershire area comprises:
• An international motorsport circuit Donington
• 280 square kilometres (108 sq miles) of attractive Park – home to major motorsport events and
English countryside festivals including the internationally renowned
• Two main towns of Ashby de la Zouch with ‘Download’ Festival
its attractive shopping streets and lanes and • The international East Midlands Airport.
Coalville with its heritage sites and green spaces
5.44 The visitor economy is one that NWLDC,
• Being at the heart of the National Forest Marketing Leicester and Leicestershire
has bought large areas of newly planted and The National Forest Company wish to
woodland together with ancient woodland and develop further. There is clear potential for
regenerated open spaces such as Sence Valley NWLDC to link with these wider efforts to
Forest Park, Saltersford Valley Picnic Area, Cloud support and develop initiatives in order to
Trail and Grace Dieu Woods extend the length of time spent in the area
• Bardon Hill being the highest point in and increase visitor expenditure.
Leicestershire offering views of all surrounding 5.45 Development of initiatives and opportunities are
counties supported by the following strategies and plans:
• A strong social and industrial heritage offer that • North West Leicestershire Blueprint for Tourism
includes Coalville, mining heritage, Ashby de la 2018-2021
Zouch Castle, Grace Dieu Priory, Swannington
Incline Plane, Moira Furnace and 1620s Manor • North West Leicestershire Tourism Strategy 2019-2021
House • The National Forest Tourism Growth Plan
• A good range of restaurants, bars and artisan • The draft Tourism Growth Plan for Leicester and
food producers Leicestershire.
• Around 75 accommodation providers offering
between them over 4,000 bed spaces
145 Place
Key objectives
• Develop the work of the Coalville and Ashby • Lobby to protect the district’s interests and
projects to maximise private and public maximise the economic benefits in relation to HS2
investment into our market towns • To support the continued role out of Superfast
• Continue to support and develop our smaller Leicestershire to improve digital connectivity of
local centres to be vibrant hubs for their homes and businesses across the district
communities, businesses and visitors • Deliver the south east Coalville and Money Hill
• Support proposals for increased investment developments and ensure that the people living
within the National Forest to develop the in these new homes have relationships with their
tourism offer and support the rural economy town centres and local services
• Encourage activity and investment that supports • Explore opportunities to provide better public
and enhances the tourism offer of North West transport connections to major employment
Leicestershire areas, including rail links and the East Midlands
• Facilitate the development of East Midlands International Gateway
Airport and the wider East Midlands • Support Leicestershire County Council and
International Gateway Midlands Connect to deliver their investment
• Support the development of the SEGRO Logistics strategies for continued improvements to the
Park and the Strategic Rail Freight Interchange highway and transport infrastructure that serves
the district
• Ensure there are sufficient employment sites and
premises in the district and help to identify gaps • Work with a range of partners to maximise the
in provision by working with developers and provision of affordable housing within North
partners, particularly for incubation, and follow- West Leicestershire to ensure that residents have
on space access to good quality affordable homes.
• Work with developers, agents and partners such
as the LLEP and the Invest in Leicester team to
attract new businesses into the district and assist
with indigenous expansions
156 Business
6.1 North West Leicestershire is home 24.7% in the East Midlands and 27.8%
to some major national and multi- nationally. This shows that the district is under-
national businesses including Barratt performing in the growth of its business stock.
Developments (construction) DHL 6.4 T he major sectors in terms of the numbers
(logistics)Norton (motorcycles); Plastic of businesses in 2018 saw professional,
Omnium (Manufacturing); Pall-Ex (logistics) scientific and technical being the lead sector
Amazon (On-line retailer and warehouse) with 17% of the total business enterprise
PWC (Accountants) East Midlands Airport stock, followed by construction (12%) and
(transportation) and Ibstock Brick (Building business administration and defence (8%)
Materials). (Presented in Table 2). The sector breakdown
6.2 In the 2018 Leicester Mercury Top 200 is similar to that in Great Britain as a whole
Businesses Survey, 52 of the largest companies although there are slightly higher proportions
in Leicester, Leicestershire & Rutland, were of enterprises in production transport and
based in the District . This is another indicator storage, motor trades, wholesale, finance
as to how businesses are attracted to North and insurance, public administration, and
West Leicestershire as a location in which to defence and education. The following
do business (see Appendix A for the full list). sectors are slightly under represented:
In addition to the larger businesses, North agriculture, forestry and fishing, construction,
West Leicestershire has a number of dynamic retail, accommodation and food services,
growing small and micro businesses. information and communication, property,
6.3 The number of business enterprises in 2018 professional, scientific and technical, business
in the district stands at 4,250 – 715 higher administration and support services, health
than in 2010, which shows a rise of 20.2%. This and arts, entertainment, recreation and other
compares with a 25.0% rise in Leicestershire services.
Table 2 - Business enterprises by sector 2018
NWL Leics EM GB
NWL
(% of (% of (% of (% of
(Number)
Total) Total) Total) Total)
Agriculture, forestry and fishing 205 4.8 6.1 6.2 5.0
Production 335 7.9 7.9 7.3 5.6
Construction 515 12.1 12.4 12.8 12.4
Motor trades 180 4.2 5.4 3.7 2.8
Wholesale 215 5.1 4.7 4.3 3.8
Retail 265 6.2 6.7 7.5 7.6
Transport and storage 270 6.4 4.7 6.2 4.1
Accommodation and food services 220 5.2 4.8 5.6 5.7
Information and communication 240 5.7 5.6 5.5 8.4
Finance and insurance 115 2.7 4.3 2.6 2.2
Property 150 3.5 4.0 3.4 3.6
Professional, scientific and technical 715 16.8 15.8 14.4 17.8
Business administration and support services 335 7.9 7.8 8.0 8.5
Public administration and defence 25 0.6 0.5 0.5 0.3
Education 95 2.2 2.0 1.8 1.7
Health 120 2.8 3.7 4.1 4.1
Arts, entertainment, recreation and other services 250 5.9 5.8 6.0 6.4
Total 4,250 100 100 100 100
16
Source: Inter Departmental Business Register ONS 20186 Business
6.5 Sectors which have seen the highest growth 6.6 In terms of the size of business enterprises,
have been public administration and 3,675 businesses classified as Micro (0 – 9
defence (150% higher – though from a low employees) representing 86.5% - this is lower
base), financial and insurance (up 77%) and than for the county; region and Great Britain
mining, quarrying and utilities (up 67% - but as a whole – but with regard large enterprises
again from a small base). Only two sectors (250 employees plus), the district has a
experienced a decline in the number of higher percentage of enterprises (0.7%) – 30
enterprises – namely wholesale (-10.4%) and enterprises in total. See Table 4.
retail (-3.6%). Table 3 shows a more detailed
breakdown.
Table 3 - Business enterprises by sector 2018
%
NWL NWL
NWL NWL change
(% of (% of
2010 2018 2010-
Total) total)
2018
Agriculture, forestry and fishing 185 5.2 205 4.8 10.8
Mining and quarrying 15 0.4 25 0.6 66.7
Manufacturing 260 7.4 310 7.3 19.2
Construction 460 13.0 515 12.1 12.0
Motor trades 160 4.5 180 4.2 12.5
Wholesale 240 6.8 215 5.1 -10.4
Retail 275 7.8 265 6.2 -3.6
Transport and storage 225 6.4 270 6.4 20.0
Accommodation and food services 205 5.8 220 5.2 7.3
Information and communication 185 5.2 240 5.7 29.7
Finance and insurance 65 1.8 115 2.7 76.9
Property 100 2.8 150 3.5 50.0
Professional, scientific and technical 495 14.0 715 16.8 44.4
Business administration and support services 230 6.5 335 7.9 45.7
Public administration and defence 10 0.3 25 0.6 150.0
Education 70 2.0 95 2.2 35.7
Health 100 2.8 120 2.8 20.0
Arts, entertainment, recreation and other services 245 6.9 250 5.9 2.0
Total 3,535 100 4,250 100 20.2
Source: Inter Departmental Business Register ONS 2018
176 Business
Table 4 - Business enterprises by size (proportion of total stock) 2018
Enterprises North West Leics Leicestershire East Midlands Great Britain
Micro (0-9) 86.5 89.1 88.9 89.3
Small (10 -49) 10.1 8.9 9.1 8.7
Medium (50 – 249) 2.7 1.6 1.6 1.6
Large (250+) 0.7 0.4 0.4 0.4
Total 100.0 100.0 100.0 100.0
Source: Inter Departmental Business Register ONS 2018
6.7 From Table 5 below it can be seen that, the uncertainty in the economy over EU Exit
although the district has experienced healthy and other economic conditions. Potentially the
growth in the number of new enterprises county statistics are distorted by Charnwood
between 2010 and 2017 rising by 34.3%, being home to company registration services,
the past year has seen a severe fall of 13.5%. which may have enhanced the 2016 numbers
Similar falls have been seen at the county, significantly and the related decline.
region and national levels – perhaps indicating
Table 5 - Count of births of new enterprises 2010, 2015, 2016 and 2017
% Change % Change
2010 2015 2016 2017
2010- 17 2016- 17
North West
335 485 520 450 34.3 -13.5
Leicestershire
Leicestershire 2,300 3,380 4,385 3,165 37.6 -27.8
East Midlands 14,325 25,345 24,630 22,565 57.5 -8.4
Great Britain 230,555 377,635 408,420 375,030 62.7 -8.2
Source: ONS Business Demography 2018
6.8 Business start up rates within the district have per 10,000 population. This is a similar pattern
accelerated after coming out of the recession to the county, region and national average.
and have continued to increase year on year, Despite the rise following the recession, the
with the exception of 2014. However, in 2017 district is still significantly lower than the
the number of births had fallen to stand at 45 Great Britain average. See Table 6.
Table 6 - Number of new births of business enterprises per 10,000 population
2012 2013 2014 2015 2016 2017
North West
45 51 46 50 53 45
Leicestershire
Leicestershire 41 49 49 50 64 46
East Midlands 36 48 48 54 52 47
Great Britain 43 55 55 60 64 58
Source: ONS Business Demography 2017 and Population Data 2017
186 Business
6.9 Business start up rates have exceeded failure 6.10 T he number of deaths of businesses
rates since 2011, indicating growth in the per 10,000 population in North West
business base. By contrast, Leicestershire Leicestershire has kept below the births
start up and failure rates are still in relative figure which is a positive sign, although
equilibrium with only limited growth in in 2017, along with a slow down in new
business stock. enterprises, there has been an increase in
business deaths as presented in Table 7.
Table 7 - Number of deaths of business enterprises per 10,000 population
2012 2013 2014 2015 2016 2017
North West
43 37 42 42 40 44
Leicestershire
Leicestershire 41 36 37 41 40 56
East Midlands 35 33 34 39 38 48
Great Britain 40 37 39 44 44 55
Source: ONS Business Demography 2017 and Population Data 2017
6.11 T he table below shows the total number compared with the East Midlands and Great
of enterprises per 10,000 population with Britain but slightly below the County figure.
North West Leicestershire performing well
Table 8 - Number of total enterprises per 10,000 population
2010 2011 2012 2013 2014 2015 2016 2017 2018
North West
379 370 384 384 395 413 418 420 425
Leicestershire
Leicestershire 367 362 372 370 383 409 419 441 430
East Midlands 318 311 316 316 327 352 366 372 375
Great Britain 333 327 336 337 350 377 390 405 405
Source: ONS Business Demography 2018 & Population Data 2017
6.12 T he strength of the North West Leicestershire the value of goods and services produced in
economy is illustrated in the latest Gross an area, industry or sector of an economy.
Value Added Statistics (GVA). GVA measures
Table 9 - Gross Value Added
% growth % growth
2005 2014 2015
2005 - 15 2014 - 15
North West
£1,983m £2,773m £2,937m 48.1% 5.9%
Leicestershire
Leicestershire £11,306m £15,189m £15,381m 36.0% 1.3%
East Midlands £73,703m £96,145m £97,887m 32.8% 1.8%
Great Britain £832,176m £1,604,160m £1,650,623m 35.5% 2.9%
Source: ONS 2017
196 Business
6.13 T otal GVA grew to £2,937million in 2015, 6.19 T he chart shows a well-balanced economy.
growing by nearly 6% on the previous The sectors where North West Leicestershire
year. This placed the district in the top has a much higher proportion of workers is
30 performing local authority areas out in transport and storage – unsurprising with
of a total of 390 in the UK. North West East Midlands Airport residing in the district
Leicestershire was placed at joint 26th. The and being the home to major logistics
district significantly out-performed the companies such as DHL, UPS and TNT. This
county, region and national performances. sector accounts for 15% of all employment
6.14 Over a longer time frame, between 2005 compared to 5.3% in the East Midlands and
and 2015, total GVA grew by nearly 50% 4.9% in Great Britain.
(48.1%) in North West Leicestershire, placing 6.20 Professional, scientific and technical activities
the district in the top 40 of the 390 UK local is also a major employment sector with
authorities. 10.7% of total employee jobs compared to
6.15 In terms of sectors which performed well East Midlands (6.5%) and Great Britain (8.6%).
between 2014 and 2015, the construction There are a number of large companies who
sector saw growth of 27% and accounted have consolidated their regional city offices,
for 10.5% of the total GVA. The next best such as PWC and HSBC corporate, which are
performing sectors were other services and now based at Pegasus Business Park, Castle
household activities (13%), information and Donington. The largest employment sector
communication (12%), business service is wholesale and retail trade with repair of
activities (11%) and production (other than motor vehicles and motor cycles – similar to
manufacturing) (9%). the region and nationally.
6.16 In terms of GVA per head of population, the
district secured a figure of £30,204 in 2015 –
growing by 4.4% on the previous year. This
is the 40th fastest growth rate of the 390
authorities and the third highest in the East
Midlands (only Bolsover and Rutland were
higher).
6.17 As regards the value of £30,204 per head
– this was the highest figure of all East
Midlands authorities and the 60th highest in
the country (41 of the 59 above North West
Leicestershire are located in London, the
South East and the East of England). In 2014
it was positioned at 62nd and in 2005 was
87th.
6.18 North West Leicestershire has a well-balanced
diverse economy with a much lower reliance
on the public sector, (such as health and
public administration) than in the region
and nationally. Chart 2 below compares the
employment structure (workplace based) of
the district against that of the East Midlands
and Great Britain.
206 Business
Chart 2 - Comparisons of industrial
Chartstructure
Title (2016)
18
16
14
12
10
8
6
4
2
0
NWL EM GB
Source: BRES (2017) Broad Industry Group Classification
Notes: % is a proportion of total employee jobs excluding farm-based agriculture
6.21 At the end of 2017 there were over 2,000 those who are economically active compares
more jobs in North West Leicestershire than extremely well with Leicestershire (77.9%);
the lowest period in 2013, to now stand at the East Midlands (73.7%) and Great Britain
52,200. The employment rate of 84.4% of (72.5%) as presented in Chart 3.
Chart 3 - Percentage of economically active in Employment
Chart Title
% of economically active in employment
85
80
75
70
65
60
2007 2008 2009 2010 2011 2012 2013 2014 2015 2016 2017
NWL Leics East Mids GB
Source: ONS Annual Population Survey 2018
216 Business
Key growth sectors
Key Objectives:
6.22 Based on the analysis of BRES data and a
range of other sources considered in the • Encourage entrepreneurial activity by delivering
development of the Economic Growth programmes of support including business start-
Plan, there are five key sectors that will be up workshops
prioritised for growth within the district. • Help to deliver specific support to assist more
These sectors are: women to start a business or to consider self-
• Business and professional services (linked to employment
town centre regeneration) • Continue to deliver the council’s Enterprising
• Construction Grants schemes to assist business growth to
increase productivity and boost local employment
• Creative / cultural / tourism sector
• Work with partners to provide local businesses with
• Manufacturing advice and support. Particular focus should also be
• Logistics and distribution placed on those businesses priority growth sectors
6.23 In 2018 Grant Thornton produced it’s Vibrant • Provide information to businesses in North
Economy Index 2016 which measures the West Leicestershire about the Leicester and
economic well-being of an area. The district Leicestershire Business Gateway and achieve a
ranked 98th out of the 324 Great Britain higher enquiry take-up
authorities, but performed extremely well • Ensure there is sufficient workspace and support
in terms of prosperity, ranking it 40th in the for new enterprise and for business start-ups
country (the majority of the other authorities • Promote North West Leicestershire as a destination
are located in the South East and East Anglia). for inward investment to attract business that will
The Index contained indicators relating to create new high-skilled employment opportunities
Total GVA (Gross Value Added), GVA per job,
mean workplace weekly pay, knowledge- • Facilitate programmes that assist businesses in staff
driven employment, businesses turning over recruitment and upskilling. For example, hosting
more than a £1 million; Businesses turning jobs and skills fairs with particular emphasis
over £100m and the percentage of foreign on those furthest from the labour market and
owned businesses. promoting a more open recruitment policy
6.24 Another sign of the strong North West • Ensure there is a soft landing package for
Leicestershire economy is that it is the potential investors to make informed decisions
home of 52 of the Leicester Mercury Top about locating to North West Leicestershire
200 (2017) Leicester and Leicestershire • Assist North West Leicestershire businesses
Businesses. These cross many sectors and affected by the proposed route of HS2 to relocate
show amazing growth in recent years,
• Look to ensure that local businesses are aware of
providing employment and contributing to
HS2 supply chain opportunities
the GVA of the area. Some of these were long
standing companies such as Ibstock Brick • Encourage local businesses to get the most
and Aggregate Industries, whereas some are from their apprenticeship levy to create new
newer arrivals such as Moran Logistics. apprenticeship opportunities and upskill their
existing workforce
• Provide specialist advice such as environmental
health, planning, building control and licensing to
local businesses to ensure that they are compliant
with regulations.
227 Resources and implementation
7.1 At the current time, with great uncertainty be opportunities to collaborate formally
regarding EU brexit and the future national and informally with other districts (within
funding arrangements, it is extremely difficult Leicestershire and outside) and across other
to ascertain where future funding will come counties and LEP areas, for example the Derby
from for both infrastructure projects and and Nottingham LEP – particularly with regard
skills-related activity. Possible sources could East Midlands Enterprise Gateway. Working
be through the Local Industrial Strategy (LIS) with the National Forest and its partners is
initiatives or the National Industrial Strategy another key relationship to develop much of
(IS), the Midlands Engine or through revenue this Plan, as the forest economy emerges from
generated through business rates (national the trees.
non domestic rates). We will continue to
monitor any new sources of funding as
appropriate.
7.2 Partnerships will be critical to the success
of the Local Growth Plan, notably with
Leicestershire County Council and LLEP.
NWLDC has a key role to play in designing
interventions that will have the maximum
impact on the district. There will also
238 Delivery
8.1 The North West Leicestershire Economic 8.5 We are keen to develop interventions that
Growth Plan has been developed against are evidence based, well thought out and
the backdrop of emerging Local Industrial measurable. We would look for projects to
Strategy (LIS). While the exact details of LIS are have a clear process for identifying any added
still being shaped, the LIS can be expected to value and demonstrate a clear understanding
play a significant role in shaping the strategic of any positive and negative economic impact
direction of Leicester and Leicestershire and on the district – and where there may be
also the distribution of emerging government negative economic impacts how these could
funding. be mitigated.
8.2 The success of the Growth Plan will be 8.6 The successful implementation of this plan
monitored by the extent to which the will be enabled through strong partnerships
objectives set out in the document are with the Council and require input from local
achieved, but also by considering the businesses, the National Forest, Leicestershire
outcomes they bring. County Council, the LLEP, Stephenson College,
8.3 Strong local governance is required. The North Job Centre Plus, neighbouring authorities and
West Leicestershire Economic Growth Plan other regional bodies.
19-21 will be underpinned by action plans that
will be implemented by NWLDC’s Business
Focus Team and our Business Corporate Action
Team (CAT). The CAT brings together expertise
from various disciplines across the council
to deliver the council’s key business facing
services.
8.4 Progress on the delivery of the strategy will
be overseen by Business Focus Team, the
CAT and reported to the portfolio holder for
business and through the council’s reporting
framework.
24Appendices
Appendix A • The top North West Leicestershire companies
have a combined turnover of £12.2 billion (up
2018 Leicestershire’s Top 200 Businesses – Great from £10.7billion in 2017) and have a combined
Performance by NWL Businesses workforce of over 37,800 (around an additional
• In June 2018 the Top 200 Leicestershire 2,000 jobs). Not all of these jobs will be based in
businesses were published by the Leicester North West Leicestershire but it still indicates the
Mercury through work undertaken by De importance of these companies nationally
Montfort University and the Leicester Mercury. • Nearly 35% of Leicestershire and Rutland’s Top
These are businesses whose registered offices 200 business turnover is produced by North West
are within the city or county, based on the Leicestershire businesses
highest turnover
• Seven businesses have made the Top 200 for
• 52 of the top 200 are based in North West the first time namely: Aceso Healthcare Group
Leicestershire, indicating that the District is one Holdings, Lafarge Cauldon Ltd, Cellar Trends
of the most dynamic places to do business. This Holdings, Caetano UK, Wilson Vale Catering; J A
represents 26% of the total number of the Top Ball (Construction); and Interlevin Holdings
200. It is home to a number of long-established
companies such as Aggregate Industries, Ibstock • 21 of the 52 are placed higher than in 2017;
Brick, EMH Group, Plastic Omnium Automotive, four remain in the same position, seven new
Ashfield Healthcare, Harlow Brothers, Motors entrants and 20 fell to lower positions. Two have
(Coalville) and Pall-ex. In addition, a number of dropped out of the ranking – GO Plant (acquired
businesses have chosen to set up or expand their by a non-Leicestershire business) and A M Norris
business e.g. Moran Logistics, Forest Holidays, (plumbers).
PKF Cooper Parry Group and Interlevin Holdings
• Of the Top 200, sectors which have come forward
in particular are property development, motor
trade, construction and manufacturing, seeing
increased turnover
Leicestershire's top 200 businesses by location by district
Chart Title
40
35
30
25
20
15
10
5
0
% of Businesses % of Employees % of Turnover
25You can also read