Conceptualization of an Indicator System for Assessing the Sustainability of the Bioeconomy - SYMOBIO
←
→
Page content transcription
If your browser does not render page correctly, please read the page content below
sustainability

Article
Conceptualization of an Indicator System for
Assessing the Sustainability of the Bioeconomy
Vincent Egenolf * and Stefan Bringezu
 Sustainable Resource Futures Group (SURF), Center for Environmental Systems Research (CESR),
 University of Kassel, 34121 Kassel, Germany; bringezu@uni-kassel.de
 * Correspondence: Vincent.egenolf@usf.uni-kassel.de

 Received: 16 November 2018; Accepted: 11 January 2019; Published: 16 January 2019

 Abstract: The increased use of biogenic resources is linked to expectations of “green” economic
 growth, innovation spurts through biotechnology, development options for rural areas, and an
 increasingly regenerative resource base that is also climate-neutral. However, for several years the
 signs for unintentional and unwanted side effects have been increasing. In 2015, the 2030 Agenda
 for Sustainable Development was published at the international level in order to address this problem
 and deliver a starting point for a comprehensive sustainability criteria evaluation catalogue. Impact
 indicators to quantify the environmental burden induced by national activities in foreign countries are
 especially lacking. In this article a comprehensive framework for the evaluation of the sustainability
 of the bioeconomy, considering key objectives and relevant criteria for environmental, economic, and
 social sustainability is developed. A special focus is set to the intersection area of the three pillars of
 sustainability, where the particularly important integrative key objectives and the indicators assigned
 to them (e.g., resource footprints) apply. This indicator set can be used as a basis for bio-economy
 monitoring, which uses and produces differently aggregated information on different levels of
 action, with a focus at the national level but also including global impacts of domestic production
 and consumption.

 Keywords: resource footprints; DPSIR concept; integrative key objectives

1. Introduction
     The increased use of biogenic resources is linked to expectations of “green” economic growth,
innovation spurts through biotechnology, development options for rural areas, and an increasingly
regenerative resource base that is also climate-neutral. According to the definition of the “German
Bio-economy Council”, the bioeconomy comprises “the production and use of biological resources
(including knowledge) in order to provide products, processes, and services in all economic sectors
within the framework of a sustainable economic system” [1].
     In 2010, the German National Research Strategy on Bio-Economy 2030 was released [2]. The focus
was on international competitiveness in research and development of biotechnology. In 2014, this
framework was extended to become the National Policy Strategy on Bioeconomy and supplemented by
industrial and energy policy, agriculture, forestry and fisheries, as well as climate and environmental
policy [3]. The main goals were food security, climate protection, sustainable consumption, and
environmental protection. A progress report was published in 2016 [4] and an evaluation of the
framework in 2017 [5]. A further update, combining research and political strategy, was announced to
be published in 2019 [6]. The new main strategy will focus on the sustainable shaping of agricultural
and silvicultural production along with innovative and bio-based alternatives to existing production
processes. Paying attention to global markets and trading relations as a condition for bioeconomy,
cooperation across national borders is seen as another focal point.

Sustainability 2019, 11, 443; doi:10.3390/su11020443                       www.mdpi.com/journal/sustainability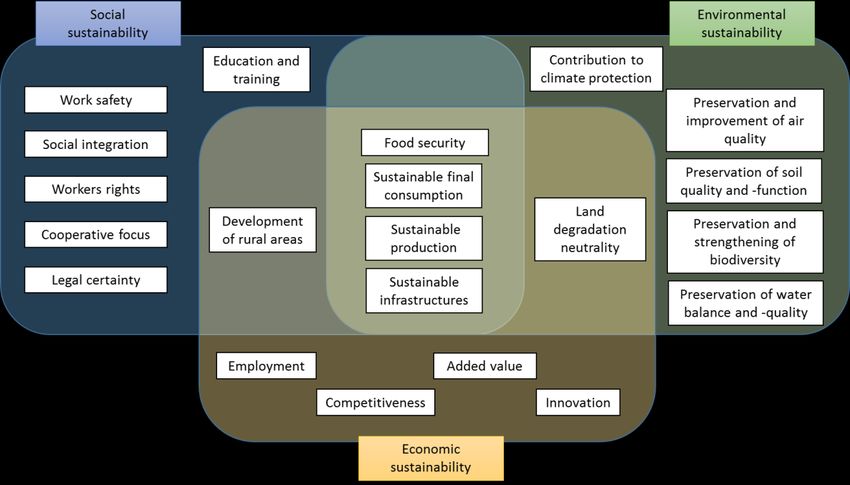
Sustainability 2019, 11, 443                                                                       2 of 20

      The EU´s strategy on bio-economy developed from several predecessor strategies, such as
early biotechnology programs (1990s), the Strategy on Biotechnology 2002, and the concept of the
Knowledge-Based Bio-Economy [7]. The goal was to tackle the challenge of boosting industrial and
economic cooperation, along with the reinforcement of excellence in science and European transnational
participation in research projects [7]. The bio-economy strategy of the European Union was under review
in 2017 and was updated in 2018 [8–10]. In summary, the five objectives of the European bioeconomy
strategy 2012 remained intact. These are: ensuring food and nutrition security, managing natural
resources sustainably, reducing dependence on non-renewable, unsustainable resources, whether
sourced domestically or from abroad, mitigating and adapting to climate change, and strengthening
European competitiveness and creating jobs. The updated European strategy supports these goals by
a system-approach action plan, which consists of three main areas. First, to strengthen and scale-up
the bio-based sectors [11] and unlock investments and markets. Second, to deploy local bio-economy
strategies rapidly across Europe. Third, to understand the ecological boundaries of the bio-economy.
Thus, the EU and German bio-economy strategy has many similarities with nuanced variation of foci.
      While dedicated policies have been established to foster bio-economy, for several years the signs
for unintentional and unwanted side effects are increasing. Globally the agricultural cultivation area is
expanding at the expense of natural ecosystems, like tropical rainforests, to feed the growing population
and supply them with energy [12–14]. Among other things, this leads to losses of biodiversity [15–17]
and to increased greenhouse gas emissions [18–20].
      The extended use of agricultural area for the supply of end-energy in Germany offers economic
advantages for the agricultural sector and seems to be positive for the climate footprint. However, in a
situation of increasing scarcity of arable land worldwide, it is inducing land conversion, especially in
the regions of origin of imports to net consuming countries like Germany, which is also contrary to
the goals set for climate and resource protection, in the sense of international responsibility [21–23].
The IPCC defines direct land use change (dLUC) as the change of use or management of land area
through human impact, which can cause a change in land cover [24]. Indirect land use change (iLUC)
refers to change of land use induced by the shift of production quantities or sites in other areas [25].
      As a result of globalization, the locations of production and consumption lie further apart [26].
Nevertheless, production and consumption are linked through process and value-added chains [27,28].
Producers and consumers can orientate themselves partly through product certification in order to
support more sustainable business practices through their demand. However, at this particular point
further research is needed, because the labelling is complex and the term “sustainability” is used in
different manners for different products [29]. A major problem results from the fact that certification
of selected product chains cannot control indirect land use change induced by growing demand for
biomass based products [30]. The question arises of how the overall demand of a country for biotic
resources has to be evaluated at the macro scale. In more general terms, the question is how the balance
of the bioeconomy will turn out if it is evaluated from different perspectives based on comprehensive
sustainability criteria.
      Research is ongoing to provide the basis for monitoring and assessing the sustainability of
the bio-economy in Germany (Project: Systemic Monitoring and Modelling of the Bio-Economy
(SYMOBIO), symobio.de and Project: Bio-Economy Pathways and Societal Transformation Strategies
(BEPASO)) and the EU [31,32]. FAO has been working with international experts towards sustainable
bio-economy guidelines [33] and provided an inventory on how sustainability has been addressed in
national bio-economy strategies so far [34].
      The 2030 Agenda for Sustainable Development was created at the international level [35] in order
to provide harmonized guidance for monitoring the progress for every country. This action plan
comprises 17 sustainable development goals (SDGs) [36–38]. Included are topics like “SDG 2: Zero
Hunger”, “SDG 13: Climate Action”, and “SDG 12: Responsible Consumption and Production”. As a
starting set, 169 indicators were listed to operationalize the SDGs, still leaving blank some important
areas where indicators would have to be established. A field of particular relevance is the tracking of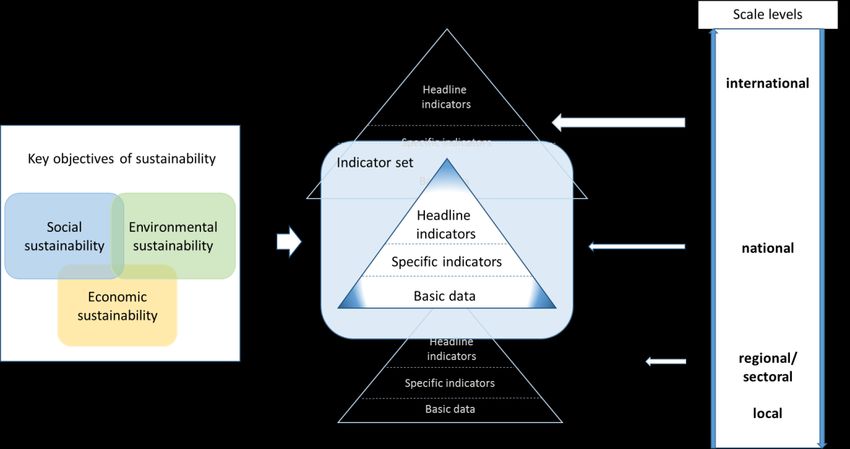
Sustainability 2019, 11, 443 3 of 20
impacts of national activities on foreign countries. This article will focus on the possibilities to monitor
various “footprints” of countries´ production and consumption on the environment in other regions,
or globally.
The implementation of SDGs at the national level and the further development of the set of
indicators continues and takes place in a dynamic process, which depends on the national priorities,
the possibilities of data collection and reporting, and not least on further research and development
activities to improve the knowledge base and monitoring.
The main advantage of the SDG concept is an internationally comparable set of indicators, for
which the data basis in major parts already exists. For a country like Germany for example, in addition
to the global perspective, the targets at the EU level as well as the national level have to be considered.
In order to assess the progress of the SDG’s at the national level with implications for the global effects,
it is necessary to define indicators in the prioritized areas.
This article develops a comprehensive framework for the evaluation of the sustainability of the
bio-economy, considering key objectives and relevant criteria for environmental, economic, and social
sustainability and the respective evaluation criteria.
2. Material and Methods
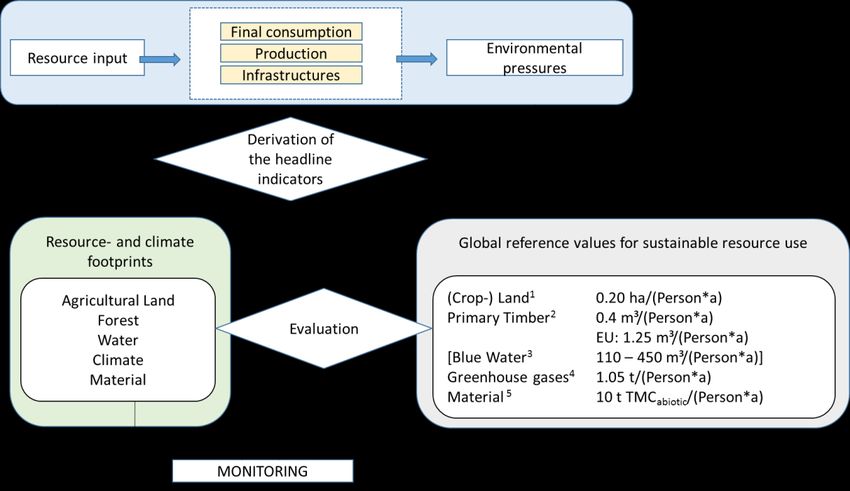
2.1. The Driving forces-Pressure-State-Impact-Response Concept
The Driving forces-Pressure-State-Impact-Response (DPSIR) concept was developed in the
1990s [39]. The core of the concept is socio-economic drivers like production, consumption, and the
construction and maintenance of infrastructure. These exert pressures to the environment by extraction
and harvest of raw materials, and final disposal of waste and release of emissions to water and air.
As a consequence, the state of environmental changes impacts society and environmental systems,
with consequences such as climate change and biodiversity losses. The reaction to this takes place
in the form of policies, and society in the form of a regulatory influence on drivers, pressures, and
impacts. Since an effective reduction of environmental impacts is primarily achieved through technical
or organizational measures along the production-consumption chain, the focus is set purposely on the
regulatory impact on these causal drivers (production, final consumption, and infrastructure).
The resource inputs determine the extent of material throughput in the production and consumption
system, and thereby have a direct impact on the scale of the environmental impacts associated with
extraction or harvest (input), and emission or waste (output). In addition to the resources used, the
direct and indirect use of cropland area by the production and consumption system is another important
stress factor. A schematic DPSIR system, taken from and subsequently adapted and supplemented by
Bringezu et al. [40], is shown in the supplementary information (Figure S1).
2.2. Requirements for Indicators of Sustainability
Indicators are measured variables which provide empirical statements on the facts to be described
in a representative form [41].The choice of indicators included should be made in a way that they
initially provide sufficiently valid information about the respective target question. In our case, they
ought to highlight progress and regression in relation to essential aspects of a sustainable bio-economy.
The scope of the indicator set has a direct relationship to the nature of the statement. A small number
reduces the level of detail of the statement and is more appropriate to provide overview, while a
large number of indicators reduces the overview character of the statement and is more appropriate
to elucidate details. In order to ensure the required level of quality of information, it is necessary to
define certain guideline, indicators in a set of indicators must meet. These guidelines vary according to
different authors and institutions, depending on the underlying question. The following requirements
have been listed most frequently: scheduled and quantified targets, robustness, communicability,
vertical integration, coherence, and data availability [42–44]. We conclude that a key set of sustainability
indicators should be tested against the listed characteristics before application. Some indicators, whichSustainability 2019, 11, 443 4 of 20
are relevant to measure progress on the macro level, can also be applied on a product level, for instance,
by means of life-cycle assessment (LCA) [45]. Indicators for social LCA [46] follow, in principle, the
same framework.
2.3. Definition of Key Objectives for the Three Pillars of Sustainability
The three-pillar model of sustainability [47] was used as systemic basis for the assignment of key
objectives to the categories of ecological sustainability, economic sustainability, and social sustainability.
In this article, the term “environmental sustainability” is used instead of “ecological sustainability”.
A distinction is made between specific and integrative key objectives. The specific key objectives are
pillar-specific, such as the key objective of working conditions for the pillar of social sustainability.
Integrative key objectives can be assigned to at least two pillars at the same time, and thus lie within
the intersection areas of the columns.
In Germany, in the course of preparing a research program to underpin a monitoring system of the
bioeconomy, three status reports about the “existing basics and contributions for a monitoring of the
bioeconomy” were published by Adler et al. [48], Delzeit et al. [49], and O’Brien et al. [50]. Adler et al.
carried out comprehensive literature research on the subject of the key objectives of bio-economy,
which includes strategy papers of the Federal Ministry of Education and Research [2] and the Federal
Ministry of Food and Agriculture [51], as well as scientific papers. As with the SDGs, the progress
reports formulate objectives and indicators for assessing progress in increasing the sustainability of
production and lifestyles. It pointed out that there is a need for development, particularly with regard
to the recording and modelling of resource footprints. However, their results only refer to the three
pillars of sustainability in a separate way.
In this paper, the assessment is extended by key objectives assigned to the intersection areas
of the three pillar concept. Here, the results of Zeug et al. [52] are reflected, who identified priority
issues for monitoring of bio-economy under sustainability aspects through a stakeholder survey.
A text-analytical comparison of the Agenda 2030 with strategy papers on the bio-economy of the EU
and the German government revealed complementary priorities. While the United Nations puts the
avoidance of hunger and the development of developing countries first, for the Federal Government
and the EU, the (socio-) economic and technical-innovative potentials of the bio-economy have a higher
priority. The survey of stakeholders from the fields of business, NGOs, and science, in turn, revealed
a comprehensive German perspective, in which the international impacts of national action were
brought to the fore. The global fight against hunger has also been identified as a particular priority by
stakeholders, which in the field of bio-economy means that food production should be given preference
over the production of non-food products (“food first”).The development of sustainable consumption
and production structures was also classified as a particular priority. The protection of biodiversity in
terrestrial and aquatic ecosystems was also considered particularly important, as was the maintenance
of good water quality.
2.4. Resource and Climate Footprint Concepts in the Current Literature
In the current scientific literature discussing life-cycle impacts of countries, the term “footprint”
is commonly used. Various teams of researchers have already dealt with one or more footprint
concepts [53–57]. The supplementary information (Table S1) provides an overview of the leading
footprint concepts and their main authors. The following sections describe the concepts of the different
resource footprints referring to Bringezu et al. [40]. A viable data base for footprint calculations are
input-output tables [58]. Different multi-regional input-output tables were established and evaluated for
footprint analysis within the last several years. Examples are EORA [59], GTAP [60], and EXIOBASE [61].
These tables are quantifying the product flows between industries and consuming sectors, both within
and between countries, and their environmental extensions include extraction of resources, emissions,
and final waste disposal. As a consequence, product groups consumed in one country can be traced
back to their origin in other countries and regions. Depending on the calculation method, the result isSustainability 2019, 11, 443 5 of 20
either the footprint of production (domestic extraction + import) or the footprint of final consumption
(domestic production + import − export), including upstream resource requirements or greenhouse
gas emissions.
2.4.1. Agricultural Land Footprint
The main categories of land use are urban and infrastructure areas, agricultural areas, forest areas,
areas for nature conservation, and others, including water bodies.
The expansion of urban (settlement) area and agricultural area at the expense of forest area
is an important driver of global land use change (LUC). In Germany, the expansion of urban area
on productive and fertile agricultural land is the most important factor for LUC. Furthermore, the
expansion and intensification of the use of existing agricultural land worldwide leads, in many cases, to
soil degradation [30]. These described influences in combination with an increasing world population
and a hereby-increasing demand for food make agricultural land an even more valuable resource.
The agricultural land footprint consisting of cropland and land for permanent cultures and perennial
plants is of great importance for the implementation of the global key objective of “halting the loss of
biodiversity through the expansion of agricultural area”.
The agricultural land footprint of domestic production is calculated from the share of domestic
arable land and the share of arable land in foreign countries, which is indirectly used for domestic
consumption via the import of products. If the amount of land under cultivation for export products is
deducted from this footprint, the footprint of domestic consumption results.
The unit of the agricultural land footprint is hectares per person. This enables an international
comparison, as well as a relation to reference values of the sustainably available areas. Data on the
global use of agricultural and forestland at national level are provided in annual reports by the Food
and Agricultural Organization of the United Nations (FAO). The analysis of agricultural land footprints
is the subject of various publications, e.g., by O’Brien et al. [62].
2.4.2. Forest Footprint
The forest footprint (FFP) is calculated from the quantity of domestic primary timber harvested
annually, plus the quantity of primary timber used abroad for the production and processing of
products, indirectly used by domestic players through the import of these products. If the amount
of primary timber used for export products is deducted from this footprint of production, the FFP of
domestic consumption results.
The FFP is thematically assigned to the material footprint. However, its valuation is based on a
different reference unit and a specific valuation scale. The data basis of the FFP can be taken from the
biotic fraction of the raw material input (RMI).
The FFP is evaluated by comparing it with the net annual increment (NAI) of a reference area
(country, EU, international) and the orientation value of the sustainable use of forest resources [63].
Approximate values of the NAI at the country level can be taken, for example, from O’Brien [63].
The unit of the NAI is (m3 /(a*ha)). This corresponds to the unit cubic meter of standing stock. The NAI
is used as a common parameter in wood statistics, such as the results database of the Federal Forest
Inventory [64].
The steady increase in the use of forest resources underlines the importance of calculating and
evaluating an FFP. The amount of timber used in the paper and cardboard sector has risen sharply over
the last 50 years. Although the majority of this is already being made available through waste paper
recycling, the use of primary timber is increasing worldwide [63]. Global timber production is forecast
to increase by 44% between 2005 and 2030 [65,66], pointing to a sharp increase in the demand for forest
biomass for final energy production, as used in the IPCC scenarios, for example. The evaluated FFP
provides answers to the question of whether the forecasted timber demand can be satisfied under a
sustainability perspective.Sustainability 2019, 11, 443 6 of 20
2.4.3. Water Footprint
The concept of the Water Footprint (WFP) was developed by Hoekstra and Hung [67] and
supplemented over the years. The Water Footprint Assessment Manual, published in 2011, describes
three types of water footprints [68].
The blue WFP refers to the amount of extracted surface or groundwater.
The green WFP comprises the quantities of precipitation water released into the atmosphere
during the growing period (or lifetime) of a crop by evapotranspiration of the plant and evaporation of
the soil.
The grey WFP corresponds to the dilution volume required to dilute anthropogenically released
pollutants into surface and groundwater bodies, to a concentration defined by specific threshold values.
Meanwhile, the effects of indirect water use must be taken into account, as the use of regional
water resources is no longer spatially tied to a respective consumer due to global product flows. This
has led to a series of concepts for concretizing and evaluating the water footprint, which are constantly
being further developed.
Of particular note is DIN EN ISO 14046:2016-07 (Environmental Management-Water Footprint-
Principles, Requirements, and Guidelines), which aims to ensure international consistency in the
determination and reporting of water footprints. In these new concepts, the water footprints according
to Hoekstra et al. [68] are each referred to as the virtual water content of a product and weighted
by using various criteria. An important criterion is the availability or scarcity of water in the region
where a certain (agricultural) product is produced. The “Water Scarcity Index” (WSI), according to
Pfister et al. [69], is an example. The direct, and especially the indirect, use of water through product
exports can thus be evaluated and discussed against the background of the water supply in a region.
In total, 70% of the world's fresh water is used for irrigation of crops [70]. The progressive
expansion of irrigated areas contributes to the regional scarcity of water reserves worldwide [71,72].
Therefore, a focus of the water footprint survey can be set on water abstraction for irrigation of
crops, represented by the blue WFP.
The green WFP of an unirrigated area results from the amount of precipitation minus the surface
runoff and minus the drainage through the root zone (groundwater runoff). It can be calculated as
evapotranspiration of a plant. When assessing the effects of water use on regional water reserves, the
green WFP has no significance for unirrigated areas, as it does not represent anthropogenic water
abstraction, and the exclusive use of green water in crop production therefore does not contribute to
water scarcity.
For an irrigated area, the proportion of (blue) irrigation water and (green) precipitation water in
evapotranspiration can only be broken down with the aid of special models, whose calculations are
prone to errors due to necessary simplifications and uncertainties, and are therefore under criticism [73].
A breakdown is necessary for the correct calculation of the green WFP, because since the here applied
concept is mapping the entire abstraction of blue water for irrigation via the blue WFP, any loss of blue
water as a result of extraction (e.g., also by evaporation) is already taken into account.
Green WFPs are also insignificant when it comes to changing water quality through anthropogenic
use, as green water is purified from its material load by evaporation. Green WFPs play a role in
the assessment of land use changes and their effect on surface and groundwater runoff. Since most
agricultural systems return less precipitation to the atmosphere through evapotranspiration than the
natural systems they replace, global runoff in river systems has increased by about 7% [70].
Further research is needed for a satisfactory concept for the grey WFP that meets the requirements.
2.4.4. Material Footprint
The Material Footprint (MFP) of a product can be determined by the cumulative raw material input,
according to VDI 4800 Part 2. It covers the resource input associated with the production, use, recycling,
and disposal of biotic and abiotic raw materials. The cumulative raw material input is methodologically
rather similar to the Raw Material Input (RMI) introduced at national and EU level [74–76]. The onlySustainability 2019, 11, 443 7 of 20
difference is that the latter accounts biomass harvest from agriculture and professional gardening,
while the former regards those processes as within the economy, which requires recalculating that
biomass into their abiotic inputs.
The MFP of domestic production (Raw Material Input, RMI) is calculated from the total domestic
extraction of raw materials and the quantity of raw materials used abroad for the production and
processing of products, which is indirectly used by domestic producers via the import of these products.
When the quantity of raw materials used for export products is deducted from the RMI, the MFP of
domestic consumption is obtained (Raw Material Consumption, RMC).
A separate identification of abiotic and biotic raw materials, both part of RMI and RMC, is possible.
Abiotic raw materials include ores, fossil fuels, and non-metallic minerals, while biotic raw materials
include agricultural, forest, and aquatic raw materials. The category RMIbiotic includes food as well as
biomass used for material and energy purposes.
As material flows induced by the economy and society, and thus also their effects on the
environment, are expected to increase worldwide in the coming decades [77], the monitoring of the
material footprint is of great value in the sense of a global increase in sustainability. Sufficient data
is also available on an international level. The data basis for the collection of the material footprint
are international input-output tables, as contained among others in the IRP database. International
comparisons of material footprints are provided by the UNEP [78,79].
However, the calculation of these raw material indicators does not take into account the unused
part of the extraction. Total extraction, covering both used and unused extraction, would be accounted
for by the indicators Total Material Requirement, TMR, and Total Material Consumption, TMC [74,80].
An update on the global scale is necessary since the data basis is still in an early stage of development.
2.4.5. Climate Footprint
The Climate Footprint (CFP) cumulates the direct and indirect greenhouse gas emissions of all
processes associated with a product or service over the entire life cycle of a product or service.
For a country, it is usually accounted for on a yearly basis. Indirect greenhouse gas emissions refer to the
emissions that must be allocated to the region of consumption via the import and export of products
from the region of production, processing, or the like. The climate footprint of domestic production and
consumption is calculated analogously to the footprints described above.
The CFP is established as an environmental impact indicator in the LCIA and has been part of
many studies [81–85].
The IPCC lists a lot of different gases which react climate-actively [86]. Six of these gases are
mentioned in the Kyoto Protocol: CO2 , CH4 , N2 O, HFC, PFC, and SF6 [87]. Later, NF3 was added to
the list [88].
3. Result Analysis
3.1. Key Objectives of the Bioeconomy
The key objectives of the social, economic, and environmental sustainability, with the intersections
between the different pillars, are presented in Figure 1. The aspects food security, sustainable final
consumption, sustainable production, and sustainable infrastructures could be identified as integrative key
objectives. The integrative character of these four key objectives results from the fact that they are
relevant to all three pillars of sustainability. The indicator system presented here will therefore take
particular account of these aspects. The results of Zeug et al. [52] support the importance of those
integrative key objectives for German stakeholders.Sustainability 2019, 11, x FOR PEER REVIEW 8 of 20
Sustainability 2019, 11, 443 8 of 20
Sustainability 2019, 11, x FOR PEER REVIEW 8 of 20
Figure 1. Key objectives of the bioeconomy.
Figure 1.
Figure Key objectives
1. Key objectives of
of the
the bioeconomy.
bioeconomy.
3.2. Information Aggregation and Levels of Action
3.2. Information Aggregation and Levels of Action
3.2. Information Aggregation
The three pillars and Levels of Action
of sustainability—environment, economy, and society—define the basis for the
The three
thematic pillars of the
framework sustainability—environment,
indicator system. Each of the economy, and society—define
three pillars has assigned keytheobjectives.
basis for the
An
The three pillars of sustainability—environment, economy, and society—define the basis for the
adequateframework
thematic set of indicators
of theisindicator
necessarysystem.
to quantify theofkey
Each theobjectives. Thehas
three pillars supplementary
assigned keyinformation
objectives.
thematic framework of the indicator system. Each of the three pillars has assigned key objectives. An
(Table
An adequateS2,S3,S4)
set ofshow an overview
indicators about
is necessary the keythe
to quantify objectives and assigned
key objectives. indicators information
The supplementary of the three
adequate set of indicators is necessary to quantify the key objectives. The supplementary information
pillars.S2–S4) show an overview about the key objectives and assigned indicators of the three pillars.
(Tables
(Table S2,S3,S4) show an overview about the key objectives and assigned indicators of the three
ItItisispart
partofofanan information
information pyramid,
pyramid, fromfrom which
which threethree
levelslevels of information
of information aggregation
aggregation are
are picked
pillars.
picked
out, which out,correspond
which correspond to the
to the base, thebase, the and
middle, middle, andofthe
the top thetop of the pyramid,
pyramid, in which in
onewhich
may one may
observe
It is part of an information pyramid, from which three levels of information aggregation are
observe continuous
continuous transitions.transitions.
The top form Thethe
top form the
headline headline
indicators, indicators,
followed followed
by the by the specific
specific indicators, and
picked out, which correspond to the base, the middle, and the top of the pyramid, in which one may
indicators,
the base forms andthe
thebasic
basedata
forms the basic
(Figure 2). data (Figure 2).
observe continuous transitions. The top form the headline indicators, followed by the specific
indicators, and the base forms the basic data (Figure 2).
Figure2.2. Aggregation,
Figure Aggregation, scale
scalelevels,
levels,and
andinformation
informationflow
flowof
ofthe
theindicator
indicatorsystem.
system.
Figure 2. Aggregation, scale levels, and information flow of the indicator system.Sustainability 2019, 11, 443 9 of 20
Headline indicators summarize certain aspects in a clear form so the cause-effect relationships can
be bundled by them. Headline indicators should inform about essential characteristics of a system.
Combined with reference values, they indicate to decision-makers the need for change measures. They
therefore have a high degree of aggregation of information and a correspondingly low level of detail.
In this paper, the headline indicators include resource footprints, which are used to measure important
integrative key objectives of sustainability (part of several pillars). An example for a well-known
economic headline indicator is GDP (gross domestic product).
Specific indicators broaden and deepen the information the headline indicators provide. They are
defined more narrowly but still keep the attributes of an indicator, meaning they adequately inform
about certain characteristic features. An example would be the indicator of self-sufficiency in forest
resources. In the social sector, an example indicator could be the level of disabled persons integrated in
the bioeconomy (e.g., workshops for disabled people). On the lowest level of the information pyramid,
basic data provide information. These are used to calculate specific and headline indicators. Basic data
can be partly used their own characteristic values and have a high degree of detail. The aggregation of
information provided by the different layers of the information pyramid has to be distinguished from
the scaling level of actors and the respective monitoring. Here the range of actors extends from a local
level, regional and national level, up to the global level. Each of the scale levels has to be monitored
considering different information pyramids. Depending on the local conditions, the headline indicators
of the different information pyramids may differ.
Significant for the presented indicator system is the multi-scale applicability and relevance.
The consideration of all pillars of sustainability for the derivation of the indicator framework guarantees
a holistic point of view. It hereby enables users to answer target questions on sustainable development
from a large-scale international level to a small-scale regional level of action. The underlying target
question defines the level of observation. It is decisive that goals on the national level can only be
realized if the necessary information is forwarded and monitored on lower levels of action. Vice versa,
substantial requirements and development of local and regional levels has to be considered in the
goals, the evaluation criteria, and the monitoring on a higher level of scale. A top-down as well as a
bottom-up information flow is necessary to realize an adequate information flow within the system.
3.3. Integrative Key Objectives of the Bioeconomy
The cross-dimensional key objectives are particularly important, not least because of their
integrative character (Figure 1, Table 1). The selection of key objectives and criteria was conducted
following Section 2.3 of the article. We assigned an exemplary indicator to each criterion. Regarding the
FAO food security indicators, an internationally well-established set of indicators is chosen. The second
set of headline indictors are the resource footprints; there relevance is further explained below. Criteria
that are also explicitly mentioned in the subject catalogue of the SDGs are listed separately, stating
the respective number. Aspects marked with an asterisk (*) were classified as particularly relevant in
the stakeholder analysis reported by Zeug et al. [52]. Classical LCA indicators are listed, e.g. climate
footprint, as well as indicators which can be assigned to social LCA [46], like the indicator of political
stability within the FAO food security indicators.
Indicators marked with (“) are not part of regular data collection, but refer to the results of
individual reports. The last column shows possible sources of data for the indicator quantification.
LandSHIFT is a land use change model for global and regional scale simulation experiments developed
by Schaldach et al. [89] at the Center for Environmental Systems Research (CESR) in Kassel.Sustainability 2019, 11, 443 10 of 20
Table 1. Integrative key objectives, criteria, and indicators of sustainability.
Integrative Key Objectives Criteria Sustainable Development Goal (SDG) Headline Indicators/Specific Indicators Scale Levels/Sources
Working conditions in the RA 9.1, 11.2 Access to public transport in RA national [90]
Development of rural areas (RA) Employment in the RA (8.5) Number of employees in RA in Full Time Equivalents (FTE) national [90]
Added value in the RA (9.3) Added value of the selected bio-economy sectors in the RA national [90]
2.4, 14.5, 15.1 Ratio of land use categories to total land area national/EU/international [91]
Land consumption
2.4, 15.3 Proportion of degraded agricultural area international [92]
Land degradation neutrality 2.4, 15.3 Loss of agricultural area national/EU/international [91]
Land use change (LUC)
15.1, 15.2, 15.3 Loss of forest area national/EU/international [91]
- Loss of agricultural area national/EU/international [91]
Indirect land use change (iLUC)
- Loss of forest area national/EU/international [91]
Food situation 2. FAO Indicators for food security international [92]
national [90],
Food security* Price development 2.c Development of consumer prices for food commodities EU [93]
international [92]
Self-sufficiency rate - Share of food consumption covered by domestic production national [94]
- (Agricultural-) land footprint -
- Forest footprint -
Resource inputs and -
- Water footprint
consumption -
sustainable - Climate footprint
Production* 8.4, 12.2 Material footprint international [95]
Infrastructures*
Total raw material productivity
Final consumption* Resource productivity 12.2 national/EU [93]
(GDP per resource consumption)
11.6, 12.3, 12.5 Amount of waste
Waste management national [90]
12.5 Recycling rate of municipal waste
Production cascades - Biomass utilization factor national [96]
Share of products certified for
Certification - national [97]
sustainable production in final consumptionSustainability 2019, 11, 443 11 of 20
The table does not claim to be complete, but serves to illustrate an exemplary structure of an
indicator system for assessing the sustainability of the bioeconomy. The respective indicator table
may need to be adapted depending on the national or regional conditions, policy priorities and the
scale of the reference system. Selected indicators would need to be checked against the quality criteria
described in Section 2.2 before application.
Rural development is a key objective that can be assigned to both social and economic sustainability
assessments through the spatially differentiated presentation of criteria, such as working conditions,
employment, and added value.
Another important key objective is the avoidance of area degradation in the sense of Land
degradation neutrality [98–101]. Meaning that settlement areas, for example, do not expand indefinitely
at the expense of agricultural areas, and these in turn do not expand at the expense of forest and natural
areas. Land degradation neutrality aims at a zero net balance of change between the types of land use.
For monitoring, in the first step, the real domestic land use is presented, divided into the five main
categories of land use: settlement and transport areas, cropland, forest areas, water areas, and other
areas, such as protected areas (nature reserves, national parks, and biosphere reserves). In a second
step, criteria will have to be applied which aim at direct and indirect land-use changes (LUC and iLUC)
associated with activities within national territory, impacting land use on foreign territory, in particular
losses of agricultural and forest land. These data are determined in connection with the quantification
of area footprints, since the indirectly induced losses are used to determine the land use triggered by
the product demand of domestic consumption abroad. In the land use category of arable land, it must
also be examined to what extent parts of it are degraded, e.g., by erosion.
Food security is a key objective that is becoming increasingly important as the world's population
is growing. Therefore, food security has the highest priority within the bioeconomy. In order to
guarantee this, criteria from all three pillars must be examined and observed. These include price
trends, the nutritional situation, and self-sufficiency. Indicators such as the trend in consumer prices for
food, the proportion of food consumption that can be covered by domestic production, and the FAO indicators
for food security can be assigned to them. The latter are divided into four different categories, which are
shown in the supplementary information (Table S5).
An important goal of bioeconomy is to strengthen sustainability in production, infrastructure,
and consumption [77]. German stakeholders attach particular importance to this goal [52].
In order to meet this expectation, it is necessary to extend the indicator set of SDGs in a way that it
is possible to make sufficient statements on the criteria of resource inputs, consumption, and efficiency.
Currently, German official reporting only considers the material intensity, putting the material footprint
in relation to an economic output indicator. In order to be able to make statements about the total
resource requirements and key environmental pressures, it is also necessary to determine the resource
footprints for (agricultural) land, forest, and water, and the climate footprint in terms of greenhouse
gases (GHG). The resource and climate footprints of domestic consumption relate to the extent to which
resources are used or GHG emissions are released on national and foreign territory, in connection
with the final domestic consumption of products. The quantity of these resources, used for imports
or emissions released for their production abroad, is added to the annual domestic resource use and
emissions by production, processing, etc., and the quantities of the resource used or emissions released
for exporting these products are deducted.
While sustainable production and consumption are related to SDG 12 “Responsible consumption
and production”, the integrative key objective of sustainable infrastructure relates explicitly to SDG
9.1 “Build resilient infrastructure, promote inclusive and sustainable industrialization and foster innovation”.
In this goal, the development of “quality, reliable, sustainable, and resilient infrastructure . . . to support
economic development and human well-being” is demanded, which states the integrative character of
this key objective.
In addition to the use of resources, resource productivity is another important criterion in
order to assess the performance of bioeconomy. Indicators of resource productivity are raw materialSustainability 2019, 11, 443 12 of 20
productivity (GDP/cost of raw materials) (€/kg) and area productivity (yield/reference area) (t/ha).
At the country level, reference area may refer to the domestic area under cultivation (for specific crops),
or the footprint area.
Waste management has a direct influence on the sustainability of production, consumption, and
infrastructure. Indicators, such as the amount of waste or the recycling rate of municipal waste, allow
drawing conclusions about the resource losses occurring in the system, and thus provide indications of
possible optimizations. The criterion use of production cascades is directly related to this, since the use
of primary resources can be reduced by the multiple use of a product. According to the definition of
the Federal Environment Agency, cascade use exists if the end product of a production process from
biogenic raw material to bio-based product is used for material or energy purposes, at least a second
time [102]. This is quantified by the indicator biomass utilization factor.
Certification is a criterion that can have a beneficial impact on the sustainability of bioeconomy if
two aspects are fulfilled. On the one hand, the respective certificate must scientifically substantiate
an increase in the sustainability of the respective production-consumption chain. On the other hand,
the consumer must trust the respective certificate and consequently change or adapt his consumer
behavior. The core aspect is to increase the transparency of the life cycle of products for end consumers.
From an overall economic perspective, the share of products certified for sustainable production in final
consumption can be a possible indicator.
The aspect of good political practice (good governance), which is addressed in the SDG’s catalogue
by the sub item 16 peace, justice and strong institutions, would formally belong to the category of
integrative key objectives. However, this key objective is not specifically relevant for the bioeconomy
as such, and is therefore not included in Table 1. Nevertheless, good political practice can be important
for assessing the origin of imports.
3.4. Resource Footprints as Indicators for the Integrative Key Objectives
In two decades of life cycle impact assessment (LCIA) and research on environmental impact
categories, like the greenhouse effect, a number of methodical approaches have been developed
to depict further specific environmental impacts of products system-wide (eutrophication, ozone
depletion, ozone formation, acidification potential, ecotoxic potential, etc.). However, to quantify
the various mid- and end-point indicators of LCIA for specific products, a high degree of spatial
differentiation is often needed, and while there has been progress towards this end in recent years [16],
still no global widely-accepted methodology or comprehensive database exists [45].
The level of detail of the resource footprints in comparison to the numerous indicators used in
LCIA may appear superficial. Steinmann et al. [56] proved that the four resource footprints of material,
water, fossil energy, and land combined represent more than 84% of the variance of all product specific
environmental impacts investigated in product life cycle assessment. They are, therefore, a good proxy
for environmental damage potential [103].
This leads to the hypothesis that in order to produce an overall picture on a global perspective,
"the abundance of environmental indicators can be reduced to a small key set, which represents the
major part of the change of environmental influences between product life cycles" [56].
The authors take up this approach here. Figure 3 illustrates the direct relation of resource footprints
as indicators of the integrative key objectives of the bioeconomy. In contrast to Steinmann et al. [56],
in this approach the indicator climate footprint is used instead of the cumulated fossil primary energy, in
order to include greenhouse gases such as methane and nitrous oxide, which play an important role
in agricultural processes. Additionally, based on Bringezu et al. [12], the authors introduce a forest
footprint for the quantification of the use of forest biomass induced by the bioeconomy.
The five footprints are determined in their scale by the volume of material throughput of
the production and consumption system, which in turn determines the extent of impact bundles
associated with resource extraction, product use, and disposal. The footprints provide highly aggregated
information on key performance properties of the (bio-)economy and related environmental impactSustainability 2019, 11, 443 13 of 20
potential. In the future, they may be further combined with more specific information of impact
cascades in the environment, when more product specific information on production-consumption
chains and spatially explicit data on impacts become available.
A consumption perspective on social indicators helps to reveal trade-related impacts of social
responsibility issues [104]. Comparing eleven social indicators and seven environmental footprints for
specific countries, O’Neill et al. [105] found out that none of these countries meet basic social needs
without crossing biophysical boundaries (following the planetary boundaries concept [106]). Therefore,
Sustainability 2018, 10, x FOR PEER REVIEW 13 of 20
in the future, it will be interesting to monitor not only the resource footprints of nations but also related
social aspects,
but also relatede.g., on the
social sociale.g.,
aspects, implications in the
on the social exporting in
implications countries supplying
the exporting products
countries to net
supplying
consuming countries.
products to net consuming countries.
Figure
Figure3.3. Resource
Resource footprints
footprints as
as headline
headline indicators
indicators of
of the
the key
key objectives
objectives of
of bioeconomy.
bioeconomy. The The reference
reference
values 1 2 3 [107] based
values of
of sustainable resource use
sustainable resource use are
are taken
taken from
from the
thefollowing
followingsources:
sources:1[12],
[12], [63]¸
2[63]¸ 3[107] based on
on [108], 4 [109], 5 This material footprint focuses on abiotic materials. TMC isonly
only relevant
relevant for
[108], 4[109] ., 5This material footprint focuses on abiotic materials. TMCabioticabiotic is for the
the
consideration of bioeconomy to the extent that problem shifts into mineral-based raw
consideration of bioeconomy to the extent that problem shifts into mineral-based raw material areas material areas
are
areto
tobe
beexpected.
expected.
3.5. Evaluation of the Resource Footprints based on Sustainability Criteria
3.5. Evaluation of the Resource Footprints based on Sustainability Criteria
However, the quantification of a resource footprint does not allow statements about the change
However, the quantification of a resource footprint does not allow statements about the change
in sustainability performance. Therefore, it is necessary to put the respective footprint in relation to
in sustainability performance. Therefore, it is necessary to put the respective footprint in relation to
orientation values in a meaningful reference system (global, regional, local). A table showing the
orientation values in a meaningful reference system (global, regional, local). A table showing the
reference values of sustainable resource use of water, materials, primary timber, carbon, and cropland,
reference values of sustainable resource use of water, materials, primary timber, carbon, and
which is taken and amended from O’Brien et al. [110], is provided in the supplementary information
cropland, which is taken and amended from O’Brien et al. [110], is provided in the supplementary
(Table S6).
information (Table S6).
These orientation values consider, on the one hand, objects of protection, like the global biodiversity,
These orientation values consider, on the one hand, objects of protection, like the global
and on the other hand respect the criteria of international equity, in which each person is in principle
biodiversity, and on the other hand respect the criteria of international equity, in which each person
granted the same right to use resources (expressed by per-person values).
is in principle granted the same right to use resources (expressed by per-person values).
For example, Bringezu et al. [12] suggested to use 0.20 hectares per person as an orientation value
For example, Bringezu et al. [12] suggested to use 0.20 hectares per person as an orientation
for the cropland area available to produce finally consumed agricultural goods under sustainability
value for the cropland area available to produce finally consumed agricultural goods under
criteria in 2030. This calculation was based on the assumption that the Business-as-Usual development
sustainability criteria in 2030. This calculation was based on the assumption that the Business-as-
of the cropland expansion will be stopped after 2020. The resulting value of 1.66 billion hectares under
Usual development of the cropland expansion will be stopped after 2020. The resulting value of 1.66
cultivation was related to the world population in 2030. The problem that the global expansion of
billion hectares under cultivation was related to the world population in 2030. The problem that the
global expansion of agricultural land is a major driver of biodiversity loss is particularly important
in the sustainability assessment [16,17,111]. The convention of biological diversity (CBD) already has
the status of an international treaty. If their goal of halting the loss of global biodiversity is to be
achieved, this requires, in particular, a halt to the net expansion of agricultural land, especiallySustainability 2019, 11, 443 14 of 20
agricultural land is a major driver of biodiversity loss is particularly important in the sustainability
assessment [16,17,111]. The convention of biological diversity (CBD) already has the status of an
international treaty. If their goal of halting the loss of global biodiversity is to be achieved, this requires,
in particular, a halt to the net expansion of agricultural land, especially intensively used arable land.
In 2007, each EU citizen consumed an average of 0.31 hectare of global arable land through the
consumption of agricultural products [12]. As a consequence, consumption of agricultural products
would have to be reduced or adjusted, resulting in a reduction of about 35% in the area needed to
achieve this orientation value (e.g., by reducing the consumption of animal products, as feed production
contributes significantly to the area footprint).
To what extent a global average value for the use of water make sense is debatable because
the availability and scarcity of water resources are distributed very differently around the globe.
The current use of blue water is still below the orientation value shown in Figure 3, which could lead
to the impression that there would be no serious problem. At the level of catchment, however, there
are regions where blue water is so heavily overused that the load limits of the regional system have
been reached, which raises risks for people and the environment [71,112]. In order to also measure
regional water scarcity, Steffen et al. [106] extended their concept and defined a second control variable
at catchment level as a percentage of the withdrawal of blue water from the average monthly quantity
of water in rivers. Their limit is between 25% and 85%, depending on the size of the flow.
4. Conclusions
The system of indicators for assessing the sustainability of the bioeconomy presented here outlines
the key objectives necessary for a holistic view, and assigns criteria and indicators to them. Although all
three pillars—environment, economy, and society—are, per se, relevant for sustainability assessment,
this working paper focuses on the integrative key objectives and assigned indicators, for which there is
still a need for development. The high relevance of these aspects was also emphasized in the stakeholder
analysis by Zeug et al. [52]. The scale of the consumption of natural resources and GHG emissions
determines the bundle of environmental impacts caused by human activities at the national and foreign
territory level. The footprint indicators (agricultural land, forest, water, material, and climate) are
instrumental in quantifying the resource and climate impact of the production and consumption system,
and to highlighting the share the bioeconomy has.
Agricultural biomass is increasingly being used for material and energy purposes. The associated
competition for land to produce food has triggered a scientific and social discussion about food security,
price developments, and ecological effects, such as changes in land use. It is necessary to monitor the
material and energetic use of agricultural biomass as an essential part of the bioeconomy. An important
criterion for improving sustainability within the bioeconomy is land use change, which goes hand in
hand with the increasing demand for biomass.
The predicted increase in the use of forest biomass for material and energy recovery by the middle
of the century due to rising demand [66] might conflict with the conservation of forest ecosystem
services, to a lesser extent in Germany, but to a significant degree in other world regions supplying
Germany. The increase in raw timber imports to Germany in recent years is documented, for example,
by Weimar [113]. Further research is required to assess the interdependency of the domestic demand
for forest biomass with the development of the energy sector, as it is described in the scenarios of
Buongiorno et al. [66]. These include the consequences of energy and climate policy objectives.
These considerations and exemplary presentations should help to improve the reference basis for
the analysis, modeling, and evaluation of bioeconomy with regard to its sustainability. It is foreseeable
that neither the goals, nor the indicator systems and their evaluation criteria and measures will ever
have reached a final status, since this will change with the development of the issues, with learning and
perspectives. The growing level of knowledge supports the need for continuous further development
of the indicator system and its evaluation criteria.You can also read