Climate Change Perceptions and Attitudes to Smallholder Adaptation in Northwestern Nigerian Drylands - MDPI
←
→
Page content transcription
If your browser does not render page correctly, please read the page content below
$
     £ ¥€
            social sciences
Article
Climate Change Perceptions and Attitudes to
Smallholder Adaptation in Northwestern
Nigerian Drylands
Nugun Patrick Jellason 1,2, * , Richard Baines 1 , John Conway 1 and Chukwuma C. Ogbaga 3
 1    School of Agriculture, Royal Agricultural University, Cirencester, Gloucestershire GL7 6JS, UK;
      richard.baines@rau.ac.uk (R.B.); john.conway@rau.ac.uk (J.C.)
 2    Bio-Resource Development Centre, National Biotechnology Development Agency, Abuja 900001, Nigeria
 3    Department of Biological Sciences, Nile University of Nigeria, Airport Road, Abuja 900001, Nigeria;
      chukwumaogbaga@gmail.com
 *    Correspondence: nugunjellason@gmail.com; Tel.: +44-750-104-0466

 Received: 25 December 2018; Accepted: 21 January 2019; Published: 23 January 2019

 Abstract: As climate change is projected to increase in vulnerable areas of the world, we examined
 farmers’ perceptions of this change and their attitudes to adaptation in two communities (Zango and
 Kofa) in northwestern Nigeria. A total of 220 arable farming households completed a livelihoods
 survey preplanting. The perceptions survey was followed by a survey of 154 households post-harvest
 for the attitudes questions based on the theory of planned behaviour (TPB). In addition to the positive
 responses from the farmers towards climate change perceptions, TPB findings reveal that such
 perceptions could lead to intentions to adapt as determinants of attitude were significant. Subjective
 norm was a significant predictor of adaptation intention in Kofa, but not in Zango. Perceived
 behavioural control, though useful, was not a determinant of climate change adaptation intention.
 Most importantly, principal component analysis (PCA) of climate change perception variables allowed
 us to discriminate smallholder farming households and can be used as a tool for segmentation into
 climate change-perceiving and nonperceiving farming households. Efforts towards improving the
 determinants of behavioural intention for the poorly perceiving group could lead to better decisions
 to adapt to climate change and provide more targeted extension support in the future.

 Keywords: climate change perceptions; adaptation intentions; smallholders; decision-making;
 principal component analysis

1. Introduction
      Climate change is projected to have the greatest impact on agricultural production and food
security in the developing world, where communities are dependent on the environment for their
livelihoods (Neil et al. 2003; Alliance for a Green Revolution in Africa 2014; Dang et al. 2014a). This is
especially true in drylands of Africa, where up to 250 million people will be exposed to water stresses
by 2020 (IPCC 2007).
      Furthermore, variability and change in rainfall patterns affect investment for agricultural productivity
enhancement as well as natural resources conservation (Mortimore 2000; Stringer et al. 2009). In Africa,
higher temperatures and drought conditions are likely to increase, particularly in the Nigerian drylands.
If not urgently addressed, these will impact negatively on the environment and result in a loss of about 11%
of Nigeria’s GDP by 2020 (Federal Ministry of Environment Climate Change Department 2011). Hence,
Northern Nigerian dryland farmers need to adopt suitable adaptation strategies.
      No consensus exists on the temporal implications of adaptation strategies. Short-term strategies
are argued to be enough to cushion the effects of climate change. However, short-term responses could

Soc. Sci. 2019, 8, 31; doi:10.3390/socsci8020031                                 www.mdpi.com/journal/socsci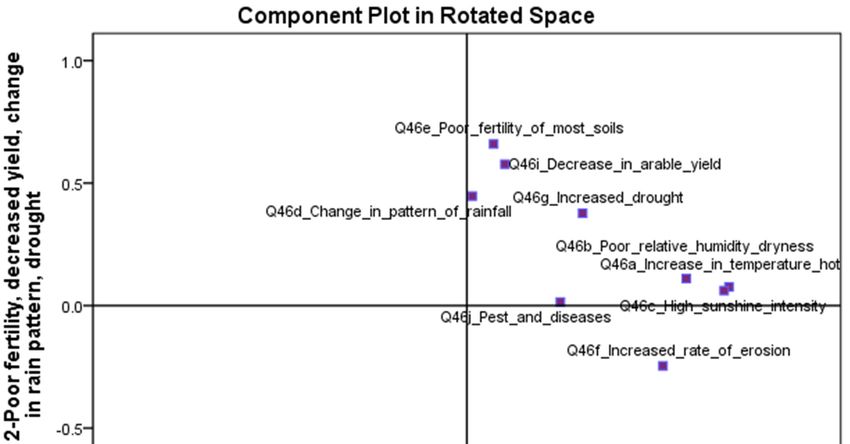
Soc. Sci. 2019, 8, 31                                                                                 2 of 20

lead to prolonged vulnerability to future climate effects (Burton 1997; Smithers and Smit 1997). Given
that dryland smallholders in northwestern Nigeria have survived for long periods, it is reasonable
to assume that they have developed adaptive strategies to weather patterns they have frequently
encountered (Stringer et al. 2009). Although, these are likely to be insufficient amidst new climatic
change events in the future, not least because the smallholders are expected to be subjected to weather
conditions not previously experienced (IPCC 2007).
     Adaptation is either autonomous or planned (Bryant et al. 2000). Autonomous adaptation
displayed involves coping strategies by farmers and other community members in an agricultural
setting. Such strategies include diversification, irrigation, change in planting date, crop and livestock
insurance and using tolerant varieties of crops which are location-specific (Dang et al. 2014b).
In contrast, planned adaptation strategies include government intervention and public policy geared
towards managing climate change impacts, such as investment in infrastructure, subsidies, research,
innovation and tax regimes (Bryant et al. 2000).
     Climate change is considered a significant risk due to uncertainties around crop and livestock
performance (Hardaker et al. 2004). Therefore, risk perception is significant in decision-making because
decisions need to anticipate all possible consequences so as to tackle them holistically (Maye et al. 2012;
Hardaker et al. 2015). Several factors affect adaptation decisions, for example, socioeconomic, technical
and institutional determinants such as the ownership of assets and land (Scoones 2009; Hisali et al. 2011),
access to credit and extension information (Deressa et al. 2009; Hisali et al. 2011; Fosu-Mensah et al. 2012)
and investments in rain-fed agriculture and efficient rainfall utilization (Wani et al. 2009). These factors
are important because certain adaptation actions require physical assets that may need to be acquired or
previously owned.
     Most previous studies ignored perception of risk as a key determinant of adaptation to
environmental shocks and stresses (Bandura 1977; Stehr and Storch 1995; Weber 1997); rather, they rely
on resource considerations alone (Patt and Gwata 2002; Grothmann and Patt 2005; Deressa et al. 2011;
Jones and Boyd 2011). Neglecting the role of perception in the adaptive decisions of those affected by
climate change is likely to be counterproductive because integrating human perceptions to the adaptation
process could address the shortfalls of the socioeconomic, technical and institutional determinants
(Grothmann and Patt 2005). Therefore, before adaptation can take place, climate change must be
perceived to be happening; hence, the role of perception as a precursor to adaptation cannot be
overemphasized (Maddison 2007; Bryan et al. 2009; Mertz et al. 2009; Deressa et al. 2011; Tambo
and Abdoulaye 2013).
     This paper utilized the theory of planned behaviour (TPB) to explore the perception and
adaptation responses in two communities in northwestern Nigerian drylands to determine the
influence of perception on attitude towards adaptation behaviour for future climatic challenges.
In addition to the TPB, the paper applied principal component analysis to differentiate the
contributions of perceptive from nonperceptive farming households so that extension on adaptation
can be appropriately targeted.

2. Theory of Planned Behaviour (TPB)
     The theory of planned behaviour (TPB) (Ajzen 1988, 1991, 2001) has wide application as a conceptual
framework in the study of human action (Ajzen 1988, 1991, 2001). It has been applied successfully in
different fields, such as food consumption and health-related behaviour (Fishbein and Ajzen 2010;
Ajzen 2015; Conner and Sparks 1996). To date, to the best of our knowledge, only a few studies have
applied the theory to climate change adaptation (e.g., Lin 2013; Masud et al. 2016), with almost no
application in the context of Nigerian drylands.
     The role of intention and behavioural control in influencing behaviour has been previously studied
(Ajzen 1991). Three factors make up TPB: behavioural beliefs (attitude towards behaviour), normative
beliefs (subjective norms) and control beliefs (behavioural control). These were applied in this study in
the context of climate change. Ajzen (2002) suggested that behavioural beliefs lead to an unfavourable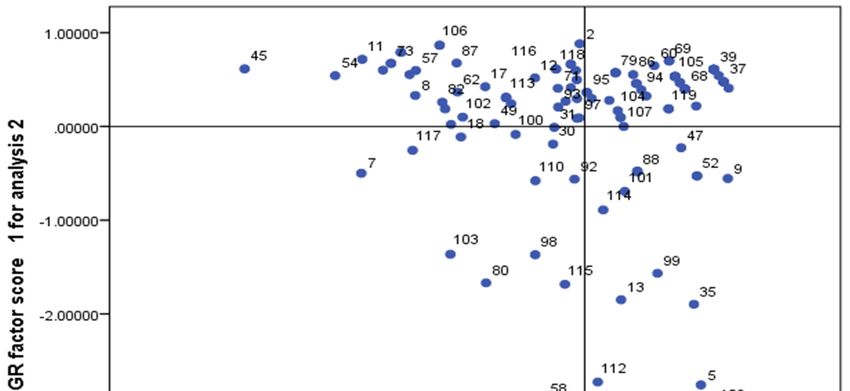
Soc. Sci. 2019, 8, 31 3 of 20
or favourable attitude concerning behaviour. Normative beliefs lead to subjective norms or perceived
socialSoc.
pressure
Sci. 2018, to
7, xaccomplish
FOR PEER REVIEW behaviour. Control beliefs result in perceived behavioural control that is
3 of 21
the perceived difficulty or ease of performing the behaviour (Ajzen 2002). These three factors, when
unfavourable or favourable attitude concerning behaviour. Normative beliefs lead to subjective
combined, give rise to behavioural intention. Perceived behavioural control is linked to the theory of
norms or perceived social pressure to accomplish behaviour. Control beliefs result in perceived
‘self-efficacy’
behavioural (Bandura
control 1977,
that is1982), and likedifficulty
the perceived subjective norm
or ease and attitude,
of performing theself-efficacy is measured
behaviour (Ajzen 2002). by
directly
These probing the capability
three factors, to perform
when combined, give arise
behaviour or indirectly
to behavioural intention.based on beliefs
Perceived aboutcontrol
behavioural the ability
to deal with specific inhibiting or facilitating factors (Ajzen 2002, p. 668).
is linked to the theory of ‘self-efficacy’ (Bandura 1977, 1982), and like subjective norm and attitude,
Critics of TPB
self-efficacy have argued
is measured that it probing
by directly is limited theincapability
its ability
toto determine
perform intention
a behaviour because it
or indirectly does not
based
on beliefs
determine aboutassociation
a certain the ability to deal with
between specific inhibiting
intentions or facilitating
and behaviour factors (Ajzen
to understand 2002, p.can
how attitude 668).
impact
Critics (Conner
goal attainment of TPB have andargued
Armitagethat1998).
it is limited in itsTPB
Similarly, ability to determine
is argued intention because
to be concerned it does
about the salience
not determine
of individuals’ a certain
beliefs, which association
may not between
align with intentions and behaviour
the researcher’s beliefsto(Conner
understand andhow attitude1998).
Armitage
can impact goal attainment (Conner and Armitage 1998). Similarly, TPB is argued to be concerned
Further, Bonnes et al. (2003) assert that TPB is limited by its inability to address the societal predicament;
about the salience of individuals’ beliefs, which may not align with the researcher’s beliefs (Conner
that is, collective outcomes are affected by a person’s behavioural feat (Serenari et al. 2012). Despite
and Armitage 1998). Further, Bonnes et al. (2003) assert that TPB is limited by its inability to address
perceptions
the societal of TPB as being oversimplistic,
predicament; that is, collective theoutcomes
present paper utilized
are affected byitainperson’s
the analysis due to feat
behavioural its wide
application in predicting human behaviour in different fields (Ajzen 1991, 2011).
(Serenari et al. 2012). Despite perceptions of TPB as being oversimplistic, the present paper utilized It is at the perception
stage itthat theanalysis
in the uniquedue factors
to itsthat
wide influence
applicationoneinperson to carry
predicting human outbehaviour
a behaviour of interest
in different and
fields the other
(Ajzen
to act1991,
differently
2011). Itcan is atbethe
learned
perception(Ajzen 1991).
stage that the unique factors that influence one person to carry out
a behaviour of interest and the other to act differently can be learned (Ajzen 1991).
3. Materials and Methods
3. Materials and Methods
3.1. Research Location, Sampling and Data Collection
3.1. Research Location, Sampling and Data Collection
This study was carried out in northwestern Nigeria (Figure 1), recording baseline climate change
Thisand
perceptions study was carried
adaptive out in northwestern
strategies Nigeria
of 220 farming (Figure 1),with
households recording baseline
a specific climate
survey change
built around
perceptions and adaptive strategies of 220 farming households with a specific survey built around
TPB with 154 of the farming households to explore attitudes towards adaptation behaviour to climate
TPB with 154 of the farming households to explore attitudes towards adaptation behaviour to climate
change. TPB is useful in assessing whether many factors affect intended versus actual adoption of
change. TPB is useful in assessing whether many factors affect intended versus actual adoption of
climate change
climate adaptation
change behaviours
adaptation behavioursamong
amongfarmers (Nilesetetal.
farmers (Niles al.2016).
2016).
FigureFigure 1. Map
1. Map of Nigeria
of Nigeria showing
showing thetwo
the twostudy
study communities,
communities, Zango
Zango(Katsina State)
(Katsina andand
State) KofaKofa
(Kano(Kano
State). Zango is situated at latitude 13°03′19.0″
◦ 0 North and longitude 8°29′17.2″
◦ 0 East while Kofa lies on
State). Zango is situated at latitude 13 03 19.0” North and longitude 8 29 17.2” East while Kofa lies on
latitude 9°41′14.6″ North and longitude 7°41′12.4″ East.
latitude 9◦ 410 14.6” North and longitude 7◦ 410 12.4” East.
Two communities, Zango and Kofa, were purposely selected with the aim of studying the
Two communities, Zango and Kofa, were purposely selected with the aim of studying
agricultural practices of areas affected by rainfall shortages (drought) and land degradation. The
the agricultural practices of areas affected by rainfall shortages (drought) and land degradation.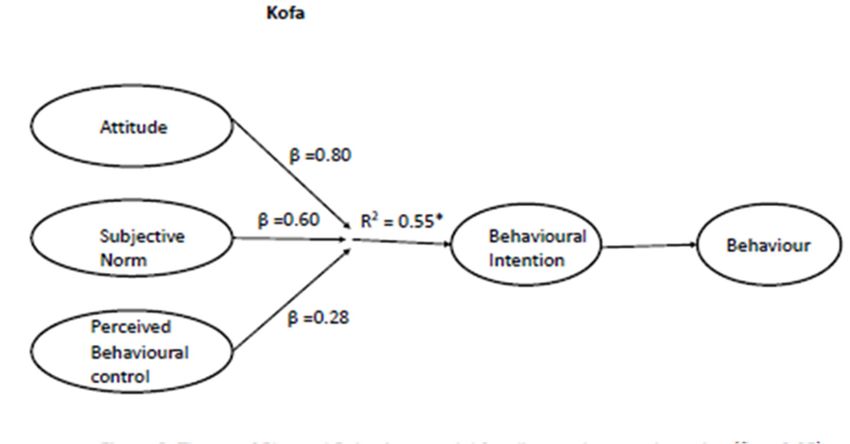
Soc. Sci. 2019, 8, 31                                                                              4 of 20

The communities provided more rationale to study the perceptions and responses of the dryland
smallholders to drought and other environmental challenges, so that improvements in practices can
be made where necessary. Communities without such experiences may not have knowledge of
environmental and climate change, thereby making it difficult to explore these issues in those areas.
As seen in the baseline data, there is indication that Zango is experiencing changes in climatic
variables. Zango is ideal for exploring vulnerability to drought as previous studies have found the
area to be adversely affected by the increasing climate events (Abiodun et al. 2011). Kofa, however,
was chosen to compare practices and results in terms of farming systems and farm characteristics
which are beneficial according to comparative studies (Fisher 2012). Total annual rainfall in Zango is
approximately 591 mm, which supports the production of cereal and legume crops. Cereals farmed
include sorghum (Sorghum bicolor) and pearl millet (Pennisetum glaucum), while legume crops include
cowpea (Vigna unguiculata), soybean (Glycine max) and groundnuts (Arachis hypogaea). Irrigation
agriculture, being a ready source of food and important for managing short-term stresses in drylands,
is not practiced in Zango. Kofa, on the other hand, lies between the semiarid and Sudan Savannah
agroecological zones south of Zango, with an annual rainfall average of 835 mm. Baseline study of the
Kofa community shows that farmers were involved mainly in cereal (maize (Zea mays), sorghum
(Sorghum bicolor) and millet (Pennisetum glaucum)), legume (cowpea (Vigna unguiculata), soybean
(Glycine max) and groundnuts (Arachis hypogaea)) and some vegetables (onions (Allium cepa), tomato
(Solanum lycopersicum) and garlic (Allium sativum)) production. Inhabitants of both Zango and Kofa are
mostly farmers and practice Islamic religion.
      A nonprobability sampling technique was employed based on the willingness of the farming
household’s head to participate in the study. Sampled households were not necessarily representative of
the population at large, but are indicative of the two communities farming under slightly different dry
conditions. An aspect of snowball sampling with the Centre for Dryland Agriculture, Kano, provided links
to the field officers working in the study communities. To ensure no nonresponse bias, characteristics of
respondents (farmers) in the two communities were checked and found to be typical of communities in the
Living Standard Measurement Study (LSMS) (Nigerian Bureau of Statistics et al. 2014).
      A section on livelihood survey with 36 questions gathered data on household demographics:
food security indicators, assets, labour availability, land size, water sources, crop input requirements
and extension support. A further 29 questions covered farmer enterprises; perceptions, causes and
effects of climate and environmental challenges; sources and accessibility of climate information;
the language of communicating climate information and level of satisfaction with information received;
and autonomous adaptation strategies. A second round of questionnaires based on TPB were
developed from the themes emerging after the initial interviews and explored subjective norms,
perceived behavioural control (PBC), and attitudes and behavioural intention for climate change
adaptation. PBC was measured based on the ease or difficulty of carrying out the adaptation practices
as influenced by internal and external controls (Table 1).
      The baseline survey was undertaken between June and July 2015 in the two communities. Staff
were recruited to help with data collection after intensive training on interviewing skills and correct
questionnaire interpretation. The surveys were carried out in all the villages that make up the
communities to ensure an even spread of views. The respondents included the heads of the farming
households, or the spouse or older son/daughter in the absence of the farming household’s head.
To be qualified as a respondent, they must have been involved in farming for at least 5 years under
their parents or on their own. It took between 45 to 60 min to administer a questionnaire; therefore,
each interviewer was expected to interview a maximum of 3 household heads per day to ensure the
quality of responses. The researcher checked the questionnaires for missing sections every day after
data collection, and where data were missing, the person responsible was requested to revisit the
household and complete the missing sections.
      Climate change perception variables were selected based on a review of the literature (Table 2).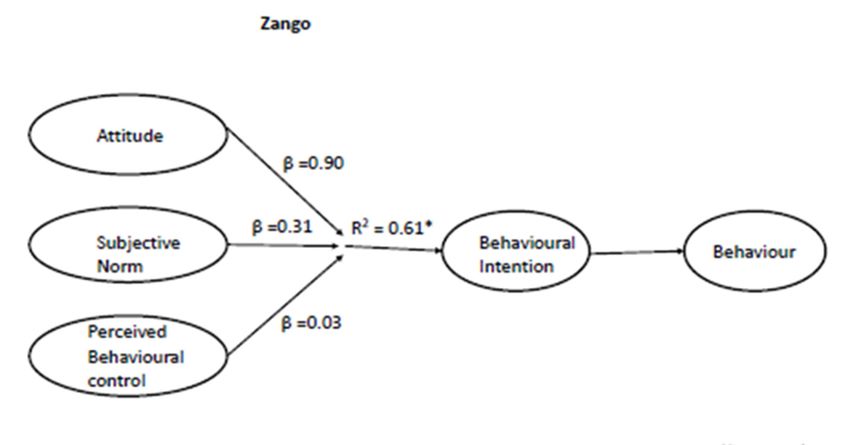
Soc. Sci. 2019, 8, 31                                                                                                                                                         5 of 20

      Table 1. Variables measured for attitude, subjective norm, perceived behavioural control and intention to adapt to climate change according to the theory of
      planned behaviour.

             Items                                                                                                                      Scale *
             Direct attitude
             For me, climate change adaptation is                                                                                       (very irrelevant–very important)
             Climate change adaptation on my farm is                                                                                    (very difficult–very practical)
             Adaptation to climate change for me is                                                                                     (very inconvenient–very convenient)
             Subjective norm
             I feel under pressure from extension agents to integrate adaptation to climate change in my farming                        (strongly disagree–strongly agree)
             People whom I respect (e.g., community head) will disapprove if I do not integrate adaptation in my farming                (strongly disagree–strongly agree)
             It is expected of me to integrate adaptation to climate change in my farming since others are doing it                     (strongly disagree–strongly agree)
             Perceived behavioural control
             If I wanted to, it is easy to integrate adaptation in my farming                                                           (strongly disagree–strongly agree)
             Not having enough resources makes it difficult to adapt to climate change                                                  (strongly disagree–strongly agree)
             Whether I integrate adaptation into my farming is entirely up to me                                                        (strongly disagree–strongly agree)
             Behavioural intention
             I intend to integrate adaptation in my farming                                                                             (very unlikely–very likely)
                                                       * Variables measured against a four-point Likert scale and bipolar adjectives.
Soc. Sci. 2019, 8, 31 6 of 20
Table 2. Climate change perception variables selected for principal component analysis (PCA) based
on literature review.
Perception Variable Reference
Poor fertility of most soils Swe et al. (2015)
Decrease in arable yield Ndamani and Watanabe (2015)
Increased drought Smit et al. (1996); Okonya et al. (2013)
Change in rainfall pattern Smit and Skinner (2002); Okonya et al. (2013)
Poor humidity/dryness Okonya et al. (2013)
Increase in temperature/hot Smit and Skinner (2002); Okonya et al. (2013)
High sunshine intensity Mehar et al. (2016)
Increased rate of erosion Nearing et al. (2004)
Flooding Okonya et al. (2013)
Pests and diseases Bryant et al. (2000); Brklacich et al. (2000); (Swe et al. 2015)
3.2. Statistics
Data were analysed using SPSS version 22 statistical software with descriptive statistics to profile
the baseline conditions before applying principal component analysis (PCA) (Morgan et al. 2007;
Pallant 2013). This was done to determine the extent of similarities among variables and to reduce
the data to a manageable size while retaining much of the characteristics of the original variables
(Joliffe 2002). All statistical criteria for the PCA were satisfied before the test was carried out, namely
scree plot test, Bartlett’s test of sphericity, and correlation and parallel analysis. Multiple regression
was employed to forecast adaptation intention along with Cronbach’s alpha coefficient for measuring
internal consistency and the reliability of the TPB questions. Significance levels were set at 0.05.
4. Results
Two sets of results are presented. The first focuses on the communities’ baseline conditions,
while the second focuses on the application of the theory of planned behaviour (TPB).
4.1. Community Livelihoods and Perceptions of Climate Change
4.1.1. Community Baseline Conditions
Respondents from the two communities comprised different age groups, gender, marital status,
family size and educational qualifications. These are summarized in Table 3.
Other livelihood conditions surveyed included roof types of houses. In Zango, 57.5% of roofs
were zinc, while 93.0% were zinc in Kofa. From the demographics in the two study communities,
women involved in farming mostly farmed plots in backyards, while the men managed plots in more
distant places.
Table 3. Demographic characteristics of Zango and Kofa communities.
Zango (%) Kofa (%)
Demographic Characteristics
n = 120 n = 100
Age (years)
21–40 32.5 55.0
41–60 64.2 37.0
≥61 3.3 8.0
Gender
Male 83.3 87.0
Female 16.7 13.0
Marital status
Single 1.7 6.0
Married 95.0 93.0
Widowed 3.3 1.0Soc. Sci. 2019, 8, x FOR PEER REVIEW 7 of 21
No. of children
Soc. Sci. 2019, 8, 31 7 of 20
0 0.8 9.0
1–5 31.1 48.0
6–10 Table 3. Cont.
44.5 26.0
11–15 21.0
Zango (%) Kofa (%) 10.0
Demographic Characteristics
≥16 2.5n = 120 n = 100 7.0
Highest education
No. of children
No education 0 32.5 0.8 9.0 33.0
1–5 31.1 48.0
Primary 6–10
19.244.5 26.0
35.0
Secondary 11–15 30.021.0 10.0 13.0
Tertiary ≥16 18.3 2.5 7.0 19.0
Highest education
No surveyed
Other livelihood conditions education included roof32.5 33.0 In Zango, 57.5% of roofs
types of houses.
were zinc, while 93.0% were zincPrimary 19.2
in Kofa. From the demographics in35.0
the two study communities,
Secondary 30.0 13.0
women involved in farming mostly farmed plots in backyards,
Tertiary 18.3 while the men managed plots in more
19.0
distant places.
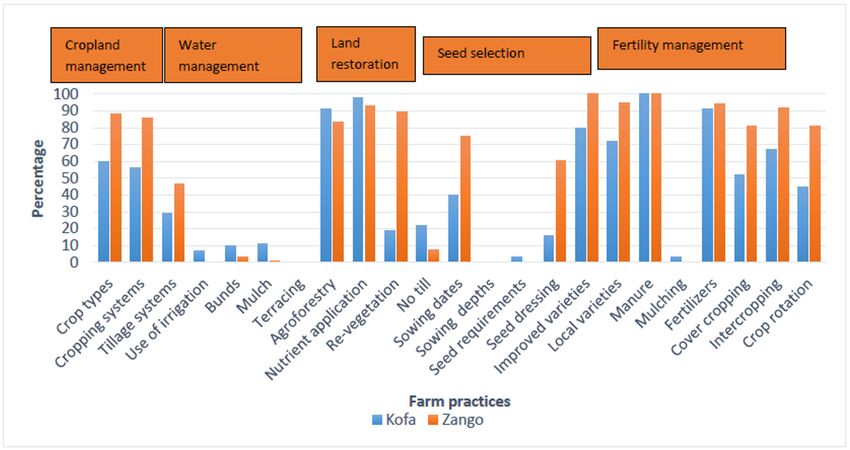
4.1.2. Source of Climate Information
4.1.2. Source of Climate Information
The radio was ranked as the most important source of climate information in the two study
The radio was ranked as the most important source of climate information in the two study
communities. Eighty percent of respondents in Kofa and all respondents in Zango reported the radio
communities. Eighty percent of respondents in Kofa and all respondents in Zango reported the radio
as being the major source of climate information. Research institutes and internet sites were ranked as
as being the major source of climate information. Research institutes and internet sites were ranked
the least important sources of climate information in both communities. Television was recorded as
as the least important sources of climate information in both communities. Television was recorded
an important source of information in Kofa, but not in Zango. Access to climate information through
as an important source of information in Kofa, but not in Zango. Access to climate information
modern means of communication such as television, internet and from research institutes did not
through modern means of communication such as television, internet and from research institutes
indicate any gender sensitivity, but was low overall (Figure 2).
did not indicate any gender sensitivity, but was low overall (Figure 2).
Access to direct extension information is expected from extension services; however, the
Access to direct extension information is expected from extension services; however, the
proportion of males (81% for Zango and 63% for Kofa) who had access to extension was significantly
proportion of males (81% for Zango and 63% for Kofa) who had access to extension was significantly
higher than that of females (15% for Zango and 4% for Kofa) in the two communities (Chi-square test
higher than that of females (15% for 2Zango and 4% for Kofa) in the two communities (Chi-square test
(with Yates continuity correction); χ (1, n = 220) = 5.75, p = 0.017, phi = −0.18).
(with Yates continuity correction); χ2 (1, n = 220) = 5.75, p = 0.017, phi = −0.18).
Radio
Government
Extension
Family & friends
NGO
Sources
Personal observation
Research institute
Internet
Television
Newspaper
Other
0 20 40 60 80 100
Percentage
Kofa Zango
Figure
Figure 2.
2. Sources
Sources of
of climate
climate information
information in
in Zango
Zango (n
(n == 120)
120) and
and Kofa
Kofa (n
(n == 100)
100) in
in terms
terms of
of the
the most
most
utilized sources. NGO—Non-Governmental Organisation.
utilized sources. NGO—Non-Governmental Organisation.Soc. Sci. 2019, 8, 31 8 of 20
4.1.3. Perceptions on Environment and Climate Change Awareness
Principal component analysis (PCA) was used to explore perceptions of climate and environmental
change awareness. Extraction of factors and oblique factor rotation was performed using the
Oblimin method (Pallant 2013). Ten items on the environmental change perception scales (Table 2)
were subjected to PCA. Data suitability for factor analysis was verified before conducting the
PCA. The correlation matrix showed that many coefficients were 0.3 and above (Appendix A).
The Kaiser–Meyer–Olkin value was 0.61, which is slightly above the recommended value of 0.6,
while Bartlett’s test of sphericity attained statistical significance (p < 0.05); random figures from parallel
analysis showed that figures for only the first two cases were less than the eigenvalues for the extracted
Soc. Sci. 2019, 8, x FOR PEER REVIEW 8 of 21
factors, which makes PCA appropriate (Pallant 2013).
The4.1.3.
results of pattern
Perceptions matrix further
on Environment supported
and Climate Change this decision, which showed two components
Awareness
with 3 items each having 0.3 or more loading on each component. The top two components explained
Principal component analysis (PCA) was used to explore perceptions of climate and
40% of the total variance, with component 1 contributing 24.1% and component 2 contributing 15.9%.
environmental change awareness. Extraction of factors and oblique factor rotation was performed
The various
usingvariables
the Oblimin (Figure
method3)(Pallant
were loaded
2013). Tenonitems
eachoncomponent. Oblimin
the environmental rotation
change wasscales
perception carried out
(Pallant (Table
2013),2)revealing the presence
were subjected to PCA. Dataof asuitability
simple structure (Thurstone
for factor analysis 1947), with
was verified beforeboth components
conducting
showingthe PCA.strong
some The correlation
loadings.matrix showed that many coefficients were 0.3 and above (Appendix A).
TheThe Kaiser–Meyer–Olkin
perception factors werevalue was 0.61, which
illustrated (Figureis slightly above
4) against the recommended
their percentage of value of 0.6, while
variance contributed.
Bartlett’s test of sphericity attained statistical significance (p < 0.05); random figures from parallel
In addition, correlations between the environmental change awareness indices and loadings of the
analysis showed that figures for only the first two cases were less than the eigenvalues for the
environmental
extractedchange
factors,parameters
which makesare PCApresented
appropriate(Appendix A) along with pattern and structure matrix
(Pallant 2013).
loadings on The the results
two components, together
of pattern matrix furtherwith their communalities
supported (Appendix
this decision, which showed two B). components
Thewith
factor scores
3 items eachofhaving
the households from the
0.3 or more loading on two
each communities
component. Thewere analysed
top two together
components but plotted
explained
40%on
separately of scatter
the total plots
variance, with component
(Figures 5 and 6), 1representing
contributing 24.1% and component
the scores of each 2household
contributingon15.9%.
each of the
The various variables (Figure 3) were loaded on each component. Oblimin rotation
perception variables; this is presented in order to visualize and assess the perceptions of environmental was carried out
(Pallant 2013), revealing the presence of a simple structure (Thurstone 1947), with both components
change awareness in the two communities and their loadings on the two components.
showing some strong loadings.
Figure Figure 3. Component
3. Component plotplot in rotated
in rotated spaceof
space of perception
perception variables
variablesfor for
bothboth
communities.
communities.
The perception factors were illustrated (Figure 4) against their percentage of variance
contributed. In addition, correlations between the environmental change awareness indices and
loadings of the environmental change parameters are presented (Appendix A) along with pattern
and structure matrix loadings on the two components, together with their communalities (Appendix
B).Soc. Sci. 2019, 8, x FOR PEER REVIEW 9 of 21
Temperature
25
Soc. Sci. 2019, 8, 31 Pests & diseases 20 Dryness 9 of 20
Soc. Sci. 2019, 8, x FOR PEER REVIEW 9 of 21
15
10
Temperature
Decreased yield Sun intensity
255
Pests & diseases 200 Dryness
15
Flooding 10 Change in rainfall
Decreased yield Sun intensity
5
0
Increased drought Poor soils
Flooding Change in rainfall
Increased erosion
Figure 4. Web diagram of perception variables and percentage strength of variance from a principal
component analysis (PCA).drought
Increased The blue colour represents variance which decreases in clockwise
Poor soils
direction.
Increased erosion
The factor scores of the households from the two communities were analysed together but
plotted separately
Figure on scatter
4. Web diagram plots (Figures
of perception 5 and
variables and 6), representing
percentage the
strength of scores
varianceoffrom
eacha principal
household on
Figure 4. Web diagram of perception variables and percentage strength of variance from a principal
eachcomponent
of the perception
component analysisvariables;
(PCA). The
analysis (PCA). thisblue
The blue is presented in variance
ordervariance
colour represents
colour represents towhich
visualize
whichand assess
decreases
decreases the perceptions
in clockwise
in clockwise direction. of
direction. change awareness in the two communities and their loadings on the two components.
environmental
The factor scores of the households from the two communities were analysed together but
plotted separately on scatter plots (Figures 5 and 6), representing the scores of each household on
each of the perception variables; this is presented in order to visualize and assess the perceptions of
environmental change awareness in the two communities and their loadings on the two components.
Figure 5. Scatter
Figure Scatterplot
plotofofregression (REGR)
regression factor
(REGR) scores
factor of households
scores in Zango
of households fromfrom
in Zango the two
the PCA
two
factors.
PCA factors.
Figure 5. Scatter plot of regression (REGR) factor scores of households in Zango from the two PCA
factors.Soc. Sci. 2019, 8, 31 10 of 20
Soc. Sci. 2019, 8, x FOR PEER REVIEW 10 of 21
Figure6.6. Scatter
Figure Scatter plot
plotof
ofregression
regressionfactor
factorscore
scoreof
ofhouseholds
householdsin
inKofa
Kofafrom
fromthe
thetwo
twoPCA
PCAfactors.
factors.
4.1.4.
4.1.4.Gender
GenderDifference
Difference
Mann–Whitney
Mann–Whitney U U tests
tests showed
showed significant
significant difference
difference between
between the
thegenders
genders in
interms
termsof ofclimate
climate
change
changeperception,
perception,where
wheremalemalerespondents
respondents were
weremore
moreinformed
informed about change
about in climate
change in climatecompared
comparedto
the female
to the respondents.
female respondents. This
Thiswas
wasarticulated
articulatedininZango
Zango asasthree
threevariables:
variables:increased
increasedrate
rateof
oferosion
erosion
(U 235.0,ppSoc. Sci. 2019, 8, 31 11 of 20
Soc. Sci. 2019, 8, x FOR PEER REVIEW 11 of 21
Figure
Figure 7. Current
7. Current farmfarm practices
practices employed
employed in Zango
in Zango (n =(n120)
= 120)
andand Kofa
Kofa (n =(n100)
= 100) based
based on on a baseline
a baseline study.
study.
4.2. Climate Change and the Theory of Planned Behaviour
4.2. Climate Change and the Theory of Planned Behaviour
4.2.1. Variability of Determinants across Climate Change Adaptation Behaviour
4.2.1.
TheVariability of Determinants
descriptive across
statistics of the Climate
theory Change
of planned Adaptation
behaviour Behaviour
model of climate change adaptation
practices
Theare listed in statistics
descriptive Table 4. of the theory of planned behaviour model of climate change adaptation
practices are listed in Table 4.
Table 4. Descriptive statistics of TPB components for climate change adaptation behaviour (Zango—n = 86;
Kofa—n
Table 4.=Descriptive
68). statistics of TPB components for climate change adaptation behaviour (Zango—
n = 86; Kofa—n = 68).
Mean SD Cronbach’s Alpha
TPB * Variables Item’s Composition
Zango MeanKofa Zango SD Kofa ZangoCronbach’s
Kofa
Item’s
TPB * Variables Alpha
Attitudes Mean Composition
of 3 items 7.91 7.51 2.04 2.26 0.80 0.81
Zango Kofa Zango Kofa Zango Kofa
Subjective norms Mean of 3 items 7.37 7.06 2.00 2.27 0.47 0.57
Attitudes Mean of 3 items 7.91 7.51 2.04 2.26 0.80 0.81
Perceived
Subjective norms MeanMean
of 3 items
of 3 items 5.93 7.37 6.217.06 1.492.00 1.982.27 0.340.47 0.43
0.57
behavioural control
Perceived behavioural
Behavioural intention Mean of 3 items 2.76 5.93 2.876.21 1.071.49 1.011.98 0.34 0.43
control
TPB—theory of planned behaviour; SD—standard deviation. * The attitudes, subjective norms, perceived
Behavioural
behavioural intention
control and intention measures were rated on 2.76 2.87
Likert and bipolar 1.07 1.01
adjectives scales from one to four.
Higher figures indicate
TPB—theory more positive
of planned responses.
behaviour; SD—standard deviation. * The attitudes, subjective norms,
perceived behavioural control and intention measures were rated on Likert and bipolar adjectives
4.2.2. Multiple
scales fromRegression
one to four.Analysis of Climate
Higher figures indicateChange Adaptation
more positive Intention
responses.
A multiple linear regression was employed to assess the TPB model for climate change adaptation
4.2.2. Multiple Regression Analysis of Climate Change Adaptation Intention
behaviour to predict the main determinant of climate change adaptation from attitude, subjective
normsAandmultiple linear
perceived regression
behavioural was employed
control, and also to totestassess
whether theclimate
TPB model
changefor climate predicts
perception change
adaptation behaviour.
adaptation behaviour toThe predict the main
reliability determinant
of the of climate
TPB questions was change
verifiedadaptation from attitude,
using Cronbach’s alpha
subjective norms and perceived behavioural
coefficient. Significance level was set at 0.05. control, and also to test whether climate change
perception predicts
The intention adaptation behaviour.
of households to adapt in The reliability
the two of the was
communities TPB predicted
questionsfrom
was direct
verified using
attitudes,
Cronbach’s
subjective alphaand
norms coefficient. Significance
perceived behavioural level was set
control. Theat regression
0.05. model explained approximately
The intention of households to adapt in the two communities
61% and 55% of the variance of the intention to adapt in Zango and Kofa, was predicted from direct
respectively attitudes,
(Table 5).
subjective norms and perceived behavioural control. The regression model explained
When analysing more specifically, one predictor (attitude towards behaviour) contributed approximately
61% and 55%
significantly of the variance
towards of the of
the prediction intention to adapt
adaptation in Zango
intention and Kofa,
to climate changerespectively
in the two(Table 5).
communitiesSoc. Sci. 2019, 8, x FOR PEER REVIEW 12 of 21
Soc. Sci. 2019, 8, 31 12 of 20
Soc. Sci. 2019, 8, x FOR PEER REVIEW 12 of 21
Table 5. Regression model for Zango and Kofa communities for climate change adaptation intention.
Table 5. Regression model for Zango and Kofa communities for climate change adaptation intention.
(0.9Community
and 0.8 for ZangoR2 andAdjusted R2 MS Residual
Kofa, respectively), * F (Significantly
while subjective Different from
norm also contributed Zero) to
significantly
Zango
adaptation
Community R 0.65
intention in
2 Kofa 0.61
(0.6), but not in 0.452
Zango (Figures 8 and 9). (3, 82) = 40.73
Adjusted R MS Residual * F (Significantly Different from Zero)
2
Kofa
Zango 0.61
0.65 0.55
0.61 0.452
0.452 (3,
(3,64)
82)= =29.38
40.73
Table 5. Regression
Kofa 0.61model for Zango
0.55 * pand KofaMS-Mean
< 0.05. communities
0.452 for climate change
Square. (3, 64)adaptation
= 29.38 intention.
Community R2 * p2 < 0.05.
Adjusted R MSMS-Mean
Residual Square.
* F (Significantly Different from Zero)
When analysing more specifically, one predictor (attitude towards behaviour) contributed
Zango
significantly 0.65 0.61 0.452 (3, 82) =the
40.73
When towards
analysingthemore
prediction of adaptation
specifically, intention(attitude
one predictor to climatetowards
change in two communities
behaviour) contributed
Kofa 0.61 0.55 0.452 (3, 64) = 29.38
(0.9 and 0.8 for Zango and Kofa, respectively), while subjective norm also contributed significantly
significantly towards the prediction of adaptation intention to climate change in the two communities
* p < 0.05. MS-Mean Square.
to(0.9
adaptation intention
and 0.8 for Zangoin Kofa
and (0.6),
Kofa, but not in Zango
respectively), while(Figures 8 and
subjective 9). also contributed significantly
norm
to adaptation intention in Kofa (0.6), but not in Zango (Figures 8 and 9).
Figure
Figure8.8. Theory
Theoryofofplanned
plannedbehaviour
behaviourmodel
modelfor
forclimate
climatechange
changeadaptation
adaptationdeterminants
determinantsfor
forthe
the
Zango
Figurecommunity
Zango 8. Theory (*
community (*ppplanned
ofSoc. Sci. 2019, 8, 31 13 of 20
up-to-date information, early warnings and new drylands technology to help in their decision-making
for adaptation.
In agrarian economies dependent on natural resources, roles, responsibilities and assets are often
differentiated by gender. The farming household heads, who were mostly men or widows, controlled
land, meaning that those women who controlled both nearby and distant areas of land were from
female-headed households. The dominance of male respondents in the practice of agriculture in the
study areas is likely due to religious barriers that limit female participation in northern Nigeria and
a limited number of female extension agents that will interface with the women (De Schutter 2013).
The Zango community has more access to extension than that in Kofa. Although gender can determine
the coping strategies adopted under a climate change scenario (Mehar et al. 2016), female-headed
households were too few in this study to accurately determine this phenomenon.
Addressing environmental challenges of farming in the drylands of northwestern Nigeria will
require an understanding of current practices of farming households. Despite not being exhaustive,
current adaptation practices uptake in the two study communities shows some good ongoing practices.
We noted that adaptation practices important for dryland resilience were visibly absent in both
communities (Figure 7). Hence, updating farming households’ knowledge and improving all the
three determinants of adaptation behaviour would be a valuable part of future extension. The results
from the TPB survey suggest that attitudes towards behaviour and subjective norms were the most
important determinants of intention to adapt to climate change in Kofa, while only attitude was
important in Zango. Thus, households were more likely to integrate adaptation into their farming
practices when they perceive climate change to be happening.
The significance of perception has been demonstrated in other climate change adaptation studies
(e.g., Weber 1997; Grothmann and Patt 2005). Subjective norms (Masud et al. 2016) and perceived
behavioural control (Lin 2013; Masud et al. 2016) were argued to be the significant determinants
of adaptation to climate change in other studies. Although the subjective norms and perceived
behavioural control were skewed positively in this study (Table 4), only the subjective norms aspect
was significant in determining intention in Kofa, while both factors were not considered significant
determinants of climate change adaptation in Zango. Findings also suggest that for climate change
adaptation behaviour, intention may not be considered completely within households’ attitudes alone
and that a lack of available and up-to-date extension information could contribute to poor awareness,
which in turn could limit adaptation to climate change. Hence, it could be argued that more emphasis
on the modern means of information dissemination, such as information communication technology
(ICT), internet, and the print and electronic media, which was found to be poorly utilized in this study,
could improve adaptation intention and subsequently behaviour.
This paper tested the usefulness of the TPB in prompting climate change adaptation intention
against the backdrop of climate change perception by Zango and Kofa smallholders. As anticipated, the
TPB model accounted for a substantial variance in the association amongst subjective norms, attitude
and perceived behavioural control and intention. The mean responses for all the variables were
positively scaled. This suggests that most farming households have positive attitudes and intentions
and received social pressures to adapt to environmental challenges. Cronbach’s alpha coefficients
showed the level of internal reliability in the responses to questions. An alpha coefficient greater than
0.7 was considered suitable (DeVellis 2012). Only attitudes towards behaviour had a Cronbach’s alpha
coefficient >0.7 in the two communities, which suggests that the households responded and ranked
the questions related to attitude consistently.
The level of trust in one’s effectiveness will affect the intention to cope with a given circumstance.
While people tend to avoid or fear unfavourable events that they perceive to exceed their adaptive
capacities, they often engage and have confidence in activities they feel competent about handling,
even if they are potentially threatening (Bandura 1977). High perception of climate change risks
could lead to interest in adaptation or mitigation, as an understanding of the benefits of such action is
necessary for a behavioural change (Burch and Robinson 2007). This is exemplified in the findings ofSoc. Sci. 2019, 8, 31 14 of 20
this study, as the respondents considered climate change perception as an important driver of adaptive
behaviour in the two communities. Similarly, intentions are to a reasonable extent expected to result in
the performance of a behaviour, as Ajzen (2015) asserted that a person is likely to have an intention
to carry out a specific behaviour if an intention to perform the behaviour exists. This aligns with
results from this study, which show positive values for intention to carry out the adaptation behaviour.
However, available evidence across a range of disciplines show that mere intention to act does not
always translate into action (Niles et al. 2016). In the same vein, other studies for sub-Saharan Africa
(e.g., Bryan et al. 2009) found that though respondents perceived climate change to be happening,
perception did not lead to adaptation. This was argued to be due to certain barriers such as lack of
access to credit and land. Respondents in the Zango community, being the drier community, perceived
higher sunlight intensity to be increasing, while Kofa, which experiences relatively more rainfall,
perceived rainfall to be decreasing. Previous climate change perception studies for the Nigerian
Savanna (Tambo and Abdoulaye 2013) show similar trends, where the perception of rainfall and
temperature differed according to agroecological zones (AEZ). It is noteworthy that the average annual
rainfall in Africa as a continent is 655 mm (World Bank 2019). Therefore, the rainfall average in Kofa is
180 mm higher than the average for Africa, while in Zango, it is 64 mm below the average for Africa
(see Section 3.1).
PCA showed four components with eigenvalues more than 1, which explained 24.1%, 15.9%,
12.8% and 11.7% of the variance, respectively. The scree plot showed a significant break after the
fourth component, and using the Catell (1966) criteria scree test, two components were retained for
further analysis. The result suggests that component 1 comprised variables that portray temperature
and heat-related signs of the environment changing, while component 2 showed variables related to
changes in rainfall (Figure 3); these informed the choice of sustainable practices for training as part of
the research intervention. These practices included reduced tillage, cover cropping (mulching) and
crop rotations.
While previous studies have suggested that perception determines intention to adapt to climate
change (Burch and Robinson 2007; Dang et al. 2014b), this study has further explored how PCA
can segment perceiving from nonperceiving households. Results from the scatter plots show outlier
households away from the groupings, such as respondents ID 3, ID 4, ID 5, ID 32, ID 58, ID 109, and ID
112 for Zango (Figure 4) and ID 77, ID 81, ID 92 and ID 98 for Kofa (Figure 6). This suggests that
such analysis can identify nonperceiving households who have been left behind in the perception
of environmental change and adoption of good farming practices, as indicated by few assets and
livestock, few crops, small land sizes and lack of access to extension for most of these groups. Similarly,
households represented at the forefront of the groupings (top of Figures 5 and 6) are demonstrating
that they are sensitized to climate change and are adapting more successfully, as indicated by their
higher assets (ID 116, ID 117, ID 113, ID 106, ID 102, ID 54, and ID 11 and ID 100, ID 97, ID 96, ID 68,
ID 43 and ID 39 for Zango and Kofa, respectively); these households may contain perceptive lead
farmers for improved farmer-to-farmer extension or community self-help. However, in stating these
observations, this paper did not find these characteristics to be exclusive to these groups and the
available data did not sufficiently validate these findings. In addition, our further probing of the
available data did not show any unique features that could describe the outlier group, which may
be serendipitous.
Perceived behavioural control is achieved when there is a complete belief that the required resources
and privileges to carry out an action is possessed (Ajzen 1985). This implies that the more the person
perceives control over a certain behaviour, the greater the motivation they have to perform that action
(Ajzen 1985; Madden et al. 1992). Poor perceived behavioural control recorded in this study may signal
limited motivation to carry out the adaptation behaviour. Contrarily, when intentions are held constant, it is
more likely to perform a behaviour as PBC increases (Conner and Armitage 1998). It is highly likely that
intention, when strong, indicates willingness to make effort to perform a behaviour; that is, the stronger
the intention, the more likely it is to perform the behaviour (Ajzen 1991; Dang et al. 2014b). Hence, it couldSoc. Sci. 2019, 8, 31 15 of 20
be argued that if smallholders believe they have the capacity to carry out adaptation behaviour, they will
likely carry it out.
It can reasonably be suggested that climate change perception, the presence of PBC and attitude
towards behaviour can lead to adaptation behaviours. However, Conner and Armitage (1998) argue
that the link between behaviour and PBC is not a straightforward one, as there is a likelihood to engage
in desirable behaviours that one has control over, while one is unable to carry out a behaviour that
one has no control over. Contrary to findings from previous psychological studies that suggested
that attitude does not influence people’s behaviour (Wicker 1969, cited in Terry et al. 1999), this study
found attitude to be a key determinant of behaviour.
6. Conclusions
This paper demonstrated that while socioeconomic factors (capital and assets such as land)
are important determinants of climate change adaptation, other key determinants exist, such as
perception, which can cover the shortcomings of capital and assets. Evidence from farmer responses
and field observations indicate that the climatic variables have been fluctuating, suggesting signs of the
climate changing. However, a review of current practices embarked upon by the farming households
indicate some ongoing good adaptation practices, although some key dryland adaptation actions were
scantily practiced. PCA has allowed us to segment climate change-perceiving from -nonperceiving
farming households. However, additional research is required to verify this. The theory of planned
behaviour has also predicted the role of perception as a determinant of adaptation to climate change,
although intention alone is insufficient to influence a behaviour in the absence of the ability to execute
that intention. Finding means of improving the three behavioural determinants would be useful.
The multiple regression model explained (for Zango = 0.61; for Kofa = 0.55) the level of significance of
the variance in climate change adaptation intention (p < 0.05). Although mean values for subjective
norms and perceived behavioural control were positively skewed, the subjective norm was a significant
predictor of intention in Kofa, but not Zango, while perceived behavioural control was not a significant
predictor of intention to adapt to climate change in either of these communities. The findings from
this paper have implications for both policy and practice. The findings will support policymakers to
design programmes and extension strategies that will influence the decision to adapt, thus reducing
the impact of climate change and degradation to farming household livelihoods. For practitioners,
extension should focus on improving farmer knowledge of ongoing climatic changes and on the need
to adopt sustainable adaptation practices suitable for managing dryland conditions.
Author Contributions: Conceptualization, N.P.J.; methodology, N.P.J., R.B. and J.C.; software, N.P.J., R.B. and J.C.;
validation, N.P.J., R.B. and J.C.; formal analysis, N.P.J.; investigation, N.P.J.; resources, N.P.J.; data curation, N.P.J.;
writing—original draft preparation, N.P.J.; writing—review and editing, N.P.J., R.B., J.C. and C.C.O.; visualization,
N.P.J., R.B. and J.C.; supervision, R.B. and J.C.; project administration, N.P.J. and C.C.O.
Funding: This research received no external funding.
Acknowledgments: This paper is part of a Ph.D. research project at the Royal Agricultural University, Cirencester.
Special thanks to the National Biotechnology Development Agency, Abuja-Nigeria, for granting study leave to
the corresponding author. Thanks to Sebastine Ugbaje for producing the map. Help provided by the Centre for
Drylands Agriculture and some of its staff, Sanusi G. Mohammed, and others in establishing initial contact with
the study communities is much appreciated. We also appreciate the research participants for their patience to
respond to our questions. Last but not least, we thank the reviewers for their comments and suggestions. We are
solely responsible for all errors and misrepresentations.
Conflicts of Interest: The authors declare no conflict of interest.Soc. Sci. 2019, 8, 31 16 of 20
Appendix A
Table A1. Correlations matrix between perception variables.
Increased Poor High Change in Poor Fertility Increased Increased Decreased Pests and
Flooding
Temperature/Hot Humidity/Dryness Sunshine Rainfall Pattern of Soils Erosion Drought Arable Yield Diseases
Increased temperature/Hot 1.000 0.483 0.630 0.150 0.057 0.212 0.123 0.085 0.150 0.125
Poor humidity/Dryness 1.000 0.399 0.034 −0.002 0.162 0.274 −0.004 0.127 0.047
High sunshine 1.000 0.108 0.068 0.202 0.198 0.084 0.091 0.157
Change in rainfall pattern 1.000 0.128 −0.078 0.048 −0.155 0.094 −0.009
Poor fertility of soils 1.000 0.197 0.322 −0.216 0.301 0.087
Increased erosion 1.000 0.249 0.363 −0.043 0.143
Increased drought 1.000 −0.059 0.112 −0.078
Flooding 1.000 −0.126 0.096
Decreased arable yield 1.000 0.213
Pests and diseases 1.000
Appendix B
Table A2. Pattern and structure matrix for PCA with Oblimin rotation of a two-factor solution of perception elements.
Item Pattern Coefficients Structure Coefficients Communalities
Component 1 Component 2 Component 1 Component 2
Increased temperature 0.779 0.076 0.788 0.165 0.626
High sunshine intensity 0.765 0.061 0.772 0.149 0.599
Poor humidity/dryness 0.652 0.111 0.665 0.185 0.454
Increased erosion 0.583 −0.246 0.555 −0.179 0.367
Pest and diseases 0.278 0.015 0.280 0.046 0.078
Flooding 0.388 −0.693 0.309 −0.648 0.569
Poor fertility of soils 0.080 0.659 0.115 0.669 0.453
Decreased yields 0.113 0.577 0.179 0.590 0.361
Change in rainfall pattern 0.016 0.447 0.067 0.449 0.202
Increased drought 0.344 0.377 0.387 0.416 0.290Soc. Sci. 2019, 8, 31 17 of 20
References
Abiodun, Babatunde, Ayobami Salami, and Mark Tadross. 2011. Climate Change Scenarios for Nigeria: Understanding
Biophysical Impacts. Climate Systems Analysis Group, Cape Town, for Building Nigeria’s Response to Climate
Change Project. Ibadan: Nigerian Environmental Study/Action Team (NEST).
Alliance for a Green Revolution in Africa. 2014. Africa Agriculture Status Report: Climate Change and Smallholder
Agriculture in Sub-Saharan Africa. Nairobi: Alliance for a Green Revolution in Africa.
Ajzen, Icek. 1985. From Intentions to Actions: A Theory of Planned Behavior. In Action Control: From Cognition to
Behavior. Edited by Kuhl Julius and Beckmann Jürgen. Berlin/Heidelberg: Springer, pp. 11–39.
Ajzen, Icek. 1988. Attitudes, Personality, and Behavior. Chicago: Dorsey.
Ajzen, Icek. 1991. The theory of planned behavior. Organizational Behavior and Human Decision Processes 50:
179–211. [CrossRef]
Ajzen, Icek. 2001. Nature and operation of attitudes. Annual Review of Psychology 52: 27–58. [CrossRef] [PubMed]
Ajzen, Icek. 2002. Perceived behavioral control, self-efficacy, locus of control, and the theory of planned behavior.
Journal of Applied Social Psychology 32: 665–83. [CrossRef]
Ajzen, Icek. 2011. The theory of planned behaviour: Reactions and reflections. Psychology & Health 26: 1113–27.
Ajzen, Icek. 2015. Consumer attitudes and behavior: The theory of planned behavior applied to food consumption
decisions. Rivista di Economia Agraria. Anno 70: 121–38.
Akande, Tunji, and Femi Ogundele. 2009. African food crisis: The Nigerian case study. In Afrint II Micro Studies.
Ibadan: Nigerian Institute of Social and Economic Research (NISER).
Bandura, Albert. 1977. Self-efficacy: Toward a unifying theory of behavioural change. Psychological Review 84:
191–215. [CrossRef] [PubMed]
Bandura, Albert. 1982. Self-Efficacy Mechanism in Human Agency. American Psychologist, 122–47. [CrossRef]
Bonnes, Mirilia, Terence Lee, and Marino Bonaiuto, eds. 2003. Psychological Theories for Environmental Issues.
Burlington: Ashgate Publishing Company.
Brklacich, Michael, Christopher Bryant, Ben Veenhof, and Andrew Beauchesne. 2000. Agricultural adaptation to
climatic change: A comparative assessment of two types of farming in central Canada. In Agricultural and
Environmental Sustainability in the New Countryside. Edited by Hugh Millward, Kenneth Beesley, Brian Ilbery
and Lisa Harrington. Winnipeg: Hignell Printing Limited, pp. 40–51.
Bryan, Elizabeth, Temesgen T. Deressa, Glwadys A. Gbetibouo, and Claudia Ringler. 2009. Adaptation to climate
change in Ethiopia and South Africa: Options and constraints. Environmental Science & Policy 12: 413–26.
Bryant, Christopher, Barry Smit, Michael Brklacich, Thomas Johnston, John Smithers, Quentin Chiotti, and
Bhawan Singh. 2000. Adaptation in Canadian agriculture to climatic variability and change. Climate Change
45: 181–201. [CrossRef]
Burch, Sarah, and John Robinson. 2007. A framework for explaining the links between capacity and action in
response to global climate change. Climate Policy 7: 304–16. [CrossRef]
Burton, Ian. 1997. Vulnerability and adaptive response in the context of climate and climate change. Climatic
Change 36: 185–96. [CrossRef]
Catell, Raymond B. 1966. The scree test for number of factors. Multivariate Behavioral Research 1: 245–76. [CrossRef]
[PubMed]
Conner, Mark, and Christopher Armitage. 1998. Extending the theory of planned behavior: A review and avenues
for further research. Journal of Applied Social Psychology 28: 1429–64. [CrossRef]
Conner, Mark, and Paul Sparks. 1996. The theory of planned behaviour and health behaviours. In Predicting
Health Behaviour: Research and Practice with Social Cognition Models. Edited by Mark Conner and Paul Norman.
Buckingham: Open University Press, pp. 121–62.
Dang, Hao, Elton Li, Johan Bruwer, and Ian Nuberg. 2014a. Farmers’ perceptions of climate variability and
barriers to adaptation: Lessons learned from an exploratory study in Vietnam. Mitigation and Adaptation
Strategies for Global Change 19: 531–48.
Dang, Hao, Elton Li, Ian Nuberg, and Johan Bruwer. 2014b. Understanding farmers’ adaptation intention to
climate change: A structural equation modelling study in the Mekong Delta, Vietnam. Environmental Science
& Policy 41: 11–22.You can also read