K-12 Finance A Citizen's Guide to Washington State - Washington State Legislature
←
→
Page content transcription
If your browser does not render page correctly, please read the page content below

A Citizen’s Guide to
 Washington State

   K-12
 Finance

2018
Table of Contents

Introduction ...................................................................................... 1
How does recent basic-education bills affect K-12 funding? ........... 2
How many students attend K-12 schools in the state? ...................... 3
How are public schools in Washington organized? .......................... 3
What does the Washington State Constitution provide regarding
K-12 public schools? ........................................................................ 4
How has this constitutional provision been interpreted in the state
courts?............................................................................................... 4
What is the McCleary decision? ....................................................... 5
How has the State implemented the Program of Basic Education? .. 7
Are there restrictions on local school levies? ................................. 15
What is Local Effort Assistance and Levy Equalization?............... 16
How much is spent on K-12 public schools? .................................. 18
How much has changed since 2005? .............................................. 18
What other sources are used by school districts?............................ 20
What are school district expenditures by activity? ......................... 21
What are school district expenditures by student by program? ...... 23
How has total per-student spending changed since 2000?.............. 25
How has state per-student funding changed since 2000? ............... 26
How is the salary level for teachers determined? ........................... 26
What is the average salary level for teachers? ................................ 29
How is the salary level of administrators and classified staff
determined? .................................................................................... 29
How does Washington fund school employee health benefits? ...... 30
How does Washington compare to other states? ............................ 32
How does the state lottery support public schools? ........................ 36
What is the role of the federal government in public elementary and
secondary education? ...................................................................... 38
What are other types of dedicated funding utilized by school
districts? .......................................................................................... 39
How is school construction funded in the state? ............................. 39
What is Initiative 1351? .................................................................. 40
Appendix A: Maximum Levy Authority ........................................ 41
Appendix B: Local Enrichment Property Tax Rates ...................... 43
Appendix C: K-12 Allocation Schedule for Certified Instructional
Staff ................................................................................................ 45
Appendix D: Base Salaries for School Year 2017-18 .................... 46
Introduction
    The 2018 Citizen’s Guide to K-12 Finance is offered to provide a clear
and simple overview of K-12 financial issues. It provides general
information on K-12 finance by answering frequently asked questions.

     For more in-depth information of K-12 finance, see Organization and
Financing of Washington Public Schools published by the Office of
Superintendent of Public Instruction (OSPI). It is available at:
http://www.k12.wa.us/safs/PUB/ORG/Org.asp. The information presented
in this document is based on statewide data.

     For information on a specific school district, inquire with that school
district. Detailed K-12 fiscal data, on both statewide and district-specific
levels, are also reported on the Washington State fiscal transparency website
at: http://fiscal.wa.gov/k12.aspx.

     The 2018 Citizen’s Guide to K-12 Finance was prepared by non-partisan
Senate Committee Services staff supporting the Senate Ways and Means
Committee and the Senate Early Learning & K-12 Committee) with the
assistance of staff of the Legislative Evaluation and Accountability Program
(LEAP) Committee.

    Questions regarding the guide or requests for additional copies should
be addressed to:

    Senate Ways and Means Committee
    311 John A. Cherberg
    Olympia, Washington 98504-0482
    Telephone: 360-786-7715
    Fax: 360-786-7615
    http://www.leg.wa.gov/Senate/Committees/WM/Pages/default.aspx

                                                                             1
How does recent legislation affect K-12 instruction and
funding of basic education?
     In the 2009-11 biennium, two pieces of legislation were enacted to
redefine the program of basic education and restructure K-12 funding
allocation formulas.
     The first bill, ESHB 2261 (Chapter 548, Laws of 2009), expanded the
definition of basic education — to include increased instructional hours, an
opportunity to complete 24 credits for high school graduation, full-day
kindergarten, a program for highly capable students, and student
transportation to and from school. The bill also created the framework for a
new distribution formula for the basic education instructional funding
allocation based on prototypical schools and a new funding formula for
student transportation. The changes took effect September 1, 2011 under an
implementation timeline set by the Legislature. The Legislature also
reaffirmed that the program of basic education includes special education
programs for students with disabilities; the Transitional Bilingual
Instructional Program (TBIP); the Learning Assistance Program (LAP),
which provides remedial education; and the education of students in
residential programs, juvenile detention, and adult correctional facilities. In
ESHB 2261, the Legislature also declared its intent to enhance the salary
allocation model.
     The second bill, SHB 2776 (Chapter 236, Laws of 2010), enacted in
statute the funding formula values for the new prototypical schools model at
levels that represented what the state was spending on basic education at the
time. It set targets and established a timeline for phasing in enhancements to
the funding and instructional program of basic education, including pupil
transportation, all-day kindergarten, K-3 class size reduction to 17 students
per teacher, and increased funding for materials, supplies and operating costs
(MSOC). These enhancements are fully implemented with the 2017-18
school year.
     The stated intent of the new funding model was to provide the
legislature's definition of basic education once fully implemented. The bills
also require school district reporting of actual staffing and expenditures,
compared to the funding provided in the prototypical model. The
comparisons are available on a public website of the Office of the
Superintendent of Public Instruction:
http://k12.wa.us/safs/INS/2776/Portal.asp.
     The enactment of EHB 2242 (Chapter 13, Laws of 2017, 3rd special
session) and its implementing appropriations in the 2017-19 operating
budget substantially increased state allocations for school staff salaries and
changed the way these salaries are established and adjusted in the future.
Under these reforms, future state salary allocations will be updated, if
necessary, to ensure that state basic education allocations continue to
provide market-rate salaries and that regionalization adjustments reflect

2
actual economic differences between school districts. In addition, EHB
2242 provides new state common school tax revenues, increases state
programming and funding for a number of K-12 basic education programs,
reforms how local levy revenues are calculated and their uses, and enacts
other reforms to further increase the transparency, accountability, and
efficiency of school funding. A more detailed description of these changes
is provided in later parts of this document. Additional information regarding
this legislation is also provided on OSPI's public website:
http://www.k12.wa.us/safs/INS/2242/2242.asp.

How many students attend K-12 schools in the state?
    In the 2016-17 school year, the most current year for which data is
available, over 1,040,800 students were enrolled at 2,393 public schools
across the state.
    In addition, it is estimated that about 81,574 students attended private
schools and 18,218 students received home-based instruction during the
2016-17 school year.

How are public schools in Washington organized?
     The public school system in Washington involves various entities at
both the state and local levels, including the Legislature, the Governor, the
State Board of Education, OSPI, the federal Department of Education, the
State Auditor’s Office, the Professional Educator Standards Board,
Educational Service Districts, the Washington State Charter School
Commission, and local school districts. Each of these entities plays a role in
establishing educational policies, implementing these policies, or providing
administrative and financial oversight of the public school system.
     Washington is largely considered a "local control" state. Each school
district is governed by a locally-elected school board whose members serve
staggered four-year terms. Local school district boards have broad
discretionary power to determine and adopt policies not in conflict with
other law that provide for the development and implementation of
instructional programs, activities, services, or practices that the school
district board of directors determine will promote education or effective
management and operation of the school district.
     Currently, there are a total of 295 school districts. Each school board
hires a Superintendent who oversees the day-to-day operation of the school
district.

                                                                               3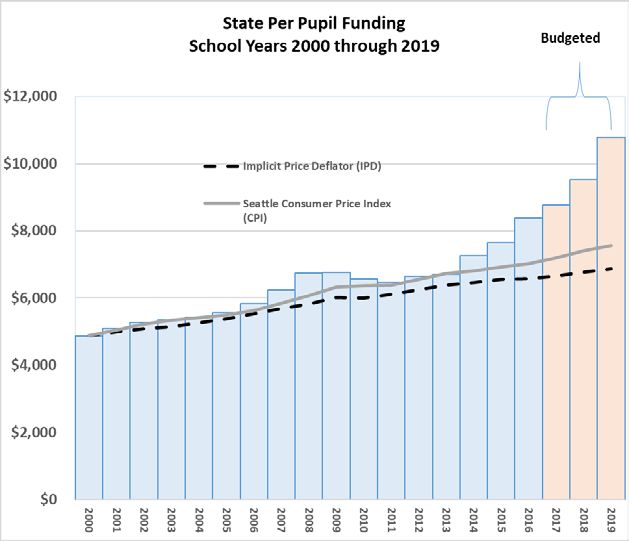
What does the Washington State Constitution provide
regarding K-12 public schools?

        "It is the paramount duty of the state to make ample
        provision for the education of all children residing within
        its borders, without distinction or preference on account
        of race, color, caste or sex."
                —Washington Constitution, article IX, section 1
     This constitutional provision is unique to Washington. While other
states have constitutional provisions related to education, no other state
makes K-12 education the "paramount duty" of the state.

How has this constitutional provision been interpreted
in the state courts?
     There have been a handful of Washington State Supreme Court cases
that have addressed basic education under Article IX of the Washington
Constitution. The Court has interpreted Article IX, section 1 of the state
constitution to mean that the state must define a "program of basic
education", within the guidelines of the Court, distinguished from all other
educational programs or services, and amply fund it from regular and
dependable sources that cannot be dependent on local tax levies.
     The Court has found that this "paramount duty" is superior in rank and
above all others. Neither fiscal crisis nor financial burden changes the
Legislature’s constitutional duty. The state has no duty to fund programs
outside the definition of "basic education." School districts may use local
property tax levies to fund enrichment programs and programs outside the
legislative definition of basic education. However, the use of local levies
cannot reduce the state’s obligation to fund basic education.
     The Court does not require the state to provide a total education or the
offerings of all knowledge, programs, subjects or services; however, the duty
goes beyond mere reading, writing, and arithmetic. The Court has noted that
a basic education also "embraces broad educational opportunities needed in
the contemporary setting to equip children for their role as citizens and as
potential competitors in today’s market as well as in the marketplace of
ideas." Additionally, the Court found that the education required by the
constitution does not reflect a right to a guaranteed educational outcome.
     The Court has acknowledged that the Legislature has an obligation to
review the definition of a basic education program as the needs of students
and the demands of society evolve. However, any reduction from the basic
education program must be accompanied by an educational policy rationale
and not for reasons unrelated to educational policy.

4
What is the McCleary decision?
The most recent court decision to address Article IX, section 1 of the
state constitution is McCleary v State, 173 Wn.2d 477, 269 P.3rd 227, which
was decided in January 2012. In McCleary, the Washington State Supreme
Court found that the State had failed to meet its paramount constitutional
duty to amply fund a program of basic education because the level of state
resources fell short of the actual cost of the basic education program.
The Court acknowledged that the Legislature had enacted promising
reforms in ESHB 2261 (Chapter 548, Laws of 2009), which if fully funded
would remedy deficiencies in the K-12 funding system. The Court retained
jurisdiction to help facilitate the Legislature's compliance with its
constitutional duty.
In the 2012 legislative session, the Legislature created the Joint Select
Committee on Article IX Litigation (Committee) to facilitate communication
with the Washington Supreme Court on school funding. In July 2012, the
Court ordered the Committee to annually report on legislative progress to
amply fund a program of basic education. The reports can be found at:
www.leg.wa.gov/jointcommittees/AIXLJSC/Pages/default.aspx.
In January 2014, the Court declared the State was not on target to meet
its 2018 constitutional funding obligations. The Court directed the State to
submit, no later than April 30, 2014, a complete plan for fully implementing
its program of basic education for each school year up to the 2017-18 school
year. In April 2014, the Committee submitted its third report to the Court,
which concluded that there was no agreement reached on the full
implementation plan. The Court subsequently found the State in contempt
for failing to comply with the Court's order to submit a plan but did not
impose sanctions. The Court ordered that the State must purge its contempt
by adjournment of the 2015 session or the Court would reconvene and
impose sanctions or other remedial measures.
After a third special session, the Legislature adopted a 2015-17 biennial
budget and the State submitted its annual post-budget report to the Court on
July 27, 2015. The Court found that the 2015-17 operating budget made
significant progress in some key areas. For example, the Court noted that
the budget provided full funding for transportation and would fully
implement all-day kindergarten by the 2016-17 school year, which was one
year ahead of schedule.
However, the Court also noted that with a looming deadline for 2018
compliance, there was still no plan to fund K-3 class sizes of 17 students,
and most importantly, the State had failed to offer any plan to fund increased
state allocations for teacher salaries, a major component of the State's
deficiency. On August 13, 2015, the Court found the State to be in
continued contempt of court and imposed a $100,000 per day penalty until
the State adopted a complete plan for complying with Article IX, section 1
by the 2018-19 school year.
5During the 2016 legislative session, the Legislature enacted Engrossed
Second Substitute Senate Bill (E2SSB) 6195 (chapter 3 , Laws of 2016),
which created an Education Funding Task Force (EFTF) to gather data
concerning compensation that school districts pay above the state basic
salary allocations. More specifically, the legislation required the hiring of an
independent consultant to assist the EFTF by collecting K-12 public school
staff total compensation data; identifying market rate salaries that are
comparable for certificated, administrative, and classified staff; and
providing analysis regarding whether a local labor market adjustment
formula should be implemented and if so, which market adjustment factors
and methods should be used.
During the 2016 legislative interim, the EFTF met 11 times to analyze
data and deliberate on policy options for resolving the remaining element for
fully funding its enacted policy reforms. In establishing the EFTF, the
Legislature declared that it would enact legislation by the end of the 2017
legislative session to eliminate school district dependency on local levies to
support the state's program of basic education. The Court, in its October 6,
2016 order, recognized "that the Legislature had committed itself in E2SSB
6195 to satisfying the State's paramount duty by the end of the 2017
legislative session." The Court further recognized that "the Legislature
cannot realistically determine the appropriations necessary for full funding
of basic education, including salaries, without the updated data that the
current task force is charged with gathering and presenting." As part of its
order, the Court clarified that full state funding of basic education must be
implemented by September 1, 2018; however, the Legislature must enact a
fully complying program by the end of the 2017 session.
The Court issued its most recent order on November 15, 2017 and
concluded that the State has met its constitutional duty to fully fund basic
education with regard to MSOC; pupil transportation; and categorical
programs of basic education, including special education, the highly capable
student program, TBIP, and LAP.
The Court also found the new salary allocation model established by
EHB 2242 is sufficient to recruit and retain competent teachers,
administrators, and staff. However, the Court held that the State remains out
of compliance because changes to basic education salaries created under
EHB 2242 are not fully implemented by the September 1, 2018 deadline. As
a result, the Court retained jurisdiction and continues to sanction a $100,000
a day penalty until the State is in full compliance.
6How has the State implemented the Program of Basic
Education?
In order to carry out its constitutional responsibility, the Legislature
passed the Basic Education Act of 1977 (BEA), which defined a "basic
education" by establishing goals, minimum program hours, teacher contact
hours, and a mix of course offerings for a school district to provide.
Currently, at least some portion of the seven programs (general
apportionment; the Special Education Program for students with disabilities;
some pupil transportation; the LAP for remediation assistance; the TBIP; the
Highly Capable Program; and the educational programs in juvenile detention
centers and state institutions) fall within the Legislature’s definition of basic
education.
The Legislature has also implemented the reform package under SHB
2261 (Chapter 548, Laws of 2009) and SHB 2776 (Chapter 236, Laws of
2010), by putting into place the new funding formulas and fully
implementing the enhancements for K-3 class size reductions, pupil
transportation, all-day kindergarten, and increased MSOC funding.
The Legislature is currently implementing the funding enhancements
and reforms under EHB 2242 (Chapter 13, Laws of 2017, 3rd special
session). For the 2017-18 school year, the changes include increased funding
for LAP, Special Education Program, Highly Capable Program, TBIP, and
reduced class sizes for career and technical education and skill centers.
The 2018-19 school year will include additional funding enhancements
for K-12 state salary and health benefit allocations and state funding for
professional learning days. The salary and benefit funding enhancements
will be fully implemented with the 2019-20 school year. State funding for
three professional learning days will be fully implemented with the 2020-21
school year.
General Apportionment - The General Apportionment formula provides
foundational state funding to school districts and funds basic education as
well as a number of non-basic education adjustments. The amount received
by each school district varies based on certain characteristics with
enrollment being the largest factor. As discussed in more detail below,
generally, enrollment drives the number of certificated, administrative, and
classified staff, and the associated salaries and benefits, allocated to the
district as well as the allocation of funds for other non-employee related
costs.
On average, the statewide allocation through the General Apportionment
formula is estimated to be $7,038 per student in the 2017-18 school year.
7General Apportionment formula:
The General Apportionment formula follows the prototypical school
model. Prototypes illustrate a level of resources to operate a school of a
particular size with particular types and grade levels of students. Allocations
to school districts are based on actual full-time equivalent (FTE) student
enrollment in each grade in the district, adjusted for small schools and
reflecting other factors in the state's biennial budget. Under SHB 2776
(Chapter 236, Laws of 2010), the Legislature designed a funding formula
that allocates funding in three primary groups:
• schools,
• district-wide support, and
• central administration.
The prototypical model applies staff ratios and an assumed class size for
each school type: elementary, middle, and high school. Each prototype has a
theoretical number of students and designated levels of staffing. The
funding to each district is scaled according to actual enrollment in each of
the grade ranges.
For example, an elementary school is assumed to have 400 students in
the prototypical model. If a district has 800 elementary-grade students, it
will receive funding for double the number of staff positions shown in Table
2, below. The class sizes represent the levels of funding associated with
assumed ratios of students to teachers, given certain assumptions about the
length of a teacher's day and the amount of time reserved for planning.
Funding is for allocation purposes only (except for the categorical, or
dedicated, programs), and it is up to the school district to budget the funds at
the local level. Beginning with the 2011-12 school year, OSPI began
reporting how school districts are deploying those same state resources
through their allocation of staff and other resources to school buildings, so
that citizens are able to compare the state assumptions to district allocation
decisions for each local school building. The information, by school
building, is available on an internet portal hosted by OSPI at:
http://k12.wa.us/safs/INS/2776/Portal.asp.
One of four 1 funding enhancements included in SHB 2776 (Chapter
236, Laws of 2010) requires average class size for grades K-3 to be reduced
beginning in the 2011-13 biennium and beginning with schools with the
highest percentage of low-income students, until the class size in the formula
beginning in the 2017-18 school year is 17.0 students per classroom teacher.
Beginning with the 2018-19 school year, funding for reduced class sizes in
1
Other required enhancements include: Funding for full-day kindergarten; substantially
increased funding for materials, supplies, and operating costs (MSOC); and substantially
enhanced funding for pupil transportation. All enhancements have been fully
implemented with the 2017-18 school year, including the K-3 class size reduction.
8K-3 is contingent upon, and proportional to, the school's demonstrated actual
class size for K-3.
The 2017-19 state operating budget includes funding to implement the
final K-3 class size reduction to 17.0 students per classroom teacher at a
biennial cost of $493 million.
EHB 2242 (Chapter 13, Laws of 2017, 3rd sp. Session) also included
funding to reduce class sizes for grades 7-12 career and technical education
classes from 26.57 to 23 students per class and skills centers from 22.76 to
20 students per class at a total biennial cost of $80 million.
Table 1: School Year 2017-18 Class Sizes
Grade Class Size
Grades K-3 17
Grades 4-6 27
Grades 7-8 28.53
Grades 9-12 28.74
Career & Tech. Ed (CTE) 7-8 23
CTE 9-12 23
Skills Centers 20
Lab Science 19.98
Length of teacher day is assumed to be 5.6 hours in elementary school
and 6.0 hours in middle and high school. Planning time is assumed to
be 45 minutes per day in elementary school and 60 minutes in high
school.
The 2017-19 state operating budget maintains existing prototypical
school building staffing unit assumptions for administrative and classified
staff as provided in the following table:
Elementary Middle High
Table 2: Staffing School School School
Prototypical school size:
Number of students 400 432 600
Staff per-school:
Principals/administrators 1.2530 1.3530 1.8800
Librarian/media specialist 0.6630 0.5190 0.5230
School nurses 0.0760 0.0600 0.0960
Social workers 0.0420 0.0060 0.0150
Psychologists 0.0170 0.0020 0.0070
Guidance counselors 0.4930 1.2160 2.5390
Instructional aides 0.9360 0.7000 0.6520
9Elementary Middle High
Table 2: Staffing continued. School School School
Office support & non-instructional aides 2.0120 2.3250 3.2690
Custodians 1.6570 1.9420 2.9650
Classified staff for student & staff safety 0.0790 0.0920 0.1410
Parent involvement coordinators 0.0825 0.0000 0.0000
District-wide support is funded under the prototypical model in addition
to the staffing levels presumed to be needed for individual school buildings,
since these services need to be provided across the district. Funding is based
on overall student enrollment levels.
Table 3: District-wide Support
Number of students 1,000
Per 1,000
Classified Staff
Students
Technology 0.628
Facilities, Maintenance, Grounds 1.813
Warehouse, Laborers, Mechanics 0.332
Under the prototypical formula, administration costs directly associated
with prototypical schools are included in those staffing levels — for
example, the number of principals and level of office support needed for
each elementary school, middle school, and high school. Central
administration, however, is funded as an additional 5.3 percent of other
staffing units generated by the formula. These general staffing units on
which the 5.3 percent is calculated include K-12 teachers, school-level
staffing, and district-wide support; it does not include additional staffing for
vocational programs, specialized classes, or categorical programs such as
programs for highly capable students, special education, or the learning
assistance program.
Finally, the prototypical funding formula for General Apportionment
includes an allocation for MSOC, formerly known as non-employee related
costs. Initially established based on district information from the 2007-08
school year, the formula provides the following per pupil funding amounts,
which are adjusted annually for inflation.
The 2017-19 budget provides $1244.16 per student for MSOC in school
year 2017-18 and $1264.07 for school year 2018-19 at a total biennial cost
of approximately $2.6 billion. The 2017-19 budget also provides
enhancements for students in grades 9-12 and students enrolled in career and
technical education and skill center programs at a total biennial cost of
approximately $329 million.
10Table 4: SY 2017-18 and 2018-19 Budgeted Materials, Supplies, and Operating
Costs (MSOC)
Per-Student Allocation Per-Student Allocation
MSOC Component
SY 2017-18 SY 2018-19
Technology $130.76 $132.85
Utilities and insurance 355.3 360.98
Curriculum and textbooks 140.39 142.64
Other supplies and library materials 298.05 302.82
Instructional professional development for
21.71 22.06
certified and classified staff
Facilities' maintenance 176.01 178.83
Security and central office 121.94 123.89
Total $1,244.16 $1,264.07
Students in grades 9-12 $1,415.07 $1,437.71
Students in CTE & skill center programs 1472.01 1495.56
Special Education - The state funding formula for special education, which
was implemented in 1995 and did not change under the new prototypical
funding formula, is based on the additional "excess costs" of educating
students receiving special education services. The "excess cost" amount is
provided for two categories of students.
For birth through four-year olds who are eligible for and enrolled in
special education, the special education allocation is 115 percent of the
district’s average per-student General Apportionment allocation.
For five to 21-year olds, the state special education allocation is 93
percent of the district’s average per-student General Apportionment
allocation.
In addition to the per-student special education allocations described
above, the special education funding structure includes safety net funding for
districts that can show extraordinary special education program costs beyond
state and federal resources. The 2017-19 budget appropriates $62.2 million
for this purpose.
The total 2017-19 biennial budget for special education is approximately
$2.2 billion. The estimated average additional special education per pupil
amount is $6,758 for Fiscal Year (FY) 2018 and $7,666 for FY2019.
Pupil Transportation - A revised transportation formula was effective
September 1, 2011, and fully implemented in the 2014-15 school year.
The new formula phased in funding for the transportation of students "to
and from school" as part basic education. The new formula requires the
funding to be calculated using a regression analysis of major cost factors that
are expected to increase (or decrease) the prior year's pupil-transportation
costs, including the count of basic and special education-student ridership,
district land area (geography), roadway miles, the average distance to
11school, and other statistically-significant coefficients. State funding in the
2017-19 budget for pupil transportation is approximately $1 billion.
As part of this funding, the state provides funding for school bus
replacement costs using a depreciation schedule. Annual payments are made
to districts from the year a bus is purchased until it reaches the end of its
scheduled lifecycle.
State allocations are deposited into the district's Transportation Vehicle
Fund to be used only for the purchase of new buses or for major repairs.
Learning Assistance Program (LAP) - LAP provides remediation
assistance to students scoring below grade level in reading, math, and
language arts. However, districts receive LAP allocations based on the
number of students in poverty, as measured by eligibility for free or reduced-
price lunch.
As with other categorical programs, the new funding formula provides a
designated number of hours of instruction per week. (A "categorical"
program is one in which funds may be used for only the dedicated program
and may not be re-allocated for use elsewhere in the school district.) State
law provides 2.3975 hours of LAP instruction per-week, assuming class
sizes of 15 students per certificated instructional staff. The formula
translates to additional funding of approximately $478 million for the 2017-
19 biennium.
EHB 2242 creates a new program within LAP. This new, additional
program establishes a high-poverty, school-based LAP allocation for schools
with at least 50 percent of the students who are eligible for free- or reduced-
priced meals. The new, additional minimum allocation in statute must
provide on a statewide average 1.1 hours per week in extra instruction with a
class size of 15. School districts must distribute this allocation to the school
buildings that generate the allocation. The funding must supplement and not
supplant the district's expenditures for LAP for these schools. To fund the
new LAP program for qualifying high-poverty school buildings, the 2017-19
biennial budget appropriates additional funding totaling approximately $205
million.
Transitional Bilingual Instructional Education (TBIP) - TBIP was
created by the Legislature in 1979. State TBIP funding supports students
whose primary language is other than English and whose English skills
impair learning to achieve proficiency in English. TBIP funds may also be
used to provide training to staff in the TBIP.
As with other categorical programs, the funding formula provides a
designated number of hours of instruction. For students in grades K through
126 and assuming class sizes of 15 students per certificated instructional staff,
the formula provides 4.7780 hours of bilingual instruction per week. The
formula translates to additional funding of approximately $279 million in the
2017-19 biennial budget.
EHB 2242 also provides funding for two additional hours of instruction
per week for students in grades 7 through 12, increasing the minimum
allocation to a total of 6.7780 hours, with a class size of 15 students.
Funding to support the additional two hours of instruction totals $27 million
in the 2017-19 biennial budget.
Funding for transitional support for up to two years after a student has
exited the TBIP is also provided to assist students who have met the
proficiency standards.
Under current law, 3.0 hours of additional instruction are provided for
students who exited the program in the immediate prior two years.
Institutional Education Programs - The state funds a 220-day
educational program for children in certain institutions. School districts,
educational service districts, or others receive institutional education moneys
if they provide the educational programs. While the amounts vary based on
the type and size of program, the current institutional education allocation is
approximately $27 million for the 2017-19 biennium.
Highly Capable Program - The Highly Capable, or gifted students,
program is funded under basic education statutes for up to 5.0 percent of a
school district's basic education student enrollment and, as is the case with
other categorical programs, the allocation cannot be used for other programs
(Prior to the enactment of EHB 2242, the funded enrollment percentage was
2.314 percent.).
As with other categorical programs, the funding formula for the Highly
Capable Program provides a designated number of hours of instruction per
week, in this case 2.1590, assuming class sizes of 15 students per certificated
instructional staff. The formula translates to additional funding of
approximately $21.5 million for the 2017-19 biennium.
Full-Day Kindergarten - The definition of basic education also provides
full-day instruction for kindergarten students (180 full days and 1,000 hours
of instruction) similar to grades 1 through 12. State funded full-day
kindergarten was fully implemented in school year 2016-17.
13The Legislature also funds a variety of programs and activities outside
of its definition of basic education. The chart below reflects the funding for
the 2017-19 biennium (FY2018 and FY2019) for the seven programs
currently defined as "basic education" as well as the funding for other K-12
programs and activities funded by the state.
2017-19 Operating Budget BASIC EDUCATION PROGRAMS
(Dollars in Millions)
General Apportionment (RCW 28A.150.260) $14,942 68.0%
Special Education (RCW 28A.150.370) $2,000 9.1%
Compensation Adjustments* $1,577 7.2%
Transportation (RCW 28A.160.150) $1,001 4.6%
Learning Assistance Program (RCW 28A.165) $682 3.1%
Bilingual (RCW 28A.180) $306 1.4%
Highly Capable Program (RCW 28A.185) $46 0.2%
Institutions (RCW 28A.190) $27 0.1%
Sub-Total: Basic Education Programs $20,579 93.7%
2017-19 Operating Budget NON-BASIC EDUCATION PROGRAMS
(Dollars in Millions)
Local Effort Assistance (Levy Equalization) $905 4.1%
Education Reform $292 1.3%
OSPI & Statewide Programs $98 0.4%
Educational Service Districts $17 0.1%
Food Service $14 0.1%
Charter Schools $63 0.3%
Charter School Commission. $0 0.0%
Sub-Total: Non-Basic Education Programs $1,389 6.3%
TOTAL - STATE FUNDS** $21,969 100%
*Includes approximately $26 million for professional learning days, which is not part
of basic education.
**State Funds include the General Fund-state, Opportunity Pathways Account, and the
Education Legacy Trust Account, together known as Near General Fund-State.
14Are there restrictions on local school levies?
Local School District Maintenance and Operation Levies before EHB
2242 - School districts are authorized to raise funds locally for their districts
through excess levies, which are voter-approved and limited in duration.
In 2016, 285 of the state's 295 school districts passed local levies for
maintenance and operation (M&O). In addition to M&O levies, school
districts are also authorized to collect voter-approved transportation vehicle
levies, which are used to pay for school buses or other school transportation
equipment. Local school district M&O revenues are deposited in the school
district's general fund. In the 2016-17 school year, M&O levies made up an
estimated 18 percent of total school district operating revenues on average
on a statewide basis.
Since 1977, the Legislature has limited the amount school districts may
collect through M&O levies. Prior to enactment of EHB 2242 in 2017, a
school district's maximum levy authority was a percentage of the state and
federal funding received by the school district in the prior year.
The state and federal funding received by a school district in the prior
year is typically referred to as the district's levy base and the percentage
amount is typically referred to as the school district's levy lid. A school
district's levy base also includes certain non-basic education revenues
formerly allocated by the state, sometimes referred to as "ghost money".
For calendar year 2017, most school districts have a levy lid of 28
percent. Therefore, these school districts may collect up to $0.28 in local
M&O levies for each $1 of state and federal revenues the district receives.
Some districts were "grandfathered" at a higher levy lid and may collect
more.
Prior to enactment of legislation during the 2017 legislative session, the
school district levy lid for calendar year 2018 was affected by the "levy
cliff". Under legislation enacted in 2010, the levy lid for most districts was
scheduled to decrease from 28 percent in calendar year 2017 to 24 percent in
calendar year 2018. (Districts grandfathered at a higher lid would have
experienced a lid decrease of 4 percentage points.) In addition, the levy cliff
would also have eliminated the "ghost money" from the levy base.
To address planning and stability for districts as the state moved toward
increased state allocations for K-12, the Legislature enacted ESB 5023 to
address the levy cliff during the 2017 regular session. This legislation
eliminated the scheduled lid decrease for calendar year 2018 as well as
revisions to the levy base related to "ghost money." In other words, M&O
levies for collection during calendar year 2018 are governed by the same lid
and base policies as those for collection in 2017.
15School District M&O Levies after EHB 2242 - Beginning with school
district levies for collection in calendar year 2019 and thereafter, EHB 2242
changes the way in which school districts may levy revenues for local
enrichment. School district M&O levies are renamed "enrichment levies".
Similarly, transportation vehicle levies are renamed "transportation vehicle
enrichment levies".
Beginning with enrichment levies levied for collection in calendar year
2019, school district levies are limited by a new levy lid. A district's
maximum enrichment levy is the lesser of $2,500 per pupil or a rate of $1.50
per $1,000 of assessed value.
Beginning in calendar year 2020, the $2,500 per pupil cap is increased
by inflation. (See Appendix B for a list of districts with tax rates estimated to
be below $1.50 in calendar years 2019 and 2020.)
Beginning with levies collected in calendar year 2020, school district
enrichment levies are subject to a new requirement for pre-ballot approval
by OSPI. Before a school district may submit an enrichment levy to the
voters, it must have received OSPI's approval of an expenditure plan for the
enrichment levy. OSPI may approve the plan if it is determined that the
district will spend enrichment levy revenues and other local revenues only
for permitted enrichment activities.
EHB 2242 establishes requirements for the review and approval process,
including timelines for OSPI to make its decision on approval; the
opportunity for districts to resubmit requests for approval to OSPI; and
criteria for OSPI approval of changes to a previously approved enrichment
expenditure plan. The same requirements also apply to transportation
vehicle enrichment levies.
What is Local Effort Assistance and Levy Equalization?
Local Effort Assistance (LEA) before EHB 2242 - The LEA program, also
referred to as state levy equalization, was created in 1987 to mitigate the
effect that above average property tax rates have on the ability of school
districts to raise local M&O revenues to supplement the state's basic
program of education.
LEA is a program that provides state funding to equalize the property
tax rates that taxpayers would otherwise pay for M&O levies and to provide
tax relief to tax payers in high tax rate school districts.
LEA funding is specifically designated as not part of the school district's
basic education allocation. In calendar year 2016, 217 of 295 school
districts were eligible for LEA, of which 212 received LEA distributions
totaling approximately $384 million.
Before EHB 2242, the state LEA program provided funding to equalize
up to 14 percent of a school district's levy base. A district was eligible to
receive LEA if the district's levy rate needed to raise the 14 percent levy
16amount for the district exceeded the statewide average 14 percent levy rate.
State funding provided under the LEA program was proportional to the
degree to which the district's 14 percent levy rate exceeds the statewide
average 14 percent levy rate.
Under the "levy cliff," LEA assistance was scheduled to decrease to a 12
percent equalization rate effective calendar year 2018; under ESB 5023, that
reduction was postponed by one year.
Local Effort Assistance after EHB 2242 - Beginning with LEA
distributions in calendar year 2019, LEA will be calculated under a new
formula that provides assistance for any school district that does not generate
an enrichment levy of at least $1,500 per student when levying at a rate of
$1.50 per $1,000 of assessed value.
An eligible school district’s maximum LEA is equal to the school
district's resident enrollment multiplied by the difference of $1,500 and the
school district's enrichment levy amount calculated on a per pupil basis at a
rate of $1.50 per $1,000 of assessed value. School district’s that are eligible
for LEA but not levying the maximum allowable levy receive LEA in
proportion to their actual levy collection. Beginning in calendar year 2020,
the $1,500 per-pupil cap is increased by inflation.
17How much of the state near-general fund is spent on
K-12 public schools?
The state general fund is the largest single fund within the state budget.
It is the principal fund supporting the operation of state government.
Given the purposes are similar and fund transfers between the two are
common, the education legacy trust account is often discussed in
combination with the state general fund; together, they are referred to as the
state near-general fund.
In the 2017-19 biennium (FY2018 and FY2019), the Legislature
appropriated just under $22 billion, or about 50 percent, of the state near-
general fund for the support and operation of K-12 public schools.
The following chart shows how the state near-general fund budget is
currently allocated:
How has the amount of the near-general fund support of
K-12 public schools changed since 2005?
As depicted on the following chart, the amount of state near-general
funds spent for K-12 public schools has increased from $11.7 billion to $22
billion per biennium since the 2005-07 biennium.
18The below chart shows state near-general fund expenditures for K-12 public
schools as a percent of the statewide total have varied over the biennia, with
a low of approximately 39 percent in 2005-07 to a high of approximately 50
percent today. Increases in the share for K-12 funding can be attributable to
increased K-12 funding, decreased funding for other programs, or both.
The major factor contributing to the decline in the 2009-11 biennium is
the impacts from the economic recession.
19What are other sources of funding used by school
districts?
In addition to state funding, school districts receive funding from the
federal government, local taxes, and other miscellaneous sources. The
sources of funding budgeted by school districts for operating costs for the
2016-17 school year are provided below.
State — Approximately 70 percent of budgeted school district revenues in
the last completed school year were from state sources. This amount consists
of funding for the seven categorical programs currently defined as "basic
education" (general apportionment; the special education program for
students with disabilities; some pupil transportation; LAP; TBIP; the Highly
Capable program; and educational programs in juvenile detention centers
and state institutions) as well as a variety of other grants, allocations, and
items funded from the state general fund and the education legacy trust
account.
Local Taxes — Approximately, $2.4 billion, or 18 percent of the total
school district revenues is derived from local taxes. This is primarily local
property taxes, which are currently referred to as maintenance and
operations levies, or beginning in calendar year 2019, will be renamed
"enrichment levies" per EHB 2242.
Federal — School districts received a little over $1 billion from federal
sources for the 2016-17 school year. This represented about 8 percent of
their total spending. This includes funding for the implementation of the
federal Individuals with Disabilities Education Act (IDEA); instructional
assistance and other strategies aimed at improving student achievement in
high-poverty schools; a variety of professional development activities; the
school lunch and other nutrition programs; financial assistance to
20compensate school districts as the result of federal land ownership; and a
variety of smaller allocations and grants.
Other Revenue & Reserves — This category, totaling $588 million or
about 4 percent of total funding, includes a variety of miscellaneous sources
such as charges and fees for non-basic education programs, school lunch
charges, revenue from other school districts, rental income, donations, and
the use of reserves or fund balance.
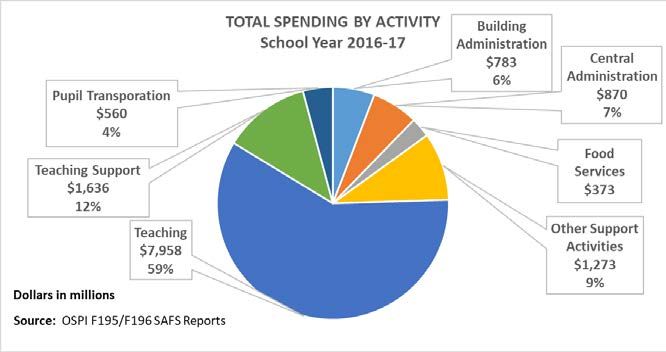
What are school district expenditures by activity?
One way to examine school spending is to identify how school districts
spend the money received from state, federal, local, and other sources.
School districts report detailed data to OSPI, including the "activities" on
which they spend money. The amounts spent on each activity for the 2016-
17 school year are depicted below.
Teaching — For the 2016-17 school year, school districts spent
approximately $8 billion (59 percent of the total) for teaching activities. This
includes payments for salaries and benefits for classroom teachers, direct
classroom instruction, extracurricular activities, and payments to other
districts for educational services.
Teaching Support — School districts spent $1.6 billion on teaching support
activities in the 2016-17 school year. This represents approximately 12
percent of total school district spending. This includes guidance counseling,
library services, audio-visual functions, psychological services, health-
related activities, and other services that support the delivery of teaching
services.
21Other Support Activities — After teaching, the largest activity for school district spending is utilities, grounds care, plant operation and maintenance, insurance, information systems, and other support functions. In the 2016-17 school year, school districts spent approximately $1.3 billion, or 9 percent of their total spending, on this activity. Central Administration — Approximately $870 million or 7 percent of total school district spending is for central administration. This includes school board functions, the superintendents’ offices, business functions, human resources, centralized programs, and other district-level administrative functions. Building Administration — In the 2016-17 school year, school districts spent $783 million, 6 percent of total school district spending, on unit administration. This includes expenditures for principals and other building- level administrative functions. Pupil Transportation — School districts spent $560 million or 4 percent on pupil transportation in the 2016-17 school year. This includes bus and other vehicle operating costs, related maintenance, and program supervision. Food Services — Approximately $373 million, or 3 percent of total spending, is for food-operation functions, including program supervision and federal-nutrition programs, in the 2016-17 school year. 22
What are school district expenditures by student and
program?
    As an alternative way to examine how school districts spend money, the
chart below shows total spending from federal, state, and local sources by
program:

Regular Instruction - In school year 2016-17, districts spent approximately
$7.4 billion on regular instruction. This program area includes basic
education expenditures for kindergarten through twelfth grade public
education. This program area also includes expenditures for alternative
learning and dropout reengagement.

                                                                        23
Special Education Instruction - This program includes expenditures for excess cost expenditures for providing special education and related services to special education-eligible students. In school year 2016-17, districts spent approximately $1.7 billion on special education instruction programs. Support Services - Support service programs consist of activities to accomplish objectives that support the educational programs of the district. Examples include food services and transporting pupils to and from school. In school year 2016-17, districts spent approximately $2.7 billion on support service programs. Compensatory Education Instruction - In school year 2016-17, districts spent approximately $851 million on compensatory education instruction. These programs include federal remediation, the state learning assistance program, and state institutions for juveniles. Community Services - This area includes expenditures for programs primarily for the benefit of the whole community or some segment of the community. Examples include the operation of public radio or television broadcasting stations, childcare programs, and recreational programs such as ski school or swimming. In school year 2016-17, districts spent approximately $85 million on community service programs. Other Instructional Programs - This program area includes traffic safety, summer school, highly capable, targeted assistance for at-risk students, and youth training programs. In school year 2016-17, districts spent approximately $272 million on other instructional programs. Skills Centers Instruction - This program represents expenditures for operating a skill center program approved by OSPI. In school year 2016-17, districts spent approximately $41 million on skill centers instruction. Vocational Education Instruction - This program includes expenditures for 9-12 grade work skills programs approved for funding by OSPI and middle school career and technical education. In school year 2016-17, districts spent approximately $393 million on vocational education programs, which includes the basic education allocation and the additional enhanced funding allocations for MSOC and class-size reductions. 24
How has total per-student spending changed since
2000?
    As can be seen from the following chart, total per-student spending
(from state, federal, local, and other sources) has increased from $6,709 in
SY 2000-01 to an estimated $12,946 in SY 2018-19.
    This represents an increase of approximately 93 percent over this period.
The growth rate of total per-student spending exceeds both the Seattle
Consumer Price Index (CPI) and Implicit Price Deflator (IPD), which are
two commonly used measures of inflation.

                                                                          25
How has state per-student funding changed since 2000?
As can be seen from the following chart, state funding per student has
increased from $6,709 in SY 1999-00 to $13,669 in SY 2018-19 slightly
more than doubling over the period. The growth rate of state funding per
student spending exceeds both the Implicit Price Deflator (IPD) and the
Seattle Consumer Price Index (CPI).
How is the salary level for teachers determined?
State Salary Allocations Before EHB 2242 – The Legislature allocates
money to each district for state-funded employee salaries and associated
fringe benefits. In the case of certificated instructional staff (CIS)—
teachers, counselors, librarians, and other instructional staff requiring
certification—the state funding is provided based on a state-salary allocation
schedule. An individual’s education level and teaching experience
determines the allocation for base salary. Additional funds (a one- to three-
percent increase) are provided for each additional year of experience up to
16 years. Additional funds (a three- to twenty-percent increase) are also
provided for additional credits of approved education acquired up to a Ph.D.
(See appendix B for the state allocation schedule for CIS for the 2017-18
school year.)
26The state does not require school districts to pay CIS in accordance with
the state-salary allocation schedule. However, most school districts have
adopted a salary schedule the same as, or similar to, the state allocation
schedule. Some of the state’s 295 school districts receive higher salary
allocations for CIS. (See Appendix D for a list of school districts receiving
higher base salary allocations).
The primary reason for this higher allocation is that these districts were
paying their CIS higher salaries when the Legislature took on responsibility
for fully funding basic education programs in the late 1970s. In the 2007-09
budget, the Legislature took steps that reduced the number of grandfathered
salary districts. (See appendix C for a list of these districts and their
allocation rate for school year 2017-18.)
Additionally, the Legislature limits a school district’s authority to
establish salaries for CIS by setting a minimum and an average salary level.
Minimum salary – The actual minimum salaries in the district
cannot be less than the minimum on the state-salary allocation
schedule for a certificated instructional staff member who has a BA
or MA with no years of experience. The rationale for this limitation
is to ensure a minimum salary for beginning certificated
instructional staff.
Average salary – The actual average salary in the district cannot
exceed the average salary calculated based on the state allocation
schedule. A rationale for this limitation is to prevent districts from
paying a few CIS a very large salary and the rest at the minimum.
The state funding provided to school districts for CIS salaries is subject to
collective bargaining within the state limitations.
Supplemental Pay – School districts may provide supplemental pay for
additional time, responsibilities, and incentives (also known as "TRI")
beyond that provided by the state. The vast majority of supplemental
contracts are paid from local revenue. State law provides that supplemental
pay contracts must not create any present- nor future-funding obligation for
the state.
State Salary Allocations Under EHB 2242 and the 2017-19 Operating
Budget - EHB 2242 increases and revises the state's salary allocation
methodology. Under EHB 2242, state funding allocations to school districts
continue to be based on staffing ratios in the prototypical school funding
model and categorical programs. In addition, state allocations generally
continue to be provided for allocation purposes rather than to require
specified staffing levels. However, EHB 2242 makes numerous changes to
state salary allocations and the process by which allocations are increased in
the future.
27Beginning with the 2018-19 school year, state CIS salary allocations
will no longer use the state salary grid to allocate salaries for school districts,
thus eliminating use of a district's "staff mix" of CIS education and years of
experience. Instead, the state will allocate salary funding to school districts
based on minimum statewide average salaries for each of the three school
staffing categories. When fully implemented in school year 2019-20, the
statewide average CIS salary allocation will be $66,930.
Beginning with the 2018-19 school year, EHB 2242 also requires the
state to adjust its salary allocations to reflect regional differences in the cost
of hiring staff. The regionalization factor for each school district is based,
in part, on differences in the median residential value of each school district
as well as all neighboring districts within a 15-mile radius. Districts whose
median residential values exceed the statewide average receive upward
adjustments of six, 12, or 18 percent. After assigning initial regionalization
factor values based on median residential values, new district allocations
under the regionalization methodology were compared to estimated school
district total state and local average CIS salaries for the 2016-17 school year
(the most current year for which data was available). In instances where the
district's new allocation was less than their estimated total salary, the
district's regionalization factor was increased by one additional tier (6
percentage points). These further regionalization adjustments are identified
in the budget bill and must be reduced on a specified schedule through the
2022-23 school year. The reductions in the regionalization are also
identified in the budget bill.
Under EHB 2242, state salary allocations must also include an
inflationary adjustment based on the IPD, rather than a cost of living
adjustment (COLA) based on the Seattle CPI.
The "innovation" category for supplemental contracts was eliminated.
School districts must annually report to OSPI on supplemental contracts
entered into for TRI. OSPI must annually report summarized district
information to the Legislature. Beginning September 1, 2019, supplemental
contracts for CIS must only be for enrichment activities and subject to the
new definition of enrichment. The rate the district pays under a
supplemental contract may not exceed the hourly rate of the CIS for services
under the basic education salary. OSPI may develop recommendations for
expanding the non-exhaustive list of specifically permitted activities for
supplemental contracts, which the Legislature must review and consider in
the 2018 legislative session.
28You can also read