Unravelling the complex story of intergenomic recombination in ABB allotriploid bananas
←
→
Page content transcription
If your browser does not render page correctly, please read the page content below
Annals of Botany 127: 7–20, 2021
doi: 10.1093/aob/mcaa032, available online at www.academic.oup.com/aob

                                     PART OF A HIGHLIGHT ON GENOMIC EVOLUTION
          Unravelling the complex story of intergenomic recombination in ABB
                                 allotriploid bananas
       Alberto Cenci1,*, Julie Sardos1, Yann Hueber1, Guillaume Martin2,3, Catherine Breton1, Nicolas Roux1,
                   Rony Swennen4,5,6, Sebastien Christian Carpentier4 and Mathieu Rouard1,*,
   1
    Alliance Bioversity International - CIAT, Parc Scientifique Agropolis II, 34397 Montpellier, France, 2AGAP, Université de
  Montpellier, CIRAD, INRA, Montpellier SupAgro, Montpellier, France, 3CIRAD, UMR AGAP, F-34398 Montpellier, France,

                                                                                                                                                     Downloaded from https://academic.oup.com/aob/article/127/1/7/5760888 by guest on 08 August 2021
  4
    Alliance Bioversity International - CIAT, Willem De Croylaan 42, B-3001 Leuven, Belgium, 5Laboratory of Tropical Crop
   Improvement, Division of Crop Biotechnics, KU Leuven, B-3001 Leuven, Belgium and 6International Institute of Tropical
Agriculture, c/o The Nelson Mandela African Institution of Science and Technology (NM-AIST), P.O. Box 447, Arusha, Tanzania
                              *For correspondence. E-mail a.cenci@cgiar.org; m.rouard@cgiar.org

         Received: 31 October 2019    Returned for revision: 26 November 2019 Editorial decision: 19 February 2020 Accepted: 25 February 2020
                                                            Electronically published: 7 April 2020

               • Background and Aims Bananas (Musa spp.) are a major staple food for hundreds of millions of people in
               developing countries. The cultivated varieties are seedless and parthenocarpic clones of which the ancestral origin
               remains to be clarified. The most important cultivars are triploids with an AAA, AAB or ABB genome constitu-
               tion, with A and B genomes provided by M. acuminata and M. balbisiana, respectively. Previous studies suggested
               that inter-genome recombinations were relatively common in banana cultivars and that triploids were more likely
               to have passed through an intermediate hybrid. In this study, we investigated the chromosome structure within the
               ABB group, composed of starchy cooking bananas that play an important role in food security.
               • Methods Using SNP markers called from RADSeq data, we studied the chromosome structure of 36 ABB
               genotypes spanning defined taxonomic subgroups. To complement our understanding, we searched for similar
               events within nine AB hybrid genotypes.
               • Key Results Recurrent homologous exchanges (HEs), i.e. chromatin exchanges between A and B subgenomes,
               were unravelled with at least nine founding events (HE patterns) at the origin of ABB bananas prior to clonal
               diversification. Two independent founding events were found for Pisang Awak genotypes. Two HE patterns, cor-
               responding to genotypes Pelipita and Klue Teparod, show an over-representation of B genome contribution. Three
               HE patterns mainly found in Indian accessions shared some recombined regions and two additional patterns did
               not correspond to any known subgroups.
               • Conclusions The discovery of the nine founding events allowed an investigation of the possible routes that
               led to the creation of the different subgroups, which resulted in new hypotheses. Based on our observations, we
               suggest different routes that gave rise to the current diversity in the ABB cultivars, routes involving primary AB
               hybrids, routes leading to shared HEs and routes leading to a B excess ratio. Genetic fluxes took place between
               M. acuminata and M. balbisiana, particularly in India, where these unbalanced AB hybrids and ABB allotriploids
               originated, and where cultivated M. balbisiana are abundant. The result of this study clarifies the classification of
               ABB cultivars, possibly leading to the revision of the classification of this subgroup.

               Key words: Genetic diversity, homologous exchanges, meiosis, Musa, polyploids, subgenomes.

                         INTRODUCTION                                        AB, AAB or ABB, depending on their ploidy level. Diploids
                                                                             with an AA constitution are parthenocarpic with various de-
Bananas (Musa spp.) are herbaceous monocotyledons belonging                  grees of sterility, mainly cultivated for fruit consumption.
to the Zingiberales. The Musa genus originated in South-East                 Edible AB hybrids do exist but are rare, and are mostly known
Asia and west Oceania where it was domesticated; from there                  in India. Those studied so far are reported as sterile (Jenny et al.,
banana was spread to tropical areas of Africa and America. Two               2011). Musa balbisiana, although associated with wild popu-
species contributed widely to the varieties cultivated world-                lations, can be found in home gardens, where it is cultivated
wide: Musa acuminata Colla (A genome), whose distribution                    for its leaves, male buds, young fruits or seeds, the last being
coincides with Mainland and Maritime South-East Asia and                     used in traditional pharmacopoeias (Subbaraya et al., 2006).
New Guinea island, and M. balbisiana Colla (B genome), dis-                  The most common banana cultivars are triploid (2n = 3x = 33),
tributed in eastern South Asia, northern South-East Asia and                 i.e. composed of three sets of 11 chromosomes, and are either
southern China (Simmonds, 1962; Janssens et al., 2016).                      autotriploid (AAA) or allotriploid (AAB and ABB). These cul-
   Present-day cultivated bananas with an exclusively A genome               tivars have very low seed set due to farmers’ selection com-
constitution are noted as AA or AAA and hybrids are noted as                 bined with triploidy, which hampers the production of balanced

                                    © The Author(s) 2020. Published by Oxford University Press on behalf of the Annals of Botany Company.
This is an Open Access article distributed under the terms of the Creative Commons Attribution License (http://creativecommons.org/licenses/
         by/4.0/), which permits unrestricted reuse, distribution, and reproduction in any medium, provided the original work is properly cited.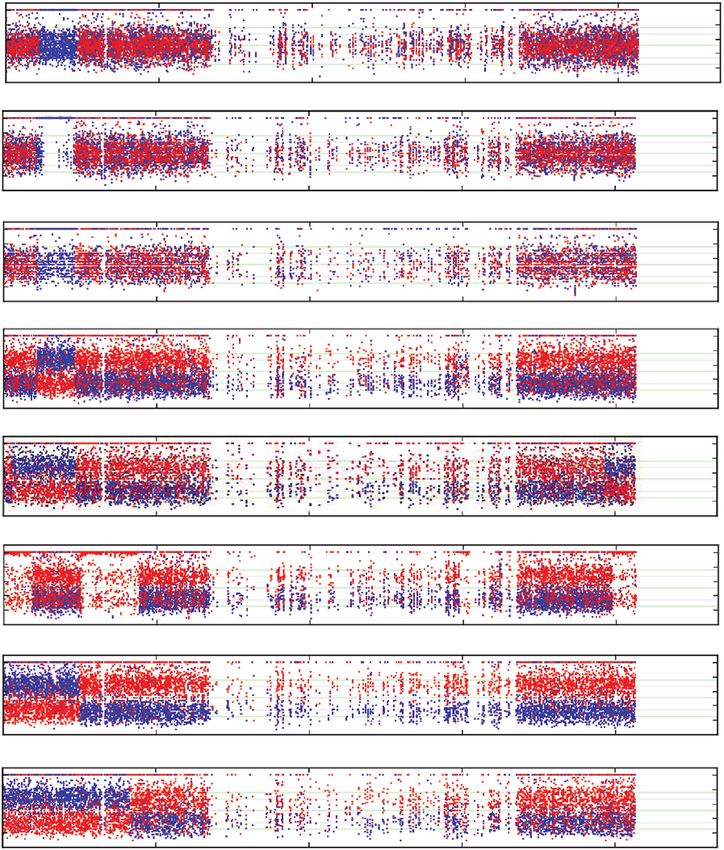
8                 Cenci et al. — Unravelling the complex story of intergenomic recombination in ABB bananas

gametes. Consequently, they are clonally propagated. The com-                         MATERIALS AND METHODS
bination of sterility and parthenocarpy ensures the production
of seedless fruits that are edible.                                  Plant material
   The taxonomic classification of allotriploid bananas
was mainly based on morphological descriptors with traits            Lyophilized leaf samples from 45 banana genotypes (36
differentiating M. acuminata from M. balbisiana (Simmonds            allotriploid ABB and nine hybrid AB) were supplied by the
and Shepherd, 1955). Later, molecular analysis of organelle          Bioversity International Musa germplasm Transit Centre (ITC)
genomes allowed the characterization of cultivar cytotypes           hosted at KU Leuven, Belgium, except for three leaf samples
and, combined with ploidy measurements, led to hypotheses            collected in Indonesia during the Triangle collecting missions in
on crossing pathways (Carreel et al., 2002; Boonruangrod             2012–13 (Hermanto et al., 2014a, b) and originally considered
et al., 2008). Next, molecular markers from single sequence          as diploid AA accessions but revised as diploid AB (Christelová
repeats (SSRs) provided a multilocus survey of the parental          et al., 2017), and currently conserved at the Indonesian Centre
allele contribution (Hippolyte et al., 2012; Christelová et al.,     for Horticultural Research and Development (ICHORD). The

                                                                                                                                         Downloaded from https://academic.oup.com/aob/article/127/1/7/5760888 by guest on 08 August 2021
2017). Cytogenetic and genome-wide studies also revealed             passport data of these accessions are available in the Musa
that allotriploids are not mere additions of sets of 11 chromo-      Germplasm Information System (MGIS) (Ruas et al., 2017)
somes, but contain regions with a variable subgenome ratio           (Table 1).
along the chromosomes (D’Hont et al., 2000; Jeridi et al.,
2011; Noumbissié et al., 2016), demonstrating the occur-
rence of recombinations between subgenomes. Advances                 DNA extraction and RADSeq data generation
in next-generation sequencing enabled the development of
methods allowing (1) a more detailed view of the chromo-                Genomic DNA was extracted using the 2X CTAB protocol.
some structure of a few allopolyploid cultivars (Wang et al.,        The method used to create the library for restriction-site-
2019), (2) to follow up segregation of chromosomes on                associated DNA sequencing (RADSeq) used the PstI restriction
breeding materials (Baurens et al., 2019) and (3) an under-          enzyme. The 300–500 short-insert libraries were sequenced
standing of the impact of allopolyploidy on gene expression          with 91 bp paired-end reads using Illumina HiSeq2000
(Cenci et al., 2019).                                                (Illumina, San Diego, CA, USA) by BGI Hong Kong. At BGI,
   It is commonly accepted that triploids have been generated        the raw data were modified with the following two steps: (1)
by spontaneous hybridizations of edible AA or AB plants with         reads polluted by adapter sequences were deleted; and (2) reads
various sources of the additional A or B genome (other edible        that contained >50 % low-quality bases (quality value ≤5) or
AA or M. acuminata, and M. balbisiana). However, the studies         >10 % N bases were removed.
cited above point up the genomic complexity of allotriploid cul-
tivars, suggesting the occurrence of backcrosses with parental
species through residual fertility in some allotriploid cultivars    Read mapping, filtering and SNP calling
(De Langhe et al., 2010).
   Among the allotriploids, the ABB genomic group com-                  Paired-end reads contained in raw FASTQ files were checked
prises starchy bananas that are used for cooking, dessert            using FastQC. Reads were then cleaned to remove adapter
and beer production (Karamura et al., 1998). They are re-            sequences and low-quality ends (Phred score >20) with Cutadapt
ported as being resistant to weevils, nematodes and black            (Martin, 2011). After trimming, reads inferior to 30 bp were
leaf streak (Karamura et al., 1998) and tolerant of drought          discarded. Reads were then aligned using BWA (Li and Durbin,
(Thomas et al., 1998; De Langhe, 2002; Vanhove et al.,               2009) with the default parameter against the Musa acuminata
2012; Ravi et al., 2013; Kissel et al., 2015; van Wesemael           genome of the reference v2 (DH Pahang) (D’Hont et al., 2012;
et al., 2019). The ABB banana cultivars belong to a mor-             Martin et al., 2016) downloaded from the Banana Genome Hub
phologically diverse group subdivided into nine subgroups,           (Droc et al., 2013). Read groups were added for each alignment
namely Bluggoe, Monthan, Ney Mannan, Klue Teparod,                   and reads were locally realigned with IndelRealigner (Genome
Kalapua, Peyan, Pisang Awak, Pelipita and Saba (Daniells             Analysis ToolKit) (McKenna et al., 2010). HaplotypeCaller
et al., 2001). They originate from two regions: India and            from GATK version 3.4-46 was then used to get a gVCF file
surrounding regions, and South-East Asia (De Langhe et al.,          for each accession. Genotyping on gVCF files was performed
2009; Perrier et al., 2011).                                         with GenotypeGVCFs from GATK 3.4-46. SNPs were called
   Molecular markers have shown that some ABB cultivars              on uniquely mapped reads with HaplotyCaller from GATK ver-
were erratically classified (Sardos et al., 2016; Christelová        sion 3.4-46.
et al., 2017). Furthermore, the genomic composition of the
Saba subgroup, coming from the Philippines, has been debated
for years as some authors have suggested it consists of B gen-
                                                                     Detection of homologous exchange
omes only (Valmayor et al., 1999).
   The goals of this study were (1) to survey a large sample            The subgenomic structure was investigated using VcfHunter
of interspecific AB and ABB genotypes to establish molecular         (https://github.com/SouthGreenPlatform/VcfHunter). Based
karyotypes and thus to set up a clear framework for their classi-    on known sequence variability in the A and B genomes, SNP
fication, and (2) to bring new insights into the origin and evolu-   variants were assigned to the ancestral genomes in order to
tion of ABB triploid cultivars.                                      plot the A/B genome allele coverage ratio and to calculate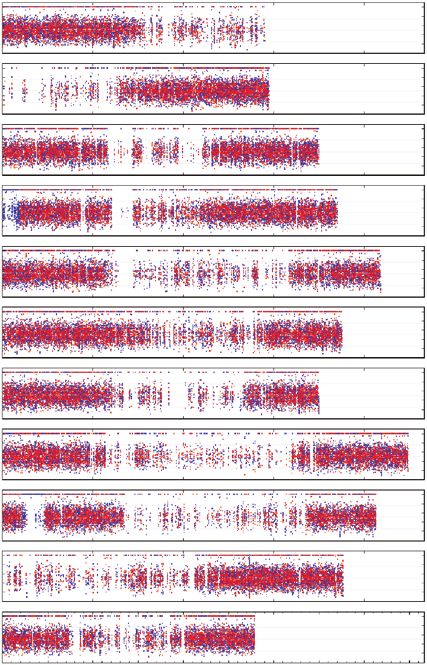
Cenci et al. — Unravelling the complex story of intergenomic recombination in ABB bananas                                               9

Table 1. List of 36 ABB and nine AB accessions used in this study. Cytotypes: Ca and Cb indicate chloroplasts originating from
                   M. acuminata and M. balbisiana, respectively; Ma and Mb indicate the same for mitochondria

Acession      Accession name            DOI                     Genome*        Subgroup         Collection      Geographical origin     Cytotype      Genomic
code                                                                                                                                                  pattern

ITC0245       Safet Velchi              10.18730/9JM13          AB             Ney Poovan       ITC             India                   CaMa          2x-1
ITC1034       Kunnan                    10.18730/9M2KD          AB             Ney Poovan       ITC             India†                  CaMa          2x-2
ITC1747       Agniswar                  10.18730/9NGN7          AB             Kunnan           ITC             Indonesia               –             2x-2
ITC1729       Padali Moongil            10.18730/9NFE5          AB             Kunnan           ITC             India†                  –             2x-3
ITC1752       Poovilla Chundan          10.18730/9NH1K          AB             Kunnan           ITC             India†                  –             2x-3
ITC1751       Adukka Kunnan             10.18730/9NGYG          AB             Kunnan           ITC             India†                  –             2x-4
Sum002        Muku Bugis                –                       AB             –                ICHORD          Indonesia               –             (2x)
Sum004        Mu’u Seribu               –                       AB             –                ICHORD          Indonesia               –             (2x)
 ITC1880      Mu’u Pundi                10.18730/P5G84          AB                              ITC             Indonesia (Sup008)      –             (2x)

                                                                                                                                                                   Downloaded from https://academic.oup.com/aob/article/127/1/7/5760888 by guest on 08 August 2021
ITC1700       Kepok Kuning              10.18730/9ND89          ABB            Saba             ITC             Indonesia               –             N/A
ITC1745       Kepok Tanjung             10.18730/9NGH3          ABB            Saba             ITC             Indonesia               –             N/A
ITC0632       Cachaco enano             10.18730/9KATX          ABB            Bluggoe          ITC             Colombia‡               –             1a
ITC0643       Cachaco                   10.18730/9KBJG          ABB            Bluggoe          ITC             Colombia‡               –             1a
ITC1728       Sambrani Monthan          10.18730/9NFD4          ABB            Monthan          ITC             India                   –             1a
ITC1746       Bankel                    10.18730/9NGM6          ABB            Pisang Awak      ITC             India                   –             1a
ITC1748       Boddida Bukkisa           10.18730/9NGQ9          ABB            Pisang Awak      ITC             India                   –             1a
ITC1483       Monthan                   10.18730/9MXQY          ABB            Monthan          ITC             India                   CaMb          1a
ITC0026       Sabra                     10.18730/9J6SQ          ABB            Unknown          ITC             Gabon                   –             1a+
ITC0767       Dole                      10.18730/9KGR$          ABB            Bluggoe          ITC             France‡                 CaMb          1a+
ITC0361       Blue Java                 10.18730/9JTR~          ABB            Ney Mannan       ITC             Fiji‡                   –             1b
ITC1750       Ney Vannan                10.18730/9NGXF          ABB            Ney Mannan       ITC             India                   –             1b
ITC1738       Kyauk Sein Phee           10.18730/9NG4V          ABB            Unknown          ITC             Myanmar                 –             1b
                Kyan
ITC0123       Simili Radjah             10.18730/9JC16          ABB            Peyan            ITC             India                   CbMb          1b+
ITC1600       INIVIT PB-2003            10.18730/9N676          ABB            Saba             ITC             Cuba‡                   –             1c
ITC1138       Saba                      10.18730/9M6MZ          ABB            Saba             ITC             Philippines             CaMb          1c
ITC0659       Namwa Khom                10.18730/9KCB4          ABB            Pisang Awak      ITC             Thailand                CbMb          2
ITC0053       Bom                       10.18730/9J7YQ          ABB            Pisang Awak      ITC             Ivory Coast‡            –             2
ITC0087       Kayinja                   10.18730/9J9YD          ABB            Pisang Awak      ITC             Burundi‡                –             2
ITC0101       Fougamou 1                10.18730/9JAX7          ABB            Pisang Awak      ITC             Gabon                   –             2
ITC0526       Kluai Namwa Khom          10.18730/9K3PQ          ABB            Pisang Awak      ITC             Thailand‡               –             2
ITC1599       Kambani Zambia            10.18730/9N665          ABB            Pisang Awak      ITC             Tanzania                –             2
ITC1721       Karpuravalli              10.18730/9NEWR          ABB            Pisang Awak      ITC             India                   –             2
ITC1737       Ya Khine                  10.18730/9NG1R          ABB            Unknown          ITC             Myanmar                 –             2
ITC0339       Pisang Awak               10.18730/9JSGY          ABB            Pisang Awak      ITC             Australia‡              –             2+
ITC1719       Chinia                    10.18730/9NERM          ABB            Pisang Awak      ITC             India                   –             3
ITC1749       Vananthpurani             10.18730/9NGTC          ABB            Pisang Awak      ITC             India                   –             3
ITC0472       Pelipita                  10.18730/9K0MU          ABB            Unknown          ITC             Philippines             CaMb          4
ITC0396       Pelipita                  10.18730/9JW32          ABB            Unknown          ITC             Costa Rica‡             –             4
ITC0397       Pelipita Majoncho         10.18730/9JW65          ABB            Unknown          ITC             Costa Rica‡             –             4
ITC0652       Kluai Tiparot             10.18730/9KC0Y          ABB            Unknown          ITC             Thailand                CbMb          5
ITC0473       Balonkawe                 10.18730/9K0P1          ABB            Klue Teparod     ITC             Philippines             –             5
ITC0983       Auko                      10.18730/9KZKW          ABB (M)        Unknown          ITC             PNG                     –             6
ITC0987       Auko                      10.18730/9KZZ3          ABB (M)        Unknown          ITC             PNG                     –             6
ITC0990       Vunapope                  10.18730/9M06A          ABB (M)        Unknown          ITC             PNG                     –             6
ITC1682       Chuoi mit                 10.18730/9NC06          ABB (AB)       Unknown          ITC             Vietnam                 –             7

   *(AB), genome erroneously classed or labelled as AB in taxonomic classification (passport data) but recognized as triploid in Christelova et al. (2017); (M),
erroneously classed as AB in taxonomic classification and reported as mixoploidy (2x + 3x).
   †
     Assumed geographical origin from literature or name.
   ‡
     Geographical origin of the previous ex situ collection.
   +
     Genomic pattern containing aneuploidy regions.

normalized site coverage along chromosomes as described in                       were defined as ‘first’ or ‘second’ according to the chromosome
Baurens et al. (2019). SNP datasets from accessions repre-                       sequence.
senting M. acuminata and M. balbisiana sequence variability
were retrieved with GIGWA (Sempéré et al., 2016) on MGIS
(https://www.crop-diversity.org/mgis/gigwa) (Ruas et al.,                        Diversity analysis and accession relationship
2017). Homologous exchanges (HEs) were inferred when,
in a given chromosome, a change in A/B allele ratio was ob-                         The SNPRelate package in R (v1.18) (Zheng et al., 2012)
served between adjacent regions. Chromosomes were identi-                        was used to investigate genetic diversity of triploid bananas.
fied by their number in the A genome reference (from 01 to                       The Vcf file obtained was converted into the genomic data
11) (D’Hont et al., 2012) preceded by ‘chr’. Chromosome arms                     structure (GDS) file format. Only bi-allelic SNPs were selected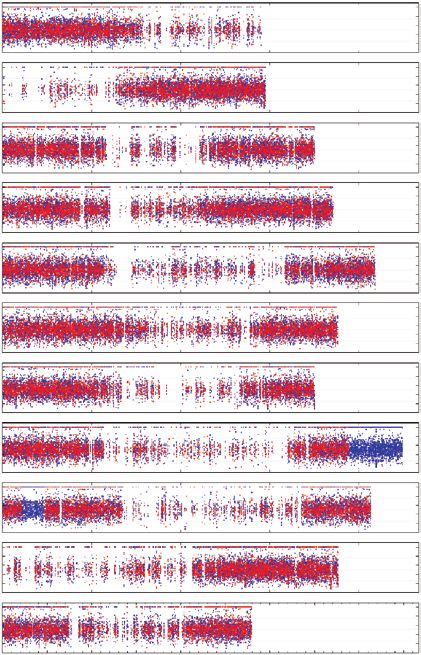
10 Cenci et al. — Unravelling the complex story of intergenomic recombination in ABB bananas
to build the dendrogram. A dissimilarity matrix between sam- had an A0:B3 ratio and the first arm of chr09 showed an A2:B1
ples was built with SNPRelate with a hierarchical clustering R interstitial region (Fig. 2). Patterns 1a and 1c had in common
package (Suzuki et al., 2006; pvclust). The statistical support of the A0:B3 terminal region of the chr11 first arm (Fig. 2) but
the genetic relationship among accessions was determined by pattern 1a differed, with a specific interstitial region A2:B1 in
running 100 bootstrap replicates. The resulting tree in Newick chr04 first arm. Pattern 1c had three specific regions A0:B3, in
format was produced with MEGA6. chr02 second arm, chr04 first arm and in chr09 first arm. The
interstitial region in chr09 where the A genome replaced the B
counterpart had a size very similar or identical to that shared by
RESULTS the 2x-2, 2x-3 and 2x-4 patterns in AB hybrids (Fig. 3). These
patterns contain mostly genotypes belonging to the Bluggoe,
Molecular karyotyping Monthan, Saba, Peyan and Ney Mannan subgroup, which ori-
ginated from India.
A set of nine AB and 36 ABB genotypes were used to iden-
The remaining patterns did not share identical HEs and were
Downloaded from https://academic.oup.com/aob/article/127/1/7/5760888 by guest on 08 August 2021
tify SNP markers using the RADSeq method. The number of
named from 2 to 7. Patterns 2 and 3 grouped genotypes classi-
SNPs ranged between 10 000 and 26 000 per chromosome
fied as Pisang Awak (Fig. 4), with the exception of two assigned
for each genotype (182 000 SNPs by genotype on average)
to pattern 1a that are known to be erroneously allocated to this
(Supplementary Data Material 1).
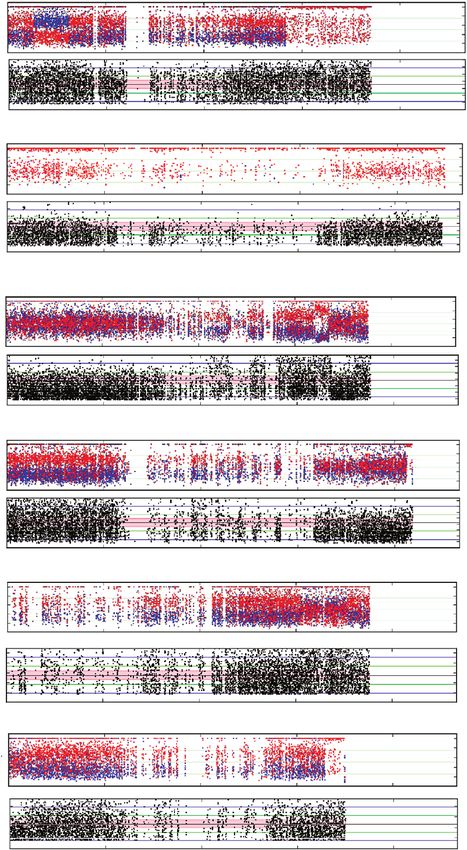
subgroup (Christelová et al., 2017). Patterns 4 and 5 were the
As in Baurens et al. (2019), SNPs were assigned to the A and
only ones having entire chromosome substitutions with the
B subgenomes and used to scan chromosomes for the detection
presence of an A0:B3 subgenome ratio. Specific to pattern 5,
of deviating regions, i.e. portions of chromosomes where the
no regions with an A2:B1 ratio were detected. Overall, patterns
subgenome ratios differ from the expected ratios based on the
4 and 5 had an excess of B subgenomes compared with other
assumed genomic composition (i.e. A1:B1 and A1:B2 for AB
ones (Fig. 4) and corresponded to genotypes assigned to sub-
hybrids and ABB allotriploids, respectively), also referred to
groups Pelipita and Klue Teparod, respectively. Pattern 6 was
as HEs.
not assigned to any known subgroup but the three genotypes
composing it shared the same origin from Papua New Guinea
(PNG) (Fig. 4, Table 1). Pattern 7 was represented by only one
AB hybrids genotype, ‘Chuoi mit’, from Vietnam (Fig. 4). Finally, two
genotypes (‘Kepok Kuning’ and ‘Kepok Tanjung’, originally
A panel of nine banana accessions reported as AB hybrids classified as belonging to subgroup Saba) both originating from
was analysed (Table 1). Only one-third of them (three) had Indonesia, did not show any region with a deviating subgenome
the expected subgenome composition (i.e. A1:B1), while the ratio and were not associated with any pattern.
others (six) showed one or two deviating regions with an A2:B0
ratio (i.e. missing B-specific SNPs). By comparing all HEs to-
gether we delineated four patterns, denoted as 2x-1, 2x-2, 2x-3
and 2x-4. The cultivar ‘Safet Velchi’ had a A2:B0 ratio in the Genotype-specific aneuploidies
first-arm terminal region of chr06 (Fig. 1, pattern 2x-1); culti-
For five genotypes, in addition to the described HEs based
vars ‘Kunnan’ and ‘Agniswar’ showed an A2:B0 ratio in the
on ratios involving three chromosomes (Fig. 5A), portions or
terminal region of second arm of chr08 and in a first-arm inter-
entire chromosomes displayed ratios with two or four copies.
stitial region of chr09 (Fig. 1, pattern 2x-2). ‘Padali Moongil’
For the ‘Dole’ genotype belonging to the Bluggoe subgroup
and ‘Poovilla Chundan’ showed an A2:B0 ratio in the first-arm
(pattern 1a), no SNPs assigned to the A subgenome were de-
terminal region of chr04 and in a first-arm interstitial region of
tected along the whole of chr08. The lower SNP coverage
chr09 (Fig. 1, pattern 2x-3); ‘Adukka Kunnan’ had an intersti-
compared with other chromosomes and the unimodal coverage
tial A2:B0 region in the first arm of chr09 (Fig. 1, pattern 2x-
distribution of residual B genome heterozygosity (at 0.5) indi-
4). Among these samples, the cytotypes of ‘Safet Velchi’ and
cates an A0:B2 ratio, implying the A version of chr08 was lost
‘Kunnan’ were previously characterized with chloroplasts and
(Fig. 5B). The chr06 of ‘Sabra’ (pattern 1a) shows a complex
mitochondria originating from M. acuminata (Carreel et al.,
structure (Fig. 5C). On the first arm there is similar coverage of
2002; Boonruangrod et al., 2008).
A- and B-assigned SNPs around 0.5 and lower SNP coverage
than other regions, compatible with an A1:B1 subgenome ratio.
On the second arm, six regions with A1:B1, A1:B2 and A1:B3
ratios were inferred. In ‘Simili Radjah’, a large part of the second
ABB allotriploids
arm of chr05 is missing. Most of the region exhibits a diploid
In 34 out of the 36 ABB genotypes, HEs with a subgenome pattern A1:B1 except in its terminal region, where A0:B2 ap-
ratio corresponding to A0:B3 (region with only B-assigned pears (Fig. 5D). The genotype ‘INIVIT PB-2003’ (pattern 1c)
SNPs) or A2:B1 (region with two-thirds A-, one-third showed a unique interstitial region, in the chr10 second arm,
B-assigned SNPs) were detected. None with an A3:B0 ratio where the SNPs assigned to A and B had similar contributions.
were found. Nine patterns corresponding to specific combin- Since SNP coverage in this region was higher than in the rest
ations were identified, enabling the classification of each geno- of chr10, an A2:B2 homoallele ratio was inferred (Fig. 5E).
type (Table 1). Three patterns sharing regions with the same Finally, the accession ‘Pisang Awak’ (ITC0339, pattern 2) had
ratio deviation and size were numbered 1a, 1b and 1c. In these, an A1:B1 homoallele ratio in the terminal part of the chr07 first
large terminal regions of the second arm of chr04 and chr11 arm (Fig. 5F).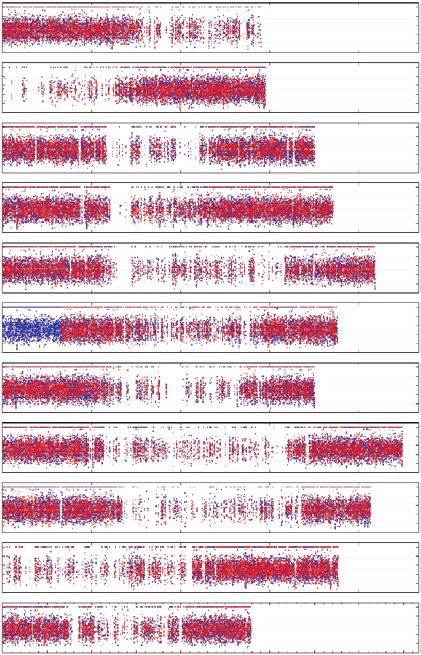
Cenci et al. — Unravelling the complex story of intergenomic recombination in ABB bananas                                          11

                                                               Pattern 2x–1                      Pattern 2x–2
                                             chr01

                                             chr02

                                             chr03

                                             chr04

                                             chr05
                             SNP frequency

                                             chr06

                                             chr07

                                                                                                                                                               Downloaded from https://academic.oup.com/aob/article/127/1/7/5760888 by guest on 08 August 2021
                                             chr08

                                             chr09

                                             chr10

                                             chr11

                                                               Pattern 2x–3                      Pattern 2x–4
                                             chr01

                                             chr02

                                             chr03

                                             chr04

                                             chr05
                             SNP frequency

                                             chr06

                                             chr07

                                             chr08

                                             chr09

                                             chr10

                                             chr11

                                                     0   5 10 15 20 25 30 35 40 45    0   5 10 15 20 25 30 35 40 45
                                                           SNP coordinates (Mb)             SNP coordinates (Mb)

Fig. 1. Patterns of AB hybrids having genomic regions with an unexpected subgenome ratio. Frequencies of SNPs (y-axis) assigned to A and B genomes are shown
                        in blue and red, respectively. SNP coordinates (x-axis) are reported in Mb at the bottom of each genotype figure.

   Since these aneuploidies were specific to single genotypes                     well supported clusters can be distinguished (Supplementary
(not shared with other genotypes with the same HE pattern),                       Data Material 2). The first cluster includes the 11 accessions
we considered that mutation events occurred after the original                    having patterns 2 and 3, whereas the second comprises all the
triploidization events.                                                           remaining genotypes.

                                                                                                            DISCUSSION
Diversity analysis
                                                                                  In this study, genome-wide molecular markers (RADSeq-
   We used SNPs from genomic regions not involved in any                          derived SNPs) were used to characterize the genome of dip-
HE in 31 ABB genotypes (pattern 4 and 5 genotypes, with high                      loid and triploid banana hybrid cultivars (with an emphasis on
B genome content, were excluded from the analysis) to per-                        the ABB group) with the objective of implementing an efficient
form a genetic diversity analysis. In the diversity tree, two very                classification system for germplasm management. RADSeq is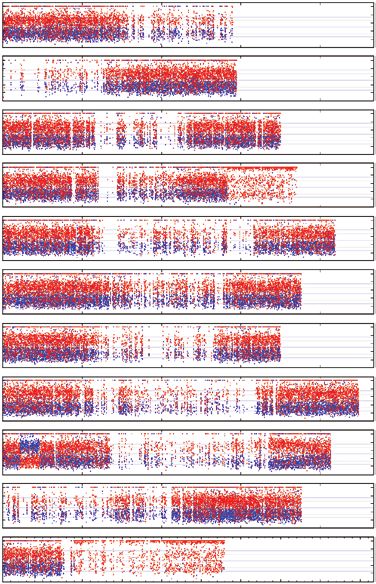
12                             Cenci et al. — Unravelling the complex story of intergenomic recombination in ABB bananas

                                                             Pattern 1a                        Pattern 1b                           Pattern 1c
                             chr01

                             chr02

                             chr03

                             chr04
             SNP frequency

                             chr05

                             chr06

                             chr07

                             chr08

                                                                                                                                                                  Downloaded from https://academic.oup.com/aob/article/127/1/7/5760888 by guest on 08 August 2021
                             chr09

                             chr10

                             chr11
                                      0          5 10 15 20 25 30 35 40 45          0   5 10 15 20 25 30 35 40 45     0    5 10 15 20 25 30 35 40 45
                                                    SNP coordinates (Mb)                  SNP coordinates (Mb)               SNP coordinates (Mb)

Fig. 2. Patterns 1a, 1b and 1c of ABB allotriploids having genomic regions with an unexpected allele ratio composition. Frequencies of SNP (y-axis) assigned
to A and B genomes are shown in blue and red, respectively. SNP coordinates (x-axis) are reported in Mb at the bottom of each genotype figure. Black rect-
angles indicate regions shared by all three patterns, blue rectangles indicate regions shared by patterns 1a and 1c, and red boxes indicate regions specific to
                                                                     the respective pattern.

                                                                                                                                       Pattern
                                                 chr09
                                                                                                                                        2x-2

                                                                                                                                       Pattern
                                                 chr09
                                                                                                                                        2x-3

                                                                                                                                       Pattern
                                                 chr09
                                                                                                                                        2x-4

                                                                                                                                       Patterns
                                                 chr09                                                                                  1a, 1b
                                 SNP frequency

                                                                                                                                        and 1c

                                                                                                                                       Pattern
                                                 chr09
                                                                                                                                          4

                                                                                                                                       Pattern
                                                 chr09
                                                                                                                                          5

                                                                                                                                       Pattern
                                                 chr09
                                                                                                                                          6

                                                                                                                                       Pattern
                                                 chr09
                                                                                                                                          7

                                                         0       5        10   15       20      25        30     35   40       45
                                                                                        SNP coordinates

Fig. 3. Chromosome 09 pseudo-karyotypes observed in three AB and seven ABB patterns. The rectangle highlights the A-genome-enriched region in all chromo-
                        somes 9. Frequency of SNPs (y-axis) assigned to A and B genomes are shown in blue and red, respectively.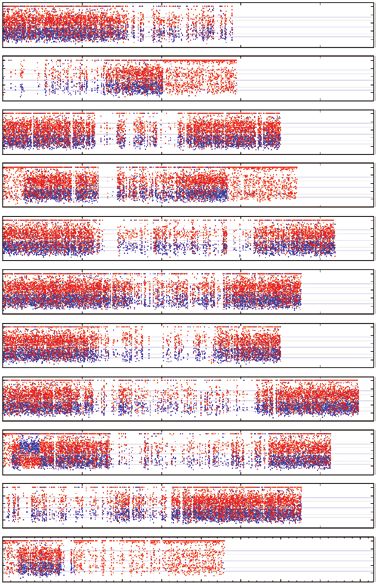
Cenci et al. — Unravelling the complex story of intergenomic recombination in ABB bananas                         13

                                 Pattern 2                     Pattern 3            Since HE detection is based on allele ratio changes, reciprocal
                chr01                                                               HEs possibly present in the analysed genomes could not be
                                                                                    detected.
                chr02
                                                                                       Such genome structural rearrangement occurs frequently in
                chr03                                                               polyploid crops, such as rapeseed, cotton, mustard rape, straw-
                chr04                                                               berry and bread wheat (Salmon et al., 2010; Guo et al., 2014;
SNP frequency

                chr05                                                               He et al., 2017; Lloyd et al., 2018; Edger et al., 2019), and
                chr06
                                                                                    can have consequences for gene expression (Lloyd et al., 2018;
                                                                                    Cenci et al., 2019; Zhang et al., 2019) and the presence/ab-
                chr07                                                               sence or copy number variations of genes linked to agronomic
                chr08                                                               traits (Stein et al., 2017; Hurgobin et al., 2018). For banana, we
                chr09                                                               show that HEs are useful in gaining new insights into the evolu-
                                                                                    tionary events that led to the creation of allopolyploids.

                                                                                                                                                         Downloaded from https://academic.oup.com/aob/article/127/1/7/5760888 by guest on 08 August 2021
                chr10
                chr11

                                                                                    The complex history of ABB cultivars can be grouped into at least
                                 Pattern 4                     Pattern 5
                                                                                    nine founding events
                chr01
                chr02
                                                                                       The classification of cultivated ABB bananas has long
                                                                                    needed clarification. (De Langhe 2002) noted that ‘The more
                chr03
                                                                                    popular names (Saba, Pisang Awak, Peyan, Bluggoe, Monthan)
                chr04                                                               actually represent a cluster of closely related cultivars, gener-
SNP frequency

                chr05                                                               ated by somatic variation’. Each variant has its local name in
                                                                                    Asia, which makes the nomenclature of the whole ABB group
                chr06
                                                                                    difficult to resolve based solely on this source of information.
                chr07                                                               The combination of morpho-taxonomic descriptors and SSR
                chr08                                                               markers confirmed this difficulty in discriminating the Indian
                chr09                                                               subgroups (Saraswathi et al., 2011), and the use of diversity
                                                                                    arrays technology (DArT) or SSR markers on a wider sample
                chr10
                                                                                    showed that the classification was consistent for accessions be-
                chr11                                                               longing to the subgroups Pelipita, Klue Teparod and Pisang
                                                                                    Awak (Sardos et al., 2016; Christelová et al., 2017). However,
                                 Pattern 6                     Pattern 7            accessions classified as belonging to the subgroups Saba,
                chr01                                                               Monthan, Bluggoe, Ney Mannan or Peyan were often misclas-
                                                                                    sified (Sardos et al., 2016).
                chr02
                                                                                       Overall, all the allotriploid accessions were confirmed as
                chr03                                                               having an ABB genome constitution, i.e. the ratio between vari-
                chr04                                                               ants assigned to B and A subgenomes was A1:B2. We further
SNP frequency

                chr05
                                                                                    explored the presence of HEs in a comprehensive set of ABB
                                                                                    cultivars, as initiated in previous studies (Baurens et al., 2019;
                chr06
                                                                                    Cenci et al., 2019; Wang et al., 2019), and confirmed that such
                chr07                                                               a phenomenon has been very common in the creation of these
                chr08                                                               domesticated bananas. Among the 36 genotypes surveyed, 34
                chr09
                                                                                    had at least two chromosome portions for which the observed
                                                                                    ratio was either A2:B1 or A0:B3 (Supplementary Data Material
                chr10                                                               3; Fig. 6).
                chr11                                                                  In total, 53 HEs were inferred in the nine ABB and
                        0 5 10 15 20 25 30 35 40 45   0 5 10 15 20 25 30 35 40 45   four AB patterns (shared HEs were counted only once)
                          SNP coordinates (Mb)          SNP coordinates (Mb)        (Supplementary Data Material 3). They were found in all
                                                                                    11 Musa chromosomes but were unevenly distributed, with
Fig. 4. Patterns 2–7 of ABB allotriploids having genomic regions with an un-        11 and 13 independent recombination events in the most re-
expected allele ratio composition. Frequencies of SNP (y-axis) assigned to          combined chr04 and chr09, respectively, and only one re-
A and B genomes are shown in blue and red, respectively. SNP coordinates
(x-axis) are reported in Mb at the bottom of each genotype figure. Black rect-      combination event in chr02 (Supplementary Data Material
angles indicate recombined regions partially overlapping in the patterns 2 and      3; Fig. 6). Since no recombination hotspots were observed
   3; red boxes indicate recombined regions differentiating patterns 2 and 3.       for chr04 and chr09 by Baurens et al. (2019) using segre-
                                                                                    gating populations, the high frequency of HEs we detected
an affordable method that provides high coverage of markers                         in these chromosomes may be due to the presence of genes
along the chromosomes. By applying the software proposed in                         influencing domestication traits for which human selection
Baurens et al., 2019, we unravelled the HEs in banana acces-                        could have favoured some combinations between A and B
sion samples as specific signatures of the taxonomic subgroups.                     homoalleles. In particular, the first arm of chr09 appears to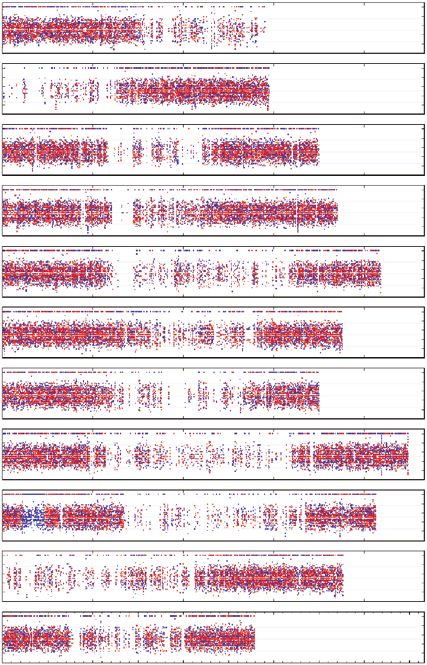
14                                Cenci et al. — Unravelling the complex story of intergenomic recombination in ABB bananas

     A                                                                                                   Groups 1a, 1b and 1c
         coverage frequency

                                                                                            f = 0.67
                     SNP

                                                                                                         Typical pattern of chromosome 4 with regions
                                                                                            f = 0.33     A1:B2 (expected), A2:B1 and A0:B3 (both
                                                                                                         deviating).
           Read

     B
         coverage frequency

                                                                                                         Dole (ITC0767)
                     SNP

                                                          f = 0.50                                       Pattern of chromosome 8 with deviating
                                                                                                         allele balance A0:B2.

                                                                                                                                                                       Downloaded from https://academic.oup.com/aob/article/127/1/7/5760888 by guest on 08 August 2021
           Read

                                                                                                         Sabra (ITC0026)
                                                                                                         Pattern of chromosome 6 with some regions
     C
         coverage frequency

                                                                                                         showing deviating allele balances. From
                     SNP

                                                                                                         left to the right (short and long arm
                                                                                                         respectively): A1:B1, A1:B2, A1:B1, A1:B2,
                                                                                                         A1:B3, A1:B1, A1:B2. Absolute coverage
                                                                                                         analysis excluded the possibility that regions
           Read

                                                                                                         with equal representation of A and B regions
                                                                                                         had an allele balance A2:B2.

     D                                                                                                   Simili Radjah (ITC00123)
         coverage frequency
                     SNP

                                                                                                         The chromosome 5 long arm had mainly an
                                                                                                         A1:B1 structure with the exception of the
                                                                                                         terminal part that was A0:B2.
           Read

                                                                                                         INIVIT PB-2003 (ITC1600)
     E
         frequency

                                                                                                         In long arm of chromosome 10, an
            SNP

                                                                                                         interstitial region showed an equal
                                                                                                         representation of A and B variants. Since
                                                                                                         the read coverage in the deviating region was
         coverage

                                                                                                         greater than in regions with the A1:B2 pattern,
           Read

                                                                                                         it was concluded that this region had a
                                                                                                         structure A2:B2.

     F
         frequency

                                                                                                         Pisang Awak (ITC0339)
            SNP

                                                                                                         The terminal region of chromosome 7 short
                                                                                                         arm showed a A1:B1 pattern. The terminal
                                                                                                         region of long arm was A0:B3 as for all the
         coverage

                                                                                                         genotypes having pattern 2.
           Read

                              0     5     10    15       20          25   30   35     40       45
                                                     SNP coordinates (Mb)

Fig. 5. Patterns of critical chromosomes involved in aneuploidy. For each pattern, frequencies of SNPs assigned to A and B subgenomes (shown in green and red,
respectively) and absolute read coverage (shown in black in the lower graphic in each panel) are reported for chromosomes with a deviating pattern. (A) Pattern of
chromosomes present in the expected number of copies (three). (B–F) Patterns with changes in number of copies involving entire or partial chromosomes. Curly
bracket colours indicate regions with the inferred subgenome composition. Coloured curly brackets delimitate the regions with inferred genome ratios reported in
 the box on the right. Grey arrows illustrate different allele frequencies (f) used to discriminate between regions with A0:B3 and A0:B2 ratios in a and b patterns.

be involved in several independent HEs, and a subgenome                             coordinates, implying different events. This supports the hy-
A interstitial region was present in all the cultivars analysed                     pothesis that the presence of this A homoallele was selected
(Fig. 3). Indeed, three AB hybrids and patterns 1a, 1b and 1c                       during the domestication process.
had identical or very similar HE coordinates but interstitial                          The different HE patterns of ABB allotriploidy provide new
or terminal regions on patterns 4, 5, 6 and 7 had different HE                      insights into their current classification, as discussed below.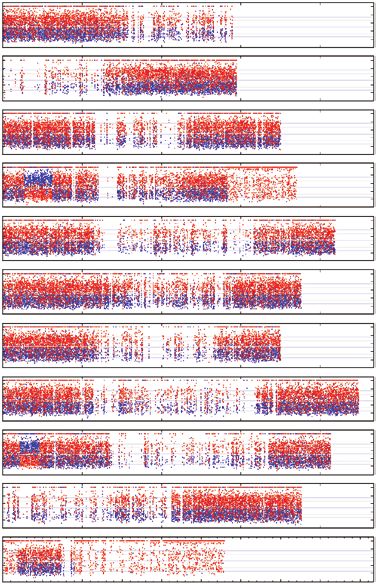
Cenci et al. — Unravelling the complex story of intergenomic recombination in ABB bananas 15
4
5 5 3
1a
1c 3
5 2 1a
5
7
5
5
1a
1b 2
5 6 6 7 3 4 2
1b 1c 5
A B B A B B A B B A B B A B B A B B
Chr01 Chr02 Chr03 Chr04 Chr05 Chr06
5 HE area Chr substitution
5 4
3 1c 1a
7 3 B A
5 1a 4 6 1b 2
Downloaded from https://academic.oup.com/aob/article/127/1/7/5760888 by guest on 08 August 2021
1b 1c
1c { } HE pattern area
4 5 5
1a Patterns/Subgroups
1b
1c 1a: Bluggoe & Monthan
4: Pelipita
2 1b: Peyan & Ney Mannan
2 4 5 2 3 5: KlueTiparod
3 4 5 1c: Saba
4 6: Auko
A B B A B B A B B A B B A B B 2: Pisang Awak
7: ChuoiMit
3: Pisang Awak
Chr07 Chr08 Chr09 Chr10 Chr11
Fig. 6. Schematic ideogram overview of all HEs and chromosome substitutions detected in the 36 ABB bananas. Hatching patterns indicate the approximate area
(cumulated when overlapping) of HEs between A (blue) and B (red). Numbered brackets indicate the boundaries for a specific pattern number. Chromosome sub-
stitutions are illustrated with the chromosome border highlighted in colour (red for B).
West ABB diversity analysis confirmed that the parents contributing to
both Pisang Awak patterns had a high level of genetic simi-
Bluggoe, Monthan, Peyan and Ney Mannan share the same
larity. Consequently, it remains difficult to conclude that the
common origin. The dominance of accessions from India in
phenotypic similarity between those genotypes is due to their
patterns 1a and 1b is obvious. Equally, diploid hybrids (AB)
global genetic background or to the similarity in recombination
from India appear to share HEs with patterns 1. We can there-
patterns.
fore locate the early origin of the recombination events typ-
ical of patterns 1 in India. All cultivars of subgroup Bluggoe
(Table 1), but also Monthan, showed HE pattern 1a. Subgroups
Peyan and Ney Mannan both had pattern 1b. This study shows Pelipita
that Bluggoe, Monthan, Peyan and Ney Mannan share a All accessions (three) classified in the Pelipita subgroup
common origin linked to India. Two additional Indian cultivars, shared an identical and specific deviating pattern (pattern 4;
classified as Pisang Awak, shared pattern 3. Fig. 4). These cultivars [‘Pelipita’ (ITC0396 and ITC0472) and
‘Pelipita Majoncho’] had an entire A chr02 and chr11 substi-
tution (A0:B3 structure) and chr07 was mainly A0:B3, with
East ABB the exception of the second-arm interstitial region. These find-
ings in the ‘Pelipita’ genome are consistent with observations
Pisang Awak subgroup would originate from at least two inde- made through in situ hybridization reporting that ‘Pelipita’ con-
pendent events. Eight Pisang Awak cultivars were included in tained 25 B and eight A chromosomes (D’Hont et al., 2000).
pattern 2 (Fig. 4). Comparing patterns 2 and 3 (i.e. coordinates Additional chromosome regions with an unexpected ratio were
of break points), we noticed that despite the independent oc- also present, notably two regions of chr09 exhibiting ratios
currence of the recombination events in each pattern, similar favouring A (A2:B1).
deviations in A and B ratios were present in three chromosomal
regions (black squares in Fig. 4). Such results could suggest
that these regions harbour genes giving similar phenotypic
Klue Teparod
traits to the cultivars with patterns 2 and 3 and that these traits
influenced their classification in the same subgroup. However, The two cultivars of HE pattern 5 (‘Kluai Tiparot’ and
phenotypic proximity among the cultivars of these two HE pat- ‘Balonkawe’) could be easily distinguished from all the other
terns likely results from genetic similarity in parental genotypes surveyed accessions. First, all deviating regions were A0:B3
(Christelová et al., 2017). The diversity tree based on SNPs in (no A2:B1 were observed, contrary to all other patterns); and
genomic regions with ABB composition indicated that geno- second, three entire chromosomes (chr02, chr08 and chr10)
types having patterns 2 and 3 form a group clearly differenti- were fully B and three additional A0:B3 centromeres were
ated from the other accessions. Since regions involved in HE present in recombined chromosomes (Fig. 4). This obser-
were excluded from the analysis, no bias due to overlapping vation provides new insights into a long-lasting debate that
regions with similar HEs is expected in these results. The exists on the classification of the Klue Teparod subgroup. The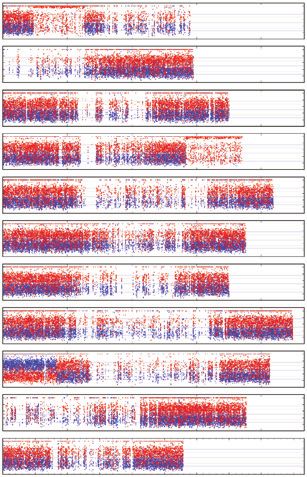
16                Cenci et al. — Unravelling the complex story of intergenomic recombination in ABB bananas

‘Balonkawe’ accession, originally collected in the Philippines       originated from different continents separated by the Wallace
by Allen in 1959, was first classified as a tetraploid ABBB          Line.
due to its robust appearance (Rosales et al., 1999). However,
flow cytometry coupled with chromosome counting indicated
that the ‘Klue Tiparot’ accession from the same subgroup was
                                                                     Genesis of HE patterns
in fact a triploid (Jenny et al., 1997). Later, the use of sev-
eral types of molecular marker led to a different conclusion.           The discovery of nine founding events opens the discussion
Ribosomal DNA (Boonruangrod et al., 2008) suggested the              on the possible routes that led to the creation of these different
presence of B genomes only while internal transcribed spacer         subgroups and the formulation of new hypotheses. To obtain a
(ITS) sequences confirmed the occurrence of A (Hřibová               triploid genome constitution (2n = 3x), a diploid gamete (n = 2x)
et al., 2011; Čížková et al., 2013). Dominant DArT markers           needs to meet a haploid gamete of the opposite sex (n = x).
that resulted in the clustering of these two accessions into the     Usually, 2x gametes can be produced by tetraploid genotypes
M. balbisiana gene pool led to the hypothesis of the presence of     (2n = 4x) or by a diploid genotype (2n = 2x) through a meiosis

                                                                                                                                           Downloaded from https://academic.oup.com/aob/article/127/1/7/5760888 by guest on 08 August 2021
an incomplete A genome (Sardos et al., 2016). In this study, it      failing one of the divisions [i.e. first- or second-division resti-
is shown that Klue Teparod accessions contain a small fraction       tution (FDR or SDR, respectively)] and ending with a doubled
of an A genome, which makes this subgroup the cultivated var-        chromosome set. Hybrids from different species are prone to
iety carrying the highest content of B genome ever described.        setting unreduced gametes, derived from FDR (Ramsey and
Similar to the cultivar ‘Lep Chang Kut’ (ITC0647), registered        Schemske, 1998).
as BBB in MGIS (Ruas et al., 2017) but for which the presence           In banana it has also been reported that allotriploids can pro-
of A isoforms was detected (Carpentier et al., 2011), we pro-        duce viable reduced gametes, both haploid (n = x = 11) and
vide evidence that Klue Teparod’s accessions are not partheno-       diploid (n = 2x = 22) (Shepherd, 1999).
carpic BBBs.                                                            To obtain an ABB constitution, two gametic combinations
                                                                     (GCs) are consequently possible:
                                                                     - AB × B: a 2x gamete containing A and B genomes
Saba                                                                   originating from (1) a hybrid genotype (AB) by FDR, or
                                                                       (2) an allotriploid (AAB or ABB) or (3) an allotetraploid
   The four cultivars classified as Saba in our sample showed
                                                                       (AABB) that met a normal M. balbisiana gamete (B). In the
two different patterns: two Indonesian cultivars showed a strict
                                                                       first case the unreduced AB gamete brings 11 A and 11 B
A1:B2 ratio whereas the other two of unknown origin showed
                                                                       centromeres with possible HEs due to partial pairing between
the 1c pattern. Although a group of cooking cultivars from the
                                                                       homologous chromosomes (Fig. 7). In the second case HEs
Philippines, including ‘Saba’ (not in our samples), were re-
                                                                       are also possible but an unbalanced A/B centromere repre-
ported to be BBB (Valmayor et al., 1991; Sales et al., 2010), no
such pattern was identified in the present study. However, it is       sentation is expected due to the double dose of one of the
confirmed that the same vernacular name is used for genotypes          two subgenomes present in the allotriploid genotype. In the
with different ancestral origins. Pattern 1c shared some HEs           third case, 11 A and 11 B chromosomes are expected due to
with Indian patterns 1a and 1b, suggesting that these cultivars        the regular meiosis between homologous chromosomes, but
were also derived from an ancestor originating in the Indian           consequently homologous pairing producing HEs is expected
subcontinent.                                                          to be infrequent.
                                                                     - A × BB: a haploid M. acuminata gamete (A) meets a gamete
                                                                       (BB) originated from M. balbisiana by unreduced meiosis.
                                                                       Here, recombination between A and B genome cannot take
Undescribed subgroup                                                   place before the establishment of allotriploidy.
   The genotype ‘Chuoi mit’ (ITC1682) [misclassified as AB              For the two genotypes from Indonesia without detected HEs,
but determined as triploid by Christelová et al. (2017)] exhibited   both GCs are possible and cannot be discriminated by our
its own specific HE pattern (pattern 7) (Fig. 4). Morphological      method due to the possible presence of invisible balanced HEs
and genomic studies of additional genotypes would be required        (Fig. 7). Such case of balanced HE was probably revealed in
to support the creation of a new subgroup.                           the second arm of chr05 because of the aneuploidy in ‘Simili
                                                                     Radjah’ genotype (Fig. 5D) as none of the accessions with the
                                                                     same HE pattern (1b) showed a deviating ratio for this chromo-
West Oceania ABB
                                                                     some (Supplementary Data Material 4).

   In this study, ABB accessions from PNG revealed a spe-
cific pattern (pattern 6). Given the absence in this analysis of
                                                                     Routes involving primary AB hybrids
genotypes belonging to the Kalapua subgroup, originating
from PNG, we could not investigate its HE pattern. Therefore,           Based on our observations of unbalanced regions between
it should be investigated whether Kalapua accessions share           A and B genomes in allotriploids, we suggest that the diploid
the same HE pattern 6 (Fig. 4) or whether an additional pat-         gamete contributing to the allotriploid with patterns 2, 3, 6 and
tern from PNG exists. This would be a rationale to distinguish       7 originated from a nucleus restitution during a diploid hy-
East ABB and West Oceania, which are usually combined but            brid (AB) meiosis, which generated the observed chromosome
Cenci et al. — Unravelling the complex story of intergenomic recombination in ABB bananas 17
Hybrid AB To explain this observation, we hypothesize that the shared
HEs were already present in AB hybrids, which inherited them
from A and B gametes previously introgressed. These hybrids
(11 A + 11 B)
then produced unreduced gametes in which new HEs possibly
occurred during meiosis and gave rise to the allotriploid ances-
DNA replication tors of the three patterns 1a, 1b and 1c. Some recombination
2(11-N) 2N events could also have even been provided by M. balbisiana
haploid gametes contributing the second B subgenome. This
route could be formulated as (AbBa) × BaBa → AbBaBa. A pos-
sible scenario leading to patterns 1a, 1b and 1c is proposed in
Supplementary Data Material 5.
Unpaired chromosomes Paired chromosomes This hypothesis is supported by the observation of hy-
Meiosis I brid AB genotypes containing unbalanced regions (Fig. 1) in
Downloaded from https://academic.oup.com/aob/article/127/1/7/5760888 by guest on 08 August 2021
Failed reductional which four different HE patterns were found. These results
division imply that the respective M. balbisiana donor plants were all
introgressed with A genome portions. This suggests genetic
fluxes between M. acuminata (or AA) and M. balbisiana, par-
ticularly in India, where these unbalanced AB hybrids and ABB
Unrecombined Recombined
chromosomes
allotriploids originated and where cultivated M. balbisiana
chromosomes
are abundant (Subbaraya et al., 2006). Since in Musa chloro-
Meiosis II
Segregation in
plasts and mitochondria are inherited from the female and male
equational division gametes, respectively (Fauré et al., 1993) and both hybrid AB
cytotypes have an A origin for both chloroplasts and mitochon-
dria, the probable crossing scheme leading to the creation of
these hybrids must have involved M. acuminata or AA gam-
etes at least twice (Fig. 8). However, this implies the incom-
plete sterility of AB hybrids, which are able to produce not only
Balanced Balanced Unbalanced Balanced unreduced gametes (n = 2x = 22) but also viable reduced gam-
non-recombinant non- recombinant recombinant etes (n = x = 11), where A and B chromosomes recombine as in
recombinant an intraspecific context and segregate.
Interestingly, in these genotypes an interstitial region in the
Fig. 7. Scheme of chromosome fates in a hybrid AB meiosis producing
unreduced gametes. Blue and red colours represent chromosomes from
first arm of chr09 exhibits very similar HEs in allotriploids and
M. acuminata (A genome) and M. balbisiana (B genome), respectively. diploids, which again suggests common ancestry (Fig. 3). As
Recombinations are possible only between homologous chromosomes that already observed by Baurens et al. (2019), the subtelomeric re-
have undergone pairing. Recombinant chromosomes are detectable by SNP al- gion of the first arm of chr09 often appears to be enriched in the
lele analysis only if genome portions are unbalanced after segregation in the A genome (only patterns 2, 3 and 2x-1 are not). In our sample,
second meiotic division (equational).
in addition to the above-mentioned diploid and triploid HE pat-
terns, four patterns have independent HEs where the A genome
recombinations (Fig. 7). De Langhe et al. (2010) hypothesized has replaced the B counterpart in the subtelomeric region of the
that this route would be restricted to India due to the exclusive oc- first arm of chr09 (Fig. 3).
currence of AB in this country. However, since then AB hybrids
have also been collected in Indonesia (Hermanto et al., 2014a,
b), making possible routes involving AB hybrids also for ABB
genotypes with origins in South-East Asia and New Guinea. Routes leading to a B excess ratio
Patterns 4 and 5 are both characterized by a higher presence
of the B genome, with three and six B centromeres having re-
Routes leading to shared HEs placed the A counterpart, respectively. The absence of A centro-
meres (Fig. 4) is not consistent with a meiosis of an AB hybrid
The observed sharing of some unbalanced regions (Fig. 2) where FDR gametes were produced by a failed first meiotic
in HE patterns 1a, 1b and 1c cannot be explained by a simple division. On the other hand, 2x gametes produced by the failure
AB × B gamete combination. In fact, identical or very similar of equational division (SDR) are not expected to have an excess
deviating patterns (three unbalanced regions corresponding to of the B genome or to lack centromeres with an A2:B1 consti-
these three recombination events) are unlikely to be obtained tution, as observed in patterns 4 and 5.
three times by fully independent meiosis, and must have been The larger contribution of M. balbisiana to these cultivars is
transmitted independently through common ancestry. In other consistent with an unreduced n = 2x gamete originating from
words, the occurrence of partially shared patterns suggests re- a backcrossed diploid hybrid (originating in an n = x gamete
peated inheritance of the same HEs. Indeed, the reported differ- from an AB hybrid that met an n = x M. balbisiana gamete)
ences in chloroplast origin (Carreel et al., 2002; Boonruangrod crossed with a regular B gamete (Fig. 9). An unreduced gamete
et al., 2008) support independent crossing pathways for pat- from such a backcrossed hybrid (AbB or BaB) is expected
terns 1a, 1b and 1c (Table 1). to have pairs of B centromeres for approximately half of its18 Cenci et al. — Unravelling the complex story of intergenomic recombination in ABB bananas
x
M. acuminata M. balbisiana Chloroplast
Mitochondrion M. acuminata M. balbisiana
F1 (AB) M. balbisiana F1 (AB)
Inter-genomic
recombination
BC1F1 (ABB) M. balbisiana
Reduced gamete (n = x) and Unreduced gamete (n = 2x) and
Downloaded from https://academic.oup.com/aob/article/127/1/7/5760888 by guest on 08 August 2021
backcross with M. balbisiana triploidizationwith M. balbisiana
BCnFn (BAB) M. acuminata
Chromosome A
Chromosome B BC1F1 (AbB) Primary triploid (AbBaB)
Inter-genomic
recombination
Unreduced gamete (n = 2x) and n = 2x gamete and
F1 (BAA) triploidization with M. balbisiana triploidization with M. balbisiana
Fig. 8. Scheme of backcrosses generating introgressions of A genome in the
M. balbisiana parent of AB hybrids having genomic regions with an unex-
pected subgenome ratio. Blue and red colours represent chromosomes from
M. acuminata (A genome) and M. balbisiana (B genome), respectively.
chromosomes and A/B heterozygous centromeres for the other Triploid from backcrossed Secondary triploid (AbBaB)
half (Fig. 9). This can be formulated as AB × BB → AbB (or hybrid (AbBB) with B > A
with B > A
BaB) × BB → AbBB (or BaBB).
Alternatively, it can be hypothesized that a B-enriched n = 2x Fig. 9. Scheme of possible crossing pathways generating B-genome-rich
gamete could be produced by an ABB allotriploid. In this case, ABB patterns 4 and 5. Blue and red colours represent chromosomes from
according to random centromere segregation, one-third of the M. acuminata (A genome) and M. balbisiana (B genome), respectively.
centromeres are expected to be homozygous for B and two-
thirds are expected to be A/B heterozygous (Fig. 9). This would of potential useful variability to create new cultivars able to
be formulated as ABB × BB → AbBB. answer the numerous challenges in banana breeding. As an
Pattern 4, with three of 11 centromeres having an A0:B3 example, ABB bananas are hypothesized to be more drought-
ratio, fits with the second hypothesis, whereas pattern 5, with tolerant (van Wesemael et al., 2019). Knowing the origin of
six of 11 centromeres A0:B3, is more in agreement with first our current cultivars, and thus their potential parents, will help
one. However, due to the low number of Musa chromosomes breeders make the right choices for future crosses.
(11), those hypotheses cannot be excluded for both patterns. Compared with previous analysis methods to assess the gen-
Somehow, independent origin of patterns 4 and 5 is supported etic diversity of the banana gene pool, whole-genome surveying
by the completely different HEs and by the different crossing based on next-generation sequencing (NGS; RADSeq in this
history that is inferred from the organelle origin. ‘Kluai Tiparot’ study) provides a detailed and exhaustive picture of the genome
(pattern 5) has both organelles originating from M. balbisiana, composition. Therefore, we recommend complementing SSR-
whereas ‘Pelipita’ (pattern 4) has chloroplasts inherited based characterization with NGS technologies such as RADSeq
from M. acuminata and mitochondria from M. balbisiana as a standard method to characterize banana gene bank acces-
(Boonruangrod et al., 2008). sions and to classify them in an objective, timely and repeatable
way.
Conclusions and perspectives SUPPLEMENTARY DATA
The results of this study demonstrate multiple origins of Supplementary data are available online at https://academic.
ABB cultivars, with different and sometimes complex routes. oup.com/aob and consist of the following. Material 1: number
It is possible that extension of RADSeq genome surveying to of SNPs assigned to each chromosome and to chloroplasts/
other cultivars will allow the discovery of additional HE pat- mitochondria in the analysed cultivars. Material 2: diversity
terns, in both AB hybrids and in allotriploids. The frequent oc- tree based on SNPs in regions not involved in HE in any of the
currence of HEs indicate that A and B subgenomes are prone analysed genotypes. Material 3: number of HEs in ABB and
to recombination, making the M. balbisiana genome a source AB patterns. Material 4: hidden HEs revealed by aneuploidy.Cenci et al. — Unravelling the complex story of intergenomic recombination in ABB bananas 19
Chr05 pattern of ‘Blue Java’ and ‘Simili Radjah’. Material 5: D’Hont A, Paget-Goy A, Escoute J, Carreel F. 2000. The interspecific genome
schema of possible crossing pathways to HE patterns 1a, 1b structure of cultivated banana, Musa spp. revealed by genomic DNA in
situ hybridization. Theoretical and Applied Genetics 100: 177–183.
and 1c. D’Hont A, Denoeud F, Aury JM, et al. 2012. The banana (Musa acuminata)
genome and the evolution of monocotyledonous plants. Nature 488:
213–217.
FUNDING Droc G, Larivière D, Guignon V, et al. 2013. The banana genome hub.
Database 2013: bat035.
This work was supported by the Directorate-general Develop Edger PP, Poorten TJ, VanBuren R, et al. 2019. Origin and evolution of the
ment Cooperation and Humanitarian Aid (‘Developing climate- octoploid strawberry genome. Nature Genetics 51: 541–547.
Fauré S, Noyer JL, Horry JP, Bakry F, Lanaud C, Gońzalez de León D.
smart bananas for the African Great Lakes region’), financed by 1993. A molecular marker-based linkage map of diploid bananas (Musa
the Belgian Development Cooperation and by donors through acuminata). Theoretical and Applied Genetics 87: 517–526.
their contributions to the CGIAR Fund, and in particular to the Guo H, Wang X, Gundlach H, et al. 2014. Extensive and biased intergenomic
CGIAR Research Program, Roots, Tubers and Bananas. The nonreciprocal DNA exchanges shaped a nascent polyploid genome,
funders had no role in study design, data collection and analysis, Gossypium (cotton). Genetics 197: 1153–1163.
Downloaded from https://academic.oup.com/aob/article/127/1/7/5760888 by guest on 08 August 2021
He Z, Wang L, Harper AL, et al. 2017. Extensive homoeologous genome ex-
interpretation of results, decision to publish, or preparation of the changes in allopolyploid crops revealed by mRNAseq-based visualization.
manuscript. Plant Biotechnology Journal 15: 594–604.
Hermanto C, Sutanto A, Daniells J, et al. 2014a. Triangle banana explor-
ation report, North Sulawesi and North Maluku, Indonesia, 6–24 October
ACKNOWLEDGEMENTS 2012. Montpellier: Bioversity International.
Hermanto C, Sutanto A, Daniells J, et al. 2014b. Triangle banana explor-
We thank BGI for their technical assistance and services for ation report, Central Maluku and Lesser Sunda Islands, Indonesia, 16
February–6 March 2013. Montpellier: Bioversity International.
the RAD sequencing. Acknowledgements are also due to the Hippolyte I, Jenny C, Gardes L, et al. 2012. Foundation characteristics of
various colleagues that helped us to access some materials: edible Musa triploids revealed from allelic distribution of SSR markers.
Ines Van den Houwe (alliance Bioversity-CIAT) for accessions Annals of Botany 109: 937–951.
from ITC; Matthew Turner (Amami Biodiversity Garden) for Hřibová E, Čížková J, Christelová P, Taudien S, Langhe E de, Doležel J.
M. balbisiana samples; and Agus Sutanto (ICHORD) and Jeff 2011. The ITS1-5.8S-ITS2 sequence region in the Musaceae: structure,
diversity and use in molecular phylogeny. PLoS ONE 6: e17863.
Daniells (DAF) for the M. acuminata samples. Finally, we thank Hurgobin B, Golicz AA, Bayer PE, et al. 2018. Homoeologous exchange
Françoise Carreel, Angélique D’Hont and Franc-Christophe is a major cause of gene presence/absence variation in the amphidiploid
Baurens (CIRAD) for useful discussions. Brassica napus. Plant Biotechnology Journal 16: 1265–1274.
Janssens SB, Vandelook F, De Langhe E, et al. 2016. Evolutionary dynamics
and biogeography of Musaceae reveal a correlation between the diversi-
fication of the banana family and the geological and climatic history of
LITERATURE CITED Southeast Asia. New Phytologist 210: 1453–1465.
Baurens FC, Martin G, Hervouet C, et al. 2019. Recombination and Jenny C, Carreel F, Bakry F. 1997. Revision on banana taxonomy: Klue
large structural variations shape interspecific edible bananas genomes. Tiparot (Musa sp) reclassified as a triploid. Fruits 2: 83–91.
Molecular Biology and Evolution 36: 97–111. Jenny C, Holtz Y, Horry J-P, Bakry F. 2011. Synthesis of new interspe-
Boonruangrod R, Desai D, Fluch S, Berenyi M, Burg K. 2008. Identification cific triploid hybrids from natural AB germplasm in banana (Musa sp.).
of cytoplasmic ancestor gene-pools of Musa acuminata Colla and Musa In: VII International Symposium on Banana: ISHS-ProMusa Symposium
balbisiana Colla and their hybrids by chloroplast and mitochondrial on Bananas and Plantains: Towards Sustainable Global Production 986,
haplotyping. Theoretical and Applied Genetics 118: 43–55. 209–217.
Carpentier SC, Panis B, Renaut J, et al. 2011. The use of 2D-electrophoresis Jeridi M, Bakry F, Escoute J, et al. 2011. Homoeologous chromosome
and de novo sequencing to characterize inter- and intra-cultivar protein pairing between the A and B genomes of Musa spp. revealed by genomic
polymorphisms in an allopolyploid crop. Phytochemistry 72: 1243–1250. in situ hybridization. Annals of Botany 108: 975–981.
Carreel F, Gonzalez de Leon D, Lagoda P, et al. 2002. Ascertaining maternal Karamura E, Frison E, Karamura D, Sharrock S. 1998. Banana production
and paternal lineage within Musa by chloroplast and mitochondrial DNA systems in eastern and southern Africa. In: Picq C, Foure E, Frison EA,
RFLP analyses. Genome 45: 679–692. eds. Bananas and food security. Montpellier: INIBAP, 401–412.
Cenci A, Hueber Y, Zorrilla-Fontanesi Y, et al. 2019. Effect of paleopolyploidy Kissel E, van Asten P, Swennen R, Lorenzen J, Carpentier SC. 2015.
and allopolyploidy on gene expression in banana. BMC Genomics 20: 244. Transpiration efficiency versus growth: exploring the banana biodiversity
Christelová P, Langhe ED, Hřibová E, et al. 2017. Molecular and cytological for drought tolerance. Scientia Horticulturae 185: 175–182.
characterization of the global Musa germplasm collection provides in- Li H, Durbin R. 2009. Fast and accurate short read alignment with Burrows-
sights into the treasure of banana diversity. Biodiversity and Conservation Wheeler transform. Bioinformatics 25: 1754–1760.
26: 801–824. Lloyd A, Blary A, Charif D, et al. 2018. Homoeologous exchanges cause
Čížková J, Hřibová E, Humplíková L, Christelová P, Suchánková P, extensive dosage-dependent gene expression changes in an allopolyploid
Doležel J. 2013. Molecular analysis and genomic organization of major crop. New Phytologist 217: 367–377.
DNA satellites in banana (Musa spp.). PLoS ONE 8: e54808. Martin M. 2011. Cutadapt removes adapter sequences from high-throughput
Daniells J. 2001. Musalogue: a catalogue of Musa germplasm: diversity in the sequencing reads. EMBnet.Journal 17: 10.
genus Musa. Bioversity International. Martin G, Baurens FC, Droc G, et al. 2016. Improvement of the banana “Musa
De Langhe E. 2002. Banana diversity in the Middle East (Jordan, Egypt acuminata” reference sequence using NGS data and semi-automated bio-
and Oman). Montpellier: International Network for the Improvement of informatics methods. BMC Genomics 17: 243.
Banana and Plantain (INIBAP), 1–56. McKenna A, Hanna M, Banks E, et al. 2010. The Genome Analysis Toolkit:
De Langhe E, Langhe ED, Vrydaghs L, Maret P de, Perrier X, Denham T. a MapReduce framework for analyzing next-generation DNA sequencing
2009. Why bananas matter: an introduction to the history of banana do- data. Genome Research 20: 1297–1303.
mestication. Ethnobotany Research and Applications 7: 165–177. Noumbissié GB, Chabannes M, Bakry F, et al. 2016. Chromosome segre-
De Langhe E, Hribová E, Carpentier S, Dolezel J, Swennen R. 2010. Did gation in an allotetraploid banana hybrid (AAAB) suggests a transloca-
backcrossing contribute to the origin of hybrid edible bananas? Annals of tion between the A and B genomes and results in eBSV-free offsprings.
Botany 106: 849–857. Molecular Breeding 36: 38.You can also read