Measurement Study of Netflix, Hulu, and a Tale of Three CDNs
←
→
Page content transcription
If your browser does not render page correctly, please read the page content below

1

  Measurement Study of Netflix, Hulu, and a Tale of
                   Three CDNs
Vijay K Adhikari, Yang Guo, Fang Hao, Member, IEEE, Volker Hilt, Member, IEEE, Zhi-Li Zhang, Fellow, IEEE,
                            Matteo Varvello, Member, IEEE, and Moritz Steiner

   Abstract—Netflix and Hulu are leading OTT (Over-The-Top)                  technically challenging. Because of their popularity and size,
content service providers in the US and Canada. Netflix alone                the design and traffic management decisions of these services
accounts for 29.7% of the peak downstream traffic in US in                   also have a profound impact on the Internet infrastructure.
2011. Understanding the system architectures and performance
of Netflix and Hulu can shed light on the design of such large                  In this paper we provide a detailed analysis of the Netflix
scale video streaming platforms, and help improving the design of            and Hulu architectures, which are designed to serve massive
future systems. In this paper, we perform extensive measurement              amount of content by combining multiple third party services.
study to uncover their architectures and service strategies. Netflix         For instance, Netflix heavily utilizes Amazon cloud service [3],
and Hulu bear many similarities. Both Netflix and Hulu video                 replacing in-house IT by Amazon Web Service (AWS), and us-
streaming platforms rely heavily on the third-party infrastruc-              ing Amazon SimpleDB, S3 and Cassandra for file storage [3].
tures, with Netflix migrating majority of its functions to Amazon            Microsoft Silverlight [4] is employed as the video playback
cloud, while Hulu hosting its services out of Akamai. Both service           platform for Netflix desktop users. Both Netflix and Hulu
providers employ the same set of three CDNs in delivering the                use Akamai, Limelight, and Level3 CDNs for video content
video contents. Using active measurement study, we dissect several
                                                                             delivery. Such third-party service based architecture can be
key aspects of OTT streaming platforms of Netflix and Hulu,
e.g., employed streaming protocols, CDN selection strategy, user             regarded as a system design blueprint by future OTT content
experience reporting, etc. We discover that both platforms assign            service providers.
the CDN to a video request without considering the network                      Despite the popularity of Netflix and Hulu, surprisingly few
conditions and optimizing the user perceived video quality. We               studies have been looking into their streaming service plat-
further conduct the performance measurement studies of the                   forms. In order to understand the architectural design issues
three CDNs employed by Netflix and Hulu. We show that                        of such large-scale video streaming service platforms and their
the available bandwidth on all three CDNs vary significantly
                                                                             implications, we conducted extensive measurement studies
over the time and over the geographic locations. We propose
a measurement-based adaptive CDN selection strategy and a                    from June 2011 to October 2011, with initial results being pub-
multiple-CDN-based video delivery strategy that can significantly            lished in [5], [6]. This journal version paper integrates/unifies
increase users’ average available bandwidth.                                 the results from [5], [6], and offers a comprehensive treatment
                                                                             of two most popular content distribution platforms. The issues
   Index Terms—Netflix, Hulu, video streaming, Content Distribu-             common for both platforms are carefully compared, while their
tion Networks (CDN), OTT (Over-The-Top) content service, CDN
selection strategy.
                                                                             differences are stressed. In particular, we have investigated
                                                                             the interactions between different components of such an
                                                                             architecture, and analyzed the strategies used by Netflix and
                        I.   I NTRODUCTION                                   Hulu that provide the glue to piece together the overall system.
                                                                             We have also looked into the implications of these design
N     ETFLIX and Hulu are the leading subscription-based
      video streaming service providers for movies and TV
shows. By April 2014, Netflix attracts more than 35 mil-
                                                                             decisions on CDNs, underlying ISP networks as well as end
                                                                             user quality-of experience (QoE).
lion subscribers in US alone, and about 48 millions world                       To the best of our knowledge, we are the first to take a
wide [1]. It is the single largest source of Internet traffic,               systematic look into the architecture of these video streaming
consuming 29.7% of peak downstream traffic in 2011 [2]. Like                 platforms together with an extensive measurement study of
Netflix, Hulu also has a large viewer base, with 38 million                  three CDNs they employ. Our results suggest the plausible
casual viewers who watches Hulu at least once a year, and                    role of business relations between Netflix/Hulu and CDNs in
3 million paying subscribers. Both providers offer video at                  constraining how a content provider decides which CDN to
multiple quality levels, capable of adapting to user’s available             select to serve streaming videos to end users, and reveal the
bandwidth. Designing such large scale, fast growing video                    differing CDN selection strategies used by Netflix and Hulu to
streaming platforms with high availability and scalability is                meet the business constraints. Furthermore, our measurement
                                                                             results demonstrate that the CDN selection strategies employed
  Vijay K Adhikari is with Microsoft, Redmond, WA.                           by Netflix and Hulu do not necessarily provide the best
  Yang Guo, Fang Hao, Volker Hilt, and Matteo Varvello are with Bell Labs,   possible QoE to end users, thus highlighting a key trade-off in
Alcatel-Lucent.
  Zhi-Li Zhang is with University of Minnesota - Twin Cities.                CDN selection decision making: business constraints vs. end
  Moritz Steiner is with Akamai Technologies, San Francisco, CA 94103.       user QoE. To illustrate how this trade-off can be effectively
This work was done while Moritz was with Bell-Labs.                          exploited, we propose new video delivery strategies that can
2

                                                                                     TABLE I.       K EY N ETFLIX H OSTNAMES
significantly improve the user QoE by effectively utilizing
multiple CDNs, while still conforming to the business con-               Hostname                                          Organization
                                                                         www.netflix.com                                   Netflix
straints. The main contributions of this paper are summarized            signup.netflix.com                                Amazon
as follows:                                                              movies.netflix.com                                Amazon
                                                                         agmoviecontrol.netflix.com                        Amazon
   • We dissect the basic architecture of the two popular                nflx.i.87f50a04.x.lcdn.nflximg.com                Level 3
       video streaming platforms by monitoring the commu-                netflix-753.vo.llnwd.net                          Limelight
       nications between the client-side player and various              netflix753.as.nflximg.com.edgesuite.net           Akamai
       components of the two platforms.
   • We analyze how Netflix and Hulu make use of multiple
       CDNs under changing bandwidth conditions. We find           capabilities, and content types influence the streaming parame-
       that both Netflix and Hulu players stay with the same       ters. Finally, we focus on the Netflix CDN assignment strategy.
       CDN even if the other CDNs may offer better video           Using dummynet [9] to strategically throttle individual CDN’s
       quality. In addition, Netflix tends to tie preferred CDNs   bandwidth, we discover how Netflix makes use of multiple
       with user accounts, while Hulu randomly selects the         CDNs in face of bandwidth fluctuation.
       preferred CDN for individual video playback following
       an underlying CDN utilization distribution. Such CDN        A. Overview of Netflix architecture
       selection decisions are likely tied to – and constrained       To observe the basic service behavior, we create a new
       by – the business relations between the content providers   user account, login into the Netflix website and play a movie.
       and CDNs.                                                   We monitor the traffic during all of this activity and record
   • We perform an extensive bandwidth measurement study           the hostnames of the servers involved in the process. We
       of the three CDNs used by Netflix and Hulu. The             then perform DNS resolutions to collect the canonical names
       results show that there are significant variations in CDN   (CNAMEs) and IP addresses of all the server names that
       performance across time and geo-locations. These results    the browser have contacted. We also perform WHOIS[7]
       imply that the (static) CDN selections made by Netflix      lookups for the IP addresses to find out their owners. Table
       and Hulu do not necessarily provide the best QoE to end     I summarizes the most relevant hostnames and their owners.
       users.                                                      Fig. 1 shows the basic architecture for Netflix video streaming
   • Finally, we explore alternative strategies for improv-        platform. It consists of four key components: Netflix data
       ing video delivery performance using multiple CDNs          center, Amazon cloud, CDNs and players.
       while conforming to the business constraints. Our study
       shows that selecting the best serving CDN based on a
       small number of measurements at the beginning of each
       video session can deliver more than 12% bandwidth
       improvement over the static CDN assignment strategy
       currently employed by Netflix. Furthermore, using mul-
       tiple CDNs simultaneously can achieve more than 50%
       improvement. Higher available bandwidth opens doors
       for supporting ever improving video quality (thus higher
       video bit-rate), and new services such as 3D movies
       and/or multiple concurrent movies in a single household.
   The paper is organized as follows. Section II and Section III
describe the architectures of Netflix and Hulu video streaming
platforms and their CDN selection strategy. Section IV presents    Fig. 1.   Netflix architecture
our measurement study of the three CDNs. Section V explores
the alternative strategies for CDN assignment in order to             Netflix data centers. Our analysis reveals that Net-
improve video delivery performance. Section VI discusses the       flix uses its own IP address space for the hostname
related work. Finally, Section VII concludes the paper and         www.netflix.com. This server primarily handles two key
discusses the future work.                                         functions: (a) registration of new user accounts and cap-
                                                                   ture of payment information (credit card or Paypal ac-
                                                                   count), and (b) redirect users to movies.netflix.com or
        II. N ETFLIX VIDEO STREAMING PLATFORM                      signup.netflix.com based on whether the user is logged
   We start the section with the overview of Netflix video         in or not respectively. This server does not interact with the
streaming platform architecture. We dissect the architecture via   client during the movie playback, which is consistent with the
traffic monitoring, DNS resolutions, and WHOIS[7] lookup.          recent presentation from Netflix team [10].
We then present the timeline of serving a single Netflix client       Amazon cloud. Except for www.netflix.com
as an example to illustrate the interplay between a Netflix        which is hosted by Netflix, most of the other Netflix
player and various service components. We further collect a        servers such as agmoviecontrol.netflix.com and
large number of video streaming manifest files using Tamper        movies.netflix.com are served off the Amazon
Data add-on[8], and analyze how geographic locations, client       cloud [11]. [10] indicates that Netflix uses various Amazon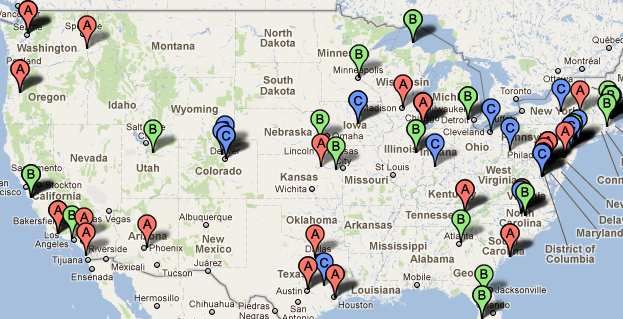
3

Reporting (Amazon Cloud)
          Audio chunk (CDN)
          Video chunk (CDN)
             Trickplay (CDN)
 Manifest (Amazon Cloud)
    Player (Amazon Cloud)

                                                  50      100              150                 200            250               300
                                                                Number of seconds from start

Fig. 2.    Timeline in serving a Netflix client

cloud services, ranging from EC2 and S3, to SDB and                    1) Silverlight player download and user authentication:
VPC [11]. Key functions, such as content ingestion, log             Video playback on a desktop computer requires the Microsoft
recording/analysis, DRM, CDN routing, user sign-in, and             Silverlight browser plug-in to be installed on the computer.
mobile device support, are all done in Amazon cloud.                When the user clicks on “Play Now” button, the browser
   Content Distribution Networks (CDNs). Netflix employs            downloads the Silverlight application and then that application
multiple CDNs to deliver the video content to end users. The        starts downloading and playing the video content. This small
encoded and DRM protected videos are sourced in Amazon              Silverlight application is downloaded for each video playback.
cloud and copied to CDNs. Netflix employs three CDNs:
                                                                       2) Netflix manifest file: Netflix video streaming are con-
Akamai, LimeLight, and Level-3. For the same video with the
                                                                    trolled by instructions in a manifest file that the Silverlight
same quality level, the same encoded content is delivered from
                                                                    client downloads. The Netflix manifest file provides the DASH
all three CDNs. In Section II-D we study the Netflix strategy
                                                                    player metadata to conduct the adaptive video streaming.
used to select these CDNs to serve videos.
                                                                    The manifest files are client-specific, i.e., they are generated
   Players. Netflix uses Silverlight to download, decode and
                                                                    according to each client’s playback capability. For instance,
play Netflix movies on desktop web browsers. The run-time
                                                                    if the user player indicates it is capable of rendering h.264
environment for Silverlight is available as a plug-in for most
                                                                    encoded video, h.264 format video is included in the manifest
web browsers. There are also players for mobile phones and
                                                                    file. If the player indicates that it can only play back .wmv
other devices such as Wii, Roku, etc. This paper, however,
                                                                    format, only .wmv format video is included.
focuses on Silverlight player running on desktop PCs.
   Netflix uses the DASH (Dynamic Streaming over HTTP)                 The manifest file is delivered to end user via SSL connection
protocol for streaming. In DASH, each video is encoded              and hence the content of the file cannot be read over the wire
at several different quality levels, and is divided into small      using packet capture tools such as tcpdump or wireshark. We
‘chunks’ - video segments of no more than a few seconds in          use Firefox browser and Tamper Data plug-in to extract the
length. The client requests one video chunk at a time via HTTP.     manifest files. The extracted manifest file is in XML format
With each download, it measures the received bandwidth and          and contains several key pieces of information including the
runs a rate determination algorithm to determine the quality        list of the CDNs, location of the trickplay data, video/audio
of the next chunk to request. DASH allows the player to freely      chunk URLs for multiple quality levels, and timing parameters
switch between different quality levels at the chunk boundaries.    such as time-out interval, polling interval and so on. The
                                                                    manifest file also reveals interesting information on the Netflix
B. Servicing a Netflix client                                       system architecture. For instance, they show that Netflix uses
                                                                    three CDNs to serve the videos. Different ranks are assigned
   We now take a closer look at the interaction between the
                                                                    to different CDNs to indicate to the clients which CDN is
client web browser and various web servers involved in the
                                                                    more preferred than others. A section of one of the manifest
video playback process. Fig. 2 shows the timeline along which
                                                                    files is shown in Fig. 3, where Level3 is listed as the most
the streaming service is provided to a desktop client, and
                                                                    preferred CDN for this client. We will conduct more elaborate
indicates the involved server entities. The X-axis in this figure
                                                                    experiments and discuss more details of the manifest files later
shows the time from the beginning of the experiment to 5
                                                                    in this section.
minutes and the Y-axis lists different activities. The client
first downloads the Microsoft Silverlight application from             3) Trickplay: Netflix Silverlight player supports simple
movies.netflix.com and authenticates the user. After                trickplay such as pause, rewind, forward and random seek.
authentication, the player fetches the manifest file from the       Trickplay is achieved by downloading a set of thumbnail
control server at agmoviecontrol.netflix.com, based                 images for periodic snapshots. The thumbnail resolution, pixel
on which it starts to download trickplay data and audio/video       aspect, trickplay interval, and CDN from where to download
chunks from different CDNs. Client reports are sent back to         the trickplay file are described in the manifest file. The
the control server periodically. We describe further details of     trickplay interval for the desktop browser is 10 seconds, and
individual activities below.                                        multiple resolutions and pixel aspects are provided.
4

                                                           5) User experience reporting: After the playback starts,
                  level3                    Netflix player communicates periodically with the control
                  6                       server agmoviecontrol.netflix.com. Based upon the
                  1                         keywords such as “/heartbeat” and “/logblob” in the request
                  140

                                                                   URLs and the periodicity of the communication, we conjecture
                                                         that they are periodic keep alive messages and log updates.
                  limelight                 However, the actual messages that we have extracted by using
                  4                       Tamper Data do not appear to be in clear text and hence we
                  2                         cannot verify it further.
                  120

                                                         C. Manifest file analysis
                  akamai                       A manifest file is delivered over the SSL connection. We
                  9
                  3
                                                                   use Tamper Data plug-in for Firefox browser to read the file.
                  100                   Since the manifest files contain a wealth of information and
                                                        shed lights on the Netflix strategies, we conduct a large scale
                                                       experiment by collecting and analyzing a number of manifest
                                                                   files. We are interested in understanding how geographic
Fig. 3.   CDN list in manifest file
                                                                   locations, client capabilities, and content type (e.g., popular vs
                                                                   unpopular, movies vs TV shows) may impact the streaming
                                                                   parameters. We use six different user accounts, 25 movies
   4) Audio and video chunk downloading: As shown in Fig. 2,       of varying popularity, age and type, four computers with
audio and video contents are downloaded in chunks. Download        Mac and Windows systems at four different locations for this
sessions are more frequent at the beginning so as to build up      experiment. From each computer, we log into Netflix site using
the player buffer. Once the buffer is sufficiently filled, down-   each of the user accounts and play all of the movies for few
loads become periodic. The interval between the beginning of       minutes to collect the manifest files. In addition to using client
two consecutive downloads is approximately four seconds -          machines located in different geographies, we also configure
the playback length of a typical chunk.                            those client browsers to use Squid proxy servers running on
   The manifest file contains multiple audio and video quality     ten PlanetLab nodes hosted by US universities in different
levels. For each quality level, it contains the URLs for indi-     geographic regions to collect additional manifest files.
vidual CDNs, as shown in Fig. 4.                                      1) CDN ranking and user accounts: Netflix manifest files
                                                                   rank CDNs to indicate which CDNs are preferred. CDN
   560                                ranking determines from which CDN the client downloads the

      playready-h264mpl30-dash                                     video and may affect user perceived video quality. We analyze
                                               the collected manifest files to understand the factors that affect
                                                  the rankings of the CDNs. For this analysis, we build a table
      512                                 that lists CDN ranking for each combination of user account,
      384

                                                                   client computer (or PlanetLab proxy), movie ID and time of
                                                 day for several days. Analysis of this table suggests that the
      4                                   CDN ranking is only based upon the user account. For a given
      3                                 user account, the CDN ranking in the manifest file remains
   v                                            the same irrespective of movie types, computers, time and

                                                 locations. Furthermore, for the same movie, computer, location
         131xxx                 and around the same time, two different users may see different
         6                                CDN rankings. We also observe that the CDN ranking for each
         http://nflx.i.../...                 user account remains unchanged for at least several days. Such

                                                                   assignment of ranking seems to be independent of available
         131xxx                 bandwidth from each CDN as shown in the Section IV.
         4                                   2) Audio/Video bit rates: Netflix serves videos in multiple
         http://netflix.../...                formats and bit rates. When a Netflix client requests for the
                                                manifest file from Netflix, the client indicates the formats

         131xxx
                                                                   of the content it can play. Netflix server then sends back
         9                                a manifest file based upon the client request. For instance,
         http://netflix.../...                Netflix client running on an older computer (Thinkpad T60
                                                with Windows XP) and a newer computer (Macbook Pro with
                                               Snow Leopard) have different capabilities and receive different
Fig. 4.   Video downloadable for one quality level                 video downloading format and bit rates.
                                                                      Based on the client capabilities, the server sends URLs for
                                                                   the video and audio chunks in the returned manifest files.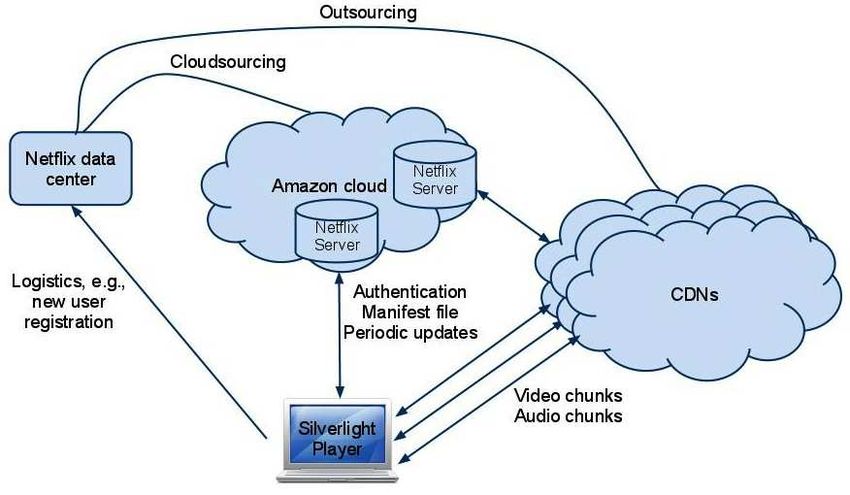
5

In general, manifest files contain information about video
chunks encoded in bit rates between 100Kbps to 1750Kbps
(and 2350Kbps and 3600Kbps for videos available in HD) for
the manifest files sent to the newer computer. We see that
videos available in HD can be served in up to 14 different
bit rates whereas non-HD content can be served in up to 12
different bit rates. We also note that Netflix clients do not try
all possible available bit rates when trying to determine the        Fig. 6.   High-level Hulu architecture
optimal playback rate.
                                                                     major component of Hulu, where short advertisement clips are
D. CDN selection strategy                                            typically delivered to users prior to the main video content.
                                                                        We employ methodologies similar to the ones used in the
   We have seen that a Netflix client can choose different video     Netflix study in studying Hulu. We play multiple videos on
bit rates and different CDNs for video downloading. In this          different web browsers from multiple locations with different
section we conduct experiments to help understand how Netflix        ISPs, with or without firewalls and proxy servers. We also
make such choices when bandwidth is dynamic. We play a               corroborate several of these observations using what has been
single movie from the beginning. Once the playback starts, we        published on Hulu’s help pages and blogs. A high level
gradually throttle the available bandwidth of the top ranked         Hulu architecture for desktop clients is shown in Figure 6.
CDN in the manifest file. We use dummynet to throttle the            The client gets the HTML pages for the video from Hulu’s
inbound bandwidth to the client.                                     front-end web server at www.hulu.com. It then contacts
   At the beginning, servers from each CDN are allowed to            s.hulu.com to obtain a manifest file that describes the
send data at 3,900Kbps. After every minute, we reduce the            server location, available bit-rates and other details. The client
available bandwidth for the current CDN by 100Kbps till it           uses the instruction in the manifest file to contact a video
reaches 100Kbps. At that point we start throttling the next          server to download the video. The client also periodically sends
CDN in the same way and so on. We plot our observation               its status report to t.hulu.com. The similarity between the
in Fig. 5. In this figure, the X-axis shows the time starting        Netflix architecture and the Hulu architecture is striking - both
from the beginning of playback. The Y-axis shows both the            platforms utilize the third-party commercial data centers and
throttled bandwidth and the playback rate. In this instance,         multiple CDNs to flexibly scale up/down to accommodate for
Level3, Limelight and Akamai CDNs are ranked first, second           the changing user population.
and third respectively. The client starts downloading video             Bandwidth Requirements. Hulu videos are streamed at
chunks from the first CDN. In the beginning, it starts from          480Kbps and 700Kbps. A few videos can also be streamed
a low bit rate and gradually improves the bit rate in a probing      at 1000Kbps. HuluPlus subscribers can also access videos in
fashion. As we lower the available bandwidth for the first CDN       HD quality when available. Clients can switch between bit-
while leaving the other CDNs intact, we notice something             rates during playback based on available bandwidth, as we
interesting. Instead of switching to a different CDN, which          will explain later.
is not throttled, the client keeps lowering the bit rate and stays      CDNs. Hulu emply the same three CDNs as Netflix to
with the first CDN. Only when it can no longer support even          deliver video contents to users. Based on manifest files, a Hulu
the very low quality level (i.e. when the available bandwidth        client is first assigned a preferred CDN hostname, and then
for the first CDN reaches 100Kbps), it switches to the second        uses DNS to select a server IP address.
CDN. It repeats almost the same behavior as we leave the first          Streaming Protocol. Hulu uses encrypted RTMP (Real
CDN at 100Kbps and gradually lower the available bandwidth           Time Messaging Protocol) to deliver movies to desktop
for the second CDN while leaving the third CDN intact. In            browsers. Hulu videos can be delivered over raw RTMP on
general, the Netflix clients stay with the same CDN as long as       port 1935 or RTMP tunneled over HTTP (RTMPT). Our exper-
possible even if it has to degrade the playback quality level.       iments reveal that Level3 prefers raw RTMP whereas Akamai
                                                                     and Limelight prefers RTMPT. All three CDNs use RTMPT
         III.   H ULU   VIDEO STREAMING PLATFORM                     when TCP port 1935 is blocked (by a firewall for instance).
                                                                     HuluPlus on a desktop browser uses the same technologies
   Besides Netflix, Hulu is another major OTT (Over-The-Top)
                                                                     and protocols. However, on mobile devices HuluPlus uses
video service provider that does not own extensive infras-
                                                                     adaptive streaming over HTTP. For instance, on iPhone and
tructure yet manages to support large scale video streaming
                                                                     iPad, HuluPlus content is delivered over HTTP LiveStream-
service. Examining the similarity and discrepancy of Netflix
                                                                     ing technology[12]. Hulu advertisements are single .FLV files.
and Hulu’s respective video streaming platform and employed
                                                                     These files are small (a few megabytes) and are downloaded
technologies shall shed light on the state-of-the-art of the video
                                                                     over single HTTP transactions.
streaming platform design. Unlike Netflix, Hulu offers both
subscription based service (called HuluPlus) and free service.
Free service is for desktop users, while HuluPlus supports           A. CDN Selection Strategy
additional platforms, e.g., set-top boxes, mobile devices, etc.,       Analyzing the captured packet traces, we find that Hulu
and offers HD video quality. Video advertisement is another          uses only one CDN server throughout the duration of a
6

                 Allowed bandwidth/Observed bitrate (in Kbps)
                                                                4000
                                                                                                                                     Bitrate − LimeLight
                                                                3500                                                                 Bitrate − Level3
                                                                                                                                     Bitrate − Akamai
                                                                3000
                                                                                                                                     Bandwidth − LimeLight
                                                                2500                                                                 Bandwidth − Level3
                                                                                                                                     Bandwidth − Akamai
                                                                2000

                                                                1500

                                                                1000

                                                                500

                                                                  0
                                                                       0   1000   2000   3000          4000           5000         6000           7000       8000
                                                                                           Number of seconds from start

Fig. 5.   CDN switching

video. But interestingly, it usually switches to a different                                             C. Manifest Files and CDN Usage Analysis
CDN for the next video. To further understand how network                                                   Hulu clients follow the manifest files they receive from
conditions affect player behavior and CDN selection strategy,                                            the server to decide which CDN to use. Since Hulu encrypts
we conduct the same bandwidth throttling experiment as in                                                the manifest file sent to the client, the manifest files from
Netflix measurement study. At the beginning, servers from                                                the network traces are not readable. We collect the manifest
each CDN are allowed to send data at 1501 Kbps. At the                                                   files using a tool called get-flash-videos[13]. A small
end of every minute, we reduce the available bandwidth for                                               section of an example Hulu manifest file is shown in Fig. 7.
the current active CDN by 100 Kbps till it reaches 1 Kbps.                                               The last line in the figure shows Hulu’s CDN preference in
As we lower the available bandwidth for the current CDN                                                  that manifest file. When we examine CDN preferences in a
while leaving the other CDNs intact, we notice that instead                                              few manifest files, we observe that the preferred CDN varies
of switching to a different CDN, which is not throttled, the                                             from one manifest file to another. For instance, when we make
client keeps lowering the bit-rate and stays with the original                                           two sequential requests for the same video, the preferred CDNs
CDN. This indicates that Hulu adapts to changing bandwidth                                               for those two requests can be different.
by adjusting the bit-rates and continues to use the same CDN
server as long as possible. Only when the current CDN server                                             ’title’ => ’Soldier Girls’,
                                                                                                         ’tp:Ad_Model’ => ’longform’,
is unable to serve the lowest possible bit-rate, it switches to a                                        ’tp:Frame_Rate’ => ’25’,
different CDN server. In summary, for a single video playback,                                           ’dur’ => ’4991138ms’,
Hulu’s CDN selection strategy is very similar to that of Netflix.                                        ’tp:enableAdBlockerSlate’ => ’true’,
                                                                                                         ’tp:Aspect_Ratio’ => ’4x3’,
                                                                                                         ’tp:BugImageURL’ => ’’,
B. User Experience Reporting                                                                             ’tp:researchProgram’ => ’’,
                                                                                                         ’tp:comScoreId’ => ’’,
   From the packet trace, we find that the Hulu player sends                                             ’tp:hasBug’ => ’false’,
periodic reports to a server that includes detailed information                                          ’tp:defaultBitrate’ => ’650_h264’,
                                                                                                         ’tp:primarySiteChannelNielsenChannelId’ => ’71’,
about the status of the client machine at that time, the CDN                                             ’tp:CP_Promotional_Link’ => ’’,
servers for video content and advertisements, and any problems                                           ’tp:CPIdentifier’ => ’ContentFilm’,
encountered in the recent past. These periodic status reports                                            ’tp:Primary_Category’ => ’Documentary and Biography’,
are sent to t.hulu.com which maps to the same single IP                                                  ’tp:adType’ => ’’,
address from all the locations in US. Using WHOIS[7] queries,                                            ’tp:fingerPrint’ => ’csel3_prod_iad115’,
                                                                                                         ’tp:CP_Promotional_Text’ => ’’,
we learn that the corresponding IP address, 208.91.157.68, is                                            ’tp:Segments’ => ’T:00:11:54;22,T:00:26:29;09,
allocated to Hulu. Examples of detailed performance informa-                                               T:00:38:49;27,T:00:57:37;18,T:01:03:15;02,
tion contained in the periodic reports includes: video bit-rate,                                           T:01:17:12;03’,
current video playback position, total amount of memory the                                              ’tp:adTypePlus’ => ’SponsoredFilm’,
                                                                                                         ’tp:Tunein_Information’ => ’’,
client is using, the current bandwidth at the client machine,                                            ’tp:distributionPartnerComScoreId’ => ’3000007’,
number of buffer under-runs, and number of dropped frames.                                               ’tp:secondarySiteChannelNielsenId’ => ’38’,
When the client adapts bit-rate due to changing network                                                  ’tp:cdnPrefs’ => ’level3,akamai,limelight’,
conditions, the periodic reports also include details on why the
bit-rate was changed. For instance, one of the messages reads                                            Fig. 7.   A section of Hulu manifest file
“Move up since avg dropped FPS 0 < 2 and bufferLength >
10”, with FPS indicating Frames Per Second. It appears that                                                 To better understand how Hulu selects different CDNs, we
Hulu has sufficient user performance information for dynamic                                             request the manifest file every second for the same video
CDN selection if they choose to do so.                                                                   from the same computer for 100 seconds. Figure 8 depicts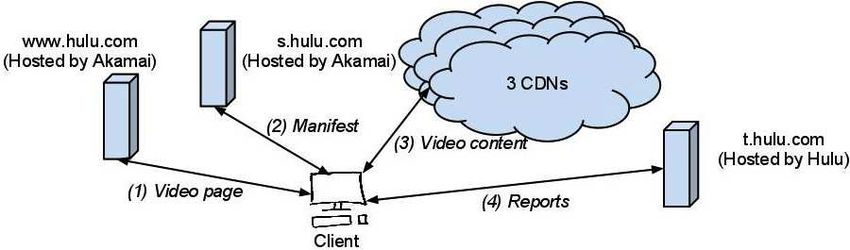
7

  Level3

Limelight

 Akamai

                     10          20          30          40          50           60           70                                       80                   90                100
                                                         Time of request (in seconds)

Fig. 8.     CDN preference change in a 100 seconds time interval

the preferred CDN along time, with ‘*’ indicating the selected                                                         0.12
                                                                                                                                                                               Akamai
CDN for each request. Since the network conditions on the                                                               0.1                                                    Level3
tested Hulu client is fairly stable during the experiment, the                                                                                                                 Limelight

above result indicates that Hulu CDN selection is not based                                                            0.08

                                                                                                Probability
on instantaneous network conditions.                                                                                   0.06
   To further understand the impact of various factors such
as client location, video and time on CDN selection, we use                                                            0.04

the get-flash-videos tool to collect manifest data for                                                                 0.02
61 different videos of different genres, length, popularity and
ratings available on Hulu from 13 different locations across                                                                0
                                                                                                                                0            20             40        60        80              100
the United States over multiple days (up to 24 days at one                                                                                            CDN preference percentage
of the locations). The client machines on these locations are
connected to residential broadband networks or business high                      Fig. 9.    Overall CDN preference distribution
speed Internet services. They also cover a number of different
ISPs including Comcast, AT&T, Verizon and CenturyLink.                                                                 50
   For a given video at a given location and time, we download
the manifest file 100 times, with 1 second interval between two                                                        40
                                                                                                Average preference %

consecutive downloads. We call such 100 consecutive down-
loads an experiment. Each downloaded manifest file assigns                                                             30
one CDN as preferred CDN. We count the number of times
each CDN is preferred for each experiment. We refer to the                                                             20
percentage of times that a CDN is preferred in an experiment as
                                                                                                                                                                               Akamai
preference percentage. This preference percentage essentially                                                          10
                                                                                                                                                                               Level3
reflects the likelihood for a CDN to be selected by Hulu.                                                                                                                      Limelight
   Overall CDN preference Figure 9 shows the distribution of                                                            0
                                                                                                                                    2             4          6         8          10       12
preference percentage for the three CDNs based on results for                                                                                            Client location IDs

all videos, locations, and time. The three curves representing
the three CDNs are very close to Gaussian distributions. The                      Fig. 10.    CDN preference from geographic regions
mean preference percentage for Limelight, Akamai and Level3
are 25, 28 and 47, respectively. Level3 is the preferred CDN
47% of times, much more than the other two CDNs.                                     CDN preference over time. Figure 12 shows CDN pref-
   CDN preference over different locations. Figure 10 shows                       erence change over different days at the same location. This
CDN preference observed from clients at different geographic                      result is based on 24 days of experiments at a single location.
locations. These 13 locations span different cities across eight                  Each data point represents the average preference percentage
US states. For this analysis, we combine data for all the                         over all videos on each day for a given CDN. The results for
videos collected at the same location and calculate the average                   other locations (not shown here) are similar. We observe that
preference percentage for each location. We observe that                          the CDN preferences do not change over time either.
different CDNs have different popularity but the popularity                          In summary, we conclude that Hulu selects the preferred
do not change over different locations.                                           CDN randomly following a fixed latent distribution for each
   CDN preference for different videos. Figure 11 shows                           of the playback requests. On average, one CDN (Level3) is
CDN preference for different videos. Here we aggregate the                        preferred more than others, but such selection preference does
experiments for each video across location and time and                           not seem to depend on instantaneous network conditions. It
calculate its average preference percentage. The small variation                  is also evident that CDN selection is not affected by client
in preference percentage across different videos indicate CDN                     location at which the video is played. And the selection
preference is independent of which video is being served.                         does not change over the 24 days that we measured. We
8

                                    50                                                                  high quality streaming?
                                                                                                  •     How do different CDNs compare in terms of perfor-
                                    40
                                                                                                        mance? Is any CDN clearly better or worse than others?
             Average preference %
                                                                                                   • How far is the current CDN selection strategy from “op-
                                    30
                                                                                                        timal”? Can the strategy be improved to support higher
                                    20
                                                                                                        delivery bandwidth while conforming to the business
                                                                                                        constraints?
                                    10                                             Akamai       In this section and the Section V, we attempt to address
                                                                                   Level3
                                                                                   Limelight
                                                                                                the above questions by conducting extensive measurement
                                     0                                                          experiments for the three CDNs used by Netflix from 95
                                            10       20       30       40         50       60
                                                           Video IDs                            vantage points across the United States1 .
                                                                                                   We measure the bandwidth throughput between each van-
Fig. 11.   CDN preference for different videos                                                  tage point and a given CDN server by downloading multiple
                                                                                                video chunks from the CDN server. Video file URLs are
                                    50                                                          collected for all three CDNs from Netflix manifest files. Here
                                                                                                we take advantage of the fact that the URLs in the manifest
                                    40
                                                                                                remain valid for several hours from the time the manifest file is
             Average preference %

                                                                                                generated, and the validity of the URLs are not tied to client IP
                                    30
                                                                                                address. Furthermore, the byte “range” of the download can be
                                                                                                adjusted without affecting the URL validity. Once we extract
                                    20
                                                                                                the URLs for the three CDNs, we “replay” the GET request
                                                                            Akamai              from all vantage points with byte range modified so that we
                                    10
                                                                            Level3              download video chunks of the same size.
                                                                            Limelight
                                     0
                                                                                                   Similar to the actual Netflix video playback, when GET
                                              5          10          15        20               requests are sent from a vantage point, the hostnames in
                                         24 days between August 17 to September 9, 2011
                                                                                                the URLs are resolved by DNS server, which returns the IP
Fig. 12.   CDN preference over time                                                             address of the edge server assigned by the CDN. To ensure
                                                                                                the measured bandwidth of three CDNs are comparable, we
                                                                                                send GET requests to three CDNs in round-robin order within
conjecture that such CDN preference is most likely based                                        a short duration. More specifically, measurement is repeated
on pricing and business arrangements and is not dependent                                       in multiple “rounds”, with each round lasting 96 seconds. A
upon instantaneous bandwidth or past performance history of                                     round is further partitioned into four “slots”, with 24 seconds
the CDNs. Note that the above CDN usage analysis is not                                         for each slot. The first three slots of each round correspond
doable for Netflix since Netflix ties the CDN preference to                                     to three CDNs, respectively, and we download video chunks
the individual user account. It is impractical to create a large                                of size 1.8MByte. The last slot of each round is for a “joint”
number of Netflix accounts to infer its CDN usage strategy.                                     measurement for all CDNs, i.e., we send GET requests to the
                                                                                                three CDNs simultaneously, each requesting video chunks for
         IV. CDN P ERFORMANCE M EASUREMENT                                                      0.6MByte data. We intend to find out how much total band-
   In the previous sections, we have shown that Netflix ties                                    width one can get if all three CDNs are used simultaneously.
the CDN preference to user accounts, while Hulu choose the                                      We pick the size of the chunks and length of “slots” based
preferred CDN for each video based on a latent distribution.                                    upon multiple trial measurements. In our trials, we find that
In both cases, factors such as user geographic locations,                                       these numbers make sure that different experiments do not
network conditions, requested video contents do not trigger the                                 interfere with each other and chunk size is sufficiently large
CDN preference change. These observations suggest that the                                      so that we can have a good estimate of the bandwidth. We also
CDN preference and selection strategies employed by Netflix                                     send keep-alive messages to each server every second when no
and Hulu are plausibly due to business considerations such                                      data is transferred to make sure that the TCP session is alive
as business relations (e.g., pricing agreements) between the                                    and sender window size does not drop.
content providers and CDNs: while Netflix and Hulu employ                                          The measurement is conducted for two hours between 8 to
different CDN selection strategies (one ties the preferred CDN                                  10pm CST, from June 8, 2011 to June 26, 2011. Based on
to each user account and the other ties to each video), both                                    downloading time, we calculate the instantaneous bandwidth
attempt to distribute and balance the video serving traffic                                     (i.e., throughput for each GET request), the one-day average
among the CDN in accordance with certain latent distribution.                                   bandwidth (average bandwidth during the two hour period),
This raises a key design trade-off in CDN selection decision                                    and average bandwidth (over entire measurement study). These
making: business constraints vs. end user QoE, and leads to                                        1 As Hulu shares the same set of CDN providers with Netflix, and since
the following questions:
                                                                                                the RTMPE protocol used by Hulu is more difficult to work with than the
   • How does each CDN perform? Can the selected CDN                                            DASH protocol used by Netflix, here we choose Netflix to conduct the CDN
       server consistently support the bandwidth needed for                                     experiments.
9
metrics allow us to examine CDN performance at multiple In particular, CDN B outperforms all others considerably. We
timescales. We conducted experiments from both residential find that these three homes use the same ISP. It is conceivable
sites and PlanetLab nodes. There are 12 residential sites, 10 that CDN B has a better presence in this provider’s network.
in New Jersey, 1 in Minnesota, and 1 in California. The
residential sites use 5 different service providers. To cover B. Daily bandwidth variations
a wider range of geographic locations, we also choose 83
PlanetLab nodes spread across the United States as additional Next we examine the bandwidth variation at different sites
vantage points. We ensure that all selected PlanetLab nodes from the three CDNs over various timescales. We compute the
are lightly loaded so that the nodes themselves do not become coefficient of variance (CoV) of the daily average bandwidth
the bottleneck and the measurement results reflect the actual at all PlanetLab nodes by computing the ratio of the standard
bandwidth that can be supported by the CDN server and the deviation to the mean at each of the locations. Fig. 17
network. shows the CoV for the one-day average bandwidth at various
The rest of this section attempts to address the first two PlanetLab nodes over multiple days. We indeed see high CoV
questions on CDN performance. We will further investigate at most nodes. The average CoV is 0.33, 0.30, and 0.30 for
the other two questions on performance improvement in the CDN A, B and C, respectively. At most locations, there are
Section V. We use CDN A, B, and C to denote the three significant variations in daily bandwidth for all three CDNs.
CDNs without particular order in the rest of the discussion. We show a few representative locations in Figures 18, 19
and 20, which plot the one-day average bandwidth over the
measurement period at one PlanetLab node and two residential
A. Overall CDN performance sites, respectively. The results show significant variations of
Fig. 13 shows the locations of all vantage points in our average bandwidth on a daily basis.
experiments as well as the CDN with highest average band- Figures 18, 19 and 20 show that the performance ranking
width at each vantage point during the measurement period. of the three CDNs also varies over time. Although the lowest
As the result indicates, no CDN clearly outperforms the others. CDN bandwidth across all three nodes is still above 3Mbps
In addition, Fig. 14 shows the CDF (Cumulative Distribution – sufficient to support standard definition (SD) levels, signif-
Function) of average bandwidth at the PlanetLab nodes over icant variations in bandwidth and varying rankings of CDNs
the entire measurement period. The available bandwidth at over time suggest that further improvement in CDN selection
different PlanetLab nodes varies significantly from location to strategies is possible.
location, ranging from 3Mbps to more than 200Mbps. The
CDF curves of three CDNs, however, are close to each other,
indicating similar overall performance. Figures 15 and 16 C. Variations in instantaneous bandwidth
further show the average bandwidth at individual locations We further investigate the instantaneous bandwidth variation
for PlanetLab nodes and residential sites, respectively. The during two hours of video playing. This is important since a
location index is sorted in the ascending order of CDN A’s DASH player constantly monitors the available bandwidth to
average bandwidth. CDN bandwidth measured at PlanetLab decide which quality level of video to download. The small
nodes appear to have much higher than that of residential sites time scale bandwidth may significantly impact the Netflix
in general. This is because most PlanetLab nodes are located in users’ viewing experience as two hours is a typical length of
universities, which typically have better access links. This also movie. Figures 21, 22 and 23 show the comparison of three
implies that in most cases, the last mile is still the bottleneck CDNs for the same PlanetLab node and residential nodes.
for streaming video. However, even the residential sites with Although the variance is still significant, there is a “pattern”
relatively low bandwidth, e.g. home 1 and 2 in Fig. 16, can in the bandwidth change. For example, bandwidth for CDN B
support 1.3Mbps on average, enough for standard definition in Fig. 21 alternates between two levels, one around 35 Mbps
(SD) videos. and one around 20 Mbps. The average coefficient of variation
for two hour period is 0.19, 0.21 and 0.18 respectively for
CDNs A, B and C respectively for residential sites.
V. A LTERNATE V IDEO D ELIVERY S TRATEGIES
We have shown that Netflix and Hulu always prefer to use
one CDN for video delivery, with other two CDNs serving as
backups: they are used only if current CDN cannot support
even the lowest video quality. We have also shown that the
available bandwidth on all three CDNs vary significantly over
time and over geographic locations. For instance, as shown
in Fig. 13, out of 83 PlanetLab locations, CDNs A, B, and
Fig. 13. Best CDN at each vantage point C perform best at 30, 28 and 25 locations, respectively. The
measurement study of residential hosts shows similar results.
It is also interesting to note that home sites 4, 9, and 11 see Hence if users are given a bad CDN choice, their video viewing
significantly different average bandwidth from different CDNs. quality may suffer even though other CDNs can provide them10
100 20
CDN A CDN A CDN A
160
CDN B CDN B
Average bandwidth in Mbps
CDN B
Average bandwidth in Mbps
80 CDN C 140 CDN C CDN C
15
120
60
100
CDF
10
80
40
60
5
20 40
20
0 0
0 35.8 71.6 107.4 143.2 179 20 40 60 80 1 2 3 4 5 6 7 8 9 10 11 12
Average bandwidth in Mbps PlanetLab node IDs Residential host IDs
Fig. 14. CDF of average bandwidth at Planet- Fig. 15. Average bandwidth at PlanetLab nodes Fig. 16. Average bandwidth at residential
Lab nodes over the entire period networks over the entire period
2 45 10
CDN A CDN A
CDN B 40 CDN B 9
Average bandwidth in Mbps
Average bandwidth in Mbps
CDN C CDN C
Coefficient of variance
1.5 35
8
30
7
1 25
6
20
5
0.5 15
CDN A
10 4 CDN B
CDN C
5 3
20 40 60 80 0 5 10 15 20 0 5 10 15
PlanetLab node IDs Time (in days) Time (in days)
Fig. 17. Coefficient of variance for the one-day Fig. 18. One-day average bandwidth at a Fig. 19. One-day average bandwidth over time
average at PlanetLab nodes PlanetLab node over time at residential site 7
20 40 25
CDN A CDN A
35 CDN B CDN B
Average bandwidth in Mbps
Average bandwidth in Mbps
Average bandwidth in Mbps
CDN C 20 CDN C
15 30
25 15
10 20
15 10
5 10
CDN A 5
CDN B 5
CDN C
0 0 0
0 5 10 15 0 0.5 1 1.5 2 0 0.5 1 1.5 2
Time (in days) Time (in hours) Time (in hours)
Fig. 20. One-day average bandwidth over time Fig. 21. Instantaneous bandwidth at a PlanetLab Fig. 22. Instantaneous bandwidth at residential
at residential site 9 node site 7
with more satisfying experience. In addition to improving the simplicity of such strategies.
experience for “unlucky” users, exploring potential ways of
increasing video delivery bandwidth may also open doors for
new bandwidth-demanding services in the future, e.g., 3D A. Room for improvement
movies or multiple concurrent movies in the same household.
Given the instantaneous bandwidth trace, the optimal CDN
In this section, we first determine how much room available
selection strategy is to choose the top CDN at each point of
for further improvement. In other words, if we could have the
time. Although this cannot be done in practice as we do not
optimal CDN selection strategy in theory, how much better
know the instantaneous bandwidth beforehand, this theoretical
it would be compared to current static assignment. We then
optimal strategy allows us to find out the highest bandwidth
explore two alternative CDN selection strategies that can easily
each client can receive if the best CDN is used at any given
be deployed in practice, and demonstrate that we can indeed
time. We refer to the average bandwidth achieved by the
significantly increase the bandwidth for video delivery despite
optimal strategy as the upper bound average bandwidth.11
10
CDN A Best CDN Best CDN
9 18 200
CDN B Average CDN Average CDN
Average bandwidth in Mbps
Average bandwidth in Mbps
Average bandwidth in Mbps
CDN C 16 Upper bound Upper bound
8
14 150
7
12
6
10
100
5 8
4 6
50
3 4
2
2
0 0.5 1 1.5 2 2 4 6 8 10 12 20 40 60 80
Time (in hours) Residential site IDs PlanetLab node IDs
Fig. 23. Instantaneous bandwidth at residential Fig. 24. Average bandwidth and the upper Fig. 25. Average bandwidth and the upper
site 9 bound at residential sites bound at PlanetLab nodes
100 400
30 Best CDN Best CDN
Average bandwidth in Mbps 3 CDNs combined 350 3 CDNs combined
Average bandwidth in Mbps
95
Percentage of the best CDN
25 300
90
85 20 250
80 200
15
75 150
PlanetLab with measurement 10
70 100
PlanetLab average
65 Residential with measurement 5 50
Residential average
60 2 4 6 8 10 12 20 40 60 80
0 2 4 6 8 10
Residential host IDs PlanetLab node IDs
Number of measurements in the beginning
Fig. 26. Effect of number of measurements Fig. 27. Best CDN vs three combined CDNs Fig. 28. Best CDN vs three combined CDNs
for residential hosts for PlanetLab nodes
Fig. 24 and Fig. 25 show the average bandwidth of three of the CDN average bandwidth over top CDN bandwidth for
CDNs and the upper bound average bandwidth for residential all PlanetLab and residential nodes, respectively. In both cases
sites and PlanetLab nodes respectively. Here we use the we calculate the average CDN bandwidth over all locations,
average bandwidth over all three CDNs to reflect the static time, and CDN providers, so they reflect the expected CDN
assignment strategy. The actual assignment may of course be performance, assuming the three CDNs are equally likely to
better or worse depending on which CDN gets selected, but be chosen in the static CDN assignment strategy. The other
this gives the expected value. We also show the bandwidth if two curves are ratio of average bandwidth using measurement
one top CDN, i.e., the one with highest average bandwidth based CDN selection strategy over that of using top CDN
is selected. For the majority of the sites, the upper bound is for both PlanetLab nodes and residential sites. Using a small
much better than the average CDN case, and close to the top number of measurements (≥ 2), the measurement based
CDN case. In particular, the upper bound is 17% and 33% strategy delivers more than 12% improvement over the static
better than the average case for residential sites and PlanetLab CDN assignment strategy. Although the average improvement
nodes respectively, indicating there is significant room for is moderate, for certain users the improvement is significant,
improvement. Assigning users to top CDN is only 6% to 7% e.g., more than 100% for residential host 4. Given this method
worse than the theoretical optimal case. This indicates that if is very straightforward and easy to implement, we believe this
we can estimate which CDN is likely to perform best in next is a favorable approach for improving video delivery.
couple hours, we can achieve average bandwidth that is fairly
close to the upper bound average bandwidth.
C. Using multiple CDNs simultaneously
B. Measurement based CDN selection In previous sections, we have assumed that only one CDN
Since selecting the top CDN for users gives good perfor- can be used at a time. However, since Silverlight player
mance, we next study how to identify the top CDN effectively. downloads video and audio content in chunks, it is possible to
We propose to have the player conduct the instantaneous use all three CDNs simultaneously. For instance, the player
bandwidth measurement multiple times at the beginning, and can download three different chunks in parallel from three
assign users the best-performing CDN for the rest of the different CDNs to obtain larger bandwidth. Since the design
movie. Fig. 26 shows the effect of number of measurements of a HTTP adaptive streaming protocol that can best utilize
on performance. As reference, two straight lines show the ratio multiple CDNs is out of the scope of this paper, we try to see12
if multiple CDNs can be used, whether they can offer higher subject to X
aggregated throughput for end users. si,j · pi = fj , ∀j (2)
Fig. 27 and Fig. 28 compare the average bandwidth using i
top CDN and the average bandwidth obtained by combining X
three CDNs for residential and PlanetLab nodes, respectively. pi = 1, (3)
We see that combining all three CDNs can significantly i
improve the average bandwidth. Specifically, the aggregate pi ≥ 0, ∀i (4)
bandwidth obtained by combining all 3 CDNs is greater than
the bandwidth of the single best CDN by 54% to 70% for where w ≫ 1 is the weight to favor profile 0. Constraint (2)
residential sites and PlanetLab nodes, respectively. ensures that the targeted traffic split is satisfied. Constraint
(3) ensures {pi } is a valid probability distribution. The values
of {si,j } can be measured using the following approach. At
the beginning of the service, the content provider randomly
D. Considering business constraints assigns N requests with profile i, ∀i, with N being a large
In the above client-side initiated CDN selection strategies, number, e.g., 1000 requests. It then collects Ni,j , the number
the business constraints are not considered. We intend to of requests that select CDN j given profile i. The estimation
show how much performance improvement can be achieved si,j = Ni,j /N can be improved further over time. Also, a
by allowing the end-users to freely choose the best CDN or request’s video size does not explicitly appear in the model.
use multiple CDNs simultaneously. In practice, the content Since each profile will be assigned to a large number of
providers may well have business arrangement with CDN requests/sessions, the average session size approaches its mean
service providers, in terms of pricing, the amount of traffic thanks to Law of Large Numbers.
need to be carried over a specific CDN, etc. How to integrate Next we use a numerical example to illustrate the benefits
the business constraints with the client-side initiated CDN of the proposed scheme. Suppose the target traffic split is
selection strategy to form a practical and high-performance [0.5 0.25 0.25]. The [si,j ] vectors for profiles 0 to 6 are
video delivery framework is an interesting research challenge. [0.3 0.3 0.4], [0.5 0.5 0], [0.45 0 0.55], [0 0.45 0.55], [1 0 0],
Below we consider one type of the business constraints, where [0 1 0], and [0 0 1], respectively. The value of w is set to be 10.
the overall traffic is shared by three CDNs based on a fixed Solving the linear program using CPLEX, the optimal solution
split-ratio - the same business constraint as used by Hulu is p∗0 = 0.625, p∗1 = 0.125, p∗4 = 0.25, and the rest are zeros. In
(see Section III-C). We explore a probabilistic CDN profile other words, 62.5% of the users are able to select the best CDN
assignment strategy that conforms with the aforementioned from three CDNs, 12.5% of the users are able to select a better
business constraint yet provides end-users better QoE by CDN between CDN0 and CDN1 , and only 25% of the users use
allowing them to choose the best CDN from a list of candidate the assigned CDN0 . The above example clearly demonstrate
CDNs provided by the content provider. the possibility of integrating the business constraints into the
CDN selection strategy. Note that the profiles are only used
Define a CDN profile to be a list of candidate CDNs from
for limiting user’s choice during performance optimization; the
which the end-user can choose the best one to retrieve the
CDNs that are not in the profile can still be used as backup.
video. Denote by Pi the i-th profile. For three CDNs, there are
For example, users that are assigned P4 can still switch to
seven valid CDN profiles, P0 = [C0 , C1 , C2 ], P1 = [C0 , C1 ],
CDN C1 or C2 when C0 is not feasible.
P2 = [C0 , C2 ], P3 = [C1 , C2 ], P4 = [C0 ], P5 = [C1 ], and
P6 = [C2 ], where Cj denotes the j-th CDN, j = 1, 2, 3. Note
VI. R ELATED W ORK
that P0 offers end-users all three CDNs and hence is the most
preferred; P1 , P2 , and P3 offer two candidate CDNs which Several recent studies have been conducted in analyzing
allow users to avoid the worst performing CDN. For profiles different aspects of Netflix video streaming. Akhshabi et
P4 , P5 , and P6 , the end-users have no choice but to use the al. [14] have studied several video streaming players including
assigned CDN, which is the current strategy used by Hulu. Netflix player and investigated how the streaming clients
Upon the arrival of a request, the content provider assign the react to bandwidth changes. The measurement is done mostly
i-th profile to this request with the probability pi . The goal is from one fixed location. Recently, Huang et al. conducted
to find the optimal {p∗i } so that the usage of profiles P0 , P1 , the measurement study to examine the dynamic rate selection
P2 , and P3 is maximized while conforming with the business algorithm of Netflix, Hulu, and Vudu, and proposed technique
constraints. Denote by fj the targeted traffic fraction for CDN to improve users’ perceived video quality [15]. Unlike the
j, and by si,j the probability that an end-user selects previous work, we investigate a broader set of components
P CDN j as in Netflix video delivery system, and focus on how the player
the best performing CDN given the profile i. j si,j = 1, ∀i,
with si,j = 0 if CDN j is not included in the candidate list interacts with different CDNs. To achieve this, we conduct
of profile i. The optimziation problem is formulated as the more extensive measurement from multiple geo locations.
following linear program: Recent work has also been done for other streaming plat-
forms [16], [17]. Krishnappa et al. have studied Hulu streaming
X
3 with emphasis on improving performance using prefetching
max (w · p0 + pi ), (1) and caching [16]. Adhikari et al. build a measurement infras-
{pi } tructure by using PlanetLab nodes with the goal to understand
i=1You can also read